analyzing focus group data · analyzing focus group data t. he analysis and interpretation of focus...
TRANSCRIPT
115
7Analyzing Focus Group Data
The analysis and interpretation of focus group data require a great deal of judgment and care, just as any other scientific approach, and regardless of
whether the analysis relies on quantitative or qualitative procedures. A great deal of the skepticism about the value of focus groups probably arises from the perception that focus group data are subjective and difficult to interpret. However, the analysis and interpretation of focus group data can be as rigorous as that generated by any other method. It can even be quantified and submitted to sophisticated mathematical analyses, though the purposes of focus group interviews seldom require this type of analysis. Indeed, there is no one best or correct approach to the analysis of focus group data. As with other types of data, the nature of the analyses of focus group interview data should be determined by the research question and the purpose for which the data are collected.
The most common purposes of a focus group interview are to provide an in-depth exploration of a topic about which little is known and the identi-fication of specific issues, opportunities, and problems. For such exploratory research, a simple descriptive narrative is quite appropriate and often all that is necessary. More detailed analyses are simply neither an efficient nor productive use of time, unless they serve a particular research objective. However, there are additional methods of analysis that may be appropriate for certain purposes. In this chapter, we consider the methods of data analysis that are most frequently used with focus group data. A place to begin this discussion is consideration of the question of how much analysis is appropriate and necessary given the research question.
©SAGE Publications

116—FOCUS GROUPS: THEORY AND PRACTICE
How Much Analysis?
Like most types of research, the amount of analysis required varies with the purpose of the research, the complexity of the research design, and the extent to which conclusions can be reached easily based on simple analyses. The most common analyses of focus group results involve a transcript of the discussion and a summary of the conclusions that can be drawn. There are occasions, however, when a transcript is unnecessary. When decisions must be made quickly (which is common in many exploratory studies that will be followed by further research) and the conclusions of the research are rather straightforward, a brief summary may be all that is necessary. In some cases, there may be time or budget constraints that prevent more detailed analysis. In other cases, all interested parties and decision makers may be able to observe or participate in the group, so there may be little need for a detailed analysis or report. Nevertheless, some type of report is almost always helpful, if only to document what was done for historical and auditing purposes.
When the results of a focus group are so obvious as to require little supporting documentation, detailed analysis is probably not worthwhile. One of the authors (D.W.S.) was involved in a series of focus groups on a new government program that was so clearly unacceptable and elicited so many objections that further analysis of any kind seemed unwarranted. In this case, the decision about the program was made quite clear by the focus group discussions. This is, in fact, a good example of how useful focus groups can be as evaluative tools. It is often the case that government planners, product design engineers, and other professionals who design products and services believe that they understand what their clients or customers need or should want. Focus groups provide a tool for testing the reality of assumptions that go into the design of services, programs, and products. On the other hand, if the researchers in this example were inter-ested in more than making a simple go/no go decision about a product or program and instead wished to explore in detail the reasons the program was unacceptable and the types of programs that might be acceptable, more detailed analyses would be needed. Thus, the amount of analysis and the level of detail and rigor ultimately depend on the purpose for which the research is carried out and the cost–benefit of carrying out an analysis at a given level.
Apart from the few occasions when only a short summary of focus group discussions is required, all analytic techniques for focus group data require transcription of the interview as a first step. Thus, we consider the issues surrounding the transcription process and then turn our attention to some of the more common tools for analysis of focus group data.
©SAGE Publications

Analyzing Focus Group Data—117
Transcribing the Interview
The first step in many approaches to the analysis of focus group data is to have the entire interview transcribed based on an audio or video recording. Transcription services are readily available in most locations and are accessible online. These services are generally able to provide relatively rapid turnaround of a transcript at modest cost. Transcription not only facilitates further analy-sis, but it also establishes a permanent written record of the group discussion that can be shared with other interested parties. On the other hand, in research situations that are time pressured or involve fairly mundane issues (e.g., adver-tising copy testing and informing the design of a survey), a transcript may not be necessary. In these cases, the researchers rely on detailed notes taken by the focus group observers, or they may also replay the audio- or videotape of the group as needed.
The amount of editing that the analyst does on a transcribed interview is a matter of preference. Transcriptions are not always complete, and the modera-tor may want to fill in gaps and missing words, as well as correct spelling and typographical errors. There is a danger in this, of course, because the modera-tor’s memory may be fallible or knowledge of what was said later in the course of the interview may color the memory of what happened earlier. On the other hand, the moderator or an observer may be able to add further information based on observations of the participants and interactions that add additional information that is not obvious in a written transcript.
Transcription also will faithfully pick up incomplete sentences, half- finished thoughts, parts of words, odd phrases, and other characteristics of the spoken word in a group discussion. These characteristics are true to the flow of the discussion, but they may make it difficult for a reader to follow the text. Some editing may increase readability, but it is important that the character of the respondents’ comments be maintained, even if at times they use poor grammar or appear to be confused (in fact, identification of confusion about concepts can be an important outcome of a focus group). Because one use of focus group interviewing is to learn how respondents’ think and talk about a particular issue, too much editing and cleaning of the transcript is undesirable and counterproductive.
Once the transcript is finished, it can serve as the basis for further analysis. It should be noted, however, that the transcript does not reflect the entire char-acter of the discussion. Nonverbal communication, gestures, and behavioral responses are not reflected in a transcript. In addition, the way members of the group use words and the tone with which words are used are important sources of information and can radically alter the interpretation of a statement. The statement, “That is bad,” can have several very different meanings. The word bad is sometimes used as a way to say that something is actually very good.
©SAGE Publications

118—FOCUS GROUPS: THEORY AND PRACTICE
Such a statement could also mean something is really bad in the traditional meaning of this word.
For these reasons, the interviewer or observer may wish to supplement the transcript with some additional observational data that were obtained during the interview. Such data may include notes that the interviewer or observers made during the interview, the systematic recording of specific events and behaviors by trained observers, or the content analysis of videotapes of the dis-cussion. Such observational data may be quite useful, but it will only be avail-able if its collection was planned in advance. Preplanning of the analyses of the data to be obtained from focus groups is as important as it is for any other type of research. Once the focus group discussions have been transcribed, analysis can begin. Today researchers have a variety of choices in analyzing focus group data, and these generally fall into two basic categories: qualitative or quantita-tive. Because focus groups are a variety of qualitative research, the following discussion examines qualitative analytic approaches.
Qualitative Analytic Approaches
Technological advances in statistics have enabled extensive and elaborate anal-yses of huge databases derived from surveys, retail transactions, census data, and numerous other sources. As later sections in this chapter explain, quanti-tative analyses can also be applied effectively to qualitative data obtained from individual depth interviews, focus groups, and ethnographies. On the other hand, studies that rely on qualitative research methods often employ quali-tative approaches to extracting meaning from the data. Unfortunately, unlike most statistical paradigms, there is much less consensus on how to analyze and interpret qualitative data. To a considerable degree, this is the result of differences in the epistemological orientations and phenomenological foci that characterize the behavioral science disciplines.
EPISTEMOLOGICAL ORIENTATION
Whether explicit or simply subsumed, disciplines adopt basic premises about the sources and nature of knowledge. Smith, Flowers, and Larkin (2009) provide a discussion of underlying philosophical foundations of knowledge and the implications of these foundations for research. Three distinctive per-spectives are particularly relevant to qualitative analyses of focus group data (Sayre, 2001). First, social constructivism broadly posits that much of reality and the meaning and categories that frame everyday life are essentially social creations. This orientation traces its origins to thinking from social psychology, sociology, and cultural anthropology. Focus group analyses that reflect this view
©SAGE Publications

Analyzing Focus Group Data—119
tend to emphasize how group members collaborate on some issue, how they achieve consensus (or fail to), and how they construct shared meanings about commercial products, communications, or social concerns.
The phenomenological approach to analysis is almost the opposite. Drawing generally from clinical psychology and more specifically from phenomenological psychology, the analytic emphasis is on the subjective, idiosyncratic perceptions and motivations of the individual respondent. This perspective is particularly useful in marketing focus groups in which manag-ers are extremely interested, for example, in the detailed and in-depth reasons why one person loves the new flavor of Fritos and another group member finds it disgusting. Because both individuals represent important segments, thoroughly mining their thoughts and feelings is critical. Finally, advocates of interpretivism accept the prior perspectives but are skeptical about taking focus group respondents’ words at face value. Researchers from this school owe much to ethnographic studies that focus on both individuals’ words and actions, particularly to the science of body language and facial expressions.
DISCIPLINARY FOCUS
As discussed in Chapter 1, the ways in which the earliest focus groups were designed, fielded, and analyzed were strongly influenced by their parent disciplines, particularly social and clinical psychology and marketing research. These influences remain strong today, although much cross-disciplinary evo-lution has blurred some of the original differences. Newer intellectual currents have also affected how researchers analyze focus group data. The field of hermeneutics migrated from Europe to the American consumer research com-munity in the 1980s. It values consumer stories, or narratives, as a powerful tool for understanding consumer motivation, meaning, and decision making. Verbal expressions are conceptualized as “text” and are interpreted through an iterative process of reading, analyzing, and rereading the text. For reviews of the hermeneutic approach, see Thompson (1997). The field of semiotics also focuses on textual data but interprets such data more broadly as including not only verbal expressions but also pictures, sounds, products, and advertise-ments (Sayre, 2001, p. 210).
Semiotic analyses commonly deconstruct textual data to uncover unin-tended or hidden messages, which has proved particularly useful in the fields of advertising, communications, and political science research (Chandler, 2007). More broadly, semiotic analyses of qualitative data have helped iden-tify the signs and symbols that are embedded in textual data. Finally, some approaches to analyzing focus group data are, in comparison with hermeneu-tics and semiotics, relatively atheoretical (Krippendorf, 2013; Schreier, 2012). This is particularly true of marketing studies that seek to discover the major
©SAGE Publications

120—FOCUS GROUPS: THEORY AND PRACTICE
ideas and themes that emerge from the group discussion. This approach also serves marketers’ frequent need to quantify, statistically analyze, and generalize the findings from small-sample qualitative studies.
WORKBENCH ISSUES
Regardless of the disciplinary orientation of the focus group researcher, there are common everyday issues that arise during many groups and require analytic attention. Unlike statistical studies, focus group analysis actually begins once the group has begun. This is largely due to the discretionary opportunities for which the moderator has to terminate a topic, expand the discussion on one that the group finds involving, or introduce an entirely new line of questioning. Still, the main analytic work occurs after the focus group discussion ends. Above and beyond the hard data provided by the transcript, qualitative analyses of focus groups involve other often equally important considerations.
THE ORDER OF TOPICS IN A GROUP DISCUSSION
The order in which discussants raise topics can provide interesting and useful insights into what group members perceive to be the most important issues. Focus group discussions commonly begin with open-ended “grand tour” questions that seek to obtain participants’ overall views about a topic. The moderator might begin with questions like, “Tell me about your overall grocery shopping experiences these days,” or “How do you feel about your health insurance plan?” It is often ana-lytically interesting to observe which aspects are expressed first in the discussion and which are therefore top-of-mind. Some judgment is required to determine whether the issues that are raised first really represent the participants’ major thoughts and concerns or are merely mundane and socially safe topics. For exam-ple, in responding to the question about grocery shopping, someone might com-plain about the high prices when this is actually not a major issue, but it represents a common perspective and an easy way of joining the discussion. A helpful rule of thumb for determining whether a topic that is raised early is important is the extent to which it precipitates general discussion among the members of the group. Another clue that a topic is important is observing that the topic is one to which the group spontaneously returns throughout the discussion. On the other hand, a topic raised early by one respondent that sparks little or no discussion by the other group members or that never recurs is unlikely to be genuinely important.
WHAT IS DISCUSSED AND WHAT IS NOT?
Most analyses of focus group data seek to find meaning in the nature of participants’ verbal or written responses to the questions in the discussion
©SAGE Publications

Analyzing Focus Group Data—121
guide. This is logical and necessary, but exclusive emphasis on what is said or written may provide only a partial picture of the situation. Things that go unsaid or are not raised in the discussion may also be important. Some issues that participants don’t address may simply represent things that are taken for granted (e.g., clean restrooms in restaurants and the presence of faculty members on a university campus). Others may represent socially sensitive topics that individuals would rather avoid (e.g., retirement savings activities and strategies; various bodily functions). Finally, other issues may not materi-alize in the discussion because they are simply not important. Interpreting the significance of things that go unsaid requires considerable skills on the part of both the moderator and the analyst(s). A topic that remains unspoken that is known to be, or at least suspected of being important is something the group moderator should raise at some point in the discussion. It would also be useful for the moderator to offer the observation that the topic has come up in other groups but not in this one as a way of probing the reasons why the topic had not been raised.
TIME SPENT ON AN ISSUE
In preparing a focus group discussion guide, researchers typically allocate blocks of time to the topics that will be covered. This requires anticipating how much discussion a particular topic or question is likely to elicit. It is not sur-prising that things don’t always go as planned. Some questions that were antic-ipated to elicit extensive discussion fall flat and yield pithy sound bites from indifferent respondents. Conversely, seemingly minor or transitional questions sometimes stimulate vigorous wide-ranging discussion and much interaction among the participants in the group. While this may sometimes frustrate the moderator, it is important because it provides clues to how much the partici-pants care about a particular issue. It may be misleading to focus only on the responses to different questions without also considering the amount of time the participants chose to spend on each one. Two ideas may seem equally important at first blush but one may be raised and quickly dropped by the group, while another may take on life and become the focus of several minutes of discussion. The latter idea is most likely far more important than the first.
It is also the case that disagreement about a topic or issue can result in greater time for discussion as each member of the group airs his or her views for agreeing or disagreeing with others. Disagreements can occur with respect to even trivial topics. A good moderator will determine when time spent on disagreements over trivial topics is not productive and move the discussion to another topic. On the other hand, disagreement regarding important topics is well worth the time required to fully develop the conflicting points of view.
©SAGE Publications
122—FOCUS GROUPS: THEORY AND PRACTICE
INTENSITY AND EMOTIONAL CONTENT OF THE DISCUSSION EXPRESSION
Often related to the issue of time are the moods and emotions that arise as various topics are covered. A focus group can be like an emotional roller coaster that veers from the dull formality of a committee meeting to moments of group hilarity to mildly hostile silence. Such situations challenge the mod-erator to get things going or calm them down. They also challenge the analyst to interpret the nature and sources of participants’ emotional reactions and expressions. The field of marketing today places a strong emphasis on the the-ory and practice of customer relationship management. The role of consumers’ emotional connections to products and brands is increasingly seen as a key link in the relationship. This orientation has contributed to the growing use of emotional elicitation techniques in focus groups, such as projective methods.
REASONS VERSUS RESPONSES
Focus group analysts are naturally interested in observing how partici-pants respond to the various questions and stimuli that are presented to the group. Sometimes when discussion guides are crammed with too many ques-tions, the moderator is pressed just to get through them all and has little time for probing the participants about the reasons for their responses. In other situations, which are quite common in marketing studies, the researchers have a strong interest in separating winning from losing product or advertising concepts. Such groups tend to involve a lot of voting and ranking from the participants, and they often pay insufficient attention to the various and often subtle reasons for their evaluations. Overemphasis on individuals’ reactions is at odds with the basic premise of focus group research that, ideally, mines rather than surveys participants’ ideas and orientations.
WHAT IS BELIEVABLE?
One central theme in criticism of focus group research is that participants say one thing and do another. This problem is not unique to focus groups and also arises in survey research. Focus group moderators and analysts need to be sensitive to situations in which participants’ expressions may reflect social desirability influences, pressures to conform to groupthink, or the persuasive effects of a dominant group member. The analyst also needs to be aware of and seek to resolve individual responses that are inconsistent. For example, in a focus group comprising mothers of young children, one person explained, “I check the nutrition labels very carefully on the food I buy for my kids,” yet later in the group, the same woman said, “Sometimes, if the kids like it, I just
©SAGE Publications
Analyzing Focus Group Data—123
throw it in the cart. I always seem to be in a hurry.” Focus group researchers often need to exercise caution in accepting participants’ words at face value.
Participants do occasionally contradict themselves. This is not usually because they are being dishonest. Rather, the discussion occurring later in a group may elicit a memory that was not recalled earlier in the discussion. Careful analysis of “contradictions” often reveals that there was no contra-diction at all. Rather, answers differ because the question is different or the context has changed. Something may occur in some situations and not others. Events in the past are different from events in the present or future. A partici-pant’s answers about his or her own opinion or behavior may be different from what the participant perceives to be the opinions or behaviors of others.
INDIVIDUALS VERSUS THE GROUP
Analysis of focus group data often seeks to generalize findings in terms of the group using terms such as most, very few, and the majority. In groups that are extremely homogeneous (e.g., upper-middle-class widows between 75 and 85 years old who still live independently), this may make sense. On the other hand, it represents a subtle intrusion of inappropriate quantitative analysis. In most studies, focus group research involves small samples that are imperfectly represen-tative of a larger population. This makes group-level generalizations questionable on both statistical and sampling grounds. An alternative approach is to view each individual in the group as representing a particular demographic, lifestyle, or atti-tudinal segment, which encourages a within-person rather than group analysis.
Methods of Analysis
There are many approaches to the analysis of focus group data. These approaches range in complexity and depth. The appropriate analysis is the one that answers the research question. If the research question is simple, such as “Identify all the reasons consumers give for failing to eat a healthy diet,” the analysis may be no more complex than a list of the reasons. On the other hand, for research questions that require exploration of motives, emotions, and contexts across multiple occasions and types of consumers, the analysis may require extensive narratives and typologies. Several of the more common approaches to the analysis of focus group data are described below.
THE SCISSOR-AND-SORT TECHNIQUE
The scissor-and-sort technique, which is sometimes called the cut-and-paste method, is a quick and cost-effective method for analyzing a transcript
©SAGE Publications

124—FOCUS GROUPS: THEORY AND PRACTICE
of a focus group discussion. The first step in applying the technique is to go through the transcript and identify those sections of it that are relevant to the research question(s). Based on this initial reading, a classification system for major topics and issues is developed, and material in the transcript related to each topic is identified. Color-coded brackets or symbols may be used to mark different topics within the text with colors. The amount of material coded for any one topic depends on the importance of that topic to the overall research question and the amount of variation in the discussion. The coded material may be phrases, sentences, or long exchanges between individual respondents. The only requirement is that the material be relevant to the particular category with which it has been identified. This coding exercise may require several passes through the transcript as categories of topics evolve and the analyst gains greater insight into the content of the group discussion.
Once the coding process is complete, the coded copy of the transcribed inter-view may be cut apart (the scissors part of the technique). Each piece of coded material can be cut out and sorted so that all material relevant to a particular topic is placed together. This cutting and sorting process may also be readily carried out on any computer with a word processing program. Whether scissors or a personal computer is employed in the process, both yield a set of sorted materials that pro-vide the basis for developing a summary report. Each topic is treated in turn with a brief introduction. The various pieces of transcribed text are used as supporting materials and are incorporated within an interpretative analysis.
The scissor-and-sort technique is a very useful and efficient approach to analysis, but it does tend to rely very heavily on the judgment of a single ana-lyst. This analyst determines which segments of the transcript are important, develops a categorization system for the topics discussed by the group, selects representative statements regarding these topics from the transcript, and devel-ops an interpretation of what it all means. There is obviously much opportu-nity for subjectivity and potential bias in this approach. Yet it shares many of the characteristics of more sophisticated and time-consuming approaches.
In some cases, it may be desirable to have two or more analysts indepen-dently analyze the focus group transcript. The use of multiple analysts provides an opportunity to assess the reliability of the categorizations, at least with respect to major themes and issues. When determining the reliability of more detailed types of categories, such as the intensity of positive and negative emotion associated with various institutions and organizations, more sophisticated coding procedures are required. All are types of content analysis, a topic to which we now turn.
CONTENT ANALYSIS
The meaning of a focus group discussion, or for that matter any set of words, does not leap out complete with interpretation and insight. Rather, the
©SAGE Publications

Analyzing Focus Group Data—125
content of the discussion must be examined and the meaning and its partic-ular implications for the research question at hand discovered. Every effort to interpret a focus group represents analysis of content. There are, however, rigorous approaches to the analysis of content, approaches that emphasize the reliability and replicability of observations and subsequent interpretation. These approaches include a variety of specific methods and techniques that are collectively known as content analysis (Krippendorf, 2013). There are frequent occasions when the use of this more rigorous approach is appropriate for the analysis of data generated by focus groups. This may even be necessary when numerous focus groups are fielded, yielding a large volume of data.
The literature on content analysis provides the foundation for computer- assisted approaches to the analysis of focus group data. Computer-assisted approaches to content analysis are increasingly being applied to focus group data because they maintain much of the rigor of traditional content analysis while greatly reducing the time and cost required to complete such analyses. Such programs also provide a means for examining the contents of verbal interaction in ways that are impossible for a human observer. We consider computer-assisted approaches to content analysis in detail later in this chapter. Before doing so, however, it will be helpful to more rigorously define content analysis and review the general approach employed in such analysis.
Krippendorf (2013) defines content analysis as “a research technique for making replicable and valid inferences from texts (or other meaningful matter) to the contexts of their use” (p. 24). Fifty years ago, Janis (1965) defined it as follows:
Any technique (a) for the classification of the sign-vehicles (b) which relies solely upon the judgments (which theoretically may range from perceptual discrimina-tion to sheer guesses) of an analyst or group of analysts as to which sign-vehicles fall into which categories, (c) provided that the analyst’s judgments are regarded as the report of a scientific observer. (p. 55)
A sign-vehicle is anything that may carry meaning, though most often it is likely to be a word or set of words in the context of a focus group interview. Sign-vehicles may also include gestures, facial expressions, tone of voice, or any of a variety of other means of communication, however. Indeed, such nonver-bal signs may carry a great deal of information and should not be overlooked as a source of information.
Content analysis has a long and rich history in the social sciences (see Krippendorf, 2013, for a concise history of the method). It has been widely applied to varied phenomena such as propaganda, literature and newspapers, transcripts of psychotherapy sessions, and television programming. A rather substantial body of literature now exists on content analysis, including books by Krippendorf and Bock (2008), Krippendorf (2013), Neuendorf (2001; see
©SAGE Publications

126—FOCUS GROUPS: THEORY AND PRACTICE
http://academic.csuohio.edu/kneuendorf/content/ for an online version of this source as well as useful updates and other resources), and Schreier (2012). A number of specific instruments have been developed to facilitate content analysis, including the Message Measurement Inventory (Smith, 1978) and the Gottschalk–Gleser Content Analysis Scale (Gottschalk, Winget, & Gleser, 1969). The Message Measurement Inventory was originally designed for the analysis of communications in the mass media, such as television programming and news magazines. The Gottschalk–Gleser Content Analysis Scale, on the other hand, was designed for the analysis of interpersonal communication. Both scales have been in use for a long time, and there is a rich literature on their applications. These scales have been adapted for other purposes, but they are generally repre-sentative of the types of formal content analysis scales that are in use.
Janis (1965) identified three distinct types of content analysis based on the purpose of the investigation:
1. Pragmatical content analysis, which includes procedures for classifying signs according to their probable causes and effects. In this type of analysis, the emphasis is on why something is said.
2. Semantical content analysis, which seeks to classify signs according to their meanings. This type of analysis may take three forms:
a. Designation analysis, which determines the frequency with which certain objects (or persons, institutions, or concepts) are mentioned. This type of analysis can be a rather simple counting exercise.
b. Attribution analysis, which examines the frequency with which certain char-acterizations or descriptors are used. Again, this can be a simple counting exercise, but the emphasis is on adjectives, adverbs, descriptive phrases, and qualifiers rather than the targets of these parts of speech.
c. Assertions analysis, which provides the frequency with which certain objects (persons, institutions, etc.) are characterized in a particular way. Assertions analysis involves combining designation analysis and attribution analysis. Such an analysis often takes the form of a matrix, with objects as columns and descriptors as rows.
3. Sign-vehicle analysis, which classifies content according to the psychophysical properties of signs (counting the number of times specific words or types of words are used). For example, the degree to which a topic is emotionally involving for respondents may be revealed by examination of the number of emotion-laden words used. (p. 57)
All of these types of analyses may be appropriate to the analysis of focus group data depending on the types of research questions at issue. For exam-ple, pragmatical content analysis may be employed when trying to under-stand the attributions of a group of consumers concerning product failures or the beliefs of a group of teenagers concerning the transmission of AIDS
©SAGE Publications

Analyzing Focus Group Data—127
(acquired immune deficiency syndrome). Semantical content analysis might be used to look at the number of positive and negative characterizations of the Democratic or Republican Party. This example is more specifically an asser-tions analysis. Finally, sign-vehicle analysis might be used to count the number of emotion-laden words that a group of union members use when referring to their employers.
Indeed, these are examples of three measures that have a long history of use in content analysis: (1) the frequency with which a symbol or idea appears, which tends to be interpreted as a measure of importance, attention, or empha-sis; (2) the relative balance of favorable and unfavorable attributions regarding a symbol or idea, which tends to be interpreted as a measure of direction or bias; and (3) the kinds of qualifications and associations made with respect to a symbol or idea, which tend to be interpreted as a measure of the intensity of belief or conviction. Other types of measures that may flow from these types of analyses might focus on the presence or absence of an idea or concept, which might suggest something about focus group respondents’ awareness or knowl-edge and the frequency with which two or more ideas, objects, or persons are associated or linked (Krippendorf, 2013, pp. 62–63).
Although content analysis is a specific type of research tool, it shares many features with other types of research. The same stages of the research process found in content analysis are present in any research project. Schreier (2012, p. 6) identified a number of these stages:
• Deciding on the research question • Selecting material • Building a coding frame • Dividing material into units for coding • Trying out the coding frame • Evaluating and modifying the coding frame • The main analysis • Interpreting and presenting findings
Data used in content analysis of focus group discussions include human speech, observations of behavior, and various forms of nonverbal communi-cation. The speech itself may be recorded, and if video cameras are used, at least some of the behavior and nonverbal communication may be permanently archived. Such data are highly unstructured, however, at least for the purposes of the researcher. Before the content of a focus group can be analyzed, it must be converted into specific units of information that can be analyzed by the researcher. The particular organizing structure that may be used will depend on the particular purpose of the research, but there are specific steps in the structuring process that are common to all applications and questions. These steps are unitizing, sampling, and recording.
©SAGE Publications

128—FOCUS GROUPS: THEORY AND PRACTICE
Unitizing involves defining the appropriate unit or level of analysis. It would be possible to consider each word spoken in a focus group as a unit for analysis. Alternatively, the unit of analysis could be a sentence, a sequence of sentences, or a complete dialogue about a particular topic. Krippendorf (2013, pp. 98–111) suggested that in content analysis, there are three kinds of units that must be considered: (1) sampling units, (2) recording units, and (3) context units.
Sampling units are those parts of the larger whole that can be regarded as independent of each other. Sampling units tend to have physically identified boundaries. For example, sampling units may be defined as individual words, complete statements of an individual, or the totality of an exchange among two or more individuals.
Recording units, on the other hand, tend to grow out of the descriptive system that is being employed. Generally, recording units are subsets of sam-pling units. For example, the set of words with emotional connotations would describe certain types of words and would be a subset of the total words used. Alternatively, individual statements of several group members may be recording units that make up a sampling unit that consists of all of the verbal exchanges related to a particular topic or issue. In this latter case, the recording units might provide a means for describing those exchanges that are, for exam-ple, hostile, supportive, or friendly.
Context units provide a basis for interpreting a recording unit. They may be identical to recording units in some cases, whereas in other cases, they may be quite independent. Context units are often defined in terms of the syntax or structure in which a recording unit occurs. For example, in marketing research, it is often useful to learn how frequently evaluative words are used in the context of describing a particular product or service. Thus, context units provide a referent for the content of the recording units. To illustrate how these distinctions might be drawn in a particular study, consider a medical equipment manufacturer that is exploring new product opportunities through several focus groups. The context unit is a new in-home medical device that enables the early diagnosis of diabetes. The sampling units would be partici-pants’ words or phrases and the recording units their expressions of positive or negative attitudes about the medical product.
Sampling units, then, represent the way in which the broad structure of the information within the discussion is divided. Sampling units provide a way of organizing information that is related. Within these broader sampling units, the recording units represent specific statements, and the context units represent the environment or context in which the statement occurs. The way in which these units are defined can have a significant influence on the interpretation of the content of a particular focus group discussion. These units can be defined in a number of different ways. Table 7.1 distinguishes five
©SAGE Publications

Analyzing Focus Group Data—129
such approaches to defining these units. Focus group research is most often concerned with referential, propositional, and thematic units, but there may be occasions when the use of physical or syntactical units is appropriate. This approach may seem somewhat abstract and overlapping to some degree, yet it provides a framework for more systematic and nuanced analyses of focus group data. Also, the definition of the appropriate unit of analysis must be driven by both the purpose of the research and the ability of the researcher to achieve reliability in the coding system. The reliability of such coding systems must be determined empirically, and in many cases, it involves the use of mea-sures of interrater agreement.
• Physical units divide the content of a medium by physical properties such as size, place, time, and length. For example, a book, a billboard, and a single issue of a magazine would all be examples of physical units. The boundaries of these units are defined by time and space.
• Syntactical units divide the content of a medium based on its natural grammar. Words, individual television programs or news items, and chapters within books are examples. These units tend to be defined by the source of the communication.
• Categorical units are defined in terms of a referent, an expression, regardless of length, that refers to or describes the same person, object, or event.
• Propositional units (also called kernels) are referential units that possess a particular structure and offer a particular thought about the referent object or person. Thus, the statement, “He is a bright, but dishonest man,” includes two propositions: (1) the man is bright and (2) the man is dishonest.
• Thematic units include more global interpretative or explanatory sets of statements. Recurring systems of beliefs or explanations represent thematic units. Thus, one might find that in a focus group, there is a recurring theme that salespeople are dishonest. Alternatively, analysis of the morning news over time might reveal themes related to significant economic changes or political conflict.
Table 7.1 Approaches to Defining Content Units
SOURCE: Adapted from Krippendorf (2013, pp. 104–109).
It is seldom practical or necessary to try to unitize all of the discussion that arises in a focus group. When multiple focus groups are carried out on the same general topic, complete unitization becomes even more difficult. For this reason, most content analyses of focus groups involve some sampling of the total group discussion for purposes of analysis. The analyst may seek to
©SAGE Publications

130—FOCUS GROUPS: THEORY AND PRACTICE
identify important themes and sample statements within a theme or use some other approach, such as examining statements made in response to particular types of questions or at particular points in the conversation. Like other types of sampling, the intent of sampling in content analysis is to provide a repre-sentative subset of the larger population. It is relatively easy to draw incorrect conclusions from a focus group if care is not taken to ensure representative sampling of the content of the group discussion. Almost any contention can be supported by taking a set of numerically unrepresentative statements out of the context in which they were spoken. Thus, it is important for the analyst to devise a plan for sampling the total content of group discussions. This task is complicated when only some group participants answer a particular question.
The final stage of data making is the recording of the data in such a way as to ensure their reliability and meaningfulness. The recording phase of content analysis is not simply the rewriting of the statements of one or more respondents. Rather, it is the use of the defined units of analysis to classify the content of the discussion into categories such that the meaning of the discussions is maintained and explicated. It is only after this latter stage has been accomplished that one can claim to actually have data for purposes of analysis and interpretation.
The recording phase of content analysis requires the execution of an explicit set of recording instructions. These instructions represent the rules for assigning units (words, phrases, sentences, gestures, etc.) to categories. These instructions must address at least four different aspects of the recording pro-cess (Krippendorf, 2013):
1. The nature of the raw data from which the recording is to be done (transcript, tape recording, film, etc.)
2. The qualifications and characteristics of coders (recorders), including any special skills such as familiarity with the subject matter and scientific research
3. The training that coders will need to do the recording
4. The specific rules for placing units into categories
These rules are critical in establishing the reliability of the recording exer-cise and the entire data-making process. Furthermore, it is necessary that these rules be made explicit and that they are demonstrated to produce reliable results when used by individuals other than those who developed them in the first place. The common practice of reporting high interrater reliability coefficients when they are based solely on the agreement of individuals who have worked closely together to develop a coding system does not provide a fair and reasonable measure of reliability (Lorr & McNair, 1966). Rather, the minimum requirement for establishing the reliability of a coding system should be a demonstration that judges exhibit substantial agreement when using only the coding rules.
©SAGE Publications
Analyzing Focus Group Data—131
Once a set of recording rules has been defined and demonstrated to produce reliable results, the data-making process can be completed by applying the recording rules to the full content of the material of interest. Under ideal circumstances, recording will involve more than one judge so that the coding of each specific unit can be examined for reliability and sources of disagreement can be identified and corrected. This is because there is a difference between developing a generally reliable set of recording rules and ensuring that an individual element in a transcript is reliably coded.
The assessment of the reliability of a coding system may be carried out in a variety of ways. As noted above, there is a difference between establishing that multiple recorders are in general agreement (manifest a high degree of interrater reliability) and establishing that a particular unit is reliably coded. The researcher must decide which approach is more useful for the given research question. In most focus group projects, general rater reliability will be more important because the emphasis is on general themes in the group discussion rather than specific units. However, there may be occasions when the reliability of individual units is more relevant.
Computation of a coefficient of agreement provides a quantitative index of the reliability of the recording system. There exists a substantial literature on coefficients of agreement. Treatment of this literature and issues related to the selection of a specific coefficient of agreement are beyond the scope of this book. Among the more common coefficients in use are kappa (Cohen, 1956; Fleiss, 1971), pi (Scott, 1955), and Krippendorf ’s alpha (Krippendorf, 1970, 2013). All of these coefficients correct the observed level of agreement (or disagreement) for the level that would be expected by chance alone. Krippendorf (2013) offers a useful discussion of reliability coefficients in content analysis, including procedures for use with more than two judges (see also Schreier, 2012; Spiegelman, Terwilliger, & Fearing, 1953).
Turning raw content into meaningful units for analysis, sometimes referred to as data making, tends to be the most time-consuming of all the stages in content analysis. It is also the stage that has received the greatest attention in the content analysis literature. The reason for this is that content analysis involves the creation of units for analysis after observations have been obtained rather than before. Content analysis uses the observations themselves to suggest what should be examined and submitted to further analysis, whereas many other types of research establish the specific domain(s) of interest and associated metrics prior to observation.
The difference in the emphasis accorded to the data-making phase by different types of research methods is similar to the difference between essay questions and multiple-choice questions. In both types of questions, there are certain issues of interest, but in the case of essay questions, the answers are not provided. Thus, the answers are in the words of the respondent. Whoever
©SAGE Publications

132—FOCUS GROUPS: THEORY AND PRACTICE
evaluates the examination must devote time to analyzing the answers and determining how “correct” the response is. This evaluation stage is unnecessary for multiple-choice questions because the available answers are identified for the respondent, and the evaluator needs to only determine whether the correct answer was selected. Multiple-choice questions require greater preparation prior to administration because the correct answer must be identified along with reasonable alternative, but incorrect, responses.
In survey research, much of the data making occurs prior to administration of the survey. Such data making involves identification of reasonable alternatives from which a respondent selects an answer. Thus, data making is a step in survey research and all types of research, but it occurs prior to observation. In content analysis, data making occurs after observation. The emphasis on reliability is clearly important in studies with scientific, theoretical purposes. On the other hand, these procedures are used less frequently in the time-pressured and prag-matic focus groups that are conducted in the marketing research field.
Quantitative Analysis
The recording or coding of individual units is not content analysis. It is merely a first stage in preparation for analysis. The specific types of analyses that might be used in a given application will depend on the purpose of the research. Virtually any analytic tool may be employed, ranging from simple descriptive analysis to more elaborate data reduction and multivariate associative techniques. Much of the content analysis work that occurs in the context of focus group data tends to be descriptive, but this need not be the case. Indeed, although focus group data tend to be regarded as qualitative, proper content analysis of the data can make them amenable to the most sophisticated quantitative analysis.
It is common for focus group interviews to be used for purposes of devel-oping hypotheses that are then tested or validated with other types of research. For example, a focus group may yield hypotheses that are tested through a survey of the population of interest. This is, of course, a perfectly appropriate approach. On the other hand, the need for validation is not unique to focus group research. This is well illustrated in a review by Reid, Soley, and Wimmer (1980) of replication studies in the field of advertising. Although the majority of the studies they examined in this research were replications of survey and experimental research findings, there was an equal probability of the replication producing results contrary to the original study as there was of the replication finding support for the original study. Such findings are not unique to adver-tising and suggest that replication and validation are necessary steps in any scientific endeavor. There is a need for validation of focus group results, just as there is a need for validation of other types of research findings. Such validation
©SAGE Publications

Analyzing Focus Group Data—133
may involve content analysis of additional focus group data or may employ other methods and measures such as survey research or formal experiments.
Computer-Assisted Content Analysis
Content analysts were quick to recognize the value of the computer as an analytical tool. The time-consuming and tedious task of data making can be greatly facilitated through use of the computer. Computers can be pro-grammed to follow the data-making rules described earlier. The importance of ensuring that these rules are well designed is made even clearer in the context of their use by a computer. In recent years, computer-assisted interpretation of focus group interviews has received considerable attention and built on the earlier foundations of research on content analysis.
The earliest uses of computers in content analysis involved counting and sorting units of analysis. A straightforward counting of the number of words and number of different words is easily programmed on a computer, and the program can be written to ignore grammatical endings and count only differ-ent word stems. Such counts and listings are useful in data making because they provide an indication of the word content of material.
Once particular categories of words have been defined, the computer can quickly count words in these identified categories and be used to quickly iden-tify their location. Search-and-find and cut-and-paste routines that now exist on virtually every word processing software package make it easy to automate the old cut-and-paste technique described above, which commonly saves both research time and money. The computer is capable of a great deal more than automation of search, find, count, cut, and paste activities. One problem with simple counting and sorting of words is that these procedures lose the context in which the words occur. For example, a simple count of the frequency with which emotionally charged words are used loses information about the objects of those emotional words. Because the meanings of words are frequently context dependent, it is useful to try to capture their context. This is one reason content analysts recommend the identification and coding of context units as a routine part of content analysis. Useful reviews of computer-aided approaches to con-tent analysis are provided by Schreier (2012, chap. 12) and Krippendorff (2013, chap. 11). Other useful resources are the Text Analysis Info website (http:// textanalysis.info), which is a free source of information about computer-as-sisted content analysis; and the Content-analysis.de website (http://www.con-tent-analysis.de/), which is maintained by the Centre for Survey Research and Methodology (ZUMA or Zentrum für Umfragen, Methoden und Analysen).
One computer-assisted approach to capturing the context as well as content of a passage of text is the key-word-in-context (KWIC) technique.
©SAGE Publications

134—FOCUS GROUPS: THEORY AND PRACTICE
The KWIC approach searches for key words and lists the key word along with the text that surrounds it. The amount of text obtained on either side of the key word can be controlled by specification of the number of words or letters to be printed. One of the earliest computer programs for KWIC analyses was the General Inquirer (Stone, Dunphy, Smith, & Ogilvie, 1966; Stone & Hunt, 1963), which is still in use today. The home page can be found at http://www.wjh.harvard.edu/~inquirer/. The General Inquirer uses a theoretically derived dictionary for classifying words. A variety of similar systems has since been developed and often uses specially designed dictionaries for a particular appli-cation. Some of these programs are simply designated as KWIC, and others are named for particular applications for which KWIC may be used.
Commercial software products specifically designed for content coding and word counting are now widely available. SPSS offers Text Analytics Software (http://www-03.ibm.com/software/products/us/en/spss-text-analytics-surveys/), SAS offers Text Analytics (http://www.sas.com/text-analytics/), and StatPac offers a product called Verbatim Blaster (http://www.statpac.com/content-analysis.htm). These three products are most useful for simple coding applications, such as counting key words and phrases. More complex coding may involve tagging dialogue that is related to themes, narratives, or profiles. QSR International offers the NVivo (www.qsrinternational.com; see also Bazeley, 2007), and SocioCultural Research Consultants offers an online product called Dedoose (http://www.dedoose.com). There are many other products available, and all vary in terms of their ease of use, comprehensiveness, focus, and cost. Software for text analysis is frequently reviewed in journals such as Computers and the Humanities, published by Kluwer Academic Publishers, and Literary and Linguistic Computing, pub-lished by Oxford University Press. Specialized dictionaries for use in conjunction with various text analysis programs are also available.
More recent work on content analysis, built on the research on artificial intel-ligence and in cognitive science, recognizes that associations among words are often important determinants of meaning. Furthermore, meaning may be related to the frequency of association of certain words, the distance between associated words or concepts (often measured by the number of intervening words), and the number of different associations. The basic idea in this work is that the way people use language provides insights into the way people organize information, impressions, and feelings in memory and, thus, how they tend to think.
The view that language provides insight into the way individuals think about the world has existed for many years. The anthropologist Edward Sapir (1929) noted that language plays a critical role in how people experience the world. Social psychologists have also long had an interest in the role language plays in the assignment of meaning and in adjustment to the environment (see, e.g., Bruner, Goodnow, & Austin, 1956; Chomsky, 1965; Sherif & Sherif, 1969). In more recent years, the study of categorization has become a discipline in its own right and has benefited from research on naturalistic categories in anthropology, philosophy, and
©SAGE Publications
Analyzing Focus Group Data—135
developmental psychology and the work on modeling natural concepts that has occurred in the areas of semantic memory and artificial intelligence (for reviews of this literature, see Hahn & Ramscar, 2001; Medin, Lynch, & Solomon, 2000).
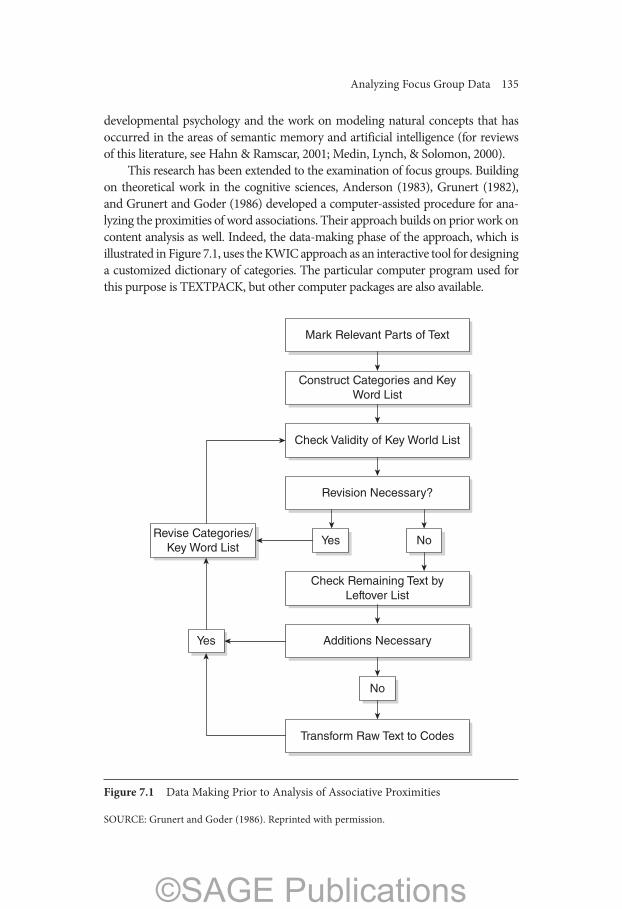
This research has been extended to the examination of focus groups. Building on theoretical work in the cognitive sciences, Anderson (1983), Grunert (1982), and Grunert and Goder (1986) developed a computer-assisted procedure for ana-lyzing the proximities of word associations. Their approach builds on prior work on content analysis as well. Indeed, the data-making phase of the approach, which is illustrated in Figure 7.1, uses the KWIC approach as an interactive tool for designing a customized dictionary of categories. The particular computer program used for this purpose is TEXTPACK, but other computer packages are also available.
Figure 7.1 Data Making Prior to Analysis of Associative Proximities
Mark Relevant Parts of Text
Check Validity of Key World List
Revision Necessary?
Yes
Check Remaining Text byLeftover List
Additions NecessaryYes
No
No
Transform Raw Text to Codes
Revise Categories/Key Word List
Construct Categories and KeyWord List
SOURCE: Grunert and Goder (1986). Reprinted with permission.
©SAGE Publications
136—FOCUS GROUPS: THEORY AND PRACTICE
The construction of a customized dictionary of categories is particularly important for the content analysis of focus groups because the range and spec-ificity of topics that may be dealt with by focus group interviews is very broad, and no general purpose dictionary or set of codes and categories is likely to suit the purposes of a researcher with a specific research application. For example, in focus groups designed to examine the ways in which groups of respondents think and talk about personal computers, there will be a need to develop a dictionary of categories that refer specifically to the features of computers, particular appli-cations, and specific work environments. In focus groups designed to examine the use of condoms among inner-city adolescents, it is likely that a dictionary of categories will be required to capture the content of the discussion that includes the slang vernacular of the respondents. Although the dictionaries developed for other applications may provide some helpful suggestions, the specificity of the language used by particular groups of respondents to discuss a specific object within a given context almost always means that the focus group analyst will have to develop a customized categorization system. Although quantitative in approach, such procedures enhance focus groups’ qualitative objective to obtain the natural language and expressions of individual participants.
Once the data-making phase is complete, the associative structure of the discussion content can be analyzed. This is accomplished by counting the dis-tances between various cognitive categories. Distance, or the proximity of two categories of content, is defined as the number of intervening constructs. Thus, two constructs that appear next to one another would have a distance of 1. To simplify computations, Grunert and Goder (1986) recommended examining categories that are at a maximum value of 10. This maximum value is then used as a reference point, and distances are subtracted from it to obtain a numeric value that varies directly (rather than inversely) with intensity of association. This procedure yields a proximity value rather than a distance measure; that is, the higher scores represent closer associations among categories. Because most categories appear more than once, the measures of association are summed over all occurrences to obtain a total proximity score for each pair of con-structs. These proximity data may then be used for further analysis.
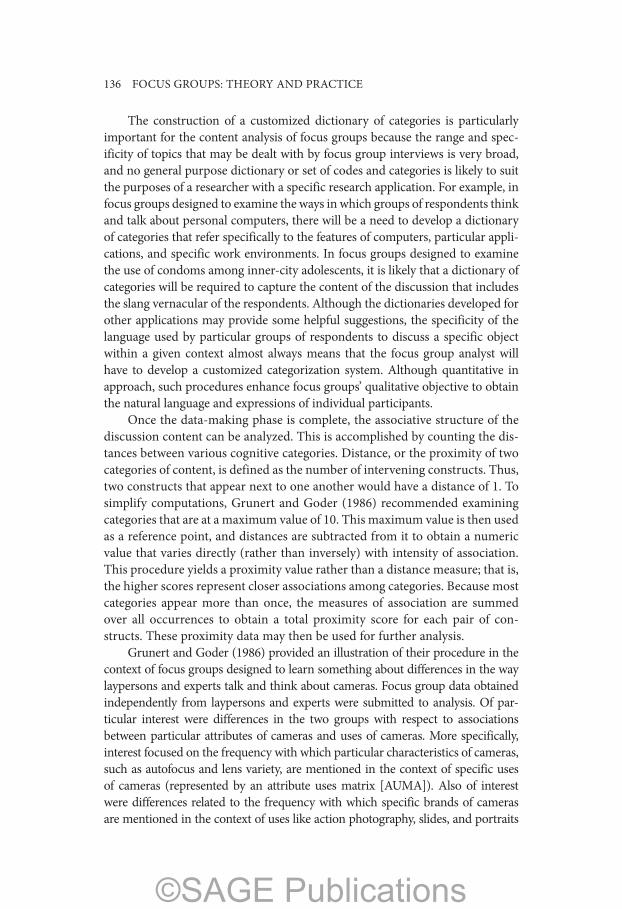
Grunert and Goder (1986) provided an illustration of their procedure in the context of focus groups designed to learn something about differences in the way laypersons and experts talk and think about cameras. Focus group data obtained independently from laypersons and experts were submitted to analysis. Of par-ticular interest were differences in the two groups with respect to associations between particular attributes of cameras and uses of cameras. More specifically, interest focused on the frequency with which particular characteristics of cameras, such as autofocus and lens variety, are mentioned in the context of specific uses of cameras (represented by an attribute uses matrix [AUMA]). Also of interest were differences related to the frequency with which specific brands of cameras are mentioned in the context of uses like action photography, slides, and portraits
©SAGE Publications

Analyzing Focus Group Data—137
(represented by a brand uses matrix [BUMA]). In addition, the study focused on differences between particular brands with respect to specific attributes, that is the frequency with which specific brands of cameras are associated with particular features (represented by a brand attribute matrix [BAMA]).
Figure 7.2 provides a summary of the results of this application. Not surprisingly, there are far richer associative structures among experts than among laypersons. The particular character of these structures can also be
AUMA Characteristics Laypersons Experts
Total # of attributes 36 40
# of attributes linked to uses 13 31
Total # of uses 4 12
# of uses linked to attributes 4 12
Absolute # of links 19 120
Relative # of links 13% 25%
BAMA Characteristics Laypersons Experts
Total # of attributes 36 40
# of attributes linked to brands 28 34
Total # of brands 22 27
# of brands linked to attributes 20 24
Absolute # of links 151 274
Relative # of links 19% 25%
BUMA Characteristics Laypersons Experts
Total # of attributes 22 27
# of attributes linked to brands 0 14
Total # of brands 4 12
# of brands linked to attributes 0 10
Absolute # of links 0 34
Relative # of links — 10%
SOURCE: Grunert and Goder (1986). Reprinted with permission.
Figure 7.2 Summary Information on Camera Associations
©SAGE Publications

138—FOCUS GROUPS: THEORY AND PRACTICE
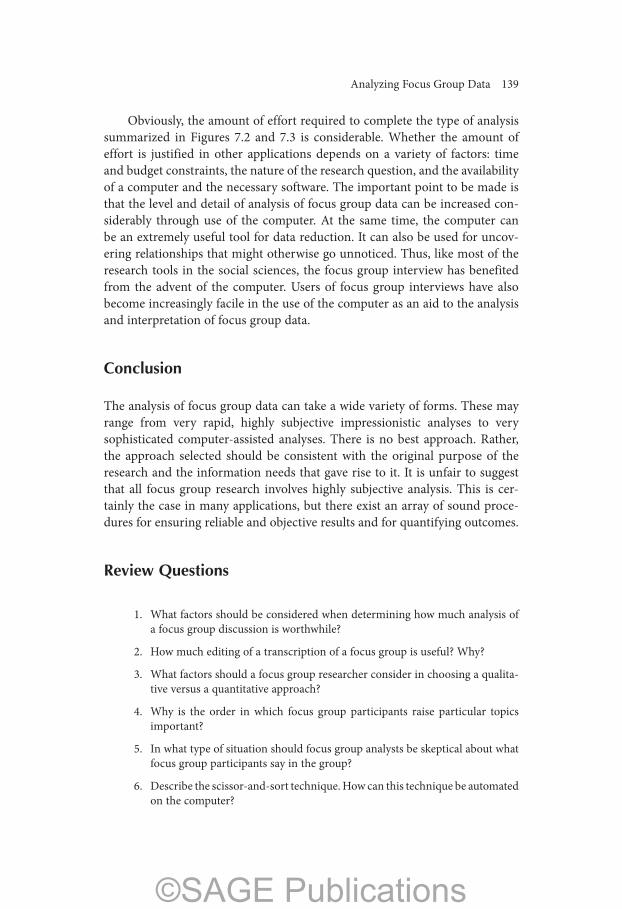
Figure 7.3 Graphic Representation of the Canon Plane for Experts and Laypersons
SOURCE: Grunert and Goder (1986). Reprinted with permission.
Picture Quality
Aperture
Handling
Test Result
Focal Length
Object Length
Re�ex Camera
Automatic
Wei
ght
Pric
e
Out-Indoor
Special Pictures
Motive
Vacation
Macro-Pictures
Frequency
Canon PlaneLaypersons
Canon PlaneExperts
Exp
ansi
onP
ossi
bilit
ies
Siz
eBat
terie
s
Illegal Import
Exposure Tim
eWinder Po
cket
Cam
era
Lens
Var
iety
Compa
tibilit
y
Slides
Light
Sen
sitivi
tyFlashTe
chnica
l Standard
Autofocus
Shutter12
2
3
35
5
5
6
26
25
33
999
1112
1416151924
24
2532
32
30
3444
16
20
34
44
55
70
93115
123125 130
Hobby
People
Batteries Auto
mat
ic
Discontinued Model
Reputation
Pric
e
Robustness
Test
Result
illustrated. For example, Figure 7.3 provides an illustration of the associa-tive structures of experts and laypersons for the brand Canon. The lengths of the lines in the figure are inversely related to strength of association. The graphical illustration in Figure 7.3 provides a comprehensible means for summarizing the information obtained through content analysis. Note that Figure 7.3 provides information about the types of associations made as well as the frequency of these associations, which are represented by the numbers within the circles.
©SAGE Publications
Analyzing Focus Group Data—139
Obviously, the amount of effort required to complete the type of analysis summarized in Figures 7.2 and 7.3 is considerable. Whether the amount of effort is justified in other applications depends on a variety of factors: time and budget constraints, the nature of the research question, and the availability of a computer and the necessary software. The important point to be made is that the level and detail of analysis of focus group data can be increased con-siderably through use of the computer. At the same time, the computer can be an extremely useful tool for data reduction. It can also be used for uncov-ering relationships that might otherwise go unnoticed. Thus, like most of the research tools in the social sciences, the focus group interview has benefited from the advent of the computer. Users of focus group interviews have also become increasingly facile in the use of the computer as an aid to the analysis and interpretation of focus group data.
Conclusion
The analysis of focus group data can take a wide variety of forms. These may range from very rapid, highly subjective impressionistic analyses to very sophisticated computer-assisted analyses. There is no best approach. Rather, the approach selected should be consistent with the original purpose of the research and the information needs that gave rise to it. It is unfair to suggest that all focus group research involves highly subjective analysis. This is cer-tainly the case in many applications, but there exist an array of sound proce-dures for ensuring reliable and objective results and for quantifying outcomes.
Review Questions
1. What factors should be considered when determining how much analysis of a focus group discussion is worthwhile?
2. How much editing of a transcription of a focus group is useful? Why?
3. What factors should a focus group researcher consider in choosing a qualita-tive versus a quantitative approach?
4. Why is the order in which focus group participants raise particular topics important?
5. In what type of situation should focus group analysts be skeptical about what focus group participants say in the group?
6. Describe the scissor-and-sort technique. How can this technique be automated on the computer?
©SAGE Publications

140—FOCUS GROUPS: THEORY AND PRACTICE
7. What is content analysis? Why is it appropriate for analysis of focus group discussions?
8. What is data making? Why is it important?
9. What are the steps in data making?
10. What are recording rules? How does one determine whether a set of rules is useful?
11. What is the KWIC approach? How would it be used to analyze focus group data?
12. What is meant by associative structure? How does one examine associative structure? How might analysis of associative structures be useful in the con-text of focus group research?
13. Identify research situations when the following types of analysis might be most appropriate:
a. A quick impressionistic summaryb. A thematic analysis using the cut-and-paste approachc. Assertions analysisd. Pragmatical analysise. Analysis of associative structures
Exercise: Find a news story in a popular magazine. Develop a categori-zation system for coding the content of the story. Share your content analysis with a friend who has not read the magazine. How much of the content of the story does your friend obtain from your content analysis? What does this sug-gest to you about the uses of content analysis?
©SAGE Publications