analyzing ancient political power and urbanization...
TRANSCRIPT
Keywords: viewsheds; historical re-creation; contours; sight lines
Analyzing Ancient Political Power and Urbanization Patterns —by Jeff Blossom
Introduction
Problem
How might you use visibility to map an ancient civilization's political landscape?
The Yoruba civilization, one of the oldest known, dates back to 350 BC (Wikipedia). The ancient city of Ife, located in present-day Nigeria, is commonly regarded as the origin of Yoruba civilization, with archaeological evidence of urbanization in AD 500 (Metropolitan Museum of Art 2000). According to Yoruba mythology, the deity Oduduwa established the political structure of Ife by planting a palm nut that grew into a great tree with 16 branches, representing the clans of the early Ife city-state (Wikipedia). These 16 clans were scattered around the perimeter of Ife, and though the clans paid homage to the central palace, each one had its own chief.
But the clans of Ife were irregular both in terms of geography and political influence, factors that must be considered in analyzing the political power in Ife. Which of the 16 clans had the most influence? Certainly, having a powerful clan leader, or chief, made a difference. Did the location of a chief's residence play a role in determining clan power?
With extensive archaeological work, locations of the chiefs' residences have been mapped. One theory of political power, as proposed by French philosopher Michel Foucault (1984), is that visibility and line of sight determine the power structure of one group over another.
So is it possible to use visibility analysis to assess the relative power wielded by the different chiefs? Thanks to archaeology and modern mapping, the answer is yes.
Location
Ife, Nigeria

Analyzing Ancient Political Power and Urbanization Patterns Jeff Blossom
2
Time to complete the lab
Two hours
Prerequisites
Familiarity with ArcMap™ software Ability to export individual features into new feature classes Ability to add a field to a dataset and calculate values to the field
Data used in this lab
Digital elevation model (DEM) and vector data derived from archaeological excavations of Ife Geographic coordinate system: WGS 1984 Datum: WGS 1984 Projected coordinate system: UTM, Zone 31N
Student activity
Archaeological excavations have unearthed the locations of the residences of the 16 chiefs, central palace, town walls, and buildings of Ife. These locations, along with a modern-day DEM, were mapped into geographic information system (GIS) format. With this data, you will test Foucault's theory of visibility affecting the power structure of the Yoruba civilization.
First, you will create overview and contour maps to familiarize yourself with the topography, central palace, and chief locations in Ife. Then you'll create visibility maps from each of the chiefs' residence locations. The results will be quantified in terms of viewable area per chief and analyzed in terms of the resultant political power and any urbanization patterns that may correlate with the viewsheds.

Analyzing Ancient Political Power and Urbanization Patterns Jeff Blossom
3
In this lab, you will do the following:
Prepare the data • Copy ife_dem, Chiefs, Palace, Town_boundary_polygon, Town_walls, and Building feature
classes from the Ife folder. • Add a field called OFFSETA to the Chiefs shapefile. Calculate the OFFSETA value as being
equal to 2. • Export each chief residence location into a separate feature class for individual viewshed
creation.
Create maps • Create a contour map from the DEM. • Create viewsheds from each of the chief residence locations. • Create and include a viewshed map for one of the chiefs. • Calculate the percentage of viewable area within the town walls. • Create a viewshed from the palace and include a map of it.
Analyze results
• Determine which chiefs have a view of the palace. • Rank the chiefs' political power based on viewable area within the palace walls. • Determine whether there are any urbanization patterns that correlate with any one
chief's viewable area.
PREPARE YOUR WORKSPACE
Examine all data in the Ife folder (you should have an ife_dem raster layer; Chiefs, Palace, Town_boundary_polygon, and Town_walls vector shapefiles; and Building feature classes).
CREATE AN IFE OVERVIEW MAP
1 Start ArcMap and add the ife_dem raster layer and Chiefs, Palace, Town_boundary_polygon, and Town_walls vector data layers.
Question 1: What coordinate system are these data layers in, and what is the linear unit of this coordinate system?
Question 2: What is the geographic footprint of ife_dem in terms of kilometers wide by kilometers long? Express your answer in the format of "distance north to south" and "distance west to east."
You can visualize elevation on a 2D map by using contour lines. For this exercise, you will create a contour layer from ife_dem and use it to help the map reader visualize elevation on an overview map of the features.
Analyzing Ancient Political Power and Urbanization Patterns Jeff Blossom
4
2 In ArcToolbox™, use the Contour tool (Spatial Analyst » Surface » Contour) to produce a contour layer of ife_dem.
3 The elevation, or z-units, of this data layer are in meters. Specify the contour interval as 20 m.
4 Examine the resultant contour map.
Question 3: What is the topography like in Ife and the surrounding area? Describe the topography both inside and outside the town walls.
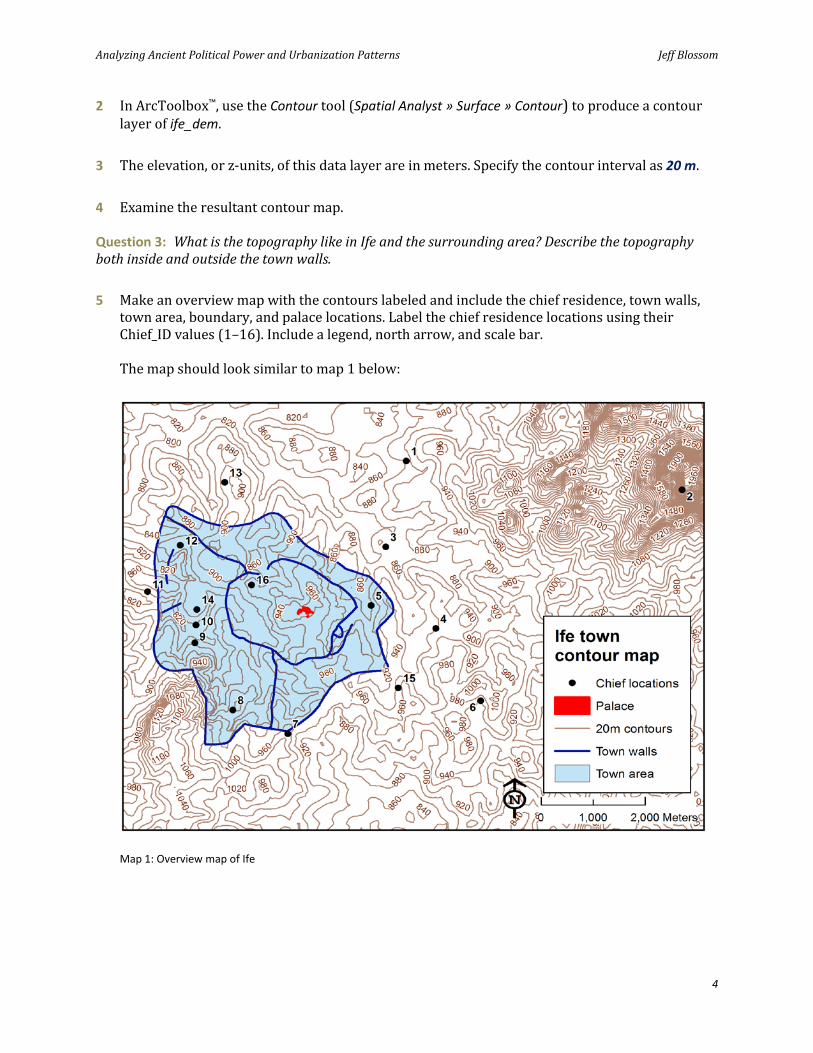
5 Make an overview map with the contours labeled and include the chief residence, town walls, town area, boundary, and palace locations. Label the chief residence locations using their Chief_ID values (1–16). Include a legend, north arrow, and scale bar.
The map should look similar to map 1 below:
Map 1: Overview map of Ife
Analyzing Ancient Political Power and Urbanization Patterns Jeff Blossom
5
CREATE IFE CHIEF RESIDENCE LOCATION VIEWSHED MAPS
1 Export each of the 16 chief residence locations into separate feature classes in a new file geodatabase called Chief_Locations. Name them Chief1, Chief2, and so on.
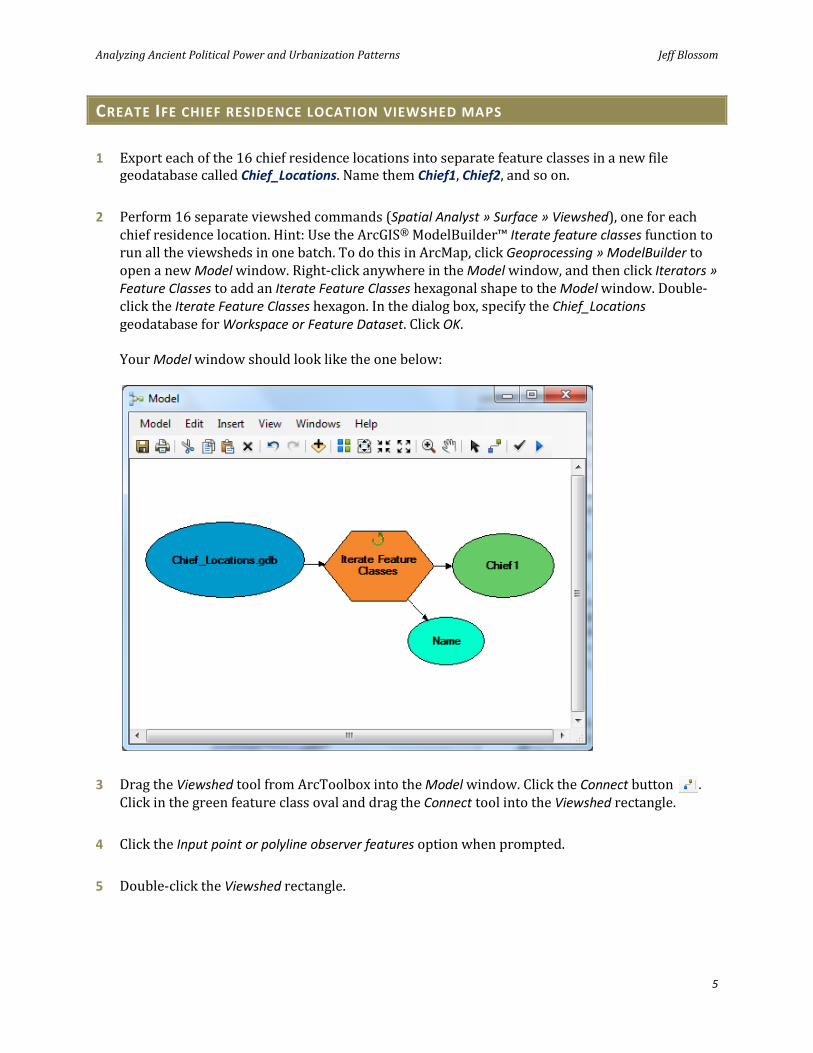
2 Perform 16 separate viewshed commands (Spatial Analyst » Surface » Viewshed), one for each chief residence location. Hint: Use the ArcGIS® ModelBuilder™ Iterate feature classes function to run all the viewsheds in one batch. To do this in ArcMap, click Geoprocessing » ModelBuilder to open a new Model window. Right-click anywhere in the Model window, and then click Iterators » Feature Classes to add an Iterate Feature Classes hexagonal shape to the Model window. Double-click the Iterate Feature Classes hexagon. In the dialog box, specify the Chief_Locations geodatabase for Workspace or Feature Dataset. Click OK.
Your Model window should look like the one below:
3 Drag the Viewshed tool from ArcToolbox into the Model window. Click the Connect button . Click in the green feature class oval and drag the Connect tool into the Viewshed rectangle.
4 Click the Input point or polyline observer features option when prompted.
5 Double-click the Viewshed rectangle.
Analyzing Ancient Political Power and Urbanization Patterns Jeff Blossom
6
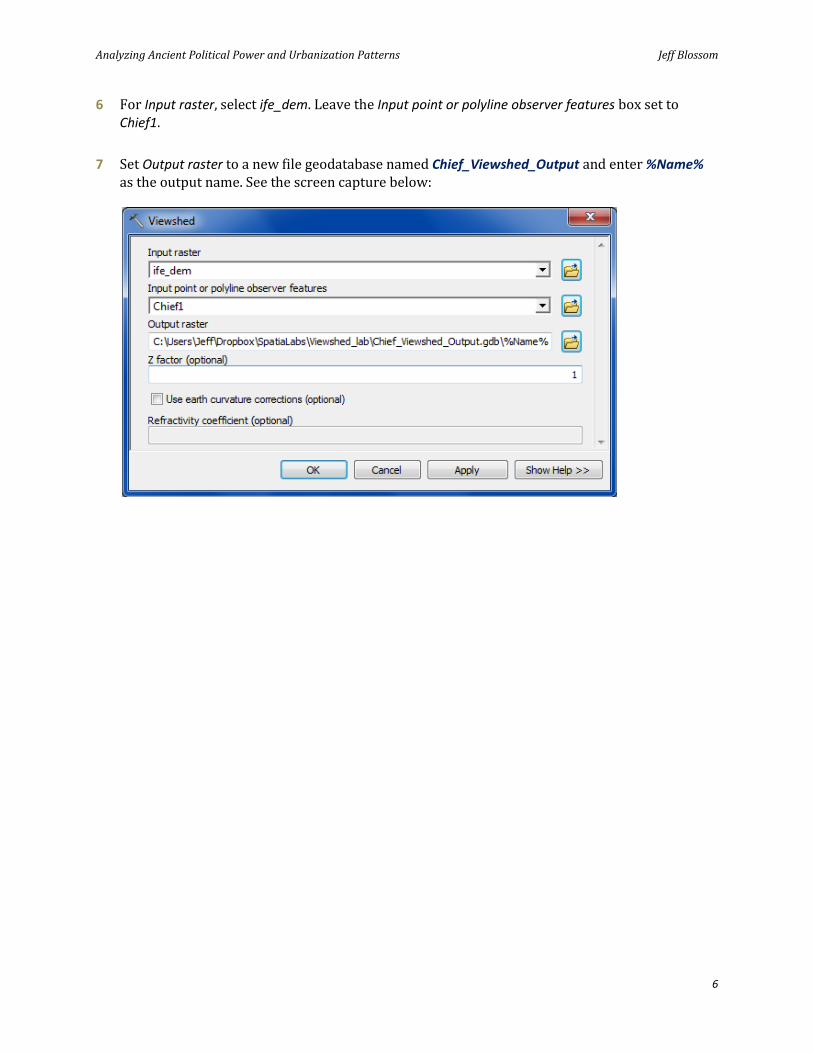
6 For Input raster, select ife_dem. Leave the Input point or polyline observer features box set to Chief1.
7 Set Output raster to a new file geodatabase named Chief_Viewshed_Output and enter %Name% as the output name. See the screen capture below:
Analyzing Ancient Political Power and Urbanization Patterns Jeff Blossom
7
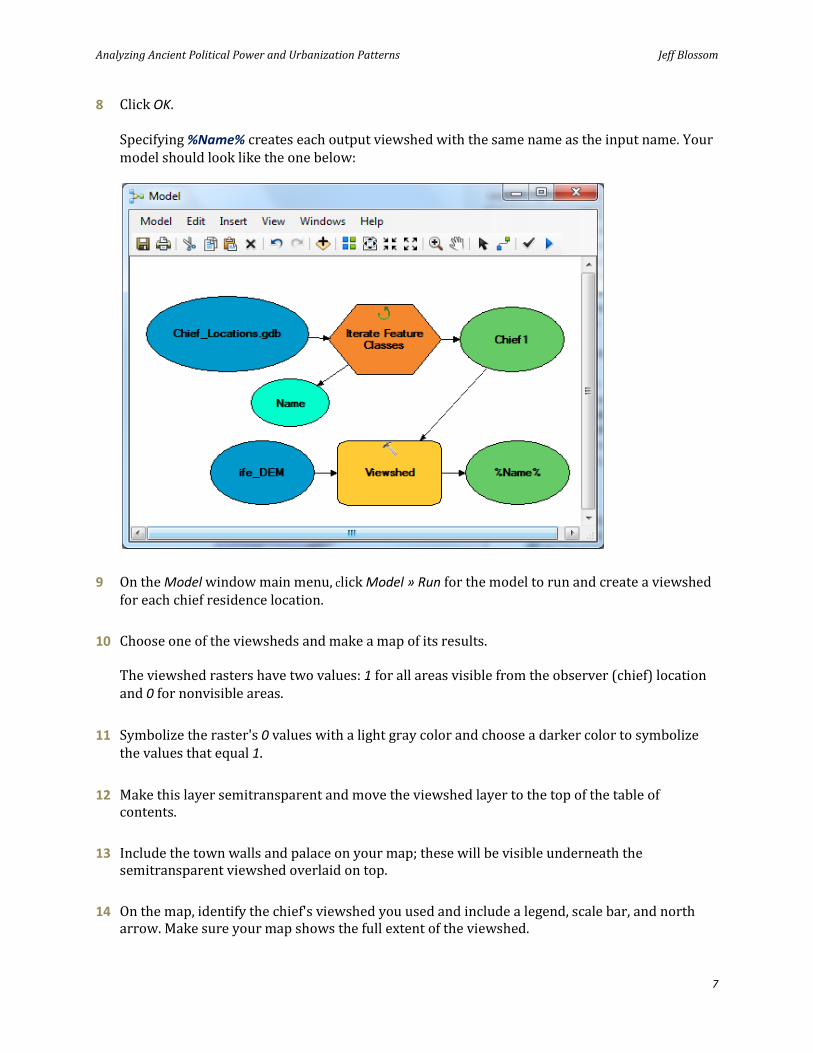
8 Click OK.
Specifying %Name% creates each output viewshed with the same name as the input name. Your model should look like the one below:
9 On the Model window main menu, click Model » Run for the model to run and create a viewshed for each chief residence location.
10 Choose one of the viewsheds and make a map of its results.
The viewshed rasters have two values: 1 for all areas visible from the observer (chief) location and 0 for nonvisible areas.
11 Symbolize the raster's 0 values with a light gray color and choose a darker color to symbolize the values that equal 1.
12 Make this layer semitransparent and move the viewshed layer to the top of the table of contents.
13 Include the town walls and palace on your map; these will be visible underneath the semitransparent viewshed overlaid on top.
14 On the map, identify the chief's viewshed you used and include a legend, scale bar, and north arrow. Make sure your map shows the full extent of the viewshed.
Analyzing Ancient Political Power and Urbanization Patterns Jeff Blossom
8
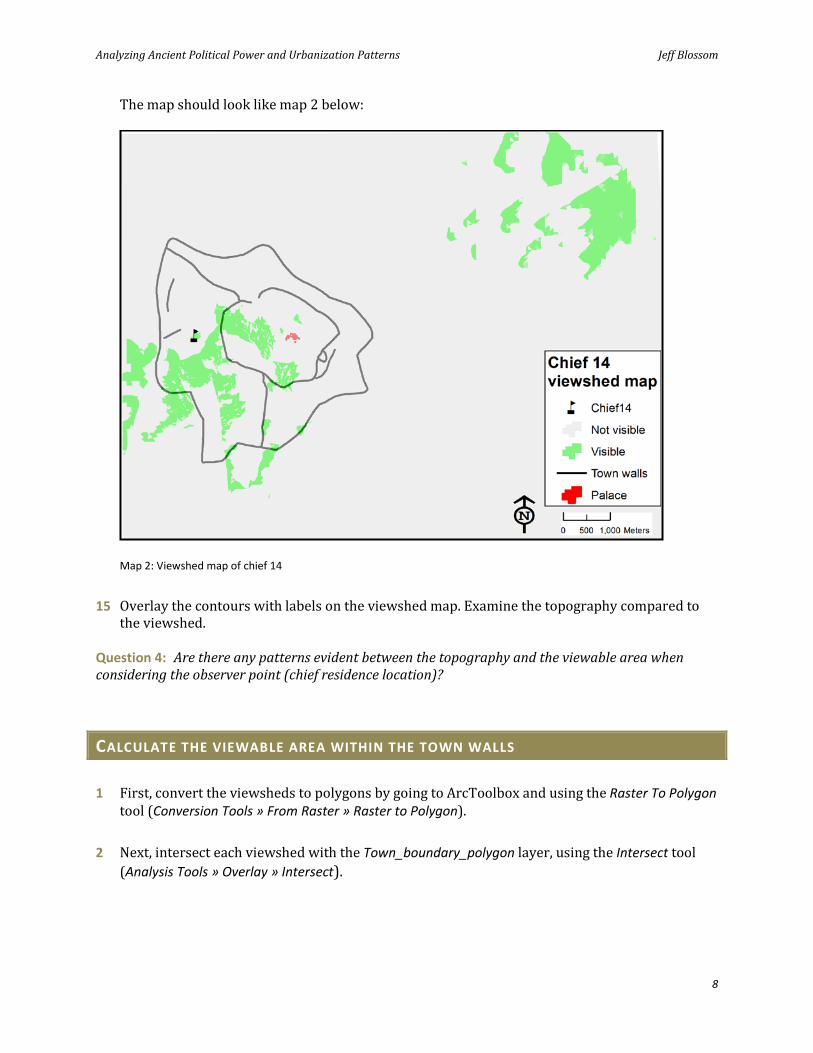
The map should look like map 2 below:
Map 2: Viewshed map of chief 14
15 Overlay the contours with labels on the viewshed map. Examine the topography compared to the viewshed.
Question 4: Are there any patterns evident between the topography and the viewable area when considering the observer point (chief residence location)?
CALCULATE THE VIEWABLE AREA WITHIN THE TOWN WALLS
1 First, convert the viewsheds to polygons by going to ArcToolbox and using the Raster To Polygon tool (Conversion Tools » From Raster » Raster to Polygon).
2 Next, intersect each viewshed with the Town_boundary_polygon layer, using the Intersect tool (Analysis Tools » Overlay » Intersect).
Analyzing Ancient Political Power and Urbanization Patterns Jeff Blossom
9
3 From this result, select all the polygons with gridcode = 1 and export them into new file geodatabase feature classes.
Making a model of these tools in ArcGIS ModelBuilder and iterating through the model for each viewshed is an efficient way to process them. The resultant polygon feature classes contain just the visible area within the town walls for each chief.
4 In the visible area polygons for each chief, the Shape_Area field contains the total visible area in square meters for each chief. Right-click the Shape_Area field and click Statistics.
5 The Sum field contains the total visible area. Copy this sum and paste it into a spreadsheet.
6 Repeat this step and copy the total visible areas for all 16 chiefs into the spreadsheet.
7 Check the statistics in the Town_boundary_polygon layer to get the total area in square meters for the town. Add this to the spreadsheet as well, in a separate column.
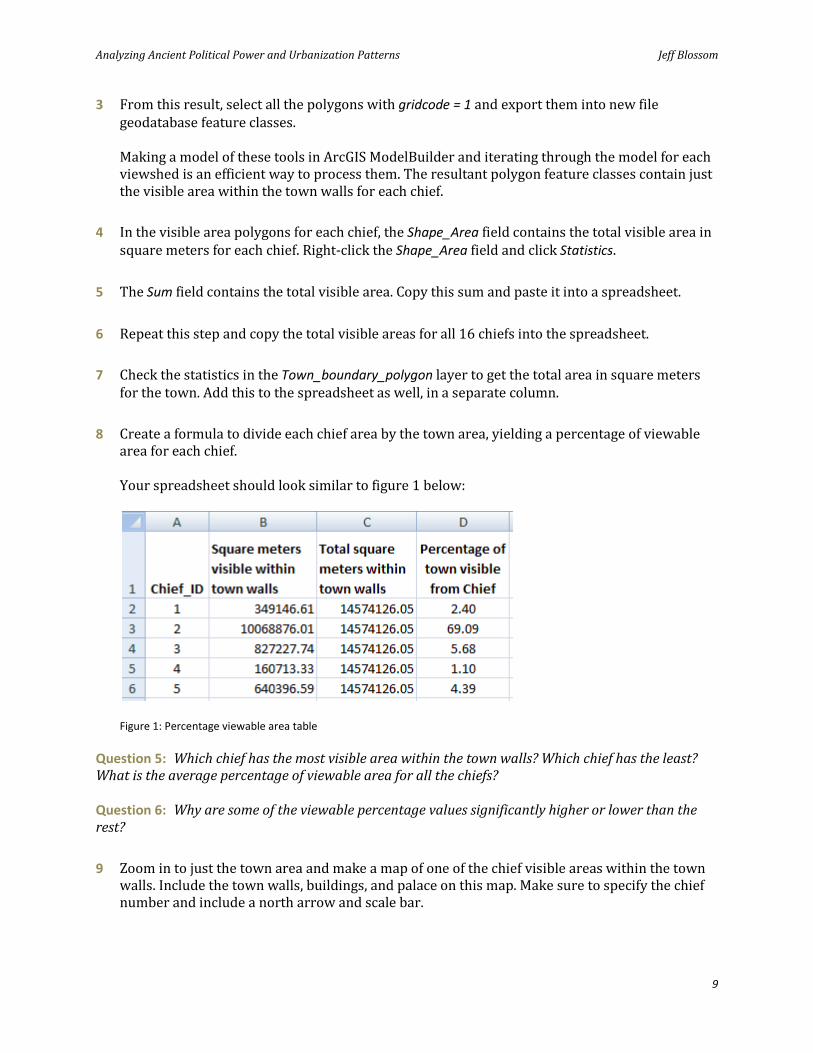
8 Create a formula to divide each chief area by the town area, yielding a percentage of viewable area for each chief.
Your spreadsheet should look similar to figure 1 below:
Figure 1: Percentage viewable area table
Question 5: Which chief has the most visible area within the town walls? Which chief has the least? What is the average percentage of viewable area for all the chiefs?
Question 6: Why are some of the viewable percentage values significantly higher or lower than the rest?
9 Zoom in to just the town area and make a map of one of the chief visible areas within the town walls. Include the town walls, buildings, and palace on this map. Make sure to specify the chief number and include a north arrow and scale bar.
Analyzing Ancient Political Power and Urbanization Patterns Jeff Blossom
10
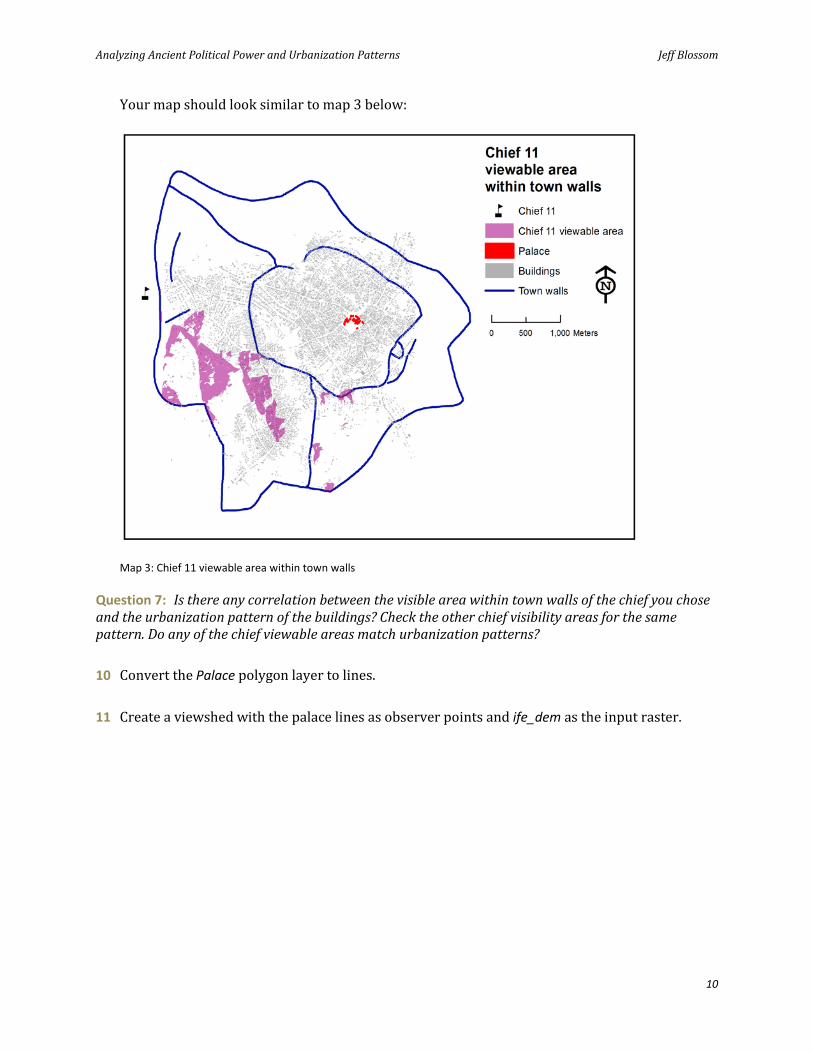
Your map should look similar to map 3 below:
Map 3: Chief 11 viewable area within town walls
Question 7: Is there any correlation between the visible area within town walls of the chief you chose and the urbanization pattern of the buildings? Check the other chief visibility areas for the same pattern. Do any of the chief viewable areas match urbanization patterns?
10 Convert the Palace polygon layer to lines.
11 Create a viewshed with the palace lines as observer points and ife_dem as the input raster.
Analyzing Ancient Political Power and Urbanization Patterns Jeff Blossom
11
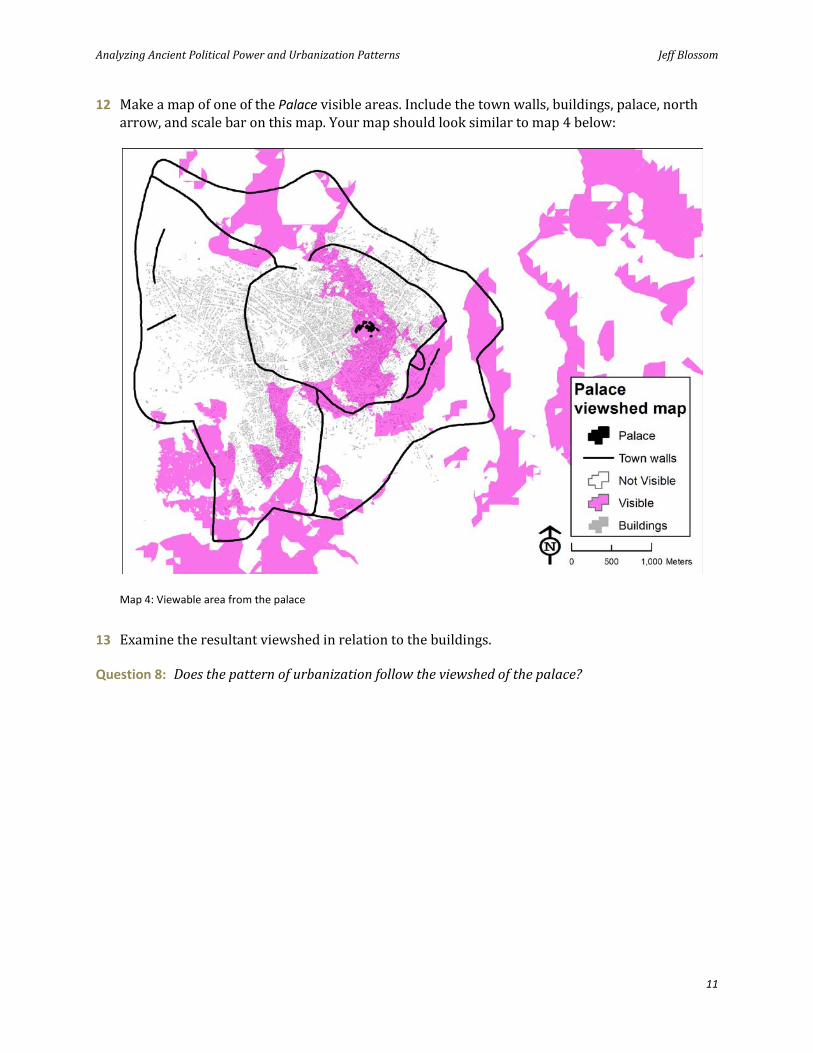
12 Make a map of one of the Palace visible areas. Include the town walls, buildings, palace, north arrow, and scale bar on this map. Your map should look similar to map 4 below:
Map 4: Viewable area from the palace
13 Examine the resultant viewshed in relation to the buildings.
Question 8: Does the pattern of urbanization follow the viewshed of the palace?
Analyzing Ancient Political Power and Urbanization Patterns Jeff Blossom
12
Submit your work
Submit the following:
Map 1: Ife contour map Map 2: Total viewshed map for one chief Map 3: Visible area within town walls for one chief Map 4: Visible area from the palace Spreadsheet 1: Chief power ranking table with percentage of viewable area for each chief Answers to questions 1–8
Credits
Data
Ife viewsheds courtesy of professor Suzanne P. Blier, Allen Whitehill Clowes Professor of Fine Art and professor of African and African American studies, Harvard University.
The Ife dataset has been compiled by Blier and her research team over the past several years. Blier is very much a supporter of using geographic information to support research and education, and her generous allowance of the use of the Ife dataset in this lab is genuinely appreciated.

Analyzing Ancient Political Power and Urbanization Patterns Jeff Blossom
13
Instructor resources
Context for the lab
This SpatiaLAB is written primarily for undergraduates studying history or geography.
This lab shows how to use modern-day geographic information to analyze historic phenomena. It is intended to promote thinking about how geographic data and software can be used to reconstruct models of past environments and then use these models to perform analysis.
Instructors may engage students to discuss the limitations of using the modeling techniques in this lab, how results might be misinterpreted, and how these viewsheds can be compared against actual conditions on the ground.
Using a spatial approach, instructors may find GIS to be one of the most useful tools for exploring historic spatial data, data analysis, and mapping.
This lab uses elevation as well as point, line, and polygon boundary and locational data.
Students are asked to answer eight questions, perform GIS analyses, and make four maps and one data table.
Analysis and visualization tools
ArcGIS 9 or 10 with the Spatial Analyst extension is required to complete this lab.
Answers to questions
Question 1: What coordinate system are these data layers in, and what is the linear unit of this coordinate system?
Answer: The coordinate system is WGS_1984 UTM Zone 31N, and the unit is meters.
Question 2: What is the geographic footprint of ife_dem in terms of kilometers wide by kilometers long? Express your answer in the format of "distance north to south" and "distance west to east."
Answer: North to south, it is approximately 8.8 kilometers. West to east, it is approximately 11.5 kilometers.
Analyzing Ancient Political Power and Urbanization Patterns Jeff Blossom
14
Question 3: What is the topography like in Ife and the surrounding area? Describe the topography both inside and outside the town walls.
Answer: Within the town walls, the undulating topography is characterized by many small ridges and valleys. The elevation ranges between 820 and 940 meters within the town walls. Outside the town walls, the topography is of a similar undulating quality. Elevations consistently rise to a peak above 2,000 m in the northeastern portion of the DEM.
Question 4: Are there any patterns evident between the topography and the viewable area when considering the observer point (chief location)?
Answer: The answers may vary depending on the specific chief map each student chooses to make for map 2. Overall, the answer should be yes—the high points are visible from the chief residence location, and the low areas and valleys are not visible. Generally speaking, in terms of comparing the topography, high areas are visible and low areas are not.
Question 5: Which chief has the most visible area within the town walls? Which chief has the least? What is the average percentage of viewable area for all the chiefs?
Answer: Chief 2 has the most viewable area, and chief 4 has the least viewable area. The average percentage of viewable area is 11.63 percent.
Question 6: Why are some of the viewable percentage values significantly higher or lower than the rest?
Answer: Chiefs with high viewable percentage values are located in local high areas, away from larger mountains that may block the view. If the chief is located in a valley, or on the lower slopes of a steep mountain, the valley walls or mountain will block the view, restricting the viewable area.
Question 7: Is there any correlation between the visible area within town walls of the chief you chose and the urbanization pattern of the buildings? Check the other chief visibility areas for the same pattern. Do any of the chief viewable areas match urbanization patterns?
Answer: There is no direct correlation, or overlap, of a single chief and the urbanized area in Ife. None of the chief viewsheds completely covers the urbanized area—in fact, most of them cover a small percentage of it. The viewable areas for chiefs 1, 9, and 14 almost exclusively match areas that have buildings on them. The viewable areas for chiefs 5, 12, 13, and 15 exhibit very little overlap with built areas. Chief 2 has by far the most viewable area, but it is a mix of built and open areas.
Question 8: Does the pattern of urbanization follow the viewshed of the palace?
Answer: Using visual inspection, it looks like about 20 to 25 percent of the total urbanized area is visible from the palace. There is a small ridge just to the west of the palace that blocks the view of much of the city.
Overall thoughts: The undulating terrain of Ife makes it difficult to find single locations that have views of much of the city. The slight ups and downs in the terrain effectively hide various portions of the city and prevent one location from seeing all, or even most, of the buildings within the town walls. In terms of line of sight enabling one chief's clan to have more power than another, it could
Analyzing Ancient Political Power and Urbanization Patterns Jeff Blossom
15
be argued that chief 2 has the most power by virtue of having visibility of over 60 percent of the area within the town walls, while no other chief has more than 20 percent. However, this power might be offset by the distance between the town and chief 2, who is on a distant mountainside. This yields a further question that could be explored with the use of GIS: Does proximity to the town center have an influence on political power?
References
Foucault, Michel. 1984. Power: Essential Foucault 3. Berkeley, CA: University Press Books.
Metropolitan Museum of Art. 2000. "Ife (from ca. 350 B.C.)." In Heilbrunn Timeline of Art History. New York: Metropolitan Museum of Art. http://www.metmuseum.org/toah/hd/ife/hd_ife.htm (accessed September 28, 2011).
Wikipedia, s. v. "Ife." http://en.wikipedia.org/wiki/Ife (accessed September 28, 2011).
Data information
The Ife dataset contains the Ife DEM and Chiefs, Palace, Town_boundary_polygon, and Town_walls shapefiles.
Data sources
Ife DEM, Chiefs, Palace, Town_boundary_polygon, and Town_walls: Courtesy of professor Suzanne P. Blier, Allen Whitehill Clowes Professor of Fine Art and professor of African and African American studies, Harvard University.
The Ife dataset has been compiled by Blier and her research team over the past several years. Blier is very much a supporter of using geographic information to support research and education, and her generous allowance of the use of the Ife dataset in this lab is genuinely appreciated.