analyze large quantities of measurement data analyze large quantities of measurement data ... the...
TRANSCRIPT
1
Success Story
October 2013
Analyze Large Quantities of Measurement Data Rationally and Flexibly
The development of automatic transmissions at Daimler began in
the year 1960 with a 4-speed transmission, which would be consid-
ered a rather simple engineering design by today’s standards. The
rapid advancement of technological development is attributable to
a wide variety of new requirements such as increased comfort
needs, larger gear spreads, lower fuel consumption, more powerful
engines, additional gears, etc. For example, the drive-off element
was changed, planetary gears and torque converters were added,
and in 1995 the first version with electro-hydraulic transmission
control was launched.
The 7G-Tronic Plus automatic transmission represents a pinnacle
of this development history. Designed in 2010, the 7G-Tronic Plus
can handle torques of up to 1000 Nm and can be implemented in a
broad range of vehicles: from the smallest rear-wheel drive vehicle
of the C-class with a 4-cylinder engine to the high-performance
models of AMG. The transmission is also used in the small variant of
the Sprinter van. It attained a successful combination of the seem-
ingly contradictory requirements of optimized fuel economy, driv-
ing fun and ride comfort, and in 2011 the transmission won the
internal Daimler Environmental Leadership Award.
Automatic Transmission Requires Many Parameter Optimizations
The extremely broad implementation range in the different models
requires optimal calibration of ECU parameters to achieve the
desired driving behavior. The path to product maturity was accom-
panied by numerous test bench and in-vehicle durability runs.
Measurement data accumulating from daily testing is saved on
servers, where it is available to development and calibration engi-
neers. The challenge in evaluating and analyzing these large quan-
tities of measurement data is to identify those data sets in which
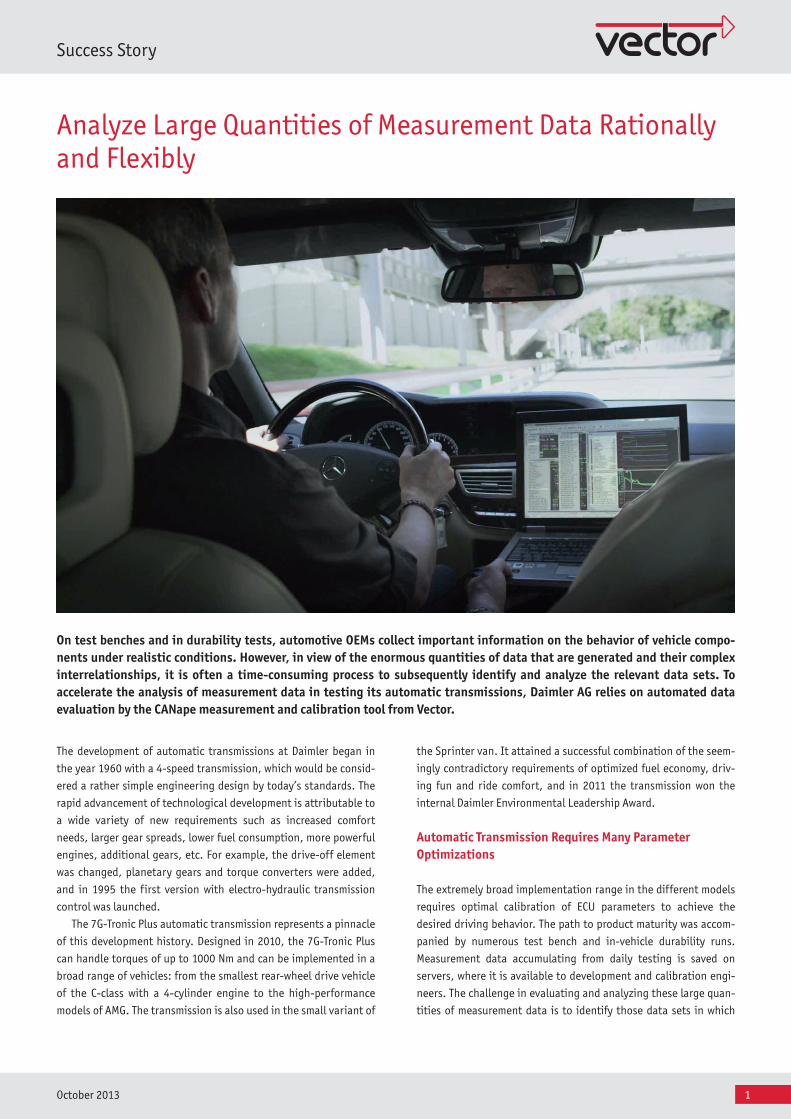
On test benches and in durability tests, automotive OEMs collect important information on the behavior of vehicle compo-nents under realistic conditions. However, in view of the enormous quantities of data that are generated and their complex interrelationships, it is often a time-consuming process to subsequently identify and analyze the relevant data sets. To accelerate the analysis of measurement data in testing its automatic transmissions, Daimler AG relies on automated data evaluation by the CANape measurement and calibration tool from Vector.
2
Success Story
October 2013
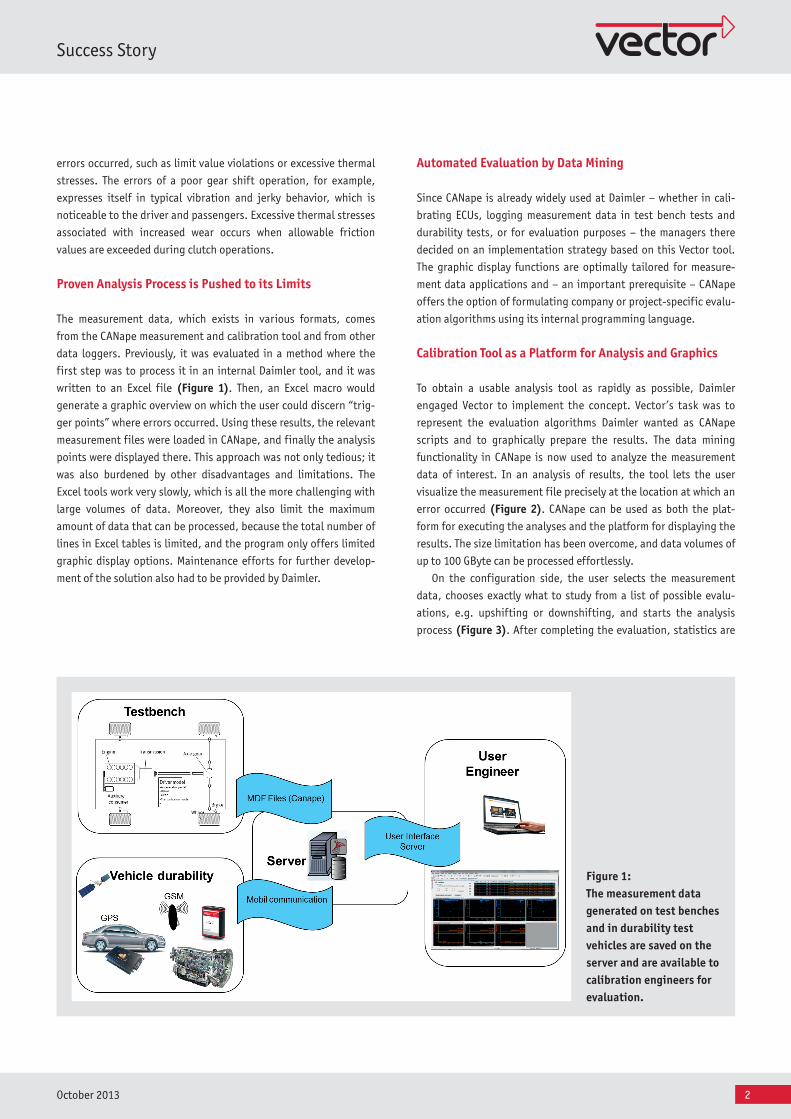
Figure 1: The measurement data generated on test benches and in durability test vehicles are saved on the server and are available to calibration engineers for evaluation.
errors occurred, such as limit value violations or excessive thermal
stresses. The errors of a poor gear shift operation, for example,
expresses itself in typical vibration and jerky behavior, which is
noticeable to the driver and passengers. Excessive thermal stresses
associated with increased wear occurs when allowable friction
values are exceeded during clutch operations.
Proven Analysis Process is Pushed to its Limits
The measurement data, which exists in various formats, comes
from the CANape measurement and calibration tool and from other
data loggers. Previously, it was evaluated in a method where the
first step was to process it in an internal Daimler tool, and it was
written to an Excel file (Figure 1). Then, an Excel macro would
generate a graphic overview on which the user could discern “trig-
ger points” where errors occurred. Using these results, the relevant
measurement files were loaded in CANape, and finally the analysis
points were displayed there. This approach was not only tedious; it
was also burdened by other disadvantages and limitations. The
Excel tools work very slowly, which is all the more challenging with
large volumes of data. Moreover, they also limit the maximum
amount of data that can be processed, because the total number of
lines in Excel tables is limited, and the program only offers limited
graphic display options. Maintenance efforts for further develop-
ment of the solution also had to be provided by Daimler.
Automated Evaluation by Data Mining
Since CANape is already widely used at Daimler – whether in cali-
brating ECUs, logging measurement data in test bench tests and
durability tests, or for evaluation purposes – the managers there
decided on an implementation strategy based on this Vector tool.
The graphic display functions are optimally tailored for measure-
ment data applications and – an important prerequisite – CANape
offers the option of formulating company or project-specific evalu-
ation algorithms using its internal programming language.
Calibration Tool as a Platform for Analysis and Graphics
To obtain a usable analysis tool as rapidly as possible, Daimler
engaged Vector to implement the concept. Vector’s task was to
represent the evaluation algorithms Daimler wanted as CANape
scripts and to graphically prepare the results. The data mining
functionality in CANape is now used to analyze the measurement
data of interest. In an analysis of results, the tool lets the user
visualize the measurement file precisely at the location at which an
error occurred (Figure 2). CANape can be used as both the plat-
form for executing the analyses and the platform for displaying the
results. The size limitation has been overcome, and data volumes of
up to 100 GByte can be processed effortlessly.
On the configuration side, the user selects the measurement
data, chooses exactly what to study from a list of possible evalu-
ations, e.g. upshifting or downshifting, and starts the analysis
process (Figure 3). After completing the evaluation, statistics are
3
Success Story
October 2013
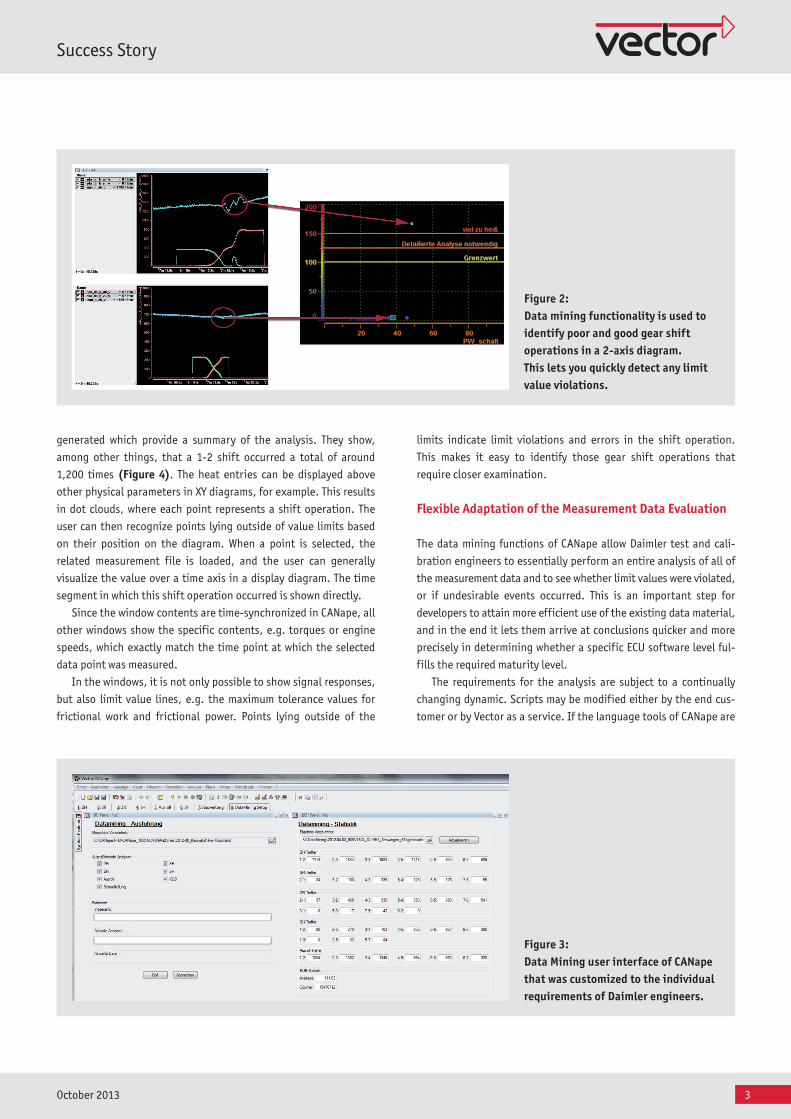
Fig ure 2: Data mining functionality is used to identify poor and good gear shift operations in a 2-axis diagram. This lets you quickly detect any limit value violations.
Fig ure 3: Data Mining user interface of CANape that was customized to the individual requirements of Daimler engineers.
generated which provide a summary of the analysis. They show,
among other things, that a 1-2 shift occurred a total of around
1,200 times (Figure 4). The heat entries can be displayed above
other physical parameters in XY diagrams, for example. This results
in dot clouds, where each point represents a shift operation. The
user can then recognize points lying outside of value limits based
on their position on the diagram. When a point is selected, the
related measurement file is loaded, and the user can generally
visualize the value over a time axis in a display diagram. The time
segment in which this shift operation occurred is shown directly.
Since the window contents are time-synchronized in CANape, all
other windows show the specific contents, e.g. torques or engine
speeds, which exactly match the time point at which the selected
data point was measured.
In the windows, it is not only possible to show signal responses,
but also limit value lines, e.g. the maximum tolerance values for
frictional work and frictional power. Points lying outside of the
limits indicate limit violations and errors in the shift operation.
This makes it easy to identify those gear shift operations that
require closer examination.
Flexible Adaptation of the Measurement Data Evaluation
The data mining functions of CANape allow Daimler test and cali-
bration engineers to essentially perform an entire analysis of all of
the measurement data and to see whether limit values were violated,
or if undesirable events occurred. This is an important step for
developers to attain more efficient use of the existing data material,
and in the end it lets them arrive at conclusions quicker and more
precisely in determining whether a specific ECU software level ful-
fills the required maturity level.
The requirements for the analysis are subject to a continually
changing dynamic. Scripts may be modified either by the end cus-
tomer or by Vector as a service. If the language tools of CANape are
4
Success Story
October 2013
Erhan Tepe graduated with a major in Information and Communications Technology at the Polytech-nic College of Reutlingen. After a two-year position as a programmer at a supplier, he obtained a Master’s degree at the European School of Business. In 2007, Mr. Tepe went to work for Daimler AG, where he is employed as a test engineer in automatic transmission testing. His work area involves test stand and vehicle testing in the validation of automatic transmissions.
Andreas Patzer graduated with a major in Electrical Engineer-ing at the Technical University of Karlsruhe. Focal points of his studies were measurement and control engineering as well as information and industrial engineering. In 2003, he moved to Vector Informatik GmbH in Stuttgart, where he is team leader for Customer Relations and Services in the Measurement & Calibration product line.
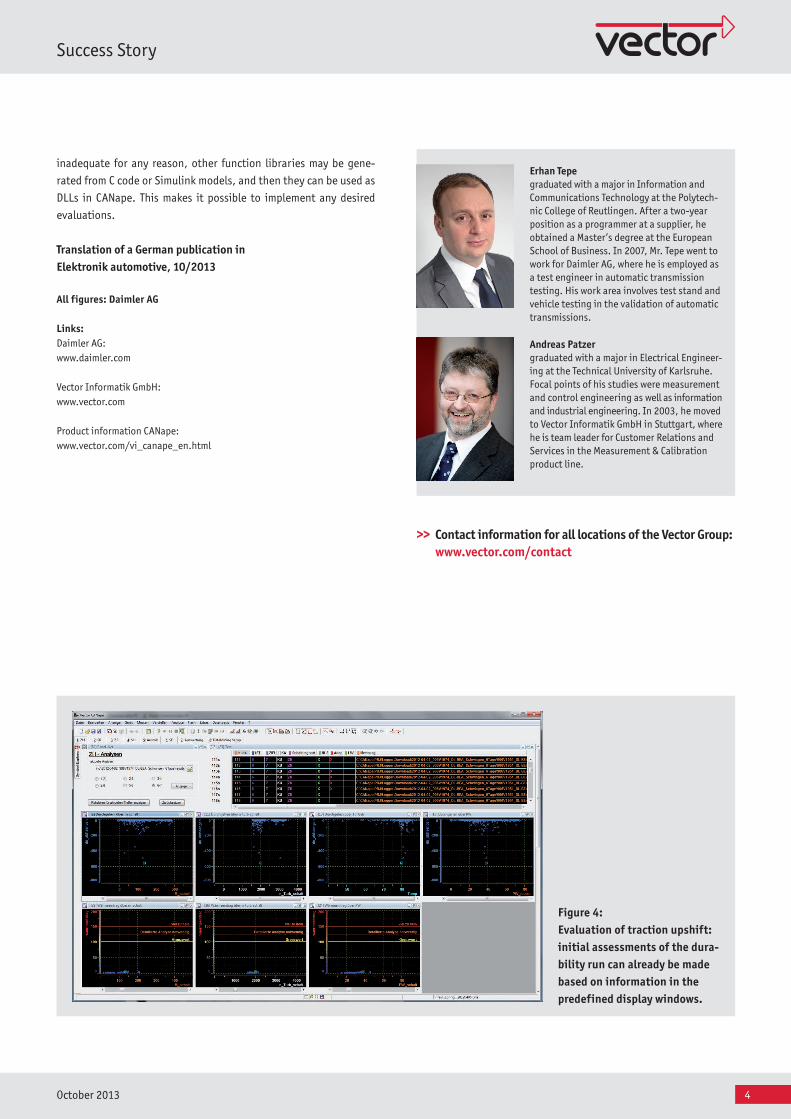
Fig ure 4: Evaluation of traction upshift: initial assessments of the dura-bility run can already be made based on information in the predefined display windows.
inadequate for any reason, other function libraries may be gene-
rated from C code or Simulink models, and then they can be used as
DLLs in CANape. This makes it possible to implement any desired
evaluations.
Translation of a German publication in Elektronik automotive, 10/2013
All figures: Daimler AG
Links:Daimler AG:www.daimler.com
Vector Informatik GmbH:www.vector.com
Product information CANape:www.vector.com/vi_canape_en.html
>> Contact information for all locations of the Vector Group: www.vector.com/contact