analytical tool for modeling the cyclic behaviour...
TRANSCRIPT

ANALYTICAL TOOL FOR MODELING THE CYCLIC BEHAVIOUR OF EXTENDED END-PLATE
CONNECTIONS
Author: Mohd Fazaulnizam Bin Shamsudin
Supervisor: Professor Carlos A. Silva Rebelo
University: University of Coimbra
University: University of Coimbra
Date: 13.01.2014

MOHD FAZAULNIZAM BIN SHAMSUDIN ii
ACKNOWLEDGEMENTS
I would like to express my sincere appreciation and gratitude to the supervisor of this
thesis, Prof. Carlos Rebelo for guiding me in doing this work. His valuable advices,
suggestions, patience and comments are highly appreciated. I am highly indebted to his for his
valuable thoughts and contributions towards the development of my thesis and also for
providing me with an ample knowledge about seismic design.
Special thanks are also extended to my colleague, Hugo Augusto who is supporting me
throughout the course of this research. His generosity and always there to help me will not be
forgotten. Also, his invaluable suggestions and constructive comments encouraged me too
numerous to count.
The help of Prof. Luís Simões da Silva who is one of the SUSCOS programme coordinator
really in way to help me in completing this project. I wish to take this opportunity to forward
my utmost appreciation to all the lecturers in the Department of Civil Engineering in Coimbra
University, Czech Technical University and all of friends in this programme for their
contributions throughout my study in the university. I was very fortunate to share part of the
journey in my life particularly in Europe with these incredible people.
Dedicating this dissertation to my family for their endless love, support and encouragement
over the past years. Huge thanks for understanding my passion and interest to push myself
beyond the limit. Finally, deepest gratefulness to God for He always directs my path to
conquer the quests to success in this momentary life.
MOHD FAZAULNIZAM BIN SHAMSUDIN iii
RESUMO
Neste trabalho é apresentada uma investigação computacional sobre estudar o modelo de
histerese e o comportamento cíclico de ligação viga-pilar . O modelo da ligação estudada e os
resultados do comportamento cíclico correspondem aos obtidos em testes experimentais
descritos na bibliografia. Foi utilizado o software SeismoStruct para modelar a ligação e foi
desenvolvida uma folha de cálculo para gerar as curvas de histerese diretamente a partir do
Modelo Modificado de Richard- Abbott com trinta parâmetros. Foi usado o protocolo ECCS
para gerar as historias de carga. Os parâmetros do modelo foram alterados para observar a
sensibilidade em termos de resistência, rigidez e capacidade de dissipação de energia. Os
resultados experimentais e computacionais relativos às curvas de histerese momento-rotação
foram comparados com os resultados do modelo analítico implementado nume folha de
cálculo.

MOHD FAZAULNIZAM BIN SHAMSUDIN iv
ABSTRACT
A computational investigation was conducted to study the hysteretic model and cyclic
behaviour of beam to column connection. The connection model was taken from
experimental test setup and data was used in the software SeismoStruct and in numerical tool
spreadsheet to perform the hysteretic curves. The beam to column joints were analysed
according to Modified Richard-Abbott Model with thirty model parameters particularly well
determined for cyclic loads which covered lower and upper bound curves. ECCS cyclic
loading protocol which correlates with displacements as a common practice was used to
generate time-history load curves. The model parameters were altered and applied on the joint
to observe the sensitivity of parameters in term of strength, stiffness and energy dissipation
capacity. Experimental and computational results of moment-rotation curves were compared
with analytical approach. The sensitivity of the results to certain coefficients was studied to
measure the differences of resulted value and numerical implementation in order to detect
errors and achieve the same result.

MOHD FAZAULNIZAM BIN SHAMSUDIN v
TABLE OF CONTENTS
CHAPTER I: INTRODUCTION AND LITERATURE REVIEW........................................ 12 1.1 Introduction ............................................................................................................... 12 1.2 Previous Research on Hysteretic Model with the Cyclic Response of Steel Joints ...... 14 1.3 End-Plate Beam to Column Connections ................................................................... 19 1.4 Component Method ................................................................................................... 22 1.4.1Introduction ....................................................................................................... 22 1.4.2Static Loading ................................................................................................... 23 1.4.2.1Characteristics Behaviour of Connection Parameters ................................... 23 1.4.2.2Design Moment-Rotation Characteristic ...................................................... 24 1.4.3Cyclic Loading .................................................................................................. 27 1.4.3.1Loading Protocols ....................................................................................... 27 1.5 Objective and Scope .................................................................................................. 32
Chapter II: DOUBLE EXTENDED END-PLATE CONNECTION ..................................... 33 2.1 Introduction ............................................................................................................... 33 2.2 Modified Richard-Abbott Model ............................................................................... 34 2.3 Cyclic Modeling of Dissipative and Non- Dissipative Components ........................... 36 2.3.1Introduction ....................................................................................................... 36 2.3.2Column Web Panel ............................................................................................ 37 2.3.3End Plate, Column Flange and Flange Cleat ...................................................... 40
CHAPTER III: ANALYSIS OF COMPUTATIONAL RESULTS ....................................... 45 3.1 Introduction ............................................................................................................... 45 3.2 Mechanical Model for Bolted Beam to Column Joints ............................................... 46 3.3 Double Extended End-Plate Bolted Connection ......................................................... 48 3.3.1Model Analysis.................................................................................................. 48 3.3.2Comparison of Experimental and SeismoStruct Analysis ................................... 54 3.3.3Numerical Study Based on Modified Richard-Abbott Model ............................. 56 3.3.4Comparison of SeismoStruct Analysis and Analytical Implementation of Model 60 3.3.5Parameter Sensitivity by Applying Solver Approach .......................................... 64

MOHD FAZAULNIZAM BIN SHAMSUDIN vi
CHAPTER IV: CONCLUSIONS AND RECOMMENDATIONS........................................ 67 4.1 Conclusions ............................................................................................................... 67 4.2 Recommendations ..................................................................................................... 68
REFERENCES .................................................................................................................... 69 APPENDIX A...................................................................................................................... 72

MOHD FAZAULNIZAM BIN SHAMSUDIN vii
LIST OF FIGURES
Figure 1.1 Examples of Extended End-Plate Connection.................................................. 20
Figure 1.2 Examples of Flush End-Plate Connection ....................................................... 20 Figure 1.3 Monotonic and cyclic loading ......................................................................... 22
Figure 1.4 Influence of Bolted End-Plate Steel Joints....................................................... 25 Figure 1.5 Model Orientation of Moment Resistance ....................................................... 25
Figure 1.6 Design Moment Rotation Curve ...................................................................... 26 Figure 1.7 Loading Protocol specified in EN 15129 ......................................................... 27
Figure 1.8 Loading Protocol specified in ECCS ............................................................... 29 Figure 1.9 SAC Loading Protocol .................................................................................... 30
Figure 1.10 ATC-24 Loading Protocol ............................................................................... 31
Figure 2.1 Double Extended End-Plate Connection Topology…………………………… 33
Figure 2.2 Richard-Abbott Model for Lower and Upper Bound…………………………. 35 Figure 2.3 Panel Zone…………………………………………………………………….. 37
Figure 2.4 Couple Moment Transfer……………………………………………………… 38 Figure 2.5 Comparison between Higher and Lower Post Limit Stiffness………………… 40 Figure 2.6 Failure Modes for a Bolted End-Plate Connections (Eurocode 3)……………. 41
Figure 2.7 Loading Branch with Pinching………………………………………………... 42 Figure 2.8 Pinching Effects on the Joint.............................................................................. 44
Figure 3.1 Load Scheme on Experimental Test (Nogueiro, P., 2009)……………………. 47 Figure 3.2 Mechanical Model for Bolted Extended End-Plate Connections (M. Latour, V.
Piluso & G. Rizzano, 2011)……………………………………………………47 Figure 3.3 Geometry of Model Scheme in Seismostruct…………………………………. 49
Figure 3.4 Geometry of Joint Topology…………………………………………………... 49 Figure 3.5 Section Discretization Pattern…………………………………………………. 50
Figure 3.6 Time-History Load Curve……………………………………………………... 53 Figure 3.7 Experimental Moment-Rotation Curve……………………………………….. 54
Figure 3.8 Numerical Moment-Rotation Curve…………………………………………... 55 Figure 3.9 Comparison between Experimental and Numerical Moment-Rotation Curve 55
Figure 3.10 Intial Stiffness Numerical Moment-Rotation Curve.......................................... 56 Figure 3.11 Lower and Upper Numerical Moment-Rotation Curve......................................58
Figure 3.12 Complete Numerical Moment-Rotation Curves.................................................59 Figure 3.13 Comparison between Analytical and Numerical Initial Curve...........................60
Figure 3.14 Comparison between Analytical and Numerical of Lower and Upper Curve…62

MOHD FAZAULNIZAM BIN SHAMSUDIN viii
Figure 3.15 Complete comparison between analytical and numerical curve..................... 63
Figure 3.16 Initial Stiffness Solver Moment-Rotation Curve.............................................64 Figure 3.17 Comparison of Initial Stiffness by Analytical, Numerical and Solver Moment-
Rotation Curves................................................................................................ 65 Figure 3.18 Comparison of Loading and Unloading by Analytical, Numerical and Solver
Moment-Rotation Curves................................................................................. 66

MOHD FAZAULNIZAM BIN SHAMSUDIN ix
LIST OF TABLES
Table 1.1 SAC Loading protocol .................................................................................... 29
Table 2.1 Model Parameters for Column Web Panel in Shear…………………………... 39 Table 2.2 Example of Model Parameters for Column Web Panel in Shear……………… 39
Table 2.3 Model Parameters for End-Plate in Bending...................................................... 42 Table 2.4 Example of Model Parameters for End-Plate in Bending................................... 43
Table 3.1 Material Properties Beam and Column………………………………………... 48 Table 3.2 Discretization parameters……………………………………………………… 50
Table 3.3 Model parameters for Modified Richard-Abbott model………………………. 51 Table 3.4 Model Parameters for Joints J1-3………………………………………………52
Table 3.5 Initial Stiffness Numerical Data.......................................................................... 57 Table 3.6 Lower and Upper Numerical Data...................................................................... 58
Table 3.7 Complete Numerical Curves Data...................................................................... 59 Table 3.8 Comparison between Analytical and Numerical Initial Stiffness Data……….. 61
Table 3.9 Comparison between Analytical and Numerical of Lower and Upper Data….. 62 Table 3.10 Complete Comparison between Analytical and Numerical Data……………... 63 Table 3.11 Comparison of Initial Stiffness by Analytical, Numerical and Solver Data....... 65
Table 3.12 Comparison of Loading and Unloading by Analytical, Numerical and Solver
Data……………………………………………………………………………. 66

MOHD FAZAULNIZAM BIN SHAMSUDIN x
SYMBOLS
Ka – Ascending Initial Stiffness
Ma – Descending Strength
Kpa – Ascending Post Limit Stiffness
Kd – Descending Initial Stiffness
Md – Descending Strength
Kpd – Descending Post Limit Stiffness
iMa – Strength Damage Rate

MOHD FAZAULNIZAM BIN SHAMSUDIN 11
ABBREVIATIONS
EC3 – Eurocode 1993-1-1:2005
MRF – Moment Resisting Frame
HSFG – High Strength Friction Grip
AISC – American Institute of Steel Construction
MATLAB – Matrix Laboratory
FEM – Finite Element Method
HSS – Hollow Structural Sections
ECCS – European Convention for Constructional Steelwork

INTRODUCTION AND LITERATURE REVIEW
MOHD FAZAULNIZAM BIN SHAMSUDIN 12
CHAPTER I: INTRODUCTION AND LITERATURE REVIEW
1.1 Introduction
In the beam-column connections, bolted steel connections in the form of T-stubs and
end-plate connections are designed as assemblages of components such as bolts, plates, and
welds. Because of the possibility in several variety of connection joint configurations, many
geometrical discontinuities and associated stress concentrations triggered on bolted
connections in beam to column structure. Also, presence of frictional forces that lead to non-
linear phenomena such as slip and the need to model uplift and contact forces that can lead to
prying action, then these connections exhibit an overall nonlinear structural behaviour
commonly classified as “semi-rigid”.
Eurocode 3 [1] contains design rules for determining the properties of several types of
connections including the bolted flush end-plate. Beam-to-column joints are often subjected
to a combination of bending and axial forces. Part 1-8 of Eurocode 3 [1] classifies joints by
their stiffness (nominally pinned, rigid or semi-rigid), or by their strength (nominally pinned,
full-strength or partial-strength). In relation to stiffness, a nominally pinned joint will allow
rotation, transmitting forces across the joint without developing significant moments. A rigid
joint, however, is stiff enough for the analysis to be based on full continuity, and a semi-rigid
joint lies between these two. In terms of strength, a nominally pinned joint is defined as for
stiffness while a full-strength joint has a moment resistance greater than that of the connected
members. The partial-strength joint does develop moment, but the moment resistance is less
than that of the connected members. It is especially advantageous for partial-strength and
semi-rigid joints to develop sufficient rotation capacity before loss of moment resistance.
Various researches on the behaviour and design of steel connections under seismic loads have
been conducted over the past several years. Although moment resisting frames (MRF) are
commonly used structural system for seismic-resistant buildings, several important aspects of
their behaviour under real earthquake excitation are not well understood. One of these issues
that need to be further studied is the seismic performance of beam to column joints. During
severe earthquakes, joints can undergo severe inelastic deformations affecting the strength,
stiffness and inelastic action distribution throughout the frames.

INTRODUCTION AND LITERATURE REVIEW
MOHD FAZAULNIZAM BIN SHAMSUDIN 13
For seismic design purposes, fully welded connections are traditionally used in moment
resisting frames. More economical types of bolted connections were not utilized mainly due
to their relative flexibility and difficulty to achieve full resistance as compared to fully welded
forms, which may lead to large deformations under the same forces. Whereas this treatment
applies for static conditions, the response under dynamic loading may be substantially
different. Due to the period elongation of the frame as well as the higher energy dissipation in
the connection, semi-rigid frames may attract lower loads and possess higher damping.
Consequently, the displacements associated with bolted frames may be lower than that
experienced in their welded counterparts. (A. S. Elnashai, 1998)
Recently pertaining on seismic design concept levels of structural response, behaviour and
safety are applied. The general and fundamental idea is that small to medium level of
earthquakes should not cause significant damages in the structure. However, the collapse
under extreme earthquakes should be avoided and certain structural damages are acceptable.
Practically, the structure should be able to sustain elastic actions under smaller case and
inelastic response while sustain severe seismic actions. In addition, an inelastic response
should be controlled in order to prevent structural collapse.

INTRODUCTION AND LITERATURE REVIEW
MOHD FAZAULNIZAM BIN SHAMSUDIN 14
1.2 Previous Research on Hysteretic Model with the Cyclic Response of Steel Joints
P. Nogueiro, L. Simões da Silva, R. Bento (2003) analysed an influence of joint
slippage on the cyclic response of steel frames. The purpose of this paper is to discuss the
various hysteretic models available to model steel joints under cyclic loading, describing a
numerical models implementation with and without slippage, comparing distinct joints under
cyclic response with and without slippage as well as assessing the structure on global
behaviour impetus by influence of slippage. The Richard-Abbott model which is based on a
formula in 1975 was used to reproduce the elastic-plastic behaviour of several materials and
was initially used to simulate the static monotonic response of joints and then applied to
cyclic response. The modified model proposed by Mazzolani (De Martino et al., 1984;
Mazzolani, 1988), which is based on the Ramberg-Osgood model also used which allows the
simulation of hysteretic curves with slippage. On the numerical implementation and
experimental calibration, it was observed that the controlling variable is rotation, φ for the
Richard-Abbott model and bending moment, M for the modified Mazzolani model. It is noted
that the edge beam-column connection exhibits more significant slippage while continuous
beam barely shows pinching effect. Based on the case study of typical of a low-rise office
building, the response and influence of joint slippage and degradation on the cyclic behaviour
of steel frames was presented in this paper. They concluded that because of the unavailability
of a joint element with degradation and slippage in the global analysis, an indirect approach
was used, using an equivalent bi-linear spring.
Pedro Nogueiro, Luís Simões da Silva, Rita Bento and Rui Simões (2006) conducted a series
of experimental tests to determine the hysteretic model with pinching. The cyclic response of
generic steel joints were implemented in computer with an adaptation of the model in a spring
element within SeismoStruct. Extended end-plate connection tests were performed to
investigate the influence of the loading history on the joint performance as well as setting the
key parameters which enabling a full description of connection behaviour including energy
dissipation capability. The tests were incorporated in software SeismoStruct and showing a
very good agreement with the experimental results, even when using different loading
strategies. They concluded that 15 parameters in ascending and 15 parameters in descending
are the same. The parameters that results from static monotonic behaviour (Ka, Ma, Kpa, Kd,
Md, Kpd) can nowadays be obtained with sufficient accuracy from the application of the
component method (EC3-1-8, 2005) for the range of joint typologies addressed in this paper.
For joints without pinching and stiffness deterioration, such as an extended end-plate with
stiffened column web in the tensile and compressive areas, only 6 parameters are needed.
From these parameters, the first three can be obtained using the component method and the
fourth is normally 1 or 2. The last one it is always the same, equal to 0.1 rad. Finally, the

INTRODUCTION AND LITERATURE REVIEW
MOHD FAZAULNIZAM BIN SHAMSUDIN 15
parameter related to the strength damage (iMa), can be established as an average value on the
basis of a sufficient number of tests.
G. Della Corte, G. De Matteis, R. Landolfo, F.M. Mazzolani (2001) performed experiments
regarding seismic analysis of moment-resisting (MR) steel frames based on refined hysteretic
models of connections. The analyses presented in this paper show that safety margins against
global collapse of the structure can be predicted only by considering more realistic hysteresis
behaviour, i.e. using mathematical models able to take account of strength degradation and
pinching phenomena. Moreover, it is shown that the design of conventional steel building
systems according to the European seismic code may lead to over-resistant structures, due to
the limitation on inter-storey drift angles for non-structural damage control under frequent
earthquakes. It is also noticed that this result is inevitable, owing to the indications provided
by Eurocode 8 in terms of both prescribed inter-storey drift limits and assumed base shear-
force demand under frequent earthquakes.
Several numerical analyses have been carried out and results shown throughout the current
paper. Two main conclusions can be drawn:
i) The elastic-perfectly-plastic hysteresis model is adequate in obtaining a reliable
prediction of deformation demand for (EC8) code-designed structures, and for
seismic intensities less than or equal to the one stipulated by the code for the
ultimate limit state check. In the relevant deformation range, variability of
deformation demand due to ground motion is largely dominant in comparison to
that related to the hysteresis model. However, safety at collapse for the frame as a
whole (dynamic instability) can only be predicted by adopting more refined
hysteresis models, able to take account of degradation phenomena.
ii) Design of steel structures according to EC8 leads to strongly over-resistant
structures, due to the limitation on inter-storey drift angles under frequent
earthquakes (serviceability requirement). When judging the effect of degradation
phenomena on the seismic performance of steel moment resisting frames, this
over-strengthening should be taken into account, since it reduces the impact of
degradation itself.
L. Mota, A. T. da Silva, C. Rebelo, L. Simões da Silva and L. de Lima (2010) expanded the
knowledge of modelling connections of moment resisting steel frames with the
implementation of seismic analysis. The modified Richard-Abbott constitutes a sophisticated
model and is used here to reproduce the cyclic behaviour of the steel joints. The main goal in
this paper was to determine the influence of stiffness degradation, strength degradation and
hardening effect of the joint under seismic behaviour of a three storey two bays moment

INTRODUCTION AND LITERATURE REVIEW
MOHD FAZAULNIZAM BIN SHAMSUDIN 16
resisting (MR) steel frame. They concluded that the maximum global displacements increases
for higher hardening effect and decreases for higher stiffness degradation and strength
degradation. The reason because for moment resisting frames the horizontal displacement is
usually the controlling design criterion in seismic design. On the other hand, that maximum
rotation in links is not very sensitive to stiffness degradation and strength degradation.
Cavidan YORGUN (2001) developed an evaluation of innovative extended end-plate moment
connections under cyclic loading. The comparison between standard end-plate connections
and innovative end endplate connections was performed using experimental results and design
methods. There was no deformation in the I-shaped element placed between the end plate and
the column flange and it remained elastic. Hysteretic loops for specimens exhibited stable
characteristics, but the specimens did not develop the same level ductility ratios. The primary
purpose of the testing process was to investigate the influence of end-plate thickness and gap
(filled in with I-shaped element, i.e. beam section) and to check this against design criteria
developed for monotonic loading. Predicted capacities obtained using the component method
coded in Eurocode 3 were compared to data obtained experimentally. The maximum moment
strengths of the connections were much greater than the strength predictions from the design
method of Eurocode 3. Finally, the design method used to predict connection strength was
shown to be conservative when compared with the experimental strength for the innovative
end-plate connections.
Mohsen Geramia, Hamid Saberia, Vahid Saberia and Amir Saedi Daryan (2010) presented the
findings of cyclic behaviour of bolted connections with different arrangement of bolts.
Following the discovery of earthquakes failures, numerous experimental and analytical
investigations were initiated to obtain a moment connection that will provide the required
combination of strength, stiffness, and ductility while resisting cracking. Therefore, various
types of connections such as end plate and T-stub bolted connections were suggested to be
used in design of moment resisting frames in areas of high seismic activity. In this study, the
cyclic behaviour of end plate and T-stub beam-to-column bolted connections is analysed and
compared for different arrangements of bolts using finite element analysis. The results of
numerical models showed a good agreement with the test data. One of the finding is the
probability of failure mode change in T-stub connection is higher than that of end plate
connection under cyclic loading due to the bolt arrangement change. Therefore, the end plate
connection is suggested for conditions where the imperfection in construction is probable.
Shemy S. Babu, S. Sreekumar (2012) conducted a study on the ductility of bolted beam-
column connections. In this paper the ductility and energy dissipation characteristics of semi
rigid bolted connections using double web angle with top and seat angles is discussed based
on experimental investigation. Non-linear analysis was also performed using finite element

INTRODUCTION AND LITERATURE REVIEW
MOHD FAZAULNIZAM BIN SHAMSUDIN 17
method to compare the results. The study revealed that ductile behaviour of beam-column
connection is improved by increasing the number of bolts on the top and seat angles and the
thickness of top and seat angles. The analytical results are in agreement with the experimental
results. Based on the experimental and analytical investigation conducted on bolted steel
beam-column joint, the following conclusions are drawn:
i) The use of top and seat angles improved the energy dissipation capacity. The
energy dissipation of the connection increases as the thickness of top and seat
angles and number of bolts increases.
ii) Increasing the number of bolts rather than increasing the diameter of bolt in the
connection with top and bottom seat angles improves ductility.
S.Aleksić and S.R. Živaljević (2008) presented a paper describing analysis of the dynamic
response of steel orthogonal frames with non-linear semi-rigid connections under the seismic
loads. Chen-Lui exponential curve was used for the mathematical modelling of the non-linear
beam-column connections. Direct integration of the equations of motion was performed with
the so-called α-procedure. The general numerical procedure was programmed in MATLAB
and used for numerical example presented in this paper. This paper is based on the usage of
the capacity design method in seismic designing. Namely, with the nonlinear behaviour of the
connections beam-column, the seismic forces are limited in the structure, in that way the
members of the structure are kept in the desirable (usually linear) range, while the largest part
of the seismic energy is spent in the hysteresis behaviour of the connections. In this way,
nonlinear beam-column connections present some kind of safety devices, consciously
designed bad points in the structure, which, including the necessary rotation capacity, make
the structure to move like a mechanism in limited case, during the formation of the plastic
hinges in the frame fixity, and while the elements of the complex structure are in the desirable
(linear) range of stresses. The conclusion is that the relation of the dynamic characteristics of
the structure in respect to the dynamic characteristics of the seismic loads has a key role
during the analysis of the seismic resistance of the structure.
Satish Kumar and Prasada Rao D. V. (2004) conducted a study in seismic qualification of
semi-rigid connections in steel frames. The results of cyclic test conducted on a semi-rigid
connection with rectangular hollow sections, consists of channel connectors welded to the
column and connected to the beam by HSFG bolts installed through a web opening were
presented. Several requirements were identified for semi-rigid connections to qualify for use
in seismic resisting frames. The tested connections were found to have adequate stiffness,
ultimate strength, ductility and energy dissipation capacity as per the requirements.

INTRODUCTION AND LITERATURE REVIEW
MOHD FAZAULNIZAM BIN SHAMSUDIN 18
John C. Ryan, Jr. (1999) conducted a research regarding the evaluation of extended end-plate
moment connections under seismic loading. In this paper, an experimental investigation was
conducted to study the extended end-plate moment connections subjected to cyclic loading.
The connections were designed using yield-line theory to predict end-plate yielding and the
modified Kennedy method to predict maximum bolt force calculations including prying
action. The inelastic rotation of connections was calculated and conclusions were drawn on
the compliance of these connections with current AISC specifications. They concluded that all
extended stiffened moment end-plate configurations demonstrated the ability to incur
sufficient inelastic rotation to be used in a moment frame designed for seismic loading. As a
result of observing the weld failures of these connections, it is recommended that full-
penetration welds be used for beam to end-plate welds, beam-to-stiffener welds and stiffener-
to-end-plate welds. Finally, the design methods used to predict connection strength are shown
to be conservative when compared with the experimental strengths for the four bolt extended
stiffened moment end-plate connections.
Mark R. Boorse (1999) performed experiments on evaluation of the inelastic rotation
capability of flush end-plate moment connections. An experimental investigation also was
conducted to study the inelastic rotation capability of flush end-plate moment connections.
Experimental results for maximum moment resisted by the connections were compared with
analytical predictions. Moment strengths of the connections were calculated using yield-line
theory to predict end-plate yielding and maximum bolt force calculations including prying
action. Experimental results were also compared to previous research with regards to strength
and stiffness. It was found that the connections with a wide connection allowed for more
yielding of the end-plate during testing. These connections exhibited nearly double the
inelastic rotation capability than their tight counterparts.

INTRODUCTION AND LITERATURE REVIEW
MOHD FAZAULNIZAM BIN SHAMSUDIN 19
1.3 End-Plate Beam to Column Connections
End-plate moment connections consist of a plate that is shop-welded to the end of a
beam that is then field bolted to the connecting member using rows of high strength bolts. The
connections are primarily used to connect a beam to a column or to splice two beams together.
Bolted end-plate connections are extensively used for connecting beams to columns or beams
to beams in multi-storey steel frame buildings. There are several types of end-plate
connections: extended end-plate, as shown in Figure 1.1 and flush end-plate, as shown in
Figure 1.2. For seismic design purposes, rigid connections are traditionally used in moment
resisting frames. Steel frames with semi-rigid connections were not utilized mainly due to
their relative flexibility when compared to rigid forms.
The extended end-plate connection is primarily used for beam-to-column connections. It
consists of a plate with bolt holes drilled or punched, and shop welded to a beam section. The
connection is completed in the field when the beam end is bolted to a column. The extended
end-plate connection is termed “extended” because the plate extends above or below the
flange that will be in tension under load. In the case of extended end-plates used for seismic
design, the end-plate is extended above and below both beam flanges. Extended end-plate
connections can be stiffened or unstiffened. The stiffened configurations have gusset plate
(stiffener) welded to the outside of the beam flange, as shown in Figure 1.1. The stiffener is
aligned with the web of the connecting beam to strengthen the extended portion of the end-
plate. This type of connections can be used in frames subjected to both vertical loads and
horizontal forces due to wind action or seismic motion. In general, bolted extended end-plate
connections are able to dissipate significant amounts of energy, and are suitable for seismic-
resistant structures (Ghobarah et al., 1992). The four-bolt, stiffened and unstiffened extended
end-plate design procedures were concluded to be sufficient for cyclic loading, and therefore
for use in steel buildings subject to seismic activity (John C. Ryan, 1999).
INTRODUCTION AND LITERATURE REVIEW
MOHD FAZAULNIZAM BIN SHAMSUDIN 20
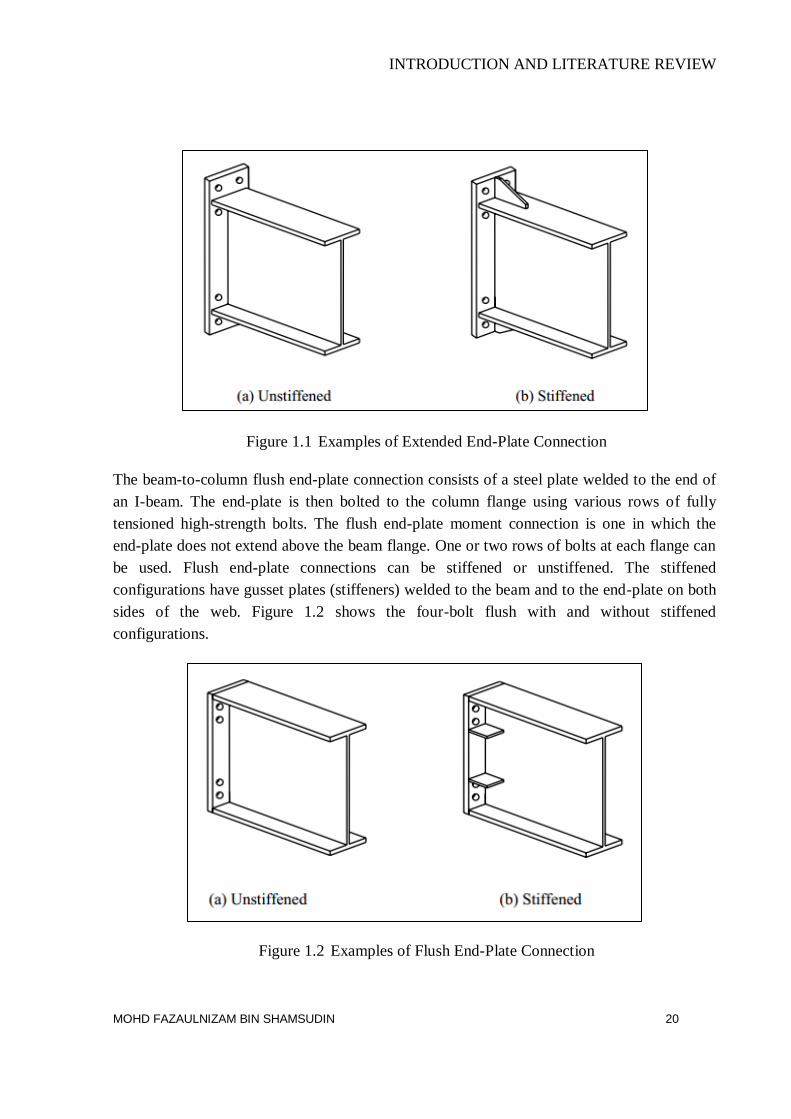
Figure 1.1 Examples of Extended End-Plate Connection
The beam-to-column flush end-plate connection consists of a steel plate welded to the end of
an I-beam. The end-plate is then bolted to the column flange using various rows of fully
tensioned high-strength bolts. The flush end-plate moment connection is one in which the
end-plate does not extend above the beam flange. One or two rows of bolts at each flange can
be used. Flush end-plate connections can be stiffened or unstiffened. The stiffened
configurations have gusset plates (stiffeners) welded to the beam and to the end-plate on both
sides of the web. Figure 1.2 shows the four-bolt flush with and without stiffened
configurations.
Figure 1.2 Examples of Flush End-Plate Connection

INTRODUCTION AND LITERATURE REVIEW
MOHD FAZAULNIZAM BIN SHAMSUDIN 21
Moment end-plate connections are further described by the number of bolts at the tension
flange and the configuration of the bolt rows. For gravity and or wind load applications, the
end plate connection is often designed to carry tension only at one flange. For seismic or
cyclic loading, where the connection may experience load reversals, the end-plate is designed
to carry tension at both flanges.
The primary advantage of moment end-plate connections is that they do not require field
welding, allowing to be done in cold conditions, and construction time to be reduced. They
are easy to build and cost approximately the same as other moment connections. They allow a
great variety of structural solutions by properly modifying the connection structural detail. In
particular, both rotational stiffness and flexural resistance can be properly balanced by
choosing an appropriate number of bolts and their location, an appropriate end-plate thickness
and its geometrical configuration. The primary disadvantages are that they require precise
beam length and bolt holes location tolerances.
This method of construction offers several advantages over other joint types (Griffifths, 1984
and Murray, 1988):
i) The joint is suitable for winter erection, since only field bolting is required.
ii) All welding is performed in the shop thus eliminating any field welding associated
problems and offering high quality control.
iii) The number of bolts required for erection purposes is relatively small compared to
other fully bolted joints, which makes the erection process relatively fast and
efficient.
The most important structural properties of the joints that should be known prior to the
analysis of frame structure and the design of its members are the moment resistance,
rotational stiffness, and rotation capacity.

INTRODUCTION AND LITERATURE REVIEW
MOHD FAZAULNIZAM BIN SHAMSUDIN 22
1.4 Component Method
1.4.1 Introduction
The application of component method to connection modelling design needs three basic
steps. Firstly, identification of the components of the joints, secondly, evaluation of force-
deflection diagram of independent components and finally the components are assembled
imposing compatibility equations to determine strength, stiffness and deformation capacity of
the entire connection. Previously connections were designed as either pinned or fixed full
strength connection. The accuracy of the component method depends on the accuracy quality
of the components assembling process. Moreover, certain mechanical components do not
behave independently being related to others. The application of the component method is
capable to analyse different types of connection topologies. Contrarily to previous design
code the procedures to design according to component method are complex requiring
considerable effort even when designing a simple moment connection. Software has been
developed to determine mechanical properties especially under monotonic loading. Generally,
the loading is assumed to be imposed on the structure in two different ways as shown in
Figure 1.3 (Ádány S., 2000). Monotonic loading means the classical static loading having the
following characteristics:
i) quasi-static,
ii) Its intensity is increasing in time.
While cyclic loading represents a simplified seismic loading with the features as follows:
i) quasi-static,
ii) repeated loading-unloading-reversed loading-unloading,
iii) Its intensity is high enough to cause significant plastic strain in the structure.
Figure 1.3 Monotonic and cyclic loading

INTRODUCTION AND LITERATURE REVIEW
MOHD FAZAULNIZAM BIN SHAMSUDIN 23
1.4.2 Static Loading
1.4.2.1 Characteristics Behaviour of Connection Parameters
i) Column web panel in shear (ductile): The limitation of the column web
slenderness satisfies the condition / 69c w
d t is there to ensure that no shear
buckling occurs. As 235 /yw c
f (with yw cf = yield stress of the column web in
2/N m m ), the steel grade is already taken into consideration there and no other
limitation is required; in other words, the formula given in Annex J for the plastic
shear resistance of the panel is valid whatever the steel grade, as long as
/ 69c w
d t . The limitation to S355 can therefore be removed.
ii) Column web in compression (fragile): The only component for which an
extending of the design rules to HSS seems quite questionable is the column web
in compression where the buckling and crippling resistances (not the crushing one)
are highly dependent on the web slenderness and the longitudinal stresses in the
column web resulting from bending moments and normal forces.
iii) Beam flange and web in compression (ductile): The strength evaluation is based
on the evaluation of the design resistance ,c R dM of the beam section. ,c R d
M is
dependent on the class of the beam profile and, as for the column web in shear,
this one is influenced by . A priority, no limitation of the steel grades seems to be
needed for this component, but the validation of the related design formula for
strength would anyway be welcome. The additional web welds were intended to
increase the amount of bending moment transferred by the web connection,
thereby relieving somewhat the moment transferred by the flange welds
(Engelhardt and Husain 1993). Regarding beam flange and web in compression,
local buckling phenomenon can result in a dissipative behaviour provided that the
width-to-thickness ratios of the plate elements constituting the beam section are
limited to assure a ductile behaviour, i.e., class 1 cross-sections are adopted.
iv) End plate in bending, Column flange in bending and Flange cleat in bending:
These components are idealized as T-stubs subjected to tension forces. At design
collapse, the bolts fail in tension, a plastic mechanism develops in the T-stub
flange or a mixed failure involving bolt fracture and plasticity in the T-stub flange
occurs. Once again, the relative values of the yield stresses (bolts/plate) are taken

INTRODUCTION AND LITERATURE REVIEW
MOHD FAZAULNIZAM BIN SHAMSUDIN 24
into consideration in the strength calculations and no limitation of the yield stress
for the connected plate (end plate, column flange or cleat) has to be considered for
these components. Moreover, the cyclic behaviour of bolted connections can be
strongly affected by bolt plastic deformation, because the occurrence of such
plastic deformations can lead to pinching phenomena of hysteresis loops of bolted
components, i.e., endplate, column flange, and flange cleat in bending.
v) Bolts in bearing, Plate in tension and compression, Beam web in tension,
Column web in tension: No instability is likely to occur in these components,
even for the plate in compression, where the risk of instability is prevented through
the use of appropriate bolt pitches. Their strength is linked to plasticity and a
limitation to steel grade lower then S355 does not appear as quite justified.
Regarding bolt behaviour, it is important to note that, both under normal and shear
stresses, their limited plastic deformation capacity and fatigue life can lead to the
brittle collapse of the joint, so that bolts have to be designed with sufficient over
strength to prevent brittle failure modes.
1.4.2.2 Design Moment-Rotation Characteristic
As explained and indicated from the previous section, the main properties required for the
analysis of a connection the moment resistance ,j R dM , rotational stiffness j
S and the
rotational capacity C d . Figure 1.3 gives an example of influence of joints beam-column
connection and force directions. The moment resistance model orientation is shown in Figure
1.4. The corresponding moment (force) – rotation (displacement) curves are non-linear which
typical feature of joint behaviour. The joint behaviour could be in rigid under torsion or shear,
in semi-rigid influenced bending or axial force.

INTRODUCTION AND LITERATURE REVIEW
MOHD FAZAULNIZAM BIN SHAMSUDIN 25
Figure 1.4 Influence of Bolted End-Plate Steel Joints
Figure 1.5 Model Orientation of Moment Resistance
The linear elastic curve deviates from its low bending moment straight line as shown in
Figure 1.6. Moment-rotation curve presents initially an elastic behaviour, followed by a
plastic response resulting from the progressive yielding of some components. After reaching
2/3 of the bending moment rotation curve, the component stiffness is reduced until the
moment is reached. The required rotational capacity of a joint is depend on the structural type
either statically determined or statically indeterminate and the analysis for the entire structure
either in elastic or plastic behaviour. EC-1-8 defines such an equivalent elastic stiffness as
expressed in equation 1.1.

INTRODUCTION AND LITERATURE REVIEW
MOHD FAZAULNIZAM BIN SHAMSUDIN 26
,j in i
j
SS
(1.1)
Figure 1.6 Design Moment Rotation Curve
In the calculation of the deformation capacity, it is important to consider possibility of
unfavourable differences between the numerical strength and the actual strength. The column
flange and the end plate in bending and the column web panel in shear are ductile joint
components. The bolts in tension and shear and welds are typical examples of brittle
components. Thus, both types mode of failure should not bother the strength of the
connection.

INTRODUCTION AND LITERATURE REVIEW
MOHD FAZAULNIZAM BIN SHAMSUDIN 27
1.4.3 Cyclic Loading
1.4.3.1 Loading Protocols
i) Requirements of EN 15129: The basic test protocol specified in EN 15129 is
shown in Figure 1.7. The standard protocol states that the number of test cycles at
the design displacement level shall be increased for devices with fundamental
periods considerably less than 2s. For structures equipped with buckling restrained
braced frame (BRBF) generally have a fundamental period in between 1-2s,
therefore an appropriate load increment of test cycles is necessary.
Figure 1.7 Loading Protocol specified in EN 15129
ii) Load Protocol Proposed by ECCS: Loading protocol provided by the European
Convention for Constructional Steelwork (ECCS) for carry out tests in order to
characterize the structural behaviour of structural components under cyclic loads
as implemented in this paper. ECCS loading protocol apply different approach
from EN 15129 protocol, the amplitude of load cycles is depending on the yield
displacement (ey, identical to dy) in this case as shown in Figure 1.7. The third
testing procedure provided by ECCS is a cyclic test with increase of displacement.
The characteristics are defined as follows:

INTRODUCTION AND LITERATURE REVIEW
MOHD FAZAULNIZAM BIN SHAMSUDIN 28
- One cycle in the / 4y
e
, / 4y
e
interval;
- One cycle in the 2 / 4y
e
, 2 / 4y
e
interval;
- One cycle in the 3 / 4y
e
, 3 / 4y
e
interval;
- One cycle in the y
e
, y
e
interval;
- Three cycles in the 2y
e
, 2y
e
interval;
- Three cycles in the 2 2y
n e
, 2 2y
n e
interval (n=1,2,...).
More cycles or more intervals may be used if necessary. Displacements at yield
are defined as:
y
y
y
Fe
tga
y
y
y
Fe
tga
Where:
/
yF
is the yield load in the positive/negative force range
/
ytga
is the slope of the tangent at the origin of the (F-e) curve, when F
increases on the positive/negative side.
Yield displacement is estimated using characteristic material properties before
the tests and verified after first yield during every experiment.

INTRODUCTION AND LITERATURE REVIEW
MOHD FAZAULNIZAM BIN SHAMSUDIN 29
Figure 1.8 Loading Protocol specified in ECCS
iii) SAC Loading protocol: The basic SAC loading protocol is the multiple step tests
in which the loading deformation history consists of stepwise increasing
deformation cycles. The loading protocol based on displacement and is illustrated
in Figure 1.9 and in tabular form as shown in Table 1.1. The cycles shall be
symmetric in peak deformations. The history is devoted into several steps and the
peak deformation of each step j is given as θj, a predetermined value of the inter-
story drift angle. Thus, the loading history is defined by the following parameters:
θj the peak deformation in load step j
nj the number of cycles to be performed in load step j
Table 1.1 SAC Loading protocol
Load Step # Peak Deformation, θ Number of Cycles, n
1 0.00375 6
2 0.005 6
3 0.0075 6
4 0.01 4
5 0.015 2
6 0.02 2
7 0.03 2
Continue wih increments in θ of 0.01 rad, and perform two cycles at each step

INTRODUCTION AND LITERATURE REVIEW
MOHD FAZAULNIZAM BIN SHAMSUDIN 30
Figure 1.9 SAC Loading Protocol
iv) ATC-24 Loading protocol
Loading protocol provided by ATC-24 as shown in Figure 1.10 recommended
several numbers of cycles and peak deformations in each load step as follows:
a) The number of cycles on with a peak deformation less than y
should be at
least six.
b) The number of cycles 1n with a peak deformation y
equal to 1 should be at
least three.
c) The number of cycles 2n with peak deformation 2 y
should be at least
three unless a lower number can be justified.
d) The number of cycles 3n with peak deformation 3
2y
should be at
least three.

INTRODUCTION AND LITERATURE REVIEW
MOHD FAZAULNIZAM BIN SHAMSUDIN 31
Figure 1.10 ATC-24 Loading Protocol
INTRODUCTION AND LITERATURE REVIEW
MOHD FAZAULNIZAM BIN SHAMSUDIN 32
1.5 Objective and Scope
To address the need for an understanding of the cyclic behaviour and thereafter propose an
appropriate cyclic model parameters for beam to column connections. An analysis software
SeismoStruct and numerical study based on Richard-Abbott Model was conducted. The
computational part consisted of two phases. The first involved investigating the cyclic
behaviour of extended end-plate joints. The scope of the software SeismoStruct in this phase
consisted of the following aspects:
i) Assessing the cyclic performance of end-plate beam to column connections.
ii) Examining the behaviour of the individual thirty cyclic model parameters
comprising the connection such as the end-plate, the column flange and the bolts.
iii) Recommending design model parameters for joint under cyclic loading excitation
to perform satisfactorily dissipative moment joint which related to pinching.
iv) The accuracy of it would need to be verified by comparing such results with
relevant information from experimental tests.
In the second phase of the numerical approach that take into account the strength degradation
and pinching phenomena were investigated by the implementation of Spreadsheet analysis.
The results of rotation were taken from analytical analysis output and applied into the
formulation of Modified Richard-Abbott model. The scope of the analytical analysis in this
phase consisted of the following:
i) Checking the validity of the model parameters design criteria adopted from
SeismoStruct and compared with resulted moment-rotation hysteretic curves
generated by Spreadsheet.
ii) Improving the percentage of errors in bending moment with alteration of certain
coefficient in Modified Richard-Abbott model.
iii) Developing the analytical model capable of predicting the behaviour of the beam-
column connection.
iv) The performance of this model would be assessed by comparing the numerical
hysteretic curves with the SeismoStruct results.

DOUBLE EXTENDED END-PLATE CONNECTION
MOHD FAZAULNIZAM BIN SHAMSUDIN 33
Chapter II: DOUBLE EXTENDED END-PLATE CONNECTION
2.1 Introduction
The behaviour of the beam-column connection plays a major role in the response of a
steel moment resisting framed structure subjected to seismic loading excitation. Semi-rigid
connections like bolted joints, are common type of connections and can be used to allow
better energy dissipation in moment resisting frames (MRF) or in dissipative parts of braced
frames. In this chapter the ductility and energy dissipation characteristics of semi-rigid bolted
connections using double extended end-plate as shown in Figure 2.1 (Nogueiro, P., 2009) is
discussed based on computational analysis.
In the steel structural framework with semi-rigid connections, the component characteristics
of joints play a vital role in dissipating energy mechanisms. Rigid connections are costly and
difficult to assemble and use of semi-rigid connections is justified. Semi-rigid connections
connecting the web and flanges of the beam to the column flange are cheaper and simpler to
assemble when compared to other conservative joint.
Figure 2.1 Double Extended End-Plate Connection Topology

DOUBLE EXTENDED END-PLATE CONNECTION
MOHD FAZAULNIZAM BIN SHAMSUDIN 34
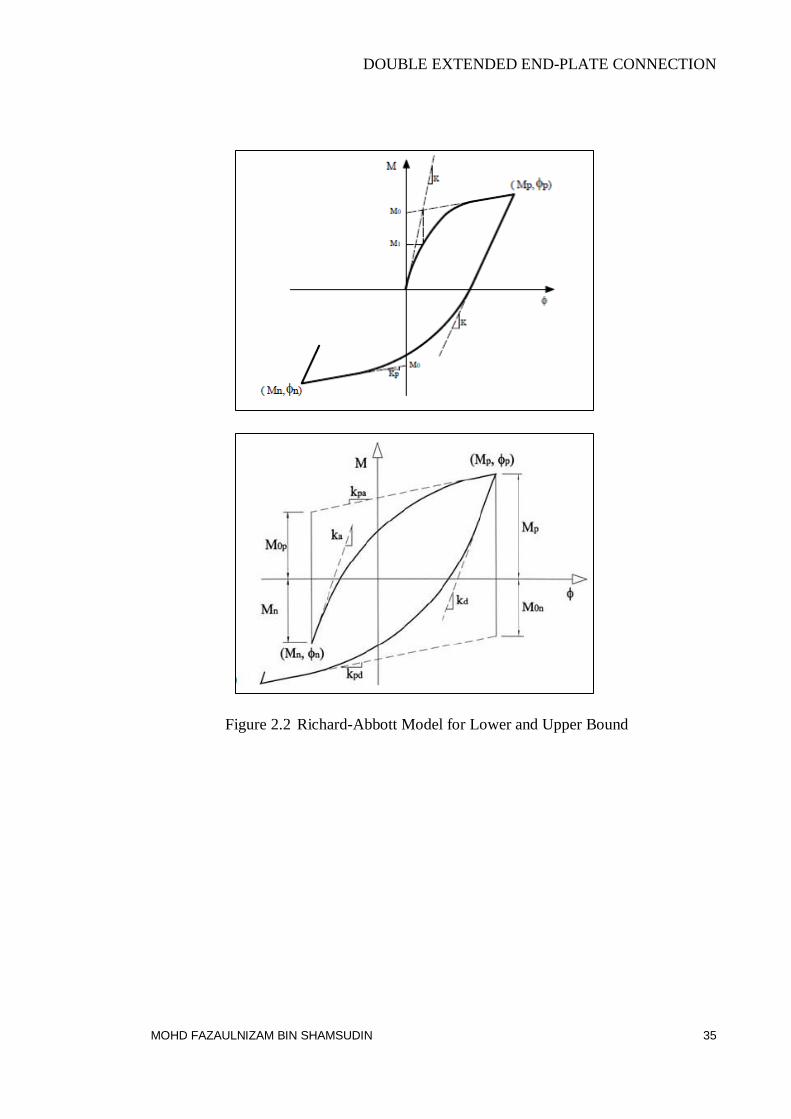
2.2 Modified Richard-Abbott Model
The Richard-Abbott model is based on a formula developed in 1975 [Richard et al.,
1975] to reproduce the elastic-plastic behaviour of several materials and was initially used to
simulate the static monotonic response of joints and later applied to cyclic situations.
According to this model, the loading branch of the moment-rotation curve of a joint is
described by equation (1).
1 /
..
.1
p
pNN
p
o
k kM k
k k
M
(1)
Where M denotes the bending moment and the joint rotation. Parameters k, kp and M0 are
defined in Figure 2.2, while N may be related with these parameters by the following
equation:
1
0
ln 2
lnp
p
NkM
M k k
(2)
In asymmetrical joints with respect to the centroidal axis, as in the case of composite joints,
the model must be modified in accordance with Figure 2.2. The loading curve for a generic
branch is now given by the equation (3).
1 /
..
.1
a pa n
n pa nNN
a pa n
oa
k kM M k
k k
M
(3)
DOUBLE EXTENDED END-PLATE CONNECTION
MOHD FAZAULNIZAM BIN SHAMSUDIN 35
Figure 2.2 Richard-Abbott Model for Lower and Upper Bound

DOUBLE EXTENDED END-PLATE CONNECTION
MOHD FAZAULNIZAM BIN SHAMSUDIN 36
2.3 Cyclic Modeling of Dissipative and Non- Dissipative Components
2.3.1 Introduction
The capacity of design should control an inelastic behaviour. Based on the fundamental
philosophy of design capacity, plastic deformations should be concentrated in pre-defined
locations of the structure while the rest of the structure should remain in the elastic range. The
application on seismic design should consider cyclic behaviour of structural components as
follows (Ádány S., 2000):
i) The zones of the structure where extensive plastic deformations are expected,
the so-called dissipative zones, have the major role of dissipating, by their
inelastic hysteresis behaviour, the input energy coming from the ground motion
in case of a severe earthquake. Thus, first of all, the dissipative zones should
have enough energy absorption capacity.
ii) Moreover, it is essential for the dissipative zones to have enough ductility to
allow the extensive structural deflections without failure, as well as to make
possible the development of plastic hysteresis cycles that are necessary for the
energy dissipation.
iii) At the same time it is important to know the strength (capacity) of the dissipative
zones, by taking into consideration the effect of possible material hardening, in
order to be able to design the connecting non-dissipative part of the structure to
provide with resistance enough to remain in the elastic domain. (Note that the
name of capacity design comes from the fact that non-dissipative zones should
be designed for the actions equal to the capacity of the neighbouring dissipative
zones.)
iv) Finally, it is important to know the rigidity change of the dissipative zones, since
the dramatic rigidity degradation in several locations can lead to the
development of global collapse mechanism of the structure that cannot be
allowed.

DOUBLE EXTENDED END-PLATE CONNECTION
MOHD FAZAULNIZAM BIN SHAMSUDIN 37
2.3.2 Column Web Panel
Column web panel is defined as the column web component restricted by the continuity
of the beam plates and the column flanges in any position of beam-column connections
respectively. This area component is studied to be a zone primarily subjected to shear stresses
behaviour and thereby its failure mode is controlled by shear yielding as shown in Figure 2.3.
Previous research demonstrated that the mode of failure was stable and ductile. Thus, allowed
the column web panel dissipate more energy under cyclic loading. These attractive
characteristics were taken into account in design rules by the late of the 1980’s which
permitted the panel zone component to be counted as a dissipative component.
Figure 2.3 Panel Zone
The ductility performance of the panel zone was strengthened in Europe by Dubina et al.
[2001] and Ciutina and Dubina [2006] in the research of understanding the cyclic
performance of beam-column connections. Research documented ductility component
triggering the capability of dissipating energy or even more by allowing stable hysteretic
loops.
Based on previous study, the theoretical analysis of the yield condition of the web panel were
conducted and validated versus experimental tests. The common load behaviour from the web
panel was characterised by three stages. First, elastic shear response followed by yielding,
according to the Von Mises criterion. Second, reserve in strength attributed to the surrounding
elements of the panel. Finally, a post yield strength characterised by strain hardening of the
steel. The post yield range was considered to be stable and to sustain considerable load after

DOUBLE EXTENDED END-PLATE CONNECTION
MOHD FAZAULNIZAM BIN SHAMSUDIN 38
the yield capacity. The panel was recognized as dissipating energy component. Considerations
of the elastic and inelastic range of the web panel was determined by experimental and detail
analytical understanding of the load deformation behaviour of joints and the associated strain-
stress regime.
Column web in compression is well known that do not usually allow the development of
highly dissipative mechanics under local buckling phenomena. For this reason, the use of
stiffeners such as continuity plates is commonly suggested in designing the column web
panel. In addition, doubler plates were sometimes provided in the column to increase the
column panel zone shear strength. Column stiffeners can be designed to prevent local flange
bending, local web yielding, local web crippling, and compression buckling of the column.
Stiffeners are placed on the column at the locations of the beam flange forces to prevent
distortion of the column flange where the beam exerts the tensile loading and web yielding
and crippling at the compression loading. The beam is therefore exerting a tensile force
through one flange and a compressive force through the other as shown in Figure 2.4.
Figure 2.4 Couple Moment Transfer
In the application of cyclic behaviour, experimental tests were carried out by Nogueiro et al
[6] and shown stable hysteretic loops with little strength and degradation and no pinching
provided. The Table 2.1 shows the Modified Richard-Abbott model parameters determined

DOUBLE EXTENDED END-PLATE CONNECTION
MOHD FAZAULNIZAM BIN SHAMSUDIN 39
from Eurocode provisions and previous experimental tests and Table 2.2 below lists model
parameters used to compute the moment-rotation hysteretic curve in the SeismoStruct.
Table 2.1 Model Parameters for Column Web Panel in Shear
Ka = Kd = Kap = Kdp (KNm/rad) EC3-1-8
Ma = Md = Map = Mdp (KNm) EC3-1-8
Kpa = Kpd = Kpap = Kpdp (KNm/rad) [1]
na = nd = nap = ndp 1
t1a = t2a = t1d = t2d = Ca = Cd 0
iKa = iKd 0
iMa = iMd 0
Ha = Hd 0
Table 2.2 Example of Model Parameters for Column Web Panel in Shear
Ka = Kd = Kap = Kdp (KNm/rad) 35000
Ma = Md = Map = Mdp (KNm) 120
Kpa = Kpd = Kpap = Kpdp (KNm/rad) 1000
na = nd = nap = ndp 1
t1a = t2a = t1d = t2d = Ca = Cd 0
iKa = iKd 0
iMa = iMd 0
Ha = Hd 0
In the application of SeismoStruct analysis, hysteretic curves were compared between lower
and higher post-limit cyclic model parameters stiffness as shown in Figure 2.5. The ductility
DOUBLE EXTENDED END-PLATE CONNECTION
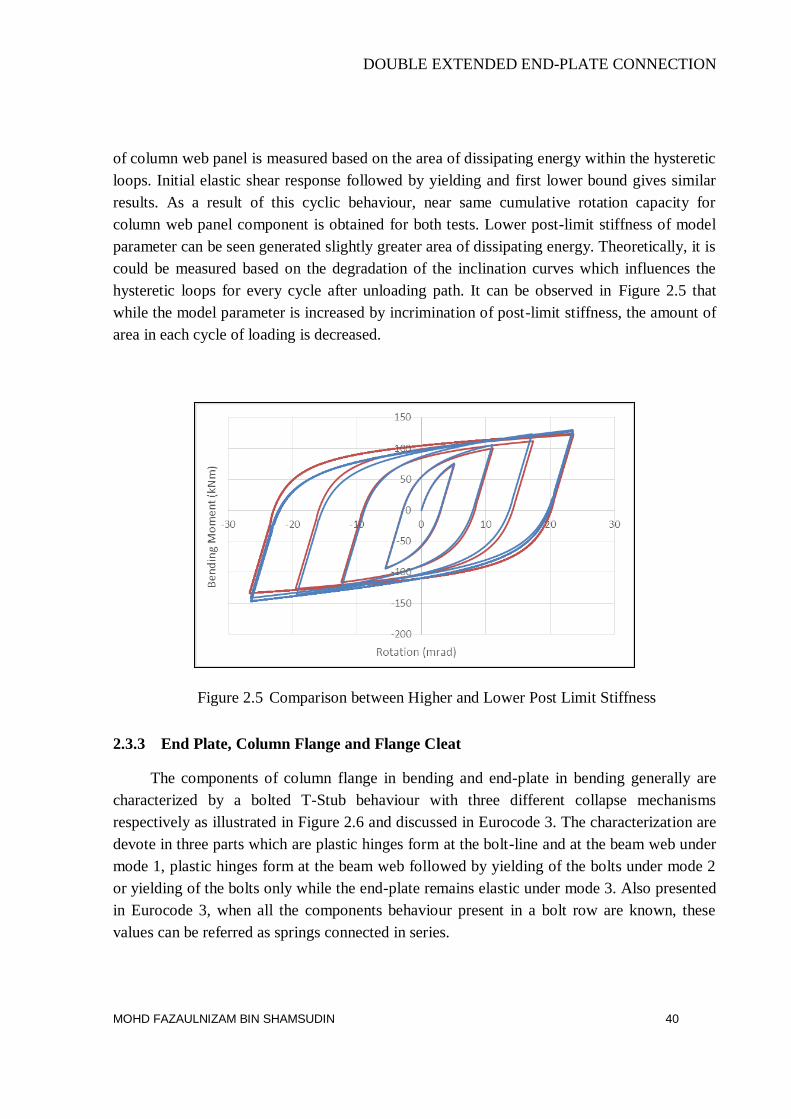
MOHD FAZAULNIZAM BIN SHAMSUDIN 40
of column web panel is measured based on the area of dissipating energy within the hysteretic
loops. Initial elastic shear response followed by yielding and first lower bound gives similar
results. As a result of this cyclic behaviour, near same cumulative rotation capacity for
column web panel component is obtained for both tests. Lower post-limit stiffness of model
parameter can be seen generated slightly greater area of dissipating energy. Theoretically, it is
could be measured based on the degradation of the inclination curves which influences the
hysteretic loops for every cycle after unloading path. It can be observed in Figure 2.5 that
while the model parameter is increased by incrimination of post-limit stiffness, the amount of
area in each cycle of loading is decreased.
Figure 2.5 Comparison between Higher and Lower Post Limit Stiffness
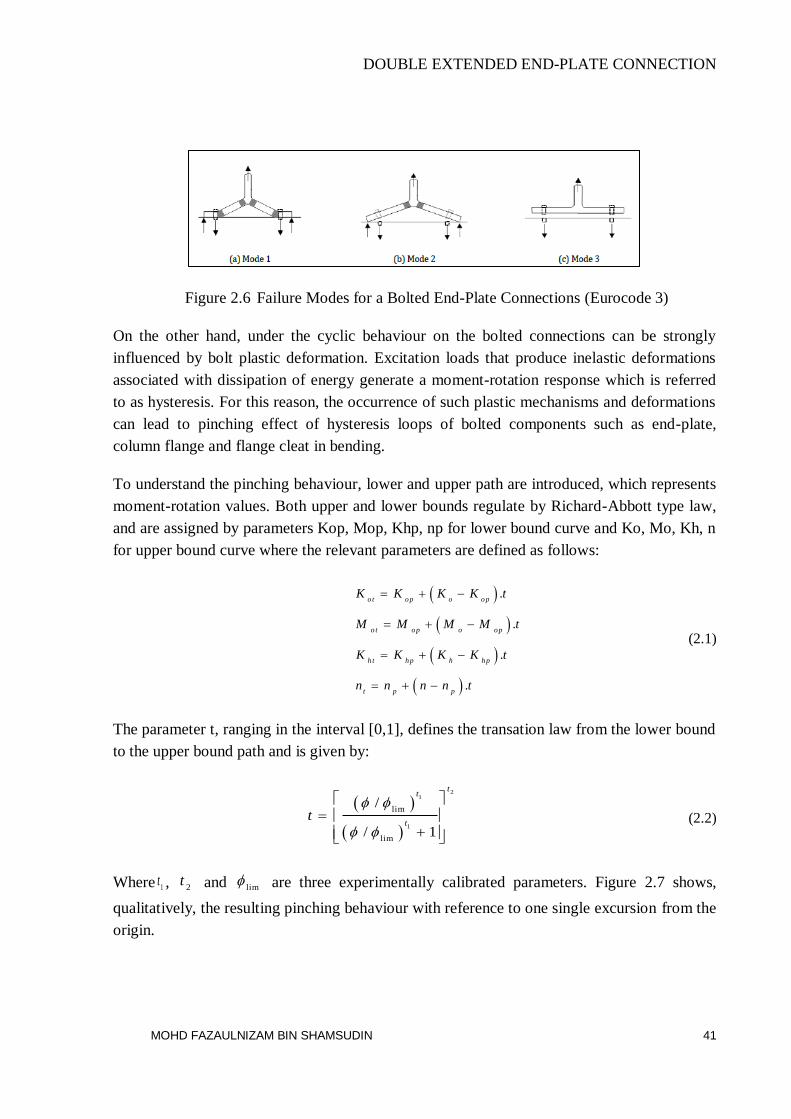
2.3.3 End Plate, Column Flange and Flange Cleat
The components of column flange in bending and end-plate in bending generally are
characterized by a bolted T-Stub behaviour with three different collapse mechanisms
respectively as illustrated in Figure 2.6 and discussed in Eurocode 3. The characterization are
devote in three parts which are plastic hinges form at the bolt-line and at the beam web under
mode 1, plastic hinges form at the beam web followed by yielding of the bolts under mode 2
or yielding of the bolts only while the end-plate remains elastic under mode 3. Also presented
in Eurocode 3, when all the components behaviour present in a bolt row are known, these
values can be referred as springs connected in series.
DOUBLE EXTENDED END-PLATE CONNECTION
MOHD FAZAULNIZAM BIN SHAMSUDIN 41
Figure 2.6 Failure Modes for a Bolted End-Plate Connections (Eurocode 3)
On the other hand, under the cyclic behaviour on the bolted connections can be strongly
influenced by bolt plastic deformation. Excitation loads that produce inelastic deformations
associated with dissipation of energy generate a moment-rotation response which is referred
to as hysteresis. For this reason, the occurrence of such plastic mechanisms and deformations
can lead to pinching effect of hysteresis loops of bolted components such as end-plate,
column flange and flange cleat in bending.
To understand the pinching behaviour, lower and upper path are introduced, which represents
moment-rotation values. Both upper and lower bounds regulate by Richard-Abbott type law,
and are assigned by parameters Kop, Mop, Khp, np for lower bound curve and Ko, Mo, Kh, n
for upper bound curve where the relevant parameters are defined as follows:
.
.
.
.
o t op o op
o t op o op
h t hp h hp
t p p
K K K K t
M M M M t
K K K K t
n n n n t
(2.1)
The parameter t, ranging in the interval [0,1], defines the transation law from the lower bound
to the upper bound path and is given by:
21
1
lim
lim
/
/ 1
tt
tt
(2.2)
Where 1t , 2
t and lim are three experimentally calibrated parameters. Figure 2.7 shows,
qualitatively, the resulting pinching behaviour with reference to one single excursion from the
origin.

DOUBLE EXTENDED END-PLATE CONNECTION
MOHD FAZAULNIZAM BIN SHAMSUDIN 42
Figure 2.7 Loading Branch with Pinching
1
1
ht
tt
ot h t
n n
ot h t
o t
K K xM K x
K K x
M
(2.3)
According to the experimental tests carried out by Nogueiro at al [13] the parameters in Table
2.3 can be observed which can be determined from eurocode 3 and experimental tests. The
values for End-Plate in Bending are proposed in Table 2.4 which are subsequently used in
SeismoStruct.
Table 2.3 Model Parameters for End-Plate in Bending
Ka = Kd = Kap = Kdp (KNm/rad) EC3-1-8
Ma = Md = Map = Mdp (KNm) EC3-1-8
Kpa = Kpd = Kpap = Kpdp (KNm/rad)
na = nd = nap = ndp [1]
t1a = t1d 1
t2a = t2d 0
Ca = Cd 5
iKa = iKd 0
iMa = iMd 0
Ha = Hd 0

DOUBLE EXTENDED END-PLATE CONNECTION
MOHD FAZAULNIZAM BIN SHAMSUDIN 43
Table 2.4 Example of Model Parameters for End-Plate in Bending
Ka = Kd = Kap = Kdp (KNm/rad) 4550
Ma = Md = Map = Mdp (KNm) 60
Kpa = Kpd = Kpap = Kpdp (KNm/rad) 100
na = nd = nap = ndp 1
t1a = t1d 20
t2a = t2d 0.3
Ca = Cd 1
iKa = iKd 0
iMa = iMd 0
Ha = Hd 0
The corresponding hysteretic curves can be observed in Figure 2.8. Hysteresis diagrams of
joint panel component for pinching effect tests are plotted. It can be seen that joint panel
shows less bending moment due to pinching effect and the area of dissipating energy.
Three analysed tests are shown in Figure 2.8 (i), (ii) and (iii) in SeismoStruct tests based on
assigned parameters related to pinching respectively. Because of their geometrical properties
and assigned higher model parameters, Figure 2.8 (i) and (ii) were more ifluenced by
pinching. For these three analytical study, no stiffness or strength degradation were observed
as can be seen in Figure 2.8. In some cases, the repetition of loading accompanied by
degradation of the structural response because of deterioration of its mechanical properties.
Previous study stated that the local pinching effect at the semi-rigid joints someimes effects
considerably on the global response of the frame, and then it shall be considered properly in
the mathematical modeling. The inelastic behavior of bolted connections is definitely more
complex compared to welded joints, simply because more components can be involved in the
dissipation mechanism, such as the endplate, angles or tee stubs in bending (depending on the
connection typology), the column flange in bending, the panel zone in shear, the column web
in tension or compression.

DOUBLE EXTENDED END-PLATE CONNECTION
MOHD FAZAULNIZAM BIN SHAMSUDIN 44
(i)
(ii)
(iii)
Figure 2.8 Pinching Effects on the Joint
ANALYSIS OF COMPUTATIONAL RESULTS
MOHD FAZAULNIZAM BIN SHAMSUDIN 45
CHAPTER III: ANALYSIS OF COMPUTATIONAL RESULTS
3.1 Introduction
The necessity for additional investigation on analytical, experimental and numerical
results regarding the behaviour of end-plate moment connections has been identified by the
understanding of literature reviews. The analytical and numerical cyclic behaviour of double
extended end-plate moment connections results is the main objective of this study.
The main purpose of the cyclic analysis was to investigate the strength, stiffness and inelastic
rotational capacity of the connection assemblies and to determine and measure if extended
end-plate moment connections were suitable for use in seismic force resisting moment frame.
The development of a design procedure for end-plate moment connections subject to cyclic
loading requires the study of analytical model that are able to simulate the moment-rotation
response of the connection.
This chapter presents and compares the hysteretic moment-rotation curves of a connection
tested experimentally with the analytical results when the Modified Richard-Abbott Model
implemented in SeismoStruct is used and when the same parameters is implemented directly
in a Spreadsheet. All computations were carried on using the methods described in Chapter II.
The inputs correspond to the actual design parameters of the specimens tested experimentally
by (Nogueiro, P., 2009) and are given in Figure 3.1.

ANALYSIS OF COMPUTATIONAL RESULTS
MOHD FAZAULNIZAM BIN SHAMSUDIN 46
3.2 Mechanical Model for Bolted Beam to Column Joints
The availability of methods in technical literature pertaining to the design modeling
under cyclic behaviour of beam-column joints can be devoted into some groups which are
mathematical models, mechanical models and finite elements models. Mathematical models
like Modified Richard-Abbott Model are developed based on curve fitting of joint moment-
rotation curves. However, mathematical approach can only be developed depending on the
availability of experimental data and tests. On the numerical implementation and
experimental calibration, it was observed that the controlling variable is rotation φ for this
type of models.
Figure 3.2 (M. Latour, V. Piluso & G. Rizzano, 2011) illustrates a typical component model
for an external double end-plate beam to column joint. Brittle components such as the bolts in
tension can be identified and ductile components such as the column web panel in shear. The
implementation of the mechanical model requires three steps to perform:
i) Assembling of the joint components;
ii) Modelling joint design parameters of the cyclic behaviour based Modified
Richard-Abbott Model;
iii) Analysis and evaluation of joint cyclic moment-rotation capacity hysteretic loops.
The modified Richard-Abbott constitutes a sophisticated model and is used here to reproduce
the cyclic behaviour of the steel joints.

ANALYSIS OF COMPUTATIONAL RESULTS
MOHD FAZAULNIZAM BIN SHAMSUDIN 47
Figure 3.1 Load Scheme on Experimental Test (Nogueiro, P., 2009)
Figure 3.2 Mechanical Model for Bolted Extended End-Plate Connections (M. Latour, V.
Piluso & G. Rizzano, 2011)

ANALYSIS OF COMPUTATIONAL RESULTS
MOHD FAZAULNIZAM BIN SHAMSUDIN 48
3.3 Double Extended End-Plate Bolted Connection
3.3.1 Model Analysis
The latest version of software Seismostruct is used for the analysis of the connection.
SeismoStruct is a Finite Element package which capable of predicting the large displacement
behaviour of space frames under static and dynamic loading. The software also takes into
accounts both geometric non-linearities and material inelasticity. The analysed model consists
on the link between a cantilever and a column, where the link element follows a moment-
rotation law specified by the Modified Richard-Abbott model. The cyclic loading is applied
on the extremity of the cantilever in order to produce a statically determined bending moment
in the link. The rotation is obtained directly from the software in the link element.
In the analysis types, static time-history has been adopted during the analysis of these models.
In static time-history analysis, the applied loads for example displacement, forces or a
combination of both can vary independently in the pseudo-time domain which according to a
prescribed load pattern. This type of analysis is typically used to model static of structures
under various force or displacement patterns such as cyclic loading.
Bilinear steel model (stl_bl) was used for the beam and column elements. Five model
calibrating parameters must be defined in order to fully describe the mechanical
characteristics of the material as shown below in Table 3.1.
Table 3.1 Material Properties Beam and Column
Modulus of Elasticity, E (kPa) 2.10x10^8
Yield Strength, fy (kPa) 450x10^3
Strain hardening parameter, µ 0.005
Fracture/buckling strain, εult 0.1
Specific weight, γ (kN/m3) 7.7
The joint modelled consists of a column section HEA 320 and a single beam section IPE 360
as illustrated in Figure 3.3. The geometry of the joint topology is presented in Figure 3.4
(Nogueiro, P., 2009).

ANALYSIS OF COMPUTATIONAL RESULTS
MOHD FAZAULNIZAM BIN SHAMSUDIN 49
Figure 3.3 Geometry of Model Scheme in Seismostruct
Figure 3.4 Geometry of Joint Topology
Element class are defining the element between classes and they are able to present nodes of
beam, column and link element like joint. It is also allowing the modelling of different
boundary conditions such as flexible foundations, seismic isolation, structural
gapping/pounding and so forth. Link elements represent the connection of beam to column
nodes. Its connect two initially coincide structural nodes and require the definition of an

ANALYSIS OF COMPUTATIONAL RESULTS
MOHD FAZAULNIZAM BIN SHAMSUDIN 50
independent force-displacement (or moment-rotation) response curve for each its local six
degrees of freedom (F1,F2,F3,M1,M2,M3). In this analysis, only M2 is interested and
implemented by several definitions of Modified Richard-Abbott with thirty parameters as
specified in Table 3.3
The ideal number of section fibres used in equilibrium computations assigned at each of the
element´s integration sections is defined as shown in Table 3.2. The section fibres are to
guarantee an adequate reproduction of the stress-strain distribution across the element´s model
cross-section as illustrated in Figure 3.5.
Table 3.2 Discretization parameters
Section Integration Section Section Fibres
IPE 360 5 200
HEA 320 10 200
Figure 3.5 Section Discretization Pattern

ANALYSIS OF COMPUTATIONAL RESULTS
MOHD FAZAULNIZAM BIN SHAMSUDIN 51
Table 3.3 Model parameters for Modified Richard-Abbott model
Parameter Description
Ka (and Kd) or Kap ( and Kdp) Initial stiffness for the upper or lower
bound curve
Ma (and Md) or Map (and Mdp) Strength for the upper or lower bound
curve
Kpa (and Kpd) or Kpap (and Kpdp) Post limit elastic stiffness for the
upper or lower bound curve
na (and nd) or nap (and ndp) Shape parameter for the upper or
lower bound curve
t1a and t1d Empirical parameters related to
pinching
t2a and t2d Empirical parameters related to
pinching
Ca and Cd Calibration parameters related to
pinching
iKa and iKd Empirical parameters related to the
stiffness damage rate
iMa and iMd Empirical parameters related to the
strength damage rate
Ha and Hd Empirical coefficient defining the
level of isotropic hardening
Emaxa (and Emaxd) Maximum value of deformation
reached in the loading history
The model must be experienced loading and unloading branches which can be either large or
small according to load protocol. To illustrate and validate the model parameter, the
numerical analyses were compared with the real experimental test. The joint was assigned
with its properties defined in Table 3.4 considering stiffness and strength damage rate.
ANALYSIS OF COMPUTATIONAL RESULTS
MOHD FAZAULNIZAM BIN SHAMSUDIN 52
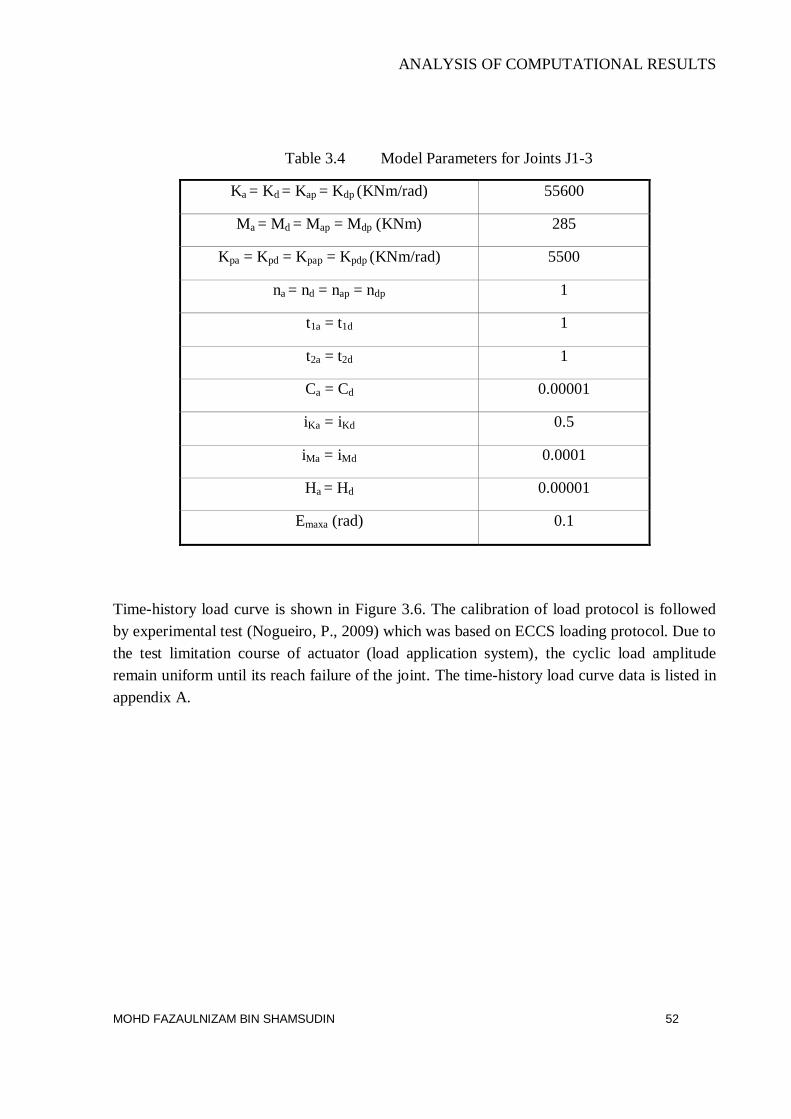
Table 3.4 Model Parameters for Joints J1-3
Ka = Kd = Kap = Kdp (KNm/rad) 55600
Ma = Md = Map = Mdp (KNm) 285
Kpa = Kpd = Kpap = Kpdp (KNm/rad) 5500
na = nd = nap = ndp 1
t1a = t1d 1
t2a = t2d 1
Ca = Cd 0.00001
iKa = iKd 0.5
iMa = iMd 0.0001
Ha = Hd 0.00001
Emaxa (rad) 0.1
Time-history load curve is shown in Figure 3.6. The calibration of load protocol is followed
by experimental test (Nogueiro, P., 2009) which was based on ECCS loading protocol. Due to
the test limitation course of actuator (load application system), the cyclic load amplitude
remain uniform until its reach failure of the joint. The time-history load curve data is listed in
appendix A.

ANALYSIS OF COMPUTATIONAL RESULTS
MOHD FAZAULNIZAM BIN SHAMSUDIN 53
Figure 3.6 Time-History Load Curve

ANALYSIS OF COMPUTATIONAL RESULTS
MOHD FAZAULNIZAM BIN SHAMSUDIN 54
3.3.2 Comparison of Experimental and SeismoStruct Analysis
In this section, relevant information from experimental test (Nogueiro, P., 2009) that is
pertinent to the analysis made is presented to validate the analytical approach. This was
undertaken to facilitate the discussion of results and to highlight some comparative aspects of
the cyclic behaviour. All analysis presented in this section were evaluation of extended end-
plate moment connections. The experimental test of cyclic curves presented in Figure 3.7.
Figure 3.7 Experimental Moment-Rotation Curve
The result of the analytical analysis is shown in Figure 3.8. Theoretically, hysteretic curves
comprising upper and lower bounds which represents loading and unloading load paths while
the prediction of moment resistance and the stiffness of the connection are related to the size
of the connected members, types of joints and orientation of the column axis.
-400
-300
-200
-100
0
100
200
300
400
-40 -30 -20 -10 0 10 20 30
Ben
din
g M
om
ent
(kN
m)
Rot (mrad)
____ Experimental
test

ANALYSIS OF COMPUTATIONAL RESULTS
MOHD FAZAULNIZAM BIN SHAMSUDIN 55
Figure 3.8 Numerical Moment-Rotation Curve
By inspection of the diagrams in Figure 3.9, it can be seen that the experimental and
analytical cyclic curves behave in similar pattern and match with each other in their last cyclic
curve lines. The comparison validates analytical results and corresponding results can be used
to implement in numerical approach. In addition, the cyclic load pattern gives very good
prediction for the energy dissipation capacity of the analysed connections.
Figure 3.9 Comparison between Experimental and Numerical Moment-Rotation Curve
-500
-400
-300
-200
-100
0
100
200
300
400
-30 -20 -10 0 10 20 30
Ben
din
g M
om
ent
(kN
m)
Rotation (mrad)
Analytical analysis
-500
-400
-300
-200
-100
0
100
200
300
400
-40 -30 -20 -10 0 10 20 30
Be
nd
ing
Mo
me
nt
(kN
m)
Rot (mrad)
____ Experimental
test
____ Analytical
results
____Analytical
results

ANALYSIS OF COMPUTATIONAL RESULTS
MOHD FAZAULNIZAM BIN SHAMSUDIN 56
3.3.3 Numerical Study Based on Modified Richard-Abbott Model
The first branch stiffness is identical to the initial stiffness of a non-linear behaviour and
it is defined in Modified Richard-Abbott as the following formula (Nogueiro, P., 2009):
1 /
0
..
.1
p
pNN
p
k kM k
k k
M
(3.1)
1
0
ln 2
lnp
p
NkM
M k k
(3.2)
With the application of formula aforementioned above, Figure 3.10 shows the initial stiffness
of moment-rotation curve. Its can be observed that joint behave in a ductile manner while
experiencing the loading. Yield point was observed of the connection of approximately
116.90 kN.m. Table 3.5 shown the data inclination of bending moment-rotation at the joint.
Figure 3.10 Intial Stiffness Numerical Moment-Rotation Curve
-20
0
20
40
60
80
100
120
140
160
-1 0 1 2 3 4 5
Ben
din
g M
om
en
t (k
Nm
)
Rotation (mrad)
Numerical approach
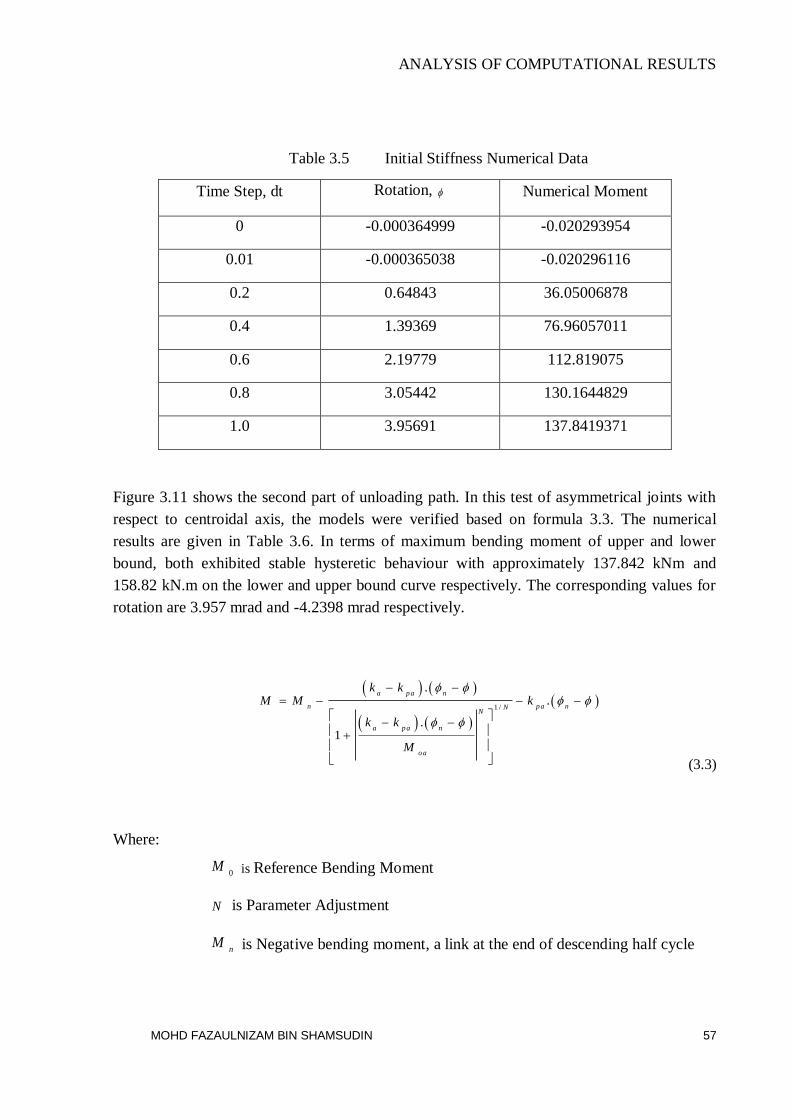
ANALYSIS OF COMPUTATIONAL RESULTS
MOHD FAZAULNIZAM BIN SHAMSUDIN 57
Table 3.5 Initial Stiffness Numerical Data
Time Step, dt Rotation, Numerical Moment
0 -0.000364999 -0.020293954
0.01 -0.000365038 -0.020296116
0.2 0.64843 36.05006878
0.4 1.39369 76.96057011
0.6 2.19779 112.819075
0.8 3.05442 130.1644829
1.0 3.95691 137.8419371
Figure 3.11 shows the second part of unloading path. In this test of asymmetrical joints with
respect to centroidal axis, the models were verified based on formula 3.3. The numerical
results are given in Table 3.6. In terms of maximum bending moment of upper and lower
bound, both exhibited stable hysteretic behaviour with approximately 137.842 kNm and
158.82 kN.m on the lower and upper bound curve respectively. The corresponding values for
rotation are 3.957 mrad and -4.2398 mrad respectively.
1 /
..
.1
a pa n
n pa nNN
a pa n
oa
k kM M k
k k
M
(3.3)
Where:
0M is Reference Bending Moment
N is Parameter Adjustment
nM is Negative bending moment, a link at the end of descending half cycle

ANALYSIS OF COMPUTATIONAL RESULTS
MOHD FAZAULNIZAM BIN SHAMSUDIN 58
Figure 3.11 Lower and Upper Numerical Moment-Rotation Curve
Table 3.6 Lower and Upper Numerical Data
Time Step, dt Rotation, Numerical Moment
1.0 3.95691 137.8419371
1.5 2.34458 48.21068312
2.0 0.67799 -42.531561
2.5 -1.60788 -128.5884013
3.0 -4.2399 -159.58241
The complete curve in the Figure 3.12 is calculated in the same formula by replacing
,n n
M by ,p p
M and the parameters 0 aM , a
k and p ak by the corresponding values
evaluated at unloading, 0 dM , d
k and p dk . The semi-rigid joint exhibited adequate stable
hysteretic behaviour with large ductility levels. The test was terminated at a displacement
19.61559 . Table 3.7 shows the cyclic data including upper and lower bound curve of the
numerical approach.
-200
-150
-100
-50
0
50
100
150
200
-6 -4 -2 0 2 4 6
Ben
din
g M
om
ent
(kN
m)
Rotation (mrad)
Numerical approach

ANALYSIS OF COMPUTATIONAL RESULTS
MOHD FAZAULNIZAM BIN SHAMSUDIN 59
Figure 3.12 Complete Numerical Moment-Rotation Curves
Table 3.7 Complete Numerical Curves Data
Time Step, dt Rotation, Numerical Moment
1.0 3.95691 137.8419371
2.0 0.67799 -42.531561
4.0 -0.56173 42.17209655
6.0 1.75529 -136.8833392
8.0 -1.85219 143.0853446
10 2.53413 -174.071674
12 -2.76341 184.829574
14 3.16423 -203.4349711
16 -3.19526 184.6653086
17 19.61559 310.6611397
-400
-300
-200
-100
0
100
200
300
400
-30 -20 -10 0 10 20 30
Be
nd
ing
Mo
me
nt
(kN
m)
Rotation (mrad)
Numerical approach

ANALYSIS OF COMPUTATIONAL RESULTS
MOHD FAZAULNIZAM BIN SHAMSUDIN 60
3.3.4 Comparison of SeismoStruct Analysis and Analytical Implementation of Model
On the basis of this verification it can be stated that the joint gives good prediction for
the initial part of the moment-rotation curve, the moment capacity. However, it is very
obvious that the yielding point slightly differ while experiencing loads as shown in Figure
3.13. The gaps between the values are probably due to the analysis implementation done in
SeismoStruct that could be differed from numerical approach and the geometrical model
itself. The comparison between analytical and numerical initial stiffness data is shown in
Table 3.8.
Figure 3.13 Comparison between Analytical and Numerical Initial Curve
-20
0
20
40
60
80
100
120
140
160
-1 0 1 2 3 4 5
Ben
din
g M
om
ent
(kN
m)
Rotation (mrad)
Analytical results
Numerical approach

ANALYSIS OF COMPUTATIONAL RESULTS
MOHD FAZAULNIZAM BIN SHAMSUDIN 61
Table 3.8 Comparison between Analytical and Numerical Initial Stiffness Data
Time Step, dt Rotation, Numerical Analytical % Error
0 -0.000364999 -0.020293954 -0.02031851 -0.121001555
0.01 -0.000365038 -0.020296116 -0.02037163 -0.372061334
0.2 0.64843 36.05006878 32.72908324 9.212147584
0.4 1.39369 76.96057011 63.7501562 17.16517158
0.6 2.19779 112.819075 91.51311104 18.88507237
0.8 3.05442 130.1644829 116.3666166 10.60033121
1.0 3.95691 137.8419371 138.6804326 -0.608302174
The unloading curve for the first branch experienced almost similar results before reach to the
second part of post-limit stiffness as shown in Figure 3.14. Its means that the zone model
gives very good prediction for the unloading stiffness of the analysed connections. The
second lower bound shows the similar cyclic behaviour as in the initial rotational stiffness. Its
behaviour must be influenced by the interaction of earlier cycle and generate a reversal
moment-rotation pattern. While the joint is preceded by loading, the ascending behaviour
results the similar pattern on the curve line. This is also due to the interaction of the
descending pattern at the first branch. Simply said that the initial stiffness of the connection is
very similar at the beginning but became slightly in gap after proceeding to yielding point.
The phenomena curve pattern can judge on the beam-column connection and joint
geometrical topology on both type of implementation.

ANALYSIS OF COMPUTATIONAL RESULTS
MOHD FAZAULNIZAM BIN SHAMSUDIN 62
Figure 3.14 Comparison between Analytical and Numerical of Lower and Upper
Curve
Table 3.9 Comparison between Analytical and Numerical of Lower and Upper
Data
Time Step, dt Rotation, Numerical Analytical
1.0 3.95691 137.8419371 138.6804326
1.5 2.34458 48.21068312 49.03374664
2.0 0.67799 -42.531561 -37.59827671
2.5 -1.60788 -128.5884013 -112.5232063
3.0 -4.2399 -159.58241 -168.2731755
The complete comparison curves of cyclic behaviour can be seen in Figure 3.15. Numerical
curves are slightly downward as compared to analytical analysis. However, the cyclic pattern
connection displayed a great deal of ductility and energy dissipation capacity.
-200
-150
-100
-50
0
50
100
150
200
-6 -4 -2 0 2 4 6
Be
nd
ing
Mo
me
nt
(kN
m)
Rotation (mrad)
Numerical approach
Analytical results

ANALYSIS OF COMPUTATIONAL RESULTS
MOHD FAZAULNIZAM BIN SHAMSUDIN 63
Figure 3.15 Complete comparison between analytical and numerical curve
Table 3.10 Complete Comparison between Analytical and Numerical Data
Time Step, dt Rotation, Numerical Analytical
1.0 3.95691 137.8419371 138.6804326
2.0 0.67799 -42.531561 -37.59827671
4.0 -0.56173 42.17209655 31.07797965
6.0 1.75529 -136.8833392 -97.27326898
8.0 -1.85219 143.0853446 102.5689259
10 2.53413 -174.071674 -140.413437
12 -2.76341 184.829574 153.0530765
14 3.16423 -203.4349711 -175.3135119
16 -3.19526 184.6653086 176.979478
17 19.61559 310.6611397 345.1613924
-500
-400
-300
-200
-100
0
100
200
300
400
-30 -20 -10 0 10 20 30
Be
nd
ing
Mo
me
nt
(kN
m)
Rotation (mrad)
Numerical approach
Analytical results

ANALYSIS OF COMPUTATIONAL RESULTS
MOHD FAZAULNIZAM BIN SHAMSUDIN 64
3.3.5 Parameter Sensitivity by Applying Solver Approach
In this section, the sensitivity of certain parameters is investigated by implementing
spreadsheet solver. This is done by minimizing the sum of moment errors by changing the
input parameters in Modified Richard-Abbott model in order to find the similar results and
matching the cyclic curves. In this case, initial stiffness (Ka and Kd) and post limit elastic
stiffness (Kpa and Kpd) are involved. The percentages of error were calculated to find the
differences between analytical and solver approach. The results were analysed and discussed
whether this approach can be used to fit the curves. The Figure 3.16 shows the initial
ascending curve resulted by solver analysis.
Figure 3.16 Initial Stiffness Solver Moment-Rotation Curve
Figure 3.17 shows the comparison of three results by analytical, numerical and solver
analysis. The data are tabulated in Table 3.11. It shows a good and closer values between
analytical and solver analysis. The parameters, Ka and Kd are reduced to 43549.05 kNm/rad
and Kpa and Kpd are aslo reduced to 4940.33 kNm/rad from original parameters.
-20
0
20
40
60
80
100
120
140
-1 0 1 2 3 4 5
Ben
din
g M
om
ent
(kN
m)
Rotation (mrad)
Solver results
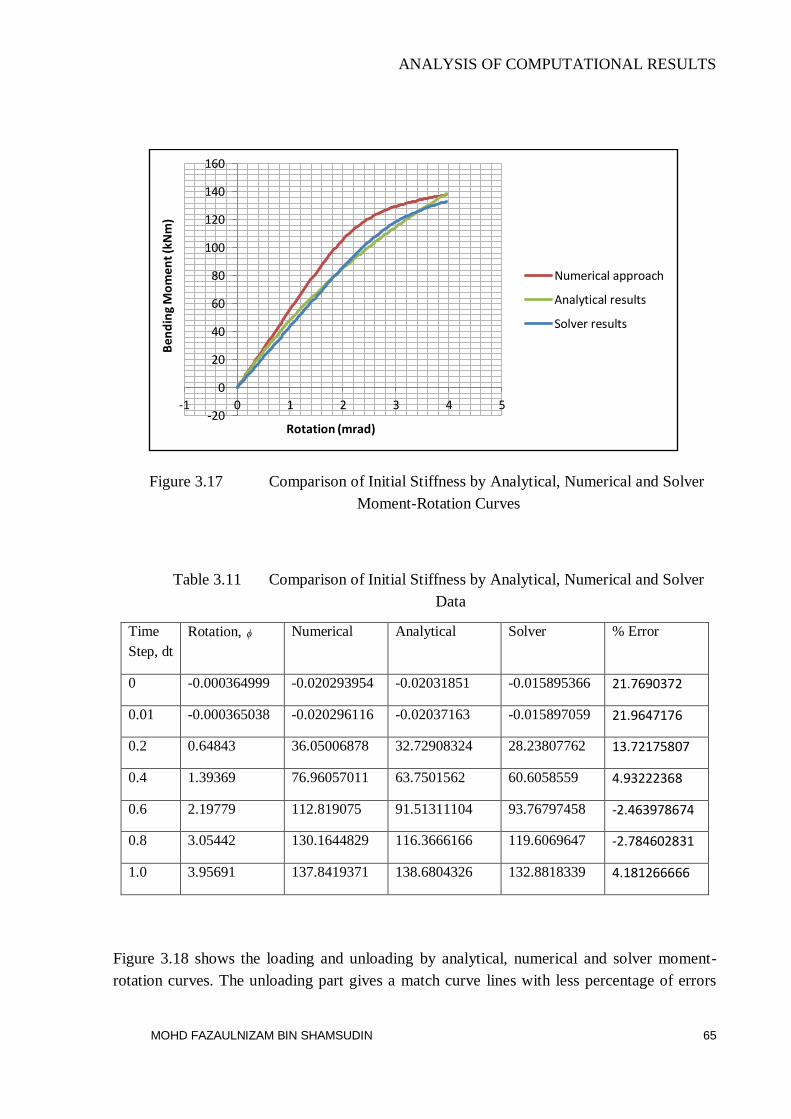
ANALYSIS OF COMPUTATIONAL RESULTS
MOHD FAZAULNIZAM BIN SHAMSUDIN 65
Figure 3.17 Comparison of Initial Stiffness by Analytical, Numerical and Solver
Moment-Rotation Curves
Table 3.11 Comparison of Initial Stiffness by Analytical, Numerical and Solver
Data
Time
Step, dt
Rotation, Numerical Analytical Solver % Error
0 -0.000364999 -0.020293954 -0.02031851 -0.015895366 21.7690372
0.01 -0.000365038 -0.020296116 -0.02037163 -0.015897059 21.9647176
0.2 0.64843 36.05006878 32.72908324 28.23807762 13.72175807
0.4 1.39369 76.96057011 63.7501562 60.6058559 4.93222368
0.6 2.19779 112.819075 91.51311104 93.76797458 -2.463978674
0.8 3.05442 130.1644829 116.3666166 119.6069647 -2.784602831
1.0 3.95691 137.8419371 138.6804326 132.8818339 4.181266666
Figure 3.18 shows the loading and unloading by analytical, numerical and solver moment-
rotation curves. The unloading part gives a match curve lines with less percentage of errors
-20
0
20
40
60
80
100
120
140
160
-1 0 1 2 3 4 5
Be
nd
ing
Mo
me
nt
(kN
m)
Rotation (mrad)
Numerical approach
Analytical results
Solver results

ANALYSIS OF COMPUTATIONAL RESULTS
MOHD FAZAULNIZAM BIN SHAMSUDIN 66
between analytical and solver analysis. The second part of descending also shows a similar
pattern between these two curves. On the other hand, the initial stiffness, Ka and Kd is
increased to 51885.07 kNm/rad and post-limit stiffness, Kpa and Kpd is decreased to 4918.30
kNm/rad as compared to the first curve. However, both branches reduced the initial and post
stiffness parameters from the original inputs.
Figure 3.18 Comparison of Loading and Unloading by Analytical, Numerical and
Solver Moment-Rotation Curves
Table 3.12 Comparison of Loading and Unloading by Analytical, Numerical and
Solver Data
Time
Step,
dt
Rotation, Numerical Analytical Solver % Error
1.0 3.95691 137.8419371 138.6804326 135.1679921 2.53275854
1.5 2.34458 48.21068312 49.03374664 54.19516582 -10.52625902
2.0 0.67799 -42.531561 -37.59827671 -31.03493414 17.45649839
2.5 -1.60788 -128.5884013 -112.5232063 -119.1184262 -5.861208649
3.0 -4.2399 -159.58241 -168.2731755 -153.739657 8.636859949
-200
-150
-100
-50
0
50
100
150
200
-6 -4 -2 0 2 4 6
Ben
din
g M
om
ent
(kN
m)
Rotation (mrad)
Solver results
Analytical results
Numerical approach

CONCLUSIONS AND RECOMMENDATIONS
MOHD FAZAULNIZAM BIN SHAMSUDIN 67
CHAPTER IV: CONCLUSIONS AND RECOMMENDATIONS
4.1 Conclusions
Based on the analytical and numerical investigation conducted on the bolted beam to
column connection the latter conclusions are discussed. The mechanical component ductility
cannot be denied that plays an important role as to sustain the strength of connection. The
column flange and the end plate in bending and the column web panel in shear are ductile
joint components. Therefore, the bolts in tension and shear and welds are typical examples of
brittle components. Thus, both types mode of failure should not interfere the strength of the
connection. It is also suggest that the experimental model should be avoided with any
distortion and damage due to site work which can cause certain gaps in results.
A component method design philosophy is taken directly from Eurocode 3 with strength
checks on steel, weld and bolts which are assemble to integrate as a one bolted joint. The
accurate calculation and observation should be made on joint behaviour when assembled
either react as individual component or behave in one structure. Indeed, there are many
consideration and analytical procedures on determination of joint response particularly
beyond the elastic limit of the moment-rotation curve. The cyclic behaviour of beam to
column joint plays an important aspect of a steel moment resisting framed structure especially
under seismic excitation.
The analytical results and numerical implementation demonstrated that the joints beam-
column connection is able to dissipate certain amount of energy capacity to withstand
inelastic deformations resulting from seismic forces. The numerical procedure which based on
Modified Richard-Abbott Model was developed in spreadsheet and presented in this
dissertation. SeismoStruct analyse the model by implementing stress-strain curve which based
on fibre model while Modified Richard-Abbott Model correlate with moment-rotation curve.
This could be the major reason differences between results since both implement and
analysing different approach. It is evident that initial and post-limit stiffness behaviour results
in different curvature as compared between analytical and numerical results.

CONCLUSIONS AND RECOMMENDATIONS
MOHD FAZAULNIZAM BIN SHAMSUDIN 68
The implementation of solver analysis when compared to analytical results does influence the
curvature lines. It can be said that in order to achieve similar curves between analytical and
solver analysis, certain amount of initial and post stiffness parameters should be reduced that
lead to match results. However, this theory is still weak since more analysis should be done to
improve the results.
The conclusion is that the relation of the components characteristics of the structure in respect
to the parameters model under seismic loads has major influences during the analysis of the
seismic resistance of the structure. It is obvious that the joint characteristic, that is the
geometrical and material properties, may have significant influence on the moment-rotation
behaviour of the joint.
4.2 Recommendations
There are still open questions in the field of beam to column extended end-plate connections.
On the basis of the research presented in this dissertation the following recommendations can
be given for further work:
i) Beam-Column joints assemblages in this study were designed according to model
parameters. In order to precisely getting the same results design and structure
modelling during experimental and software illustration must fit into each other
without any distortion and damage on the model during experimental tests.
ii) Due to the error or gap in the result, analytical procedures should be investigated
onto the numerical implementation. It is suggested to observed the root of the
Modified Richard-Abbott Model which certainly derive from stress-strain which
based on fibre analysis and correlating with moment-rotation numerical form.

MOHD FAZAULNIZAM BIN SHAMSUDIN 69
REFERENCES
Ádány S., “Numerical and Experimental Analysis of Bolted End-Plate Joints under
Monotonic and Cyclic Loading”, PhD thesis presented to the Budapest University of
Technology and Economics, (2000).
Ashraf, M. G. (1991). “Extended End-Plate Beam-Column Joints in Seismic Moment
Resisting Frames,” Degree Doctor of Philosophy Thesis, MacMaster University, Hamilton,
Ontario.
Beg M., Zupancic E. and Vayas I. (2004) “On the Rotation Capacity of Moment
Connections” Journal of Constructional Steel Research. 60, 601–620.
Boorse, M. R. (1999). “Evaluation of the Inelastic Rotation Capability of Flush End-Plate
Moment Connections,” Master of Science Thesis, Virginia Polytechnic Institute and State
University, Blacksburg, Virginia.
Dunai D.Sc., (2011) “Type Testing of Buckling Restrained Braces according to EN 15129”,
Final Report, Department of Structural Engineering, Budapest University of Technology and
Economics.
Elnashai, A.S. and Elghazouli, A.Y. (1994) “Seismic Behaviour of Semi-rigid Steel Frames”
Journal of Constructional Steel Research. 29, 149-174.
Elnashai, A.S., Elghazouli, A.Y. and Denesh-Ashtiani. F. A. (1998) “Response of Semi-rigid
Steel Frames to Cyclic and Earthquake Loads.” Journal of Structural Engineering. 857-867.
Gerami M., Saberi H., Saberi V. and Saedi Daryan A. (2011) “Cyclic Behavior of Bolted
Connections with Different Arrangement of Bolts” Journal of Constructional Steel Research.
67, 690–705.
Helena Gervásio., Simões da Silva, L. and Borges, L. (2004). Reliability Assessment of the
Post-Limit Stiffness and Ductility of Steel Joints. Journal of Constructional Steel Research.
60, 635-648.
MOHD FAZAULNIZAM BIN SHAMSUDIN 70
Kim, W. and Lu, W. (1992) “Hysteretic Analysis of Composite Beam-to-Column Joints”
Earthquake Engineering, Tenth World Conference. 4541-4546.
Kumar, S. and Rao, D.V. (August 1-6, 2004). Seismic Qualification of Semi-Rigid
Connections in Steel Frames. 13th World Conference on Earthquake EngineeringVancouver,
B.C., Canada. Paper No. 2149.
Mahmood, T. and Azman, H. (2008). Experimental Tests on Extended End-Plate Connections
with Variable Parameters. Steel Structures 8 (2008). 369-381.
Nogueiro, P., “Comportamento Cíclico de Ligações Metálicas”, PhD thesis presented to the
University of Coimbra, (2009).
Nogueiro, P. Simões da Silva, L., Bento, R and Simões, R., “Numerical implementation and
calibration of a hysteretic model with pinching for the cyclic response of steel joints”,
International Journal of Advanced Steel Construction 3(1). Pp. 459-484 (2007).
Nogueiro, P. Simões da Silva, L., Bento, R and Simões, R.,“Experimental behaviour of
standardised European end-plate beam-to-column steel joints under arbitrary cyclic loading”,
in Camotim, D. (ed.), Proceedings of SDSS’06 International Colloquium on Stability and
Ductility of Steel Structures, Lisboa, Portugal, 6-8 September (2006).
Ryan, J. C. (1999). “Evaluation of Extended End-Plate Moment Connections Under Seismic
Loading,” Master of Science Thesis, Virginia Polytechnic Institute and State University,
Blacksburg, Virginia.
Saqan, E. I. (December 1995). “Evaluation o Ductile Beam-Column Connections for use in
Seismic-Resistant Precast Frames,” Doctor of Philosophy Dissertation, The University of
Texas at Austin.
SeismoSoft (2011). SeismoStruct Version 5.2.2. SeismoSoft Ltd., Inc., Earthquake
Engineering Software Solutions, Pavia, Italy, [online]. Available from URL:
http://www.seismosoft.com.
Setia, S., Murty, C.V.R. and Sehgal V.K. (2008). Improved Configuration of Weak-Axis
Connections in Seismic Steel Moment Frames. The 14th World Conference on Earthquake
Engineering October 12-17, 2008, Beijing, China.
Shemy, S.B. and Sreekumar, S. (Sep-Oct. 2012) “A Ductility Model for Steel Connections.”
International Journal of Modern Engineering Research (IJMER). Vol.2, Issue.5, pp-3517-
3521. ISSN: 2249-6645.

MOHD FAZAULNIZAM BIN SHAMSUDIN 71
Simões da Silva, L. and Girão Coelho A. (2001) “A Ductility Model for Steel Connections.”
Journal of Constructional Steel Research. 57, 45–70.
Simões da Silva, L., Rebelo, C., and Mota, L., (2009) “Extension of the Component Method
to End-Plate Beam-to-Column Steel Joints Subjected to Seismic Loading” CC2009 – Special
Lecture, Madeira.
Steenhuis, M., Jaspart, J. P., Gomes, F. and Leino, T. (1998). Application of the Component
Method to Steel Joints, Proceedings of the Control of the Semi-Rigid Behaviour of Civil
Engineering Structural Connections Conference, ed. by R. Maquoi, COST C1, Liege,
Belgium. 125-143.
Sokol Z., Wald F., Delabre V., Muzeau J. P and Marek S. “Design of End Plate Joints Subject
to Moment and Normal Force”. Czech Technical University in Prague, Université Blaise
Pascal, CUST.
Yorgun, C. (2001) “Evaluation of Innovative Extended End-Plate Moment Connections under
Cyclic Loading”. Department of Civil Engineering, Istanbul Technical University. 483-492.

MOHD FAZAULNIZAM BIN SHAMSUDIN 72
APPENDIX A
Time-history curve values
Time Load Factor
0.01 0.
1. 0.00741061
2. 0.
3. -0.00834668
4. 0.
5. 0.01482121
6. 0.
7. -0.01669337
8. 0.
9. 0.02223182
10. 0.
11. -0.02504005
12. 0.
13. 0.02964243
14. 0.
15. -0.03338673
16. 0.
17. 0.02964243

MOHD FAZAULNIZAM BIN SHAMSUDIN 73
18. 0.
19. -0.03338673
20. 0.
21. 0.02964243
22. 0.
23. -0.03338673
24. 0.
25. 0.02964243
26. 0.
27. -0.03338673
28. 0.
29. 0.02964243
30. 0.
31. -0.03338673
32. 0.
33. 0.02964243
34. 0.
35. -0.03338673
36. 0.
37. 0.02964243
38. 0.
39. -0.03338673
40. 0.
41. 0.02964243
42. 0.

MOHD FAZAULNIZAM BIN SHAMSUDIN 74
43. -0.03338673
44. 0.
45. 0.02964243
46. 0.
47. -0.03338673
48. 0.
49. 0.02964243
50. 0.
51. -0.03338673
52. 0.
53. 0.02964243
54. 0.
55. -0.03338673
56. 0.
57. 0.02964243
58. 0.
59. -0.03338673
60. 0.
61. 0.02964243
62. 0.
63. -0.03338673
64. 0.
65. 0.02964243
66. 0.
67. -0.03338673

MOHD FAZAULNIZAM BIN SHAMSUDIN 75
68. 0.
69. 0.02964243
70. 0.
71. -0.03338673
72. 0.
73. 0.02964243
74. 0.
75. -0.03338673
76. 0.
77. 0.02964243
78. 0.
79. -0.03338673
80. 0.
81. 0.02964243
82. 0.
83. -0.03338673
84. 0.
85. 0.02964243
86. 0.
87. -0.03338673