analytical support for the statewide multimodal long-range transportation plan prepared for the...
TRANSCRIPT

Analytical Support Analytical Support for the Statewide for the Statewide Multimodal Long-Multimodal Long-
Range Range Transportation Plan Transportation Plan
Prepared for the Systems and Information Engineering Design Prepared for the Systems and Information Engineering Design SymposiumSymposium
University of VirginiaUniversity of Virginia
April 26, 2003April 26, 2003
AuthorsAuthorsMohammed A. Ba-Ali
Brister B. Barrett David A. Cowden
Jared T. Zane Prof. James H. Lambert
Kenneth D. Peterson (BS/MS Student)C. Ariel Pinto (MS Student)
Center for Risk Management of Engineering Systems and
Department of Systems and Information Engineering,
University of Virginia

Problem StatementProblem Statement
Need for analytical methods to Need for analytical methods to improve the coordination among the improve the coordination among the
various modal transportation agencies various modal transportation agencies of the Commonwealth of Virginiaof the Commonwealth of Virginia

1.1. Process of case studiesProcess of case studies
2.2. Aviation case studyAviation case study
3.3. Public transit case studyPublic transit case study
4.4. Port case studyPort case study
5.5. Rail case studyRail case study
6.6. Multimodal systems integrationMultimodal systems integration
OverviewOverview
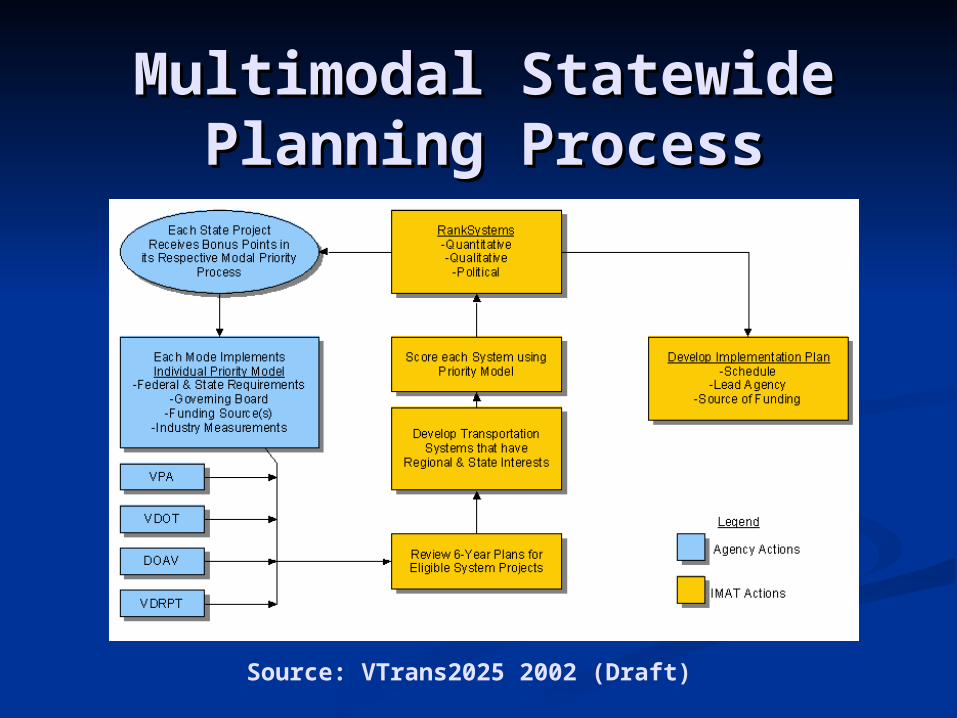
Multimodal Statewide Multimodal Statewide Planning ProcessPlanning Process
Source: VTrans2025 2002 (Draft)

Process of Case StudiesProcess of Case Studies
Collect projects from modal agencies Collect projects from modal agencies (aviation, public transit, port, rail)(aviation, public transit, port, rail)
Assess TEA-21 qualitative metrics for Assess TEA-21 qualitative metrics for each projecteach project
Select quantitative metrics for each modeSelect quantitative metrics for each mode Assess quantitative metrics for each Assess quantitative metrics for each
projectproject Interpret and study the portfolios of Interpret and study the portfolios of
projectsprojects

TEA-21 Qualitative TEA-21 Qualitative MetricsMetrics
EC: Economic competitiveness FR: Fiscal responsibility IM: Intermodalism and mobility QL: Quality of life SM: Systems management SS: Safety and security
Aviation Case Aviation Case StudyStudy

Aviation Data CollectionAviation Data Collection Recorded project data Recorded project data
from VDOAVfrom VDOAV Description of the Description of the
projects for each airportprojects for each airport Project cost ($)Project cost ($) State funding State funding
(requested and (requested and recommended)recommended)
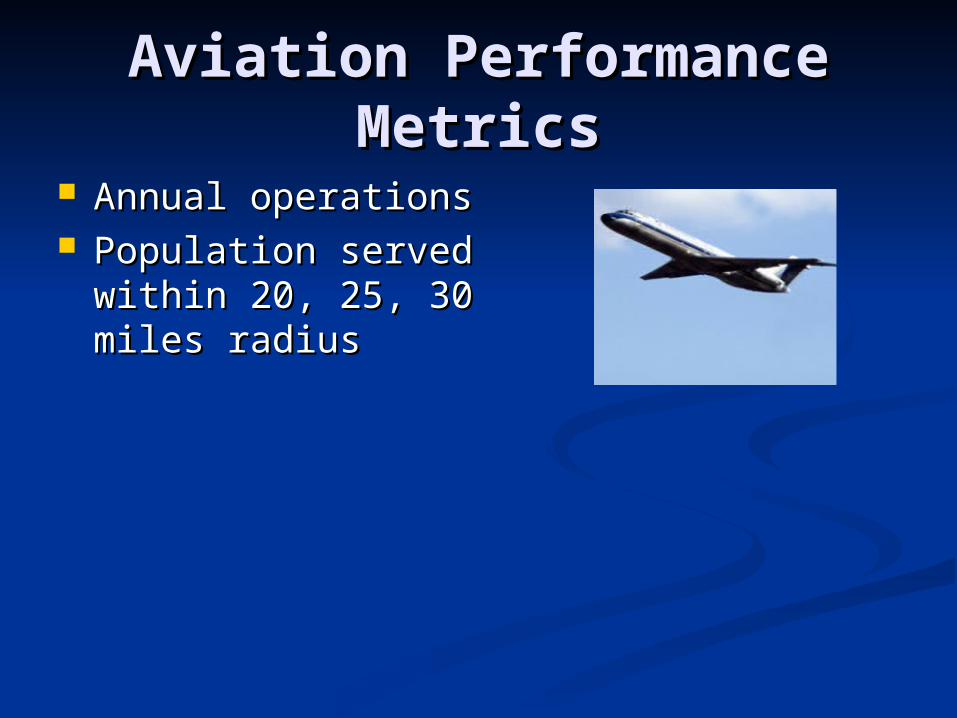
Aviation Performance Aviation Performance MetricsMetrics
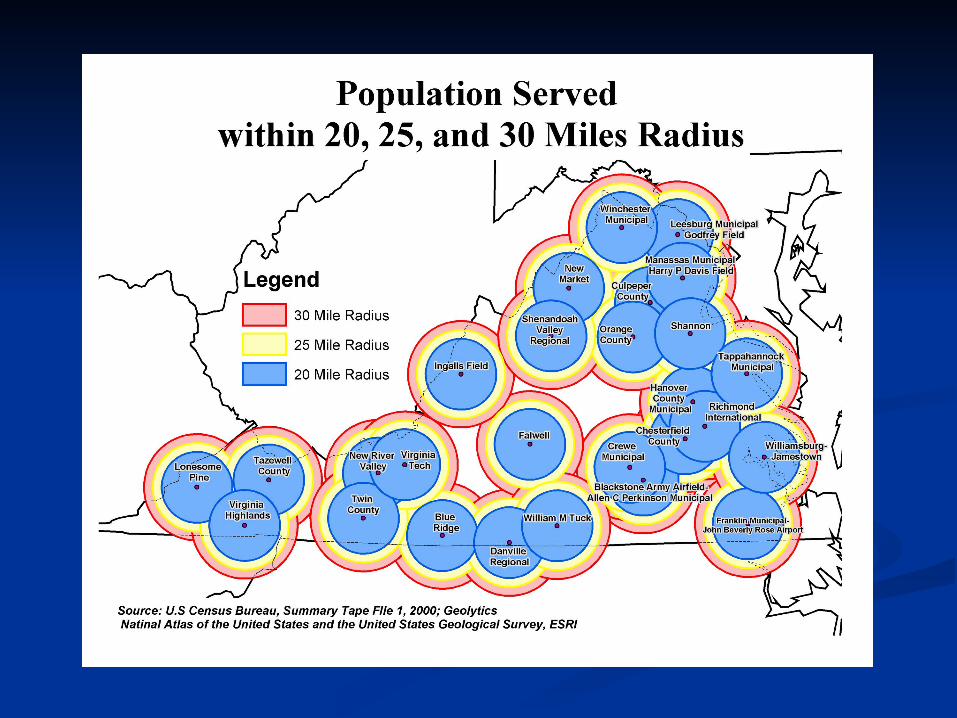
Annual operationsAnnual operations Population served Population served
within 20, 25, 30 miles within 20, 25, 30 miles radiusradius

Aviation Project DataAviation Project DataP
roje
ct I
D #
Sub
syst
em I
D#
Pri
mar
y A
ttri
bute
s
Lev
erag
ing
(%
non-
stat
e)
Cos
t ($
thou
ands
)
Ann
ual O
pera
tion
s in
thou
sand
s
Pop
ulat
ion
Ser
ved
wit
hin
20 M
iles
R
adiu
s (i
n th
ousa
nds)
Pop
ulat
ion
Ser
ved
wit
hin
25 M
iles
R
adiu
s (i
n th
ousa
nds)
Pop
ulat
ion
Ser
ved
wit
hin
30 M
iles
R
adiu
s (i
n th
ousa
nds)
App
rove
d/D
isap
prov
ed
Des
crip
tion
Y X X` X``000001 000001 SM IM 91% 1648 152 851 950 997 Y Loop Roadways000002 000001 IM SM 95% 9495 152 851 950 997 Y Terminal Platform and Roadway000003 000001 SM SS 96% 44845 152 851 950 997 Y Terminal Building 000004 000001 SM QL 95% 5497 152 851 950 997 Y Terminal Fumishings000005 000001 SM IM 96% 24924 152 851 950 997 Y Concourse 'C' Expansion000006 000001 SM SS 96% 9674 152 851 950 997 Y Air Traffic Control Tower000007 000001 IM QL 96% 5646 152 851 950 997 Y Taxiway 'U' Extension000008 000001 SM SS 92% 138 21 209 248 367 Y Snow Removal Equipment Building000009 000002 IM SM 92% 400 21 209 248 367 Y Acquire Parcels 36 &40000010 000002 SS IM 100% 333 9 99 144 240 N Partial Parallel Taxway000011 000003 SS SM 100% 150 9 99 144 240 N Airport Layout Plan Update000012 000003 SM SS 100% 80 9 99 144 240 N Helipad & Perimeter Fencing 000013 000003 SM EC 100% 25 22 338 505 619 N Access Road Improvement000014 000004 IM SM 100% 445 22 338 505 619 N T-Hanger Site Preparation & Auto Parking Lot000015 000004 SS IM 20% 591 22 338 505 619 Y Apron Expansion000016 000004 SS QL 20% 3 22 338 505 619 Y Storm water Pollution Plan Update000017 000004 SM SS 100% 1500 9 163 191 258 N Apron Expansion000018 000005 SS SM 91% 500 14 169 296 410 Y Apron Rehabiliation 000019 000006 SM QL 100% 125 23 159 228 366 N West Side Airport Development (Design)000020 000007 SS SM 100% 180 23 159 228 366 N West Side Corporate Hanger Site Preparation (Construction)
000021 000007 EC SM 100% 1949 23 159 228 366 N West Side Airport Development (Construction)000022 000007 QL SM 100% 20 23 159 228 366 N West Side Corporate Hanger Site Preparation (Design)
000023 000007 SS SM 92% 250 23 159 228 366 Y FAR Part 77 Obstruction Removal 000024 000007 IM SM 100% 34 23 159 228 366 N West Side Auto Parking Area (Construction)000025 000007 QL SS 100% 150 23 159 228 366 N Obstruction Lighting000026 000007 QL EC 100% 6 23 159 228 366 N West Side Auto Parking Area (Design)000027 000007 SS SM 34% 10 6 95 156 221 Y Fuel Storage Tank & Card Reader
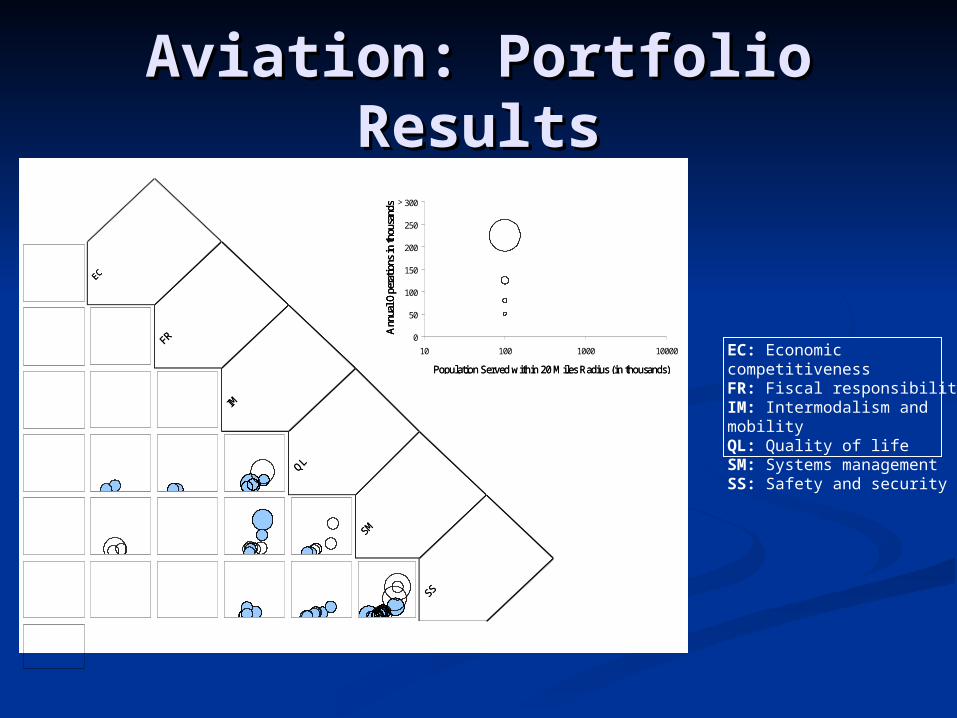
Aviation: Portfolio Aviation: Portfolio ResultsResults
Ann
ual O
pera
tions
in th
ousa
nds
Ann
ual O
pera
tions
in th
ousa
nds
Population Served within 20 Miles Radius (in thousands)
Ann
ual O
pera
tions
in th
ousa
nds
Population Served within 20 Miles Radius (in thousands)
0
50
100
150
200
250
300
10 100 1000 10000
>
> EC: Economic competitivenessFR: Fiscal responsibility IM: Intermodalism and mobilityQL: Quality of lifeSM: Systems managementSS: Safety and security
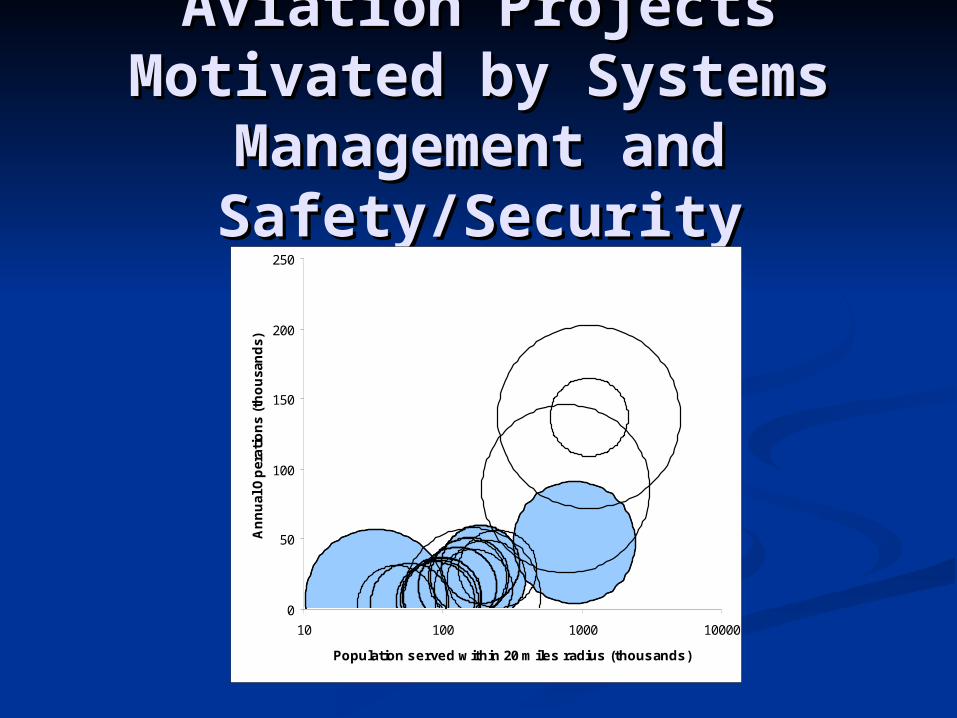
Aviation Projects Aviation Projects Motivated by Systems Motivated by Systems
Management and Management and Safety/SecuritySafety/Security
0
50
100
150
200
250
10 100 1000 10000
Population served within 20 miles radius (thousands)
An
nu
al O
per
atio
ns
(th
ou
san
ds)

Aviation: Count of Aviation: Count of ProjectsProjects
EC: Economic competitivenessFR: Fiscal responsibility IM: Intermodalism and mobilityQL: Quality of lifeSM: Systems managementSS: Safety and security
EC (4%
)
FR (1%
)
IM (1
5%)
2 2 6QL (1
9%)
3 9 7SM
(31%
)
7 11 26SS (3
0%)
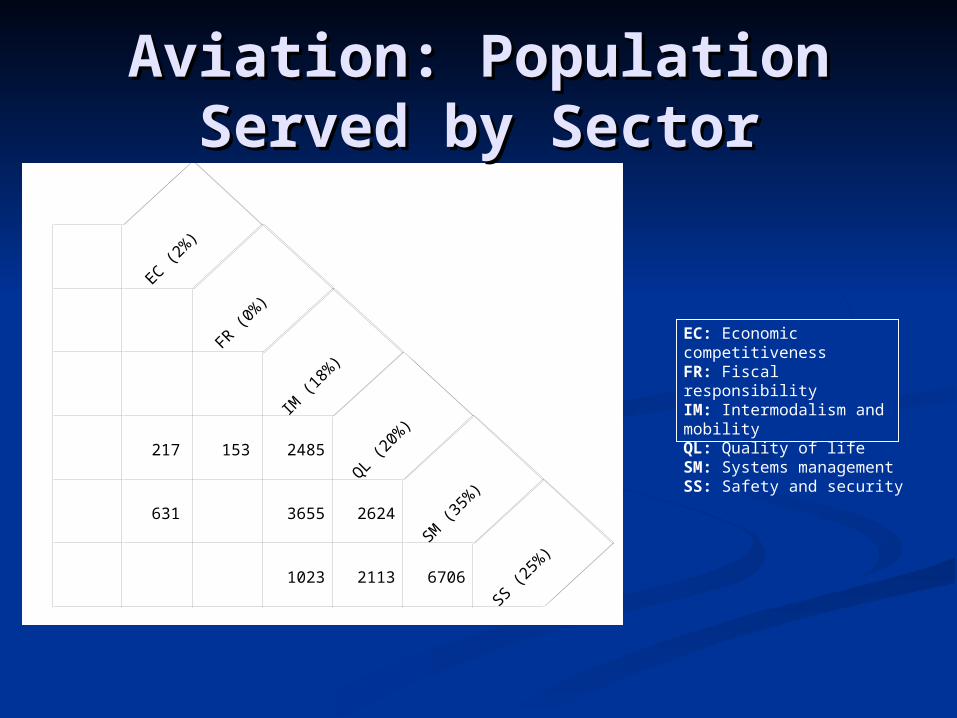
Aviation: Population Aviation: Population Served by SectorServed by Sector
EC (2%
)
FR (0%
)
IM (1
8%)
217 153 2485QL (2
0%)
631 3655 2624SM
(35%
)
1023 2113 6706SS (2
5%)
EC: Economic competitivenessFR: Fiscal responsibility IM: Intermodalism and mobilityQL: Quality of lifeSM: Systems managementSS: Safety and security

Public Transit Public Transit Case StudyCase Study
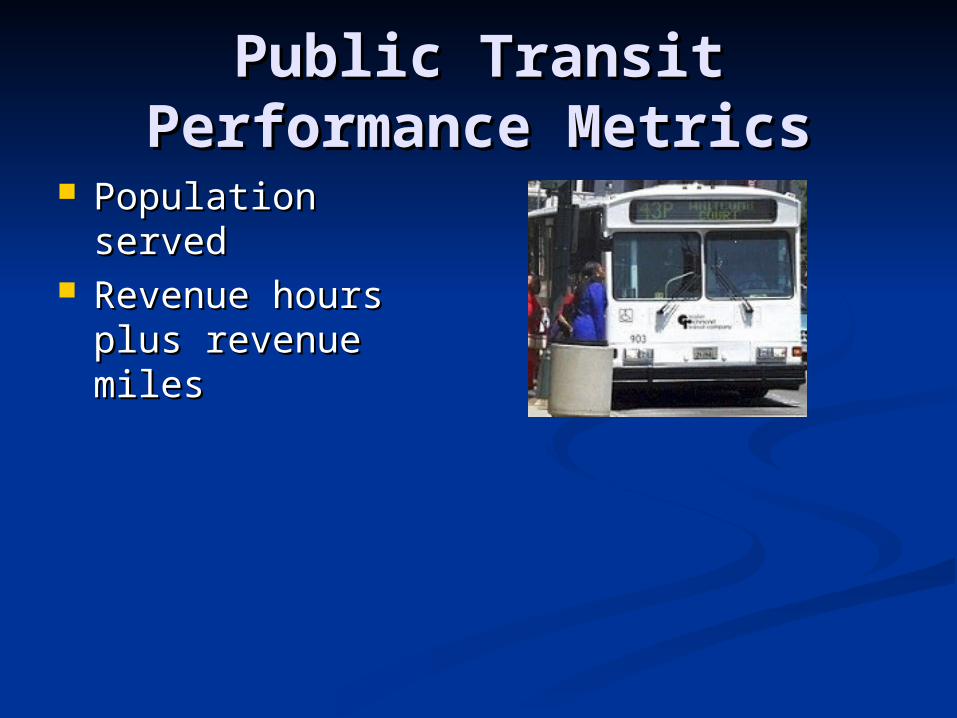
Public Transit Public Transit Performance MetricsPerformance Metrics
Population servedPopulation served Revenue hours Revenue hours
plus revenue milesplus revenue miles

Public Transit Project Public Transit Project DataData
000001 50 0% 18.4 103 IM SS Y 0003 Bristol City Bus000002 50 0% 6.5 59 IM SS Y 0012 Graham Transit - Town of Bluefield000003 4.2 0% 156.1 433 FR SM Y 0008 District III Governmental Cooperative000004 90 0% 156.1 433 SM IM Y 0008 District III Governmental Cooperative000005 230 0% 91.5 649 IM SS Y 0021 Mountain Empire Older Citizens - Wise Co. Area
000006 45 0% 46 26 IM SS Y 0027 Tazewell County Transportation000007 200 0% 40 515 SM QL Y 0005 Charlottesville Transit Service000008 2400 0% 40 515 IM SM Y 0005 Charlottesville Transit Service000009 818 0% 169.5 1530 IM SS Y 0019 JAUNT, Inc. - Charlottesville Area000010 371.44 0% 169.5 1530 QL SM Y 0019 JAUNT, Inc. - Charlottesville Area000011 77.3 0% 13.5 204 IM SS Y 0016 Greene County Transit000012 50 0% 53 90 IM SS Y 0001 Bay Transit - Gloucester County000013 250 0% 53 90 EC SM Y 0001 Bay Transit - Gloucester County000014 1045 0% 1343.3 12744 IM SS Y 0028 Transportation District Comm. Of Hampton Roads
000015 2390 0% 1343.3 12744 QL SM Y 0028 Transportation District Comm. Of Hampton Roads
000016 1679.708 0% 1343.3 12744 QL SM Y 0028 Transportation District Comm. Of Hampton Roads
000017 3045 0% 1343.3 12744 IM SS Y 0028 Transportation District Comm. Of Hampton Roads
000018 100 0% 45.7 270 IM SS Y 0009 Eastern Shore - Star Transit000019 1000 0% 45.7 270 EC SM Y 0009 Eastern Shore - Star Transit000020 22.371 0% 66.1 961 FR SM Y 0013 Greater Lynchburg Transit Company000021 100 0% 66.1 961 QL SM Y 0013 Greater Lynchburg Transit Company000022 93.125 0% 53.1 334 IM SS Y 0006 Danville Transit000023 143.142 0% 29.5 214 IM SS Y 0004 Central Virginia Transit - Cumberland Co.000024 100 0% 17.3 95 IM SS Y 0010 Farmville Area Bus000025 820 0% 1247.5 35320 EC SM Y 0022 Northern Virginia Transportation Commission
000026 22284.08 0% 1247.5 35320 FR SM Y 0022 Northern Virginia Transportation Commission
000027 246.2 0% 1247.5 35320 QL SM Y 0022 Northern Virginia Transportation Commission
000028 2800 0% 1247.5 35320 IM SM Y 0022 Northern Virginia Transportation Commission
000029 2000 0% 1247.5 35320 QL IM Y 0022 Northern Virginia Transportation Commission
000030 30 0% 1247.5 35320 QL EC Y 0022 Northern Virginia Transportation Commission

Public Transit: Portfolio Public Transit: Portfolio ResultsResults
EC
Rev
. Hrs
. plu
s R
ev. M
i. (i
n th
ousa
nds)
EC
Rev
. Hrs
. plu
s R
ev. M
i. (i
n th
ousa
nds)
FR
IM
Rev
. Hrs
. plu
s R
ev. M
i. (i
n th
ousa
nds)
FR
Population Served (in thousands)
IM
QL
Population Served (in thousands)
QL
SMSM
SSSS
0
2000000
4000000
6000000
8000000
10000000
12000000
10 100 1000 10000
>
>EC: Economic competitivenessFR: Fiscal responsibility IM: Intermodalism and mobilityQL: Quality of lifeSM: Systems managementSS: Safety and security
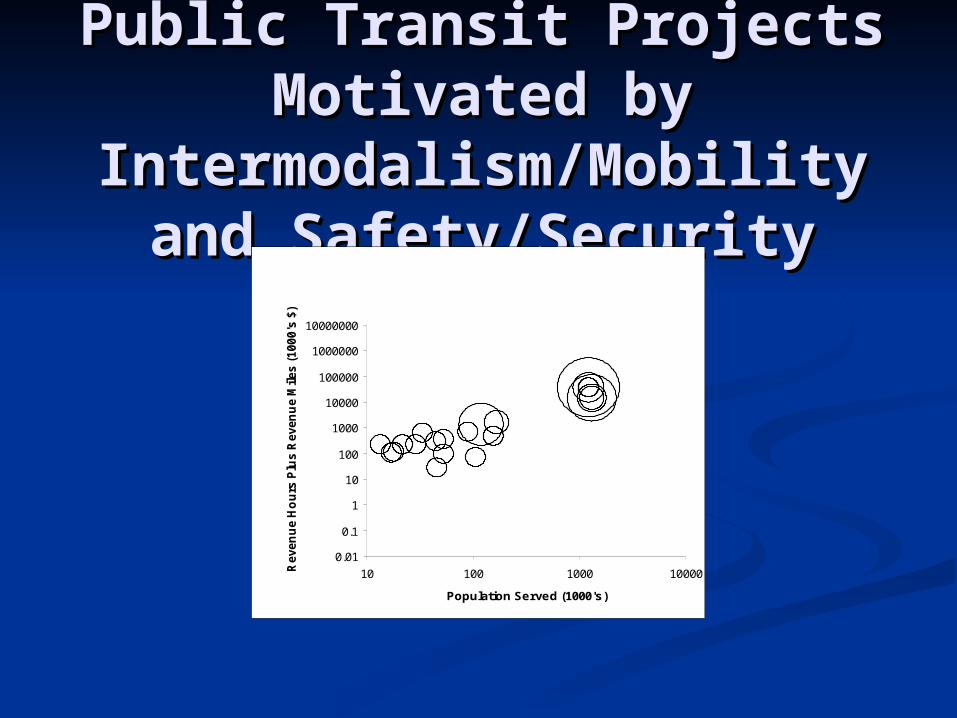
Public Transit Projects Public Transit Projects Motivated by Motivated by
Intermodalism/Mobility Intermodalism/Mobility and Safety/Securityand Safety/Security
0.01
0.1
1
10
100
1000
10000
100000
1000000
10000000
10 100 1000 10000
Population Served (1000's)
Reven
ue H
ou
rs P
lus R
even
ue M
iles (
1000's
$)
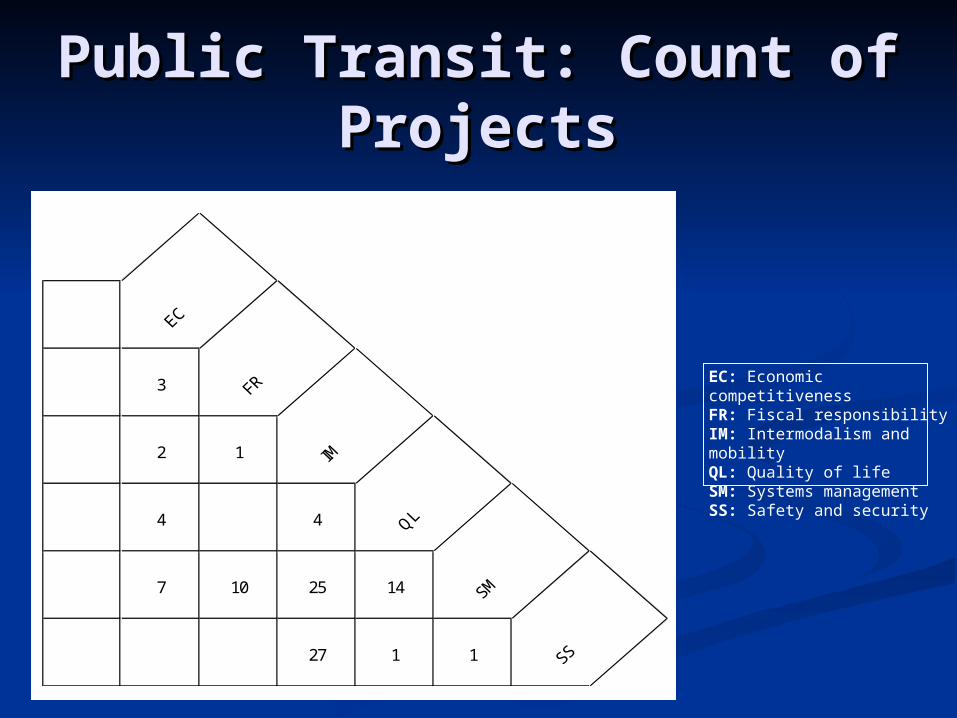
Public Transit: Count of Public Transit: Count of ProjectsProjects
3
2 1
4 4
7 10 25 14
27 1 1
EC: Economic competitivenessFR: Fiscal responsibility IM: Intermodalism and mobilityQL: Quality of lifeSM: Systems managementSS: Safety and security
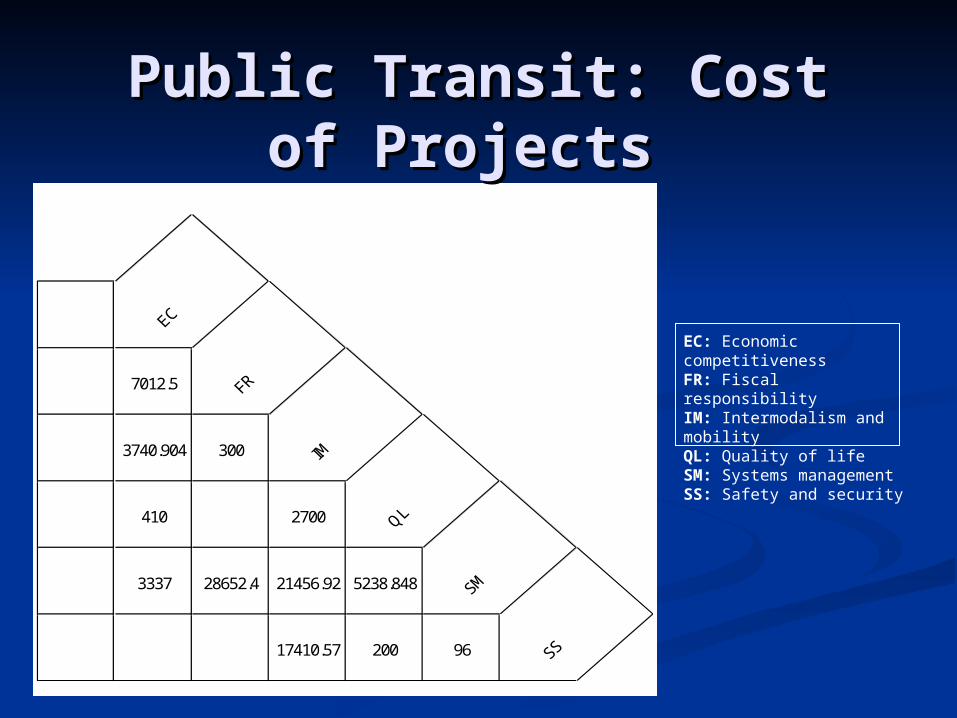
Public Transit: Cost of Public Transit: Cost of Projects Projects
7012.5
3740.904 300
410 2700
3337 28652.4 21456.92 5238.848
17410.57 200 96
EC: Economic competitivenessFR: Fiscal responsibility IM: Intermodalism and mobilityQL: Quality of lifeSM: Systems managementSS: Safety and security

Public Transit: Public Transit: Population Served by Population Served by
SectorSector
2535
2686.9 1247.5
3983 4990
5250.6 5494.9 22736.3 8913.4
12679.4 300.1 122.3
EC: Economic competitivenessFR: Fiscal responsibility IM: Intermodalism and mobilityQL: Quality of lifeSM: Systems managementSS: Safety and security
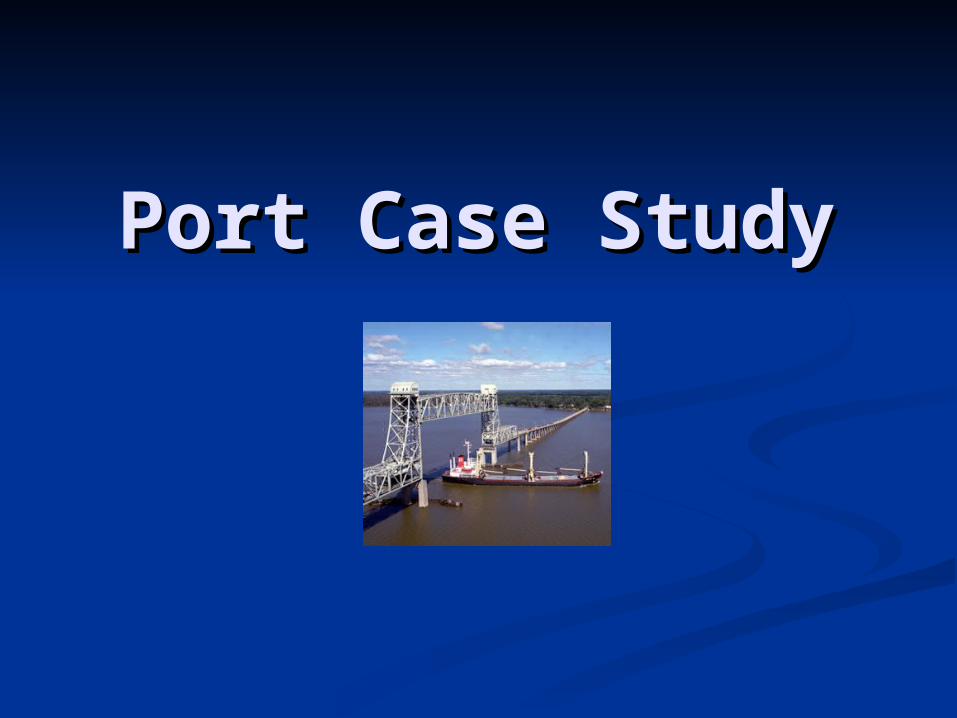
Port Case StudyPort Case Study

Port Performance Port Performance MetricsMetrics
Total tonnage per Total tonnage per yearyear
Total acresTotal acres

Port Project DataPort Project Data
Projec
t ID #
Cost (
$ tho
uand
s)
Lever
agin
g (%
non
-state
)
Popul
ation
Ser
ved w
ithin
30 M
iles R
adiou
s
Annua
l Ope
ratio
ns in
thou
sand
s
Primar
y Attr
ibutes
Inclu
de in
Com
paris
ons (
Y or N
)
Highl
ight
in G
raph
s? (Y
or N
)
Subsy
tem of
: Sys
tem ID
#
System
Des
crip
tion
1 66068 0% 811 42336883 SM IM Y Y 0001 Norfolk International Terminals2 14224 0% 811 42336883 IM SM Y Y 0001 Norfolk International Terminals3 8579 0% 811 42336883 IM SM Y Y 0001 Norfolk International Terminals4 8890 0% 811 42336883 IM SM Y Y 0001 Norfolk International Terminals5 80504 0% 811 42336883 SM IM Y Y 0001 Norfolk International Terminals6 5647 0% 811 42336883 SM IM Y Y 0001 Norfolk International Terminals7 3814 0% 811 42336883 SM IM Y Y 0001 Norfolk International Terminals8 89800 0% 811 42336883 SM EC Y Y 0001 Norfolk International Terminals9 22388 0% 811 42336883 IM EC Y Y 0002 Norfolk International Terminals
10 21804 0% 811 42336883 SM IM Y Y 0002 Norfolk International Terminals11 7920 0% 811 42336883 SM IM Y Y 0003 Norfolk International Terminals12 34382 0% 811 42336883 IM EC Y Y 0003 Norfolk International Terminals13 10627 0% 811 42336883 SM IM Y Y 0003 Norfolk International Terminals14 4469 0% 811 42336883 IM EC Y Y 0004 Norfolk International Terminals15 5539 0% 811 42336883 IM SM Y Y 0004 Norfolk International Terminals

Port: Portfolio ResultsPort: Portfolio Results
EC: Economic competitivenessFR: Fiscal responsibility IM: Intermodalism and mobilityQL: Quality of lifeSM: Systems managementSS: Safety and security

Port Projects Motivated Port Projects Motivated by Economic by Economic
Competitiveness and Competitiveness and Intermodalism/MobilityIntermodalism/Mobility
Total Tonnage per Year vs. Total Acres
0
10000000
20000000
30000000
40000000
50000000
60000000
70000000
0 200 400 600 800 1000 1200 1400
Total Acres
Tot
al T
onna
ge p
er Y
ear
Tota
l T
on
nag
e p
er
Year

Port: Count of Port: Count of ProjectsProjects
14
3 17
Grand Total: 34
EC: Economic competitivenessFR: Fiscal responsibility IM: Intermodalism and mobilityQL: Quality of lifeSM: Systems managementSS: Safety and security

Port: Cost of ProjectsPort: Cost of Projects
250000
132000 266000
Grand Total: 648000
EC: Economic competitivenessFR: Fiscal responsibility IM: Intermodalism and mobilityQL: Quality of lifeSM: Systems managementSS: Safety and security

Rail Case StudyRail Case Study

Rail Performance Rail Performance MetricsMetrics
• Track milesTrack miles• Total freight cars Total freight cars
on-line (per year)on-line (per year)

Rail Project DataRail Project Data
Projec
t ID #
Cost (
$ tho
uand
s)
Levera
ging (
% no
n-sta
te)
Track M
iles
Total F
reigh
t Cars
On-
Line (P
er W
eek)
Primary
Attr
ibutes
Inclu
de in
Com
paris
ons (
Y or N
)
Highlig
ht in
Graphs
? (Y or
N)
Coincid
ent w
ith H
ighway
Mod
e?
Coincid
ent w
ith A
viatio
n Mod
e?
Coincid
ent w
ith P
ort M
ode?
Coincid
ent w
ith P
ublic
Tran
sit M
ode?
Coincid
ent w
ith H
eavy
Rail
Mod
e?
Subsy
tem of
: Sys
tem ID
#
System
Des
cripti
on
0001 370,000 18% 118 225179 EC FR Y Y Y 0001 DC-Richmond (Main St. Station)0002 200000 0% 70 225179 FR IM Y Y Y Y 0002 Richmond-Newport News (Hampton Roads)0003 100,000 0% 30 225179 IM SM Y Y Y 0003 Richmond-Petersburg (Tri-Cities)0004 200,000 0% 84 184506 SM IM Y Y Y Y 0004 Petersburg-Norfolk(South Hampton Roads)0005 225,000 0% 70 225179 SM IM Y Y Y Y 0005 Petersburg-North Carolina Line0006 100,000 9% 480 184506 IM SM Y Y Y 0006 TransDominion Express0007 1,200,000 10% 250 184506 IM EC Y Y Y 0007 Virginia Railway Express0008 356000 0% 356 225179 IM SM Y Y Y 0008 I-81 Rail Corridor0009 3966 13% 39 450 SM EC Y Y Y 0009 Buckingham Branch Railroad0010 580 29% 16 1360 SM IM Y Y Y 0010 Commonwealth Railway0011 9608 5% 70 108760 SM IM Y Y Y Y 0011 Eastern Shore Railroad0012 480 0% 40 10000 SM EC Y Y Y 0012 North Carolina and Virginia Railroad0013 1130 46% 36 12540 FR SM Y Y Y Y 0013 Norfolk and Portsmouth Belt Line RR0014 6875 0% 30 300 IM EC Y Y Y 0014 Shenandoah Valley Railroad0015 7606 7% 75 1020 IM SM Y Y Y 0015 Virginia Southern Railroad0016 5958 10% 54 800 FR SM Y Y Y 0016 Winchester and Western Railroad

Rail: Portfolio ResultsRail: Portfolio Results
EC
Tot
al F
reig
ht C
ars
On-
Lin
e (P
er W
eek)
EC
Tot
al F
reig
ht C
ars
On-
Lin
e (P
er W
eek)
FR
IM
Tot
al F
reig
ht C
ars
On-
Lin
e (P
er W
eek)
FR
Track Miles
IM
QL
Track Miles
QL
SMSM
SSSS
0
50000
100000
150000
200000
250000
300000
10 100 1000
>
>EC: Economic competitivenessFR: Fiscal responsibility IM: Intermodalism and mobilityQL: Quality of lifeSM: Systems managementSS: Safety and security

Rail Projects Motivated Rail Projects Motivated by Systems by Systems
Management and Management and Intermodalism/MobilitIntermodalism/Mobilit
yy
0.01
50000.01
100000.01
150000.01
200000.01
250000.01
300000.01
350000.01
10 100 1000
Track Miles
Tot
al C
ars
On-
line

Rail: Count of ProjectsRail: Count of Projects
0 EC
0 1 FR
0 2 1 IM
0 0 0 0 QL
0 2 2 8 0 SM
0 0 0 0 0 0 SS
EC: Economic competitivenessFR: Fiscal responsibility IM: Intermodalism and mobilityQL: Quality of lifeSM: Systems managementSS: Safety and security

Rail: Cost of ProjectsRail: Cost of Projects
0 EC
0 370000 FR
0 1206875 200000 IM
0 0 0 0 QL
0 4446 7088 998794 0 SM
0 0 0 0 0 0 SS
EC: Economic competitivenessFR: Fiscal responsibility IM: Intermodalism and mobilityQL: Quality of lifeSM: Systems managementSS: Safety and security

Multimodal Systems Multimodal Systems IntegrationIntegration
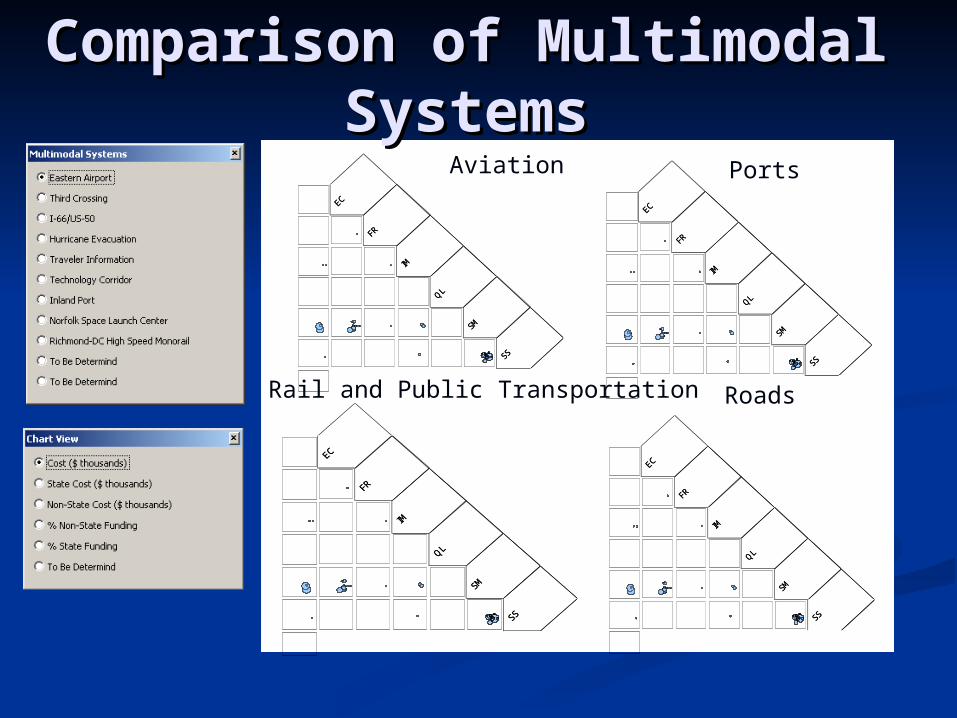
Comparison of Multimodal Comparison of Multimodal SystemsSystemsEC
FR
EC
FR
IM
QL
IM
QL
SM
SS
SM
SS
EC
FR
EC
FR
IM
QL
IM
QL
SM
SS
SM
SS
Aviation Ports
Rail and Public Transportation Roads
EC
FR
EC
FR
IM
QL
IM
QL
SM
SS
SM
SS
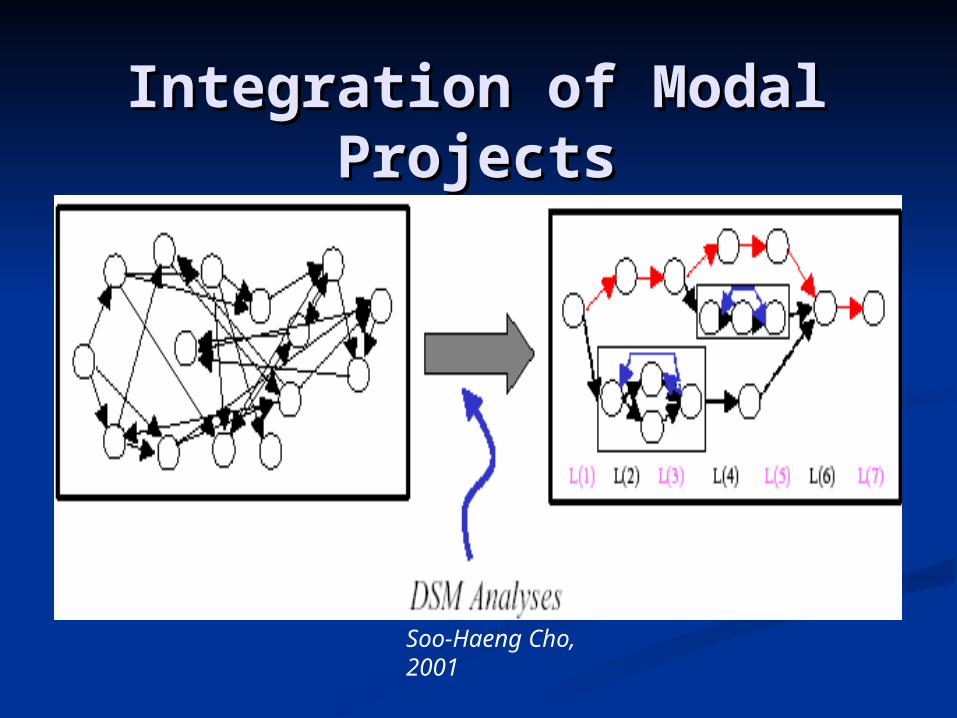
Integration of Modal Integration of Modal ProjectsProjects
Soo-Haeng Cho, 2001
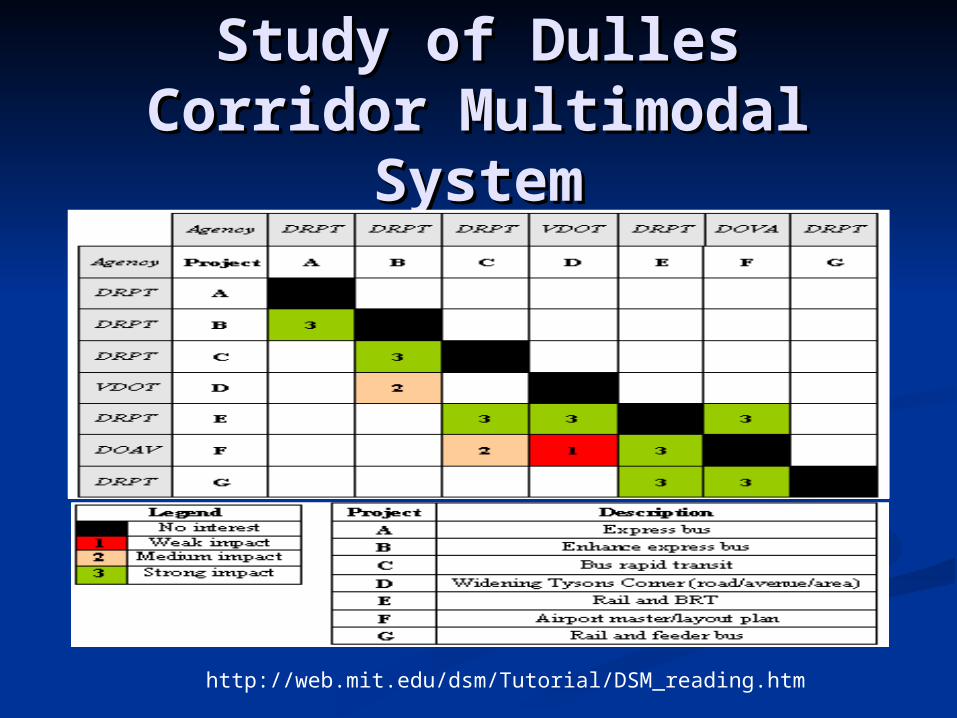
Study of Dulles Study of Dulles CorridorCorridor Multimodal Multimodal
SystemSystem
http://web.mit.edu/dsm/Tutorial/DSM_reading.htm
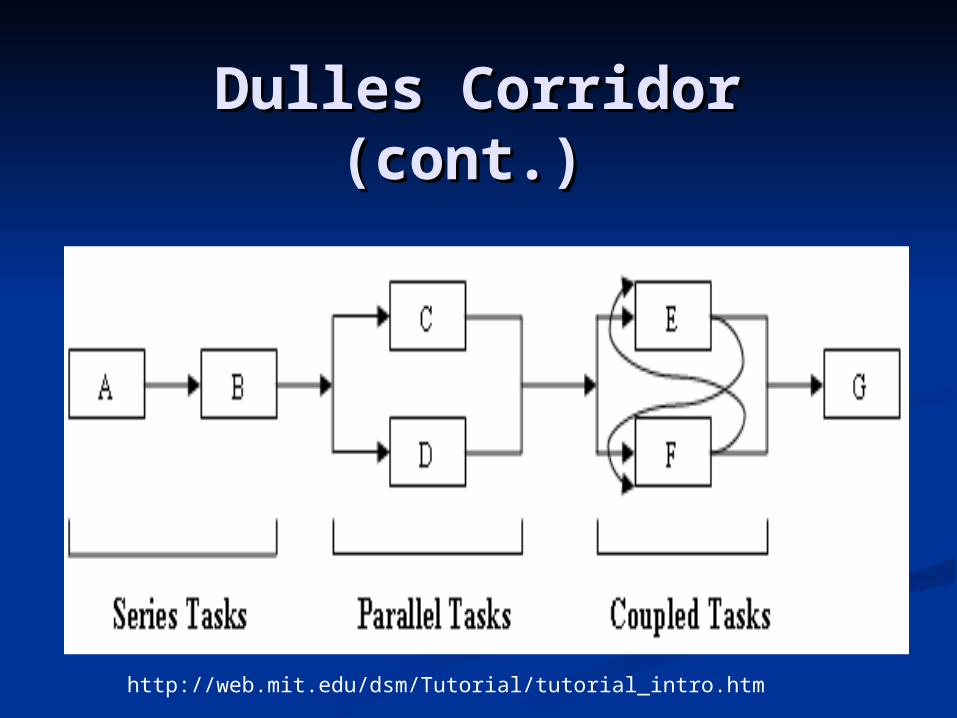
Dulles Corridor (cont.)Dulles Corridor (cont.)
http://web.mit.edu/dsm/Tutorial/tutorial_intro.htm

Future WorkFuture Work
Development of a “multimodal impact Development of a “multimodal impact statement”statement” Need and purposeNeed and purpose Rationale for selected alternativeRationale for selected alternative Integration and implementation planIntegration and implementation plan

MIS Example: Route MIS Example: Route 460 Corridor460 Corridor
Route 460 Corridor Route 460 Corridor (cont.)(cont.)
Various upgrades to bring US460 to near interstate standardsVarious upgrades to bring US460 to near interstate standards Construct new 6000 ft runway at Hampton Roads airportConstruct new 6000 ft runway at Hampton Roads airport Provide dedicated access/interchanges for the following Provide dedicated access/interchanges for the following
general aviation and small commercial facilities: Blackstone general aviation and small commercial facilities: Blackstone Municipal Airport, Petersburg Airport, Wakefield Airport Municipal Airport, Petersburg Airport, Wakefield Airport (runway protection zone necessitates realignment), Crewe (runway protection zone necessitates realignment), Crewe Airport, Farmville Airport, Lynchburg-Falwell Airport, Airport, Farmville Airport, Lynchburg-Falwell Airport, Lynchburg Regional Airport, Roanoke AirportLynchburg Regional Airport, Roanoke Airport
Rail upgrade (double track, sidings, speeds) and realignment Rail upgrade (double track, sidings, speeds) and realignment of Norfolk Southern and CSXT linesof Norfolk Southern and CSXT lines
APM Terminals (Maersk subsidiary) intermodal container APM Terminals (Maersk subsidiary) intermodal container port in Portsmouth (largest such private facility in the US)port in Portsmouth (largest such private facility in the US)
Intermodal container rail to port facility in Suffolk (Virginia Intermodal container rail to port facility in Suffolk (Virginia Port Authority)Port Authority)
Intermodal container rail to port facility in Petersburg Intermodal container rail to port facility in Petersburg (Richmond Ports Commission)(Richmond Ports Commission)
Various rail-industrial development sites west of PetersburgVarious rail-industrial development sites west of Petersburg

Dulles Corridor Disaster preparedness Eastern airport I-81 Corridor Third Crossing Western Rail Expansion Space transportation Olympics High-tech rail Cruise ship terminals Door-to-door freight
Future Work: Other Future Work: Other Multimodal SystemsMultimodal Systems
Coal/mineral transportation Urban undergrounds Urban public/personal transportation Tourism centers Multimodal service areas Innovative transit solutions Innovative parking solutions Urban corridors
-DC-RIC-RIC-NOR

AcknowledgementsAcknowledgements
Jim Bland, Cliff Burnette, Jeff Florin, Jim Bland, Cliff Burnette, Jeff Florin, George Connor, Bill LaBaugh, Alan George Connor, Bill LaBaugh, Alan Tobias, Ranjeet Rathore, Ken Lantz, Tobias, Ranjeet Rathore, Ken Lantz,
Diane Mitchell, Marsha Fiol, Katherine Diane Mitchell, Marsha Fiol, Katherine Graham, Kimberly Spence, Frank Graham, Kimberly Spence, Frank
Dunn, Gus Robey, Mary Lynn Tischer, Dunn, Gus Robey, Mary Lynn Tischer, Mike Knott, Chip Badger, Alan Tobias, Mike Knott, Chip Badger, Alan Tobias,
Bill Ketron, Kevin Page, Wayne Bill Ketron, Kevin Page, Wayne Ferguson, Mike Fontaine, and John Ferguson, Mike Fontaine, and John
MillerMiller

DiscussionDiscussion