analytical studies branch research paper series canadian
TRANSCRIPT

Analytical Studies Branch Research Paper Series
Canadian Compulsory School Laws and their Impact on Educational
by Philip Oreopoulos
Family and Labour Studies Division 24th floor, R.H. Coats Building, Ottawa, K1A 0T6
Telephone: 1 800 263-1136
T
Catalogue no. 11F0019MIE — No. 251
ISSN: 1205-9153
ISBN: 0-662-40421-1
Research PaperResearch Paper
Attainment and Future Earnings

Canadian Compulsory School Laws and their
Impact on Educational Attainment and Future Earnings by
Philip Oreopoulos
11F0019 No. 251 ISSN: 1205-9153
ISBN: 0-662-40421-1
Family and Labour Studies Division, Statistics Canada
and Department of Economics,
University of Toronto
Ottawa, K1A 0T6 Telephone: (613) 951-3837
Facsimile Number: (613) 951-5403
May 2005 This project is part of the research program of the Family and Labour Studies Division of Statistics Canada. It was completed while the author was a Statistics Canada Research Fellow. I am very grateful to Miles Corak, Arthur Sweetman, Adriana Lleras-Muney, Angelo Melino, and Michael Baker for their discussion and to participants at the Canadian Employment Research Forum’s 10th Anniversary Conference. Sonya Gulati and Tarek Hussain provided outstanding research assistance. Support from SSCHRC, Grant no. 410-2003-0189, and the Family and Labour Studies Division of Statistics Canada is greatly appreciated.
Published by authority of the Minister responsible for Statistics Canada
© Minister of Industry, 2005
All rights reserved. The content of this publication may be reproduced, in whole or in part, and by any means, without further permission from Statistics Canada, subject to the following conditions: that it is done solely for the purposes of private study, research, criticism, review, newspaper summary, and/or for non-commercial purposes; and that statistics Canada be fully acknowledged as follows: source (or “Adapted from”, if appropriate): Statistics Canada, name of product, catalogue, volume and issue numbers, reference period and page(s). Otherwise, no part of this publication may be reproduced, stored in a retrieval system or transmitted in any form or by any means, electronic, mechanical, photocopy, for any purposes, without prior written permission from Licensing Services, Marketing Division, Statistics Canada, Ottawa, Ontario, Canada K1A 0T6. Cette publication est disponible en français. Note of appreciation: Canada owes the success of its statistical system to a long-standing partnership between Statistics Canada, the citizens of Canada, its businesses, governments and other institutions. Accurate and timely statistical information could not be produced without their continued cooperation and goodwill.

Analytical Studies – Research Paper Series - 3 - Statistics Canada Catalogue no. 11F0019 No. 251
Table of Contents
I. Introduction....................................................................................................... 5 II. History of compulsory schooling in Canada..................................................... 7 III. Data description and sources .......................................................................... 12 IV. Methodology for estimating the effects of compulsory school on education and adult outcomes......................................................................... 14 V. Results............................................................................................................. 15
VI. Discussion ....................................................................................................... 19
VII. Conclusion ...................................................................................................... 21 Tables....................................................................................................................... 22
Figures...................................................................................................................... 30 References................................................................................................................ 34
Data Appendix ......................................................................................................... 36
Data Appendix References ...................................................................................... 38
Analytical Studies – Research Paper Series - 4 - Statistics Canada Catalogue no. 11F0019 No. 251
Abstract
Compulsory school laws have existed in Canada for more than a hundred years, and policies to mandate further education continue to be discussed. This paper examines the impact of these laws on education attainment and on subsequent social economic outcomes for individuals compelled to stay in school. The findings indicate that mandating education substantially increased adult income and substantially decreased the likelihood of being below the low income cut-off, unemployed, and in a manual occupation. Considering possible costs incurred while attending school, these findings suggest compulsory schooling legislation was effective in generating large lifetime gains to would-be-dropouts.
Key Words: Compulsory schooling in Canada, returns to schooling, dropout behaviour JEL Classification: I20, I21, I28

Analytical Studies – Research Paper Series - 5 - Statistics Canada Catalogue no. 11F0019 No. 251
I. Introduction
Compulsory school laws mandate the minimum length of time children and youths must spend in school before having the legal option to leave. The motivation for introducing these laws, or for updating them, often relates to assumptions that children wishing to leave school early are better off from staying on, or that society benefits collectively from raising a country’s overall education attainment because doing so promotes good citizenship and economic development. Archibald Macallum, an Ontario teacher, summarized these arguments vigorously in a report favouring the introduction of compulsory schooling in Canada:
Society has suffered so cruelly from ignorance, that its riddance is a matter of necessity, and by the universal diffusion of knowledge alone can ignorance and crime be banished from our midst; in no other way can the best interests of society be conserved and improved than by this one remedy – the compulsory enforcement of this great boon – the right of every Canadian child to receive that education that will make him a good, loyal subject, prepared to serve his country in the various social functions which he may be called on to fill during his life; and prepare him, through grace, for the life to come [Annual Report of the Ontario Teachers’ Association, 1875, as cited in Prentice and Houston, 1975, pp. 175-176].
Similar reasons are given for continuing to enforce compulsory schooling, or for updating these laws. Many states, provinces, and countries initially mandated a school leaving age of 12, but most school jurisdictions presently enforce a school leaving age of 16, and several governments have implemented or are discussing raising the school leaving age to 18. New Brunswick was the first province to raise the school leaving age above 16 to 18 in 1999. Alberta raised the school leaving age to 17 in 2001, and Ontario plans to raise the school leaving age to 18. Surprisingly little research discusses the welfare implications of compulsory schooling, even though these policies have existed for more than a hundred years. Most arguments in favour of compulsory schooling, including those cited above, seem to rely more on intuition than on theoretical or empirical evidence. The most common model of school choice in social science, however, suggests compulsory schooling should lower lifetime welfare [e.g., Becker, 1965, Chiswick, 1967]. The human capital model of school choice views education as an investment. Students invest time, forgo earnings, and endure possible psychological costs from attending school, but only if the anticipated benefits from doing so are large enough to offset these costs. If not, a student’s optimal decision should be to leave. Compulsory schooling prevents that option. If students already choose optimally when to leave, then imposing a longer stay in school makes them worse off, on average, than before. Only in the presence of positive externalities or sub-optimal school attainment can compulsory attendance legislation improve lifetime welfare.1 Several previous studies use historical changes to compulsory school laws as natural experiments to identify causal estimates of the returns to education. Although these
1. See Eckstein and Zilcha (1994) and Oreopoulos (2003).

Analytical Studies – Research Paper Series - 6 - Statistics Canada Catalogue no. 11F0019 No. 251
studies generally do not discuss the welfare and policy implications of their results, all point to significant individual and social gains from compulsion. Angrist and Krueger (1991) use differences in the timing of individual births to identify youths that entered school earlier because they were born just prior to the entry-date cut-off as opposed to just after. They find youths that left school with one extra year of school because of these entry laws experienced an increase in annual earnings of 10.1 percent, on average, for U.S. males. The gain is likely incurred directly, since this experiment compares relative earnings differences for two cohorts that differ by birth date only. Externalities from increasing the education of one group would likely affect the other. Acemoglu and Angrist (2002), find more direct evidence that school compulsion raises earnings of would-be-dropouts directly by instrumenting education attainment with school entry laws that affect would-be-dropouts directly and state compulsory schooling laws that may have direct and indirect effects from externalities. They conclude individual returns to compulsory schooling are 8 percent or more, while additional social returns are negligible. Other papers find evidence of social returns, but for non-pecuniary outcomes. Lochner and Moretti (2001), for example, find school compulsion lowers crime. Lleras-Muney (2002a) finds school compulsion improves health. Dee (2003) and Milligan et al. (2003) estimate that tighter restrictions to school-leaving laws in the U.S. and UK correspond to increases in civic activities (like voting and discussing politics). And Oreopoulos, Page, and Stevens (2003), find that children of mothers and fathers compelled to take additional schooling are less likely to fail a grade and less likely to drop out of high school. One concern with this empirical literature is that the effects of school compulsion on overall grade attainment are small, and so the instrumental variable estimates on the returns to compulsory schooling are weak and potentially biased. Bound, Jaeger, and Baker (1995) show that if education attainment and compulsory school laws are only weakly correlated, estimates can be biased in the same direction OLS results are biased. Many of the issues raised by these authors have been addressed by Staiger and Stock (1997) and Cruz and Moreira (2002), who conclude that accounting for the possibility that these instruments are weak does not generally, change the conclusion that the effects of compulsory schooling on earnings are substantial and significant. A second concern involves the potential that the compulsory school laws are still correlated with other factors related to earnings and other outcome variables. Angrist and Krueger (1991) try to address the possibility that school entry laws are related to seasonal birth patterns that are independently correlated with adult earnings. Lleras-Muney (2002b) suggests changes to compulsory school laws were more for political reasons than driven by region-specific economic or social trends. The aim in this paper is to provide further evidence of the effects of compulsory schooling, and to present this evidence in a framework for discussing the potential policy implications of these laws rather than in the framework of the returns to schooling literature. Historical changes in Canada provide an opportunity to examine whether school leaving and entry laws affect would-be-dropouts under different circumstances than those in the U.S. studies. Figures show that students compelled to take an extra

Analytical Studies – Research Paper Series - 7 - Statistics Canada Catalogue no. 11F0019 No. 251
grade of school experienced an average increase of 12.3 percent in annual income. Figures also show that students with additional schooling are more likely to speak two languages, and more likely to work, and less likely to be below the Low Income Cut-off, unemployed, and in a manual occupation. In reduced form, the laws affect only birth cohorts directly, and only those individuals without post-secondary education. This suggests the laws had primarily a direct impact on economic outcomes and little impact on other cohorts. Similar estimates may be arrived at whether looking over different periods between 1920 and 1980, or whether looking over different regions. The results reinforce the earlier studies and suggest compulsory schooling served as an effective policy tool for improving lifetime welfare among early school leavers, at least on average. The next section provides a brief history of compulsory schooling in Canada. Section III describes the data sources used in the paper. Section IV shows the methodology for identifying the effects of compulsory schooling. The estimates for the effects of compulsion on grade attainment, adult earnings, and other labour market outcomes are displayed in Section V. Section VI carries out a simple cost-benefit exercise from the perspective of a social planner, to evaluate whether these policies had overall beneficial effects. The last section concludes.
II. History of compulsory schooling in Canada
Interest in public and non-denominational schooling grew in Canada in the last half of the nineteenth century from a mix of circumstances and motives. Many affluent farmers, merchants, lawyers, and other professionals favoured the expansion of public education to promote learning for those without privileged background. Other politicians saw public schooling as a means to cultivate a sense of citizenship and loyalty. Some prominent Canadians attributed the rise in economic power and prosperity of the United States to the development of its public education system and argued for its emulation. Parents with large families from rural communities, the vast majority of Canadians in the late nineteenth century, may also have been predisposed to the campaign for public education. While farmers typically hoped their children, especially their sons, would eventually take over the homestead, there was not enough farmland to ensure the economic viability of everyone in the next generation. Public schooling could provide opportunity to secure economic security through other occupational pursuits, while being offered nearby. A gradual increase in industrial development, road construction, and the establishment of representative government, especially at the local level, made the logistics of introducing public schooling possible. Prince Edward Island introduced the first province-wide common schooling system in 1852. By 1873, all provinces but three funded their schools through taxation. Alberta and Saskatchewan adopted a free-school act in the early half of the twentieth century. Newfoundland began legislation in 1942. Even as schooling became more available, school attendance was often sporadic and infrequent. At the end of the nineteenth century, 70 percent of the Canadian population still lived in rural areas. The needs of the farm often dictated the frequency and timing of school attendance. Teachers and administrators expressed concern over the irregular

Analytical Studies – Research Paper Series - 8 - Statistics Canada Catalogue no. 11F0019 No. 251
turnout. Some families sent one child to school for a few weeks and then another [Phillips, 1957]. In the winter, when children were least needed at home, attendance remained low because leisure was often preferred over sitting still in crammed and cold schoolhouses. The average daily attendance rate (among those enrolled) for the whole of Canada was 61 percent in 1900. The number of years typically spent in school were also few. Both boys and girls often left by ages nine or ten to begin work in factories or at home. Teachers, inspectors, and politicians were among the first to argue for school compulsion. One argument was that weak attendance disrupted the class and prevented any meaningful learning from occurring. For example, a local superintendent in Ontario in 1871 claimed, “irregularity of attendance is the bane and curse of the public schools; it is a log and chain upon the progress of instruction for it blasts and withers the noblest purposes of the best of teachers” [Axelrod, 1997, p 51]. Another argument was that students were being kept home for trifling reasons, or that poor families resisted sending their children to school, when doing so would help them avoid poverty as adults. Authorities felt the reasons for introducing public education were being compromised by poor attendance. As an inspector for the school system of Prince Edward Island in 1869 stated,
Neither the building of School-houses, the furnishing of them, nor the payment of the taxes that go to make up the Teachers’ Salaries is left to voluntary effort. Government enforces the payment of taxes. A majority of householders compels the minority to share the expense of building the School-house. Why then, it is asked, should the attendance of pupils at School, -- that point at which the machinery of our Educational System ought most prominently be brought to bear – be left to the caprice or the negligence of parents? [Phillips, 1957, pp. 165-166].
Figure 1 summarizes the compulsory school laws in Canada over the last hundred years. The figure highlights the minimum school leaving ages of each province, and the ages which children must begin school. Ontario took the first step of introducing compulsory school laws in 1871. Parents were obliged by threat of fine to have children attend school for at least four months a year between the ages of seven and twelve. Legislation in 1891 raised the limits to eight and fourteen and required a child to remain at school, even after reaching fourteen, until the end of term. The new law was more definite in stipulating penalties for parents, who refused to comply and for employers who hired children who should have been at school. But, as with many of the new compulsory school laws first introduced by the other provinces, many exceptions were allowed, and authorities failed to enforce, especially in rural areas. Aside from sickness, the main exception involved living more than 2 miles away from school for a child under age 10, and 3 miles away if over age 10 unless transportation was provided. The Adolescent School Attendance Act increased the age of compulsory attendance in 1921 to sixteen in urban areas, but any adolescent was exempted with a home permit or an employment certificate signed by a parent. Employed fourteen and fifteen year olds were required to attend part-time evening classes, but only in municipalities that provided such instruction. In 1954, the Schools Administration Act imposed a minimum school leaving age of 16 for all children in Ontario, but allowed

Analytical Studies – Research Paper Series - 9 - Statistics Canada Catalogue no. 11F0019 No. 251
adolescents over fourteen to work on a family farm, at home, or elsewhere, if doing so was necessary for subsistence. By 1970, these exemptions were removed. British Columbia began compulsory schooling in 1873, one year after introducing free public education. Children were required to attend between ages seven and fourteen for periods to be determined by local trustees. School regulators complained, not long after, that trustees were reluctant to pass such laws or to enforce them if passed. A further attempt to improve attendance was made in 1874 by making teacher’s pay dependent on attendance, though this legislation did little to help enrolment and much to enrage teachers. In 1876, the Public Schools Act was again amended to order trustees to enforce attendance over six months a year for students between seven and twelve. A further amendment to the Act in 1901 raised the age of compulsory schooling from seven to fourteen in cities for the full year, and in 1912 this was extended to all municipal districts. In 1921, the minimum school leaving age increased again to fifteen. Prince Edward Island amended its Public Schools Act in 1877 to include a compulsory clause stating that every child between ages eight and thirteen remain in school at least twelve weeks in every year, six weeks of which must be consecutive. In 1920, P.E.I. mandated the annual time in school extended to sixty percent of the days on which public school was in operation. Children in Charlottetown and Summerside were required to attend school 100 percent of the time by 1930, unless exempt. In 1938, the minimum school leaving age for all students was raised to fifteen. Most other provinces introduced compulsory attendance before 1910. In Nova Scotia from 1883, a two-thirds majority vote in favour of compulsory attendance in any school section sanctioned its application to children aged seven to twelve, with the usual penalty of a fine and the usual exemptions of children living two miles from a public school or attending a private school. Nova Scotia restricted employment of children less than sixteen years to only those who passed a grade seven equivalent examination in 1922. Adolescents over thirteen who needed to work were exempt, if deemed so by a principal. In 1933, the school-leaving age was raised to fourteen for children in rural areas and to sixteen for children in urban schools. A child could be exempted after thirteen if a parent or guardian argues successfully to the Board of Education that necessity requires the child to work, or if a child attains grade nine equivalent standing. In 1946, any child attaining the minimum school leaving age became required to finish the school year. A child could still obtain an employment certificate that states it is necessary for her to work in 1954. School trustees in New Brunswick began in 1905 voting every year until resolution for compulsory schooling for children ages six to fourteen in cities and incorporated towns, and ages seven to twelve in other rural areas. In 1946, the province changed compulsory schooling requirements to ages seven and sixteen inclusive for students in cities and to seven and fourteen inclusive for students in rural areas. In 1966, it changed the minimum school leaving age to sixteen for everyone. Saskatchewan started compulsory schooling in 1909. Children between the ages of seven and thirteen years inclusive were required to attend school for one hundred days, sixty of

Analytical Studies – Research Paper Series - 10 - Statistics Canada Catalogue no. 11F0019 No. 251
those consecutive. The School Attendance Act, introduced in 1917, expanded on these laws, compelling children between ages seven and fourteen to attend school for the whole year in session. Children attaining grade eight equivalent were exempted. In 1922, the minimum school leaving age was raised to fifteen and in 1965, Saskatchewan raised the school leaving age again to sixteen. The grade eight equivalent exemption remained until 1975. Alberta introduced the Truancy and Compulsory School Attendance Act in 1910. The Act compelled children between ages seven and fourteen to attend school for the full term. The school leaving age was amended to fifteen in 1918, with children attaining grade eight exempted. Children reaching age fourteen and employed were also exempted. The amended Act in 1922 removed these exemptions. The requirement that children age fifteen must stay until the end of the term was changed to apply only to those whose birthday occurs in the second term. The school leaving age was raised to sixteen in 1966, and the maximum school entry age lowered to age six in 1970. The requirement that a child finish the end of term before leaving school was dropped in 1975. The original Public Schools Act of Manitoba contained a compulsory attendance provision, but was ultimately deleted before passing because of a concern that it might lead to the entire proposal being declared unconstitutional [Henley, 1993]. The province prohibited funding Catholic schools, and feared that forcing Catholic parents to send their children to non-denominational schools would cause substantial political backlash. As a compromise between Catholic school supporters and those who argued for compulsion, the province introduced child labour laws in 1907 restricting the employment of children under age twelve during school hours. That age was raised to fourteen in 1914, but was not enough to calm the growing campaign for compulsory legislation. In 1916, the province finally introduced legislation compelling children ages seven to fourteen to attend school. In 1962, it raised the minimum school leaving age to sixteen. In only two provinces was the enactment of compulsory attendance postponed until the second quarter of the twentieth century. The issue of compulsory education aroused much public debate in Quebec. The first bill was submitted to the legislature in 1892, but it was defeated. A second, in 1901, met the same fate. In 1912 the Protestant Committee, convinced that the Roman Catholics would not concur, recommended obligatory school attendance for Protestant children only. This proposal, too, was defeated. One argument against compulsory schooling at the time was that it was unnecessary on the basis that child labour laws already restricted employment of youths. Legislation restricted children under the age of sixteen from working without knowing how to read and write. Those who did not were required to attend night school if they wanted to continue their occupation. Many avoided school from these exceptions and weak enforcement. While Quebec enjoyed relatively high average daily attendance rates in school in the early part of this century, its growth in secondary school enrolment failed to keep pace with the other provinces. Finally, in 1943, the legislature adopted an Act making school attendance compulsory between the ages of six and fourteen, until the end of the school term. Children completing elementary school were excused, but this exemption was removed shortly afterwards. In 1961, the school leaving age was raised to fifteen.
Analytical Studies – Research Paper Series - 11 - Statistics Canada Catalogue no. 11F0019 No. 251
Newfoundland enacted compulsory schooling late, the same year it legislated free education in 1942. Compulsory ages were set between age seven and fourteen. The province raised the school leaving age to fifteen in 1951. Students attaining fifteen during the school year had to wait until the end of the school term before having the option to leave. After 1963, all provinces enforced a minimum school leaving age of either fifteen or sixteen. These limits remained for many years. In 1980, Prince Edward Island raised the limit to sixteen. Newfoundland also raised the limit to sixteen in 1987, followed by Quebec in 1988, British Columbia in 1990, and Nova Scotia in 1996. New Brunswick was the first province to implement a minimum school leaving age above sixteen in 2000, raising it to eighteen. In addition to compulsory schooling, many provinces also introduced child labour legislation near the beginning of the twentieth century. The initial laws were primarily designed to protect children from working under excessive conditions rather than to encourage learning in school.2 Many provinces imposed restrictions on the age a child could begin work in a mine or factory. Night work under the age of eighteen was strictly forbidden in most provinces. Children were limited in the number of hours they could work, generally not more than 10 hours a day and 60 hours a week. There were other types of employment laws that shared a closer connection with compulsory schooling. Employment certificates, for example, exempted children from the minimum school leaving age law. Some certificates were obtained by passing a grade seven or eight equivalence test. Others required only evidence of reading and writing skills. For certain occupations, employment certificates were required for children over the minimum school leaving age, mainly mining. Another type of labour law allowed children to work below the minimum school leaving age if doing so was necessary for subsistence. In Nova Scotia, and other provinces, children were allowed to work if doing so was deemed necessary for subsistence. By 1933, all provinces had removed these exemptions. In certain provinces, employers were also not allowed to hire children during school hours. This condition was usually incorporated into compulsory school legislation. For virtually every case, the minimum working age restriction (during school hours) corresponded with the minimum school-leaving age restriction. The purpose of restricting employment below the minimum school leaving age was to place liability on employers, in addition to the liability already imposed on parents and guardians through compulsory schooling. Most provinces implemented these laws the same time as other amendments, designed to strengthen compulsory school laws, were being made.
2. The Dominion Bureau of Statistics’ 1925 Survey of Education provides a useful summary of the details and complexities of early Child Labour Laws by province.
Analytical Studies – Research Paper Series - 12 - Statistics Canada Catalogue no. 11F0019 No. 251
In short, child labour laws in Canada either reinforced existing compulsory school legislation or provided opportunities to avoid it. They were designed to work together. Children were allowed to work earlier than the minimum school leaving age if they had already obtained a satisfactory minimum level of education, or if they were from poor households. But many school authorities believed these exemptions provided unnecessary loopholes used to avoid the school leaving age law without reasonable cause. By 1942, all provinces except Saskatchewan removed these exemptions. Saskatchewan abandoned its Grade 8 exemption in 1974.
III. Data description and sources
Data on compulsory schooling and child labour laws were compiled directly from provincial Statues and Revised Statutes containing all original Acts of legislation and amendments since inception. Additional sources helped verify the compilation. In particular, the Dominion Bureau of Statistics (later renamed Statistics Canada) published a near annual survey of education beginning in 1921 detailing revisions to Education Acts and summarizing compulsory school legislation (and occasionally child labour laws) for each province. The Appendix lists the Acts, the education surveys, and all additional sources used to create the variables in this paper. Four variables were created to summarize compulsory school attendance rules, coded by year of legislation for each province from 1900 to 2000: 1. Maximum age of compulsory schooling in towns and cities (town dropout age), 2. Maximum age of compulsory schooling in rural areas (rural dropout age), 3. Minimum age of compulsory schooling (entry age), and 4. Indicator for whether employment certificates provided exemptions to the dropout age. The town and rural dropout age rarely differed; therefore, only the town dropout age is used here. In addition, a variable is constructed for the number of years in school a child would have to attend if she entered school at the age that compulsory attendance laws required and left immediately after reaching the minimum school leaving age (minimum number of years in school). Acemoglu and Angrist (2002) and Lleras-Muney (2002a) use a similar variable for their United States analyses. To explore the effects of compulsory schooling on education attainment, and on subsequent social-economic outcomes, the schooling law variables were matched to census data, from the 33 percent sample of the 1971 Census, and the 20 percent samples from the 1981, 1986, 1991, 1996, and 2001 Census files.3 The censuses provided information on gender, province of residence, province of birth, age, labour market status, income and wages, and education attainment. All Canadian-born individuals who were 14
3. These files are available internally at Statistics Canada. No difference in the results were found, whether working with these files or with the Public Use Data Files. The STATA program codes for working with these files are available on request. The 1976 public use census sample excludes earnings information and was omitted.

Analytical Studies – Research Paper Series - 13 - Statistics Canada Catalogue no. 11F0019 No. 251
years of age between 1920 and 1970 are kept. The sample aged 14 before 1920 are older than 65 in the 1971 Census, and compulsory schooling laws were sometimes weakly enforced during that period compared to afterwards. School-leaving age changes after 1980 may have affected high school dropouts differently compared to changes that occurred during the 1920 to 1970 period, when education attainment and enrolment rose substantially. For these reasons, analysis is limited to the effects of compulsory schooling to this fifty-year period. During this period, all provinces experienced rapid increases in average education attainment. These remarkable increases are shown in Figure 2. Note that, together, the data displayed in Figures 1 and 2 can generate similar estimates of the effects from the compulsory school on average grade attainment, even though discontinuities at the years when the laws change do not appear visible. We should not expect large discontinuities, because the education attainment variable used here (grade attainment) does not correspond precisely with the law changes (age requirements). Raising the school leaving age may increase the length of time spent in school, but may not raise education attainment for those retained a grade. The Census recorded highest grade attained, highest degree completed, and an indicator for high school certificate attainment. This paper focuses on the grade attainment variable, since the school laws before 1970 did not constrain children to finish high school. A child who entered Grade 1 at age 6 and advanced one grade per year reaches Grade 11 at age 16. The following examines whether compulsory schooling affected high school completion or education levels beyond high school with the other variables.4
Different provincial grade requirements for high school graduation complicated the use of grade attainment variables to examine the effects of compulsory schooling on earnings. By 1960, for example, Nova Scotia, Quebec, and Newfoundland allowed graduation after Grade 11. Newfoundland did not offer schooling beyond this grade until 1984.5 The other provinces allowed graduation after Grade 12. Ontario and British Columbia offered a senior matriculation year with Grade 13 that generally reduced by one year the time required for a university degree. Almost 50 percent of those who were 14-year olds in 1960 eventually attended Grade 13. Compelling children to attain Grade 11 likely had different implications depending on the province they were in. To explore whether differences in high school graduation dates, or other unrelated factors affecting upper levels of education, affect the results, the regressions for only those attaining grade 11 or less are estimated. If compulsory schooling had a minimal impact
4. Children compelled to take additional years of high school may also be more likely to graduate since the number of years until completion after gaining the option to drop out declines. If the perceived costs of completing the remaining years after attaining an extra grade are considered smaller, students who would have dropped out under less restrictive compulsory school laws may choose to continue beyond the maximum age of compulsion. Compulsory legislation might also affect children wanting to leave after the school leaving age. Lang and Kropp (1986) suggest that individuals intending to complete one or two additional years of schooling after the minimum leaving age requirement may acquire additional education after legislation raises the limit to avoid signalling to employers they are in the same category as those who leave school at soon as possible. 5. See Sweetman (2001) for a discussion on the effects from increasing the high school curriculum in Newfoundland by one year before graduation.

Analytical Studies – Research Paper Series - 14 - Statistics Canada Catalogue no. 11F0019 No. 251
on those attaining grades beyond 11, this sample omits a large population of students unaffected by the laws. We should not expect the estimated effects of compulsory schooling on adult labour market outcomes to differ if the laws impact only high school dropouts or early school leavers. Section VI shows this hypothesis generally holds. The author matched individuals to the compulsory school laws that were in place in their province of birth when they were 14 years old, except for the school entry laws which were matched according to when individuals were 6 years old.6 Acemoglu and Angrist (2002), Lleras-Muney (2002b), Schmidt (1996), and Goldin and Katz (2003) followed the same procedure for the United States. Schmidt (1996) examined this assumption and found the effect compulsory school laws in the United States were largest when matching to individuals at this age. Finally, individuals with characteristics of their province-of-birth when they were 14 years old are matched: number of schools per student, number of teachers per student, total per capita education expenditure, fraction in province in a rural area, and fraction of workers in province working in the manufacturing sector. The appendix describes in more detail how these variables were compiled. The combined dataset contained 9,393,327 Canadian-born individuals, aged 20 to 64, who were 14 years old between 1920 and 1970.
IV. Methodology for estimating the effects of compulsory school on education and adult outcomes
Cell means were first generated for all variables by census year, birth cohort, and province. This improves the manageability of the dataset, and avoids heteroskedasticity at the individual level. The following equation is estimated: (1) EDUCpcy = γCLpc + βXpc + ep + ec + ey + epcy
where EDUCpcy is the average education attainment level for the group born in province p, from birth cohort c, from census year y. CLpc is a vector of provincial compulsory schooling laws and child labour laws, Xpc is a vector of provincial controls, ep , ec , and
ey are fixed effects for province, birth cohort, and census year respectively, and pcye is the error term. The errors are clustered by province and birth cohort. Identifying the effects from the laws comes from difference in the timing of the changes in these laws across provinces. The analysis is therefore similar to difference-in-difference estimation, but with more than one intervention and more than one ‘treatment group’. The methodology does not depend on perfect enforcement of the laws, but only that
6. Individuals who moved to a different province before reaching high school were mismatched. Children did not likely move provinces because of a change in compulsory school legislation, so such law changes are unlikely correlated with error.

Analytical Studies – Research Paper Series - 15 - Statistics Canada Catalogue no. 11F0019 No. 251
changes in the laws have some predictive power on education attainment. The identification strategy of the true impact of these laws on enrolment fails if other provincial factors that influence enrolment change coincidentally at the same time as the laws themselves. Several specification checks are carried out to examine this possibility. The returns to compulsory schooling were estimated on earnings and other socio-economic outcomes by substituting actual education attainment with predicted education attainment from compulsory schooling differences across province and time. The baseline instrumental variables equation is: (2) pcyycppcpcypcy uuuuXEDUCY +++++= βδ ,
where pcyY is the average outcome for the group born in province p , from birth cohort c ,
from census year y , and pcyEDUC is predicted education for the group after estimating equation (2).
V. Results
This section presents the main results. Section A describes in detail what effect the compulsory school law changes had on overall education attainment between 1920 and 1970. Section B then focuses on the effect compulsory schooling had on individuals and estimates how additional compulsory schooling affected adult earnings and other socio-economic outcomes. A. The impact of compulsory schooling on school enrolment and education
attainment Table 1 presents the predicted effects of the compulsory school variables on grade attainment from estimating equation (1), weighted by cell mean sample size. The estimates use the full sample of Canadian-born individuals who were 14 years old between 1920 and 1970, and who were between 20 and 65 years old when they completed their survey. Column 1 shows the coefficients for the effects from facing different school-leaving ages. The omitted dropout age is 12 years or less (or no dropout age). Average grade attainment is 0.23 points higher with a school-leaving age of 14 compared to a lower or no school-leaving age, after controlling for average provincial, birth cohort, and census year fixed effects. Raising the dropout age to 15 versus 14 exhibits an even larger increase in average grade attainment (0.63 points). However, the effect from increasing the limit again to age 16 is negative, compared to provinces with a school leaving age of 15. The lower estimate occurs consistently with other specifications. As shown in the next tables, this finding may, in part, be due to enrolment patterns in Quebec after 1950. The table shows a negative association between grade attainment and the exemptions indicator. Being exempted from the school leaving age by means of work-permit or proof of necessity lowers average grade attainment by 0.27 points. This estimate stays about the

Analytical Studies – Research Paper Series - 16 - Statistics Canada Catalogue no. 11F0019 No. 251
same when including other laws or provincial controls in the regression. Lower entry ages are also associated with higher grade attainment. Average grade attainment for adults who faced a school entry age of 7, versus no entry age or an entry age of 8, are 0.32 grades higher. However, students from provinces with the entry age of 6 experience a 0.13 reduction in average grade attainment. Taken overall, the relative effects of the compulsory schooling variables are the same when restricting the sample to only those with less than Grade 12 attainment. Adding the control variables does not alter the coefficient estimates on the effects of the laws by much. Provincial school expenditures matched to students when aged 14 are strongly associated with grade attainment (while including province and birth cohort fixed effects). Fraction in province in rural areas is negatively correlated with grade attainment and fraction of workers in province in the manufacturing sector is positively correlated. The summary variable for compulsory schooling identifies a strong link between grade attainment and the minimum number of years required to remain in school before being allowed the option to leave. A one-year increase in the number of mandatory school years is associated with 0.19 increase in grade attainment, on average. This estimate falls to 0.13 after adding the 5 provincial school control variables. This estimate is similar to that found by Lleras-Muney (2002a) for the United States. She found a one-year increase in mandatory number of years in school, from the school entry age to the earliest age allowed to obtain a work permit, increased the number of years of schooling by 0.051 years. This estimate is notably smaller than the effect from a one-year increase to mandatory years of schooling in Canada. The measures, however, span different years, and the U.S. estimate includes an additional control for whether a student must attend continuation school after working. Average grade attainment increased from 8.1 in 1920 to 11.3 in 1970. The mean years of mandatory schooling rose by 3.8 years, from 5.8 to 9.6. Table 1 implies that the changes in provincial compulsory school laws can explain an increase in grade attainment of 0.50 years. Thus, about 15.6 percent (0.5 × 3.8 / 3.2) of the increase in grade attainment over the fifty year period from 1920 to 1970 can be accounted for by changes in compulsory school legislation. Goldin and Katz (2003) find somewhat lower impact of compulsory school changes on grade attainment in the United States from 1910 to 1939. They estimate compulsory schooling and child labour laws explain about 5 percent of the year increase in U.S. average schooling from the 1896 to 1925 birth cohorts. Table 2 compares the estimates of the effects from the compulsory school law variables on different levels of education using the full sample. One specification check for whether other factors underlie the relationship between these laws and the outcome variables is to examine if changes in the laws are associated with changes in higher levels of education attainment. We should not expect the laws to substantially affect education attainment beyond high school. We should also not expect early dropout ages to impact on later grades. Table 2 shows the predicted effects of compulsory school law variables on different levels of education attainment generally hold. Raising the dropout age to 14 does

Analytical Studies – Research Paper Series - 17 - Statistics Canada Catalogue no. 11F0019 No. 251
not significantly affect higher levels of education. The point estimates are precisely estimates at zero for Grade 12 attainment or higher, but the standard errors for the estimates of the effect on lower levels of education are high. Allowing work permits to exempt students from staying in school lowers education attainment at all levels of high school, but does not affect schooling beyond high school. Finally, school entry age differences generally impact Grade 7, Grade 8, and Grade 9 attainment. The lower row summarizes the effects of compulsory schooling on different levels of education attainment with the mandatory number of school years variable. The coefficient on this variable is largest for Grade 7 and 8 attainment, and then declines. The variables have no association with high school completion or with post-secondary education. The results strongly corroborate the predicted zero effect for compulsory schooling on education attainment beyond high school. Since the compulsory school laws do not appear to affect higher levels of education attainment, we may prefer to carry out the analysis on the sample of early high school leavers. Table 3 shows the first stage results for both the full Census sample, and the sample of individuals that attained Grade 11 or less. The Census asks both an individual’s highest grade attainment and highest degree, so while most of the second sample did not complete high school, it does not preclude individuals in it from having obtained community college or bachelor degrees. The differences in coefficients for the estimated effects of the school laws are small. The effect of facing a dropout age of 14 versus something less is smaller for the dropout sample, and the effect for facing a school entry age of 6 is higher. Since these estimates are weighted by cell mean sample sizes, they place far more emphasis on what happened in Quebec and Ontario, where more than 50 percent of Canada’s population resides, than for what happened in the other provinces. The cell mean sample sizes are large enough for all provinces to consider placing equal weight on all provinces (and all birth cohorts). The second set of columns in Table 3 excludes the cell weights, thus treating law changes that happened in smaller provinces equal with changes that happened in larger ones. Removing emphasis on Quebec and Ontario leads to a larger coefficient on the school leaving age variables, a smaller coefficient on the exemptions variable, and a larger coefficient on the school entry age variables. But generally, whether looking at the dropout sample, or the non-weighted sample, the results indicate changes to compulsory school laws in Canada had a significant impact on average grade attainment.7 B. The returns to compulsory schooling on earnings and other outcomes
The subsection above examines how changes to compulsory schooling legislation, from 1920 to 1970, impacted average education attainment. Here we investigate what happened to those who were affected by these changes, in terms of their earnings, income, and other outcomes measured in the Census. Table 4 shows returns to schooling estimates from instrumenting grade attainment with predicted grade attainment. The table compares these 7. The estimates are very similar when separating males and females (results not shown, but available on request).

Analytical Studies – Research Paper Series - 18 - Statistics Canada Catalogue no. 11F0019 No. 251
results with least-squares estimates that use the full sample of adults aged 20 to 64 who were aged 14 between 1920 and 1970. From Column 3, children compelled to take another grade of school end up with about 12.3 percent higher annual income, on average, than children not restricted to stay in school longer. This estimate is lower compared to the one in Column 4 that restricts the sample to only high school dropouts. The estimated returns to compulsory schooling are about the same when placing equal weights across the provinces in the last two columns. The effect of the school compulsion on earnings is lower than that for total income. One extra grade raises annual earnings by about 7.1 percent. The results also indicate significant increases in earnings and income for males, and for combined household income. Placing equal weight on the compulsory school law effects for all provinces, for example, compelling boys to take one additional grade raises their average annual earnings by 7.0 percent. The instrumental variables estimates are about the same, or higher than the least-squares estimates shown in Columns 1 and 2. This finding is not uncommon, compared to previous studies, despite the likelihood that OLS estimates for the returns to schooling are downward biased. Several recent papers attempt to explain why the IV approach may arrive at higher returns to schooling estimates than OLS. One explanation is that IV estimates, if specified correctly, are without omitted variables bias, and without measurement error bias. Mis-measured independent variables may attenuate estimates and bias results downwards. A second explanation is that the IV estimates measure the returns to schooling for only those affected by compulsory school law changes. Clearly, characteristics underlying the types of individuals influenced by these laws differ from the average characteristics of those in the entire sample. The IV results identify the group of individuals compelled to take more school, that otherwise would have left sooner. The results presented here suggest these individuals have more to gain from staying on than the rest of the population. Figure 3 demonstrates graphically the discontinuity in average education attainment and earnings at the time of a law change. The figure shows estimates of coefficients on lead and lag indicators for whether compulsory schooling increases. High school dropout samples were selected and the data by province and birth cohort groups were aggregated. The dependent variables are schooling and log earnings. Lags include years –10 to –2. Leads include years +2 to +10. The regression also includes province and birth cohort controls fixed effects. Figure 3 shows clearly identification of the effects of compulsory school laws comes from changes to education attainment and earnings immediately or soon after school leaving age changes and not before. Average years of completed schooling and average log weekly earnings show no noticeable trend leading up to the dropout age increase. Between cohorts 2 years before and 2 years after an increase, average years of completed schooling rises by about 0.314 years. Log weekly earnings rise over the same period by 0.035 points. If we divide the earnings increase by the schooling increase, we arrive at a return to compulsory schooling estimate of 11.1 percent, which is strikingly similar compared to the full-sample estimates.
Analytical Studies – Research Paper Series - 19 - Statistics Canada Catalogue no. 11F0019 No. 251
Earnings increases appear to occur more gradually for birth cohorts exposed to more restrictive compulsory school laws. Such results could indicate adjustment costs for cohorts compelled to stay in school immediately after a change, or that legislated changes took some time to become fully enforced. Even as education attainment subsequently rises after a law change, earnings also subsequently rise. The graphs show earnings and education moving roughly in tandem immediately following a law increase, and after controlling for region and year of birth. The figures are important because they suggest that dropout age increases raise education attainment and subsequent earnings, and not that they simply respond to underlying trends in schooling.8 Table 5 shows the IV estimates with the full sample and dropout sample using different time periods. The table shows the returns to compulsory schooling estimates using smaller, thirty-year, periods. All regressions find positive and strongly significant estimates, similar to those using the full sample ones. For example, the returns to compulsory schooling estimates range from about 8.7 percent to 13.5 percent for any thirty-year period beginning in 1920 until 1980, with the sample of early high school leavers. The table indicates the estimated effects are not driven by any particular law change, or any particular time period. We do not have to restrict the analysis of outcome variables to just earnings and income. Looking at other socio-economic outcomes provides more evidence (for or against) the effect of compulsory schooling, and whether individuals may benefit in non-pecuniary ways. Table 6 displays the returns to compulsory schooling on other outcome variables. The estimates imply school compulsion lowers the likelihood of reporting being not working while looking for work, and raises the likelihood of reporting working full time. The IV results also predict additional schooling lowers the probability of working in a manual occupation, and raises the likelihood of working in clerical service. Those compelled to take an extra grade are 7.9 percentage points less likely to fall below Statistics Canada’s Low Income Cut-off, and more likely to report being fluent in both English and French. Finding that occupational composition changes and self-reported language skills improve from one more grade of compulsory schooling seems to indicate real skills are acquired during the extra years of school.
VI. Discussion
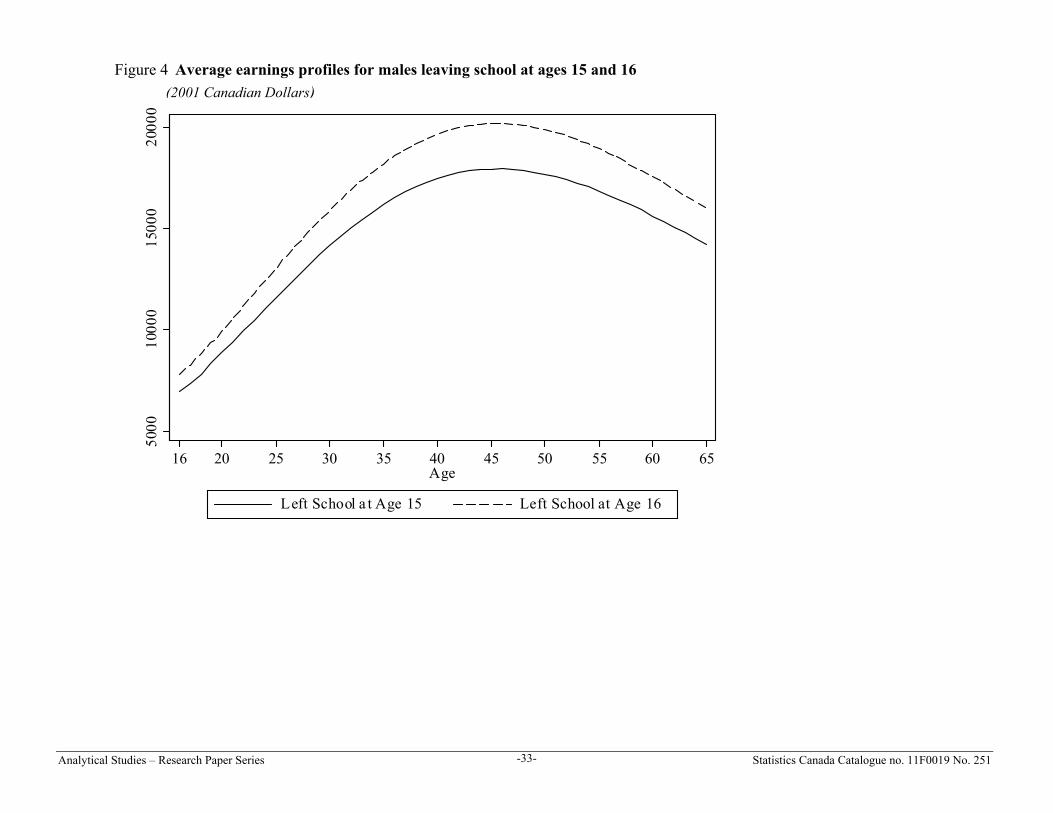
To get some estimate of the financial lifetime gain from compulsory schooling, Figure 4 shows predicted income profiles for males that left school at age 15 or age 16 from regressing equation (2) with an added quartic in age. The specification that the return from compulsory schooling is constant, estimated at 11.8 percent, is clearly an
8. It may be worth pointing out that compulsory schooling became more restrictive every time a law changed over time. Therefore, all of the identification comes from laws that raise the average education attainment faster for some provinces than others, and corresponding with the law changes. The discontinuity in the Figure 3 helps show that the law changes led to a sharp and sudden increase in education attainment. Another study shows similar estimates of returns to compulsory schooling using only regions in the United States that experienced a decrease in the laws [Oreopoulos, 2003)].

Analytical Studies – Research Paper Series - 20 - Statistics Canada Catalogue no. 11F0019 No. 251
assumption. Allowing the return to differ by age does not alter this discussion.9 The profiles take the usual shape, increasing at early ages and peak at age 47. The amounts are measured in 2001 Canadian dollars. Table 7 converts the annual differences between these profiles into present value amounts using alternative discount rates. The appropriate discount rate is the risk-free rate, although the present value conversion using higher rates is also shown. Table 7 also considers lower annual returns to compulsory schooling using rates of 10 and 8 percent. With a 3 percent discount rate, the estimated present value increase in income from compelling a would-be-dropout to continue an extra grade is about $44,450. That amount is more than 6 times the first year earnings of the student that leaves at age 15, and more than 2 times her maximum annual salary. Using a 5 percent discount rate and an 8 percent return, the predicted present value difference in earnings is still greater than a dropout’s peak annual earnings. The costs from attaining an extra grade may extend beyond forgone earnings and school expenditure costs. Students may incur psychological costs, or additional liquidity constraint costs from being obliged to attend more school. These costs cannot easily be measured. A social planner would have to assess whether the costs from school compulsion offset the present value subsequent gains. While it is impossible to tell from this data, another paper provides some evidence that liquidity constraint costs and psychological costs from attending school do not appear significantly large [Oreopoulos, 2003]. Furthermore, any non-pecuniary gains from compulsory schooling, such as utility gains from being less likely to be unemployed, or more likely to be in a more enjoyable job, would also have to be included when comparing direct costs and benefits. Another consideration is whether the above results are driven by positive or negative externalities for others not directly affected. Negative externalities might arise, for example, if increasing the supply of high school graduates with compulsion, relative to high school dropouts, leads to lower wages for graduates. In an attempt to test this, Table 8 shows the results from regressing log income on the mandatory number of school years faced when aged 14, and the number of mandatory school years faced by other birth cohorts. The regression includes birth cohort and province fixed effects, as well as the provincial controls. This reduced form equation shows the overall (income) effect of raising school attendance on the cohort directly influenced, and the effect from raising school attendance on earlier and later cohorts. If school compulsion raises wages for those directly affected at the expense of other cohorts, we should expect to see the coefficient on mandatory number of school years faced to be positive, while that for other cohorts to be negative. On the other hand, the presence of positive externalities (on adult income) may lead to the coefficient for the laws faced by other cohorts to be positive. Table 8 indicates the school laws faced by individuals when young impact income directly, but the laws faced by other cohorts have no significant effect. Increasing a cohort’s school leaving age or reducing their school entry age year raises adult income, on average, by about 1.4 percent. But raising the school leaving age for cohorts born a few 9. For an example, see Oreopoulos (2003).

Analytical Studies – Research Paper Series - 21 - Statistics Canada Catalogue no. 11F0019 No. 251
years earlier or later does not affect average income. This result occurs whether analyzing the full sample, or just the sample that never attained Grades 12 or 13. Whether looking at cohorts born a few years later or earlier, the coefficient on their mandatory number of school years is consistently around zero. These results suggest compulsory schooling has no additional negative or positive affect on income for cohorts not directly affected.
VII. Conclusion
Education levels rose dramatically in Canada between 1920 and 1970. The national grade attainment average increased from 8.1 to 11.3. Provinces also implemented or tightened many compulsory school limits. Changes in these limits are estimated to have had a significant impact on the rise in grade attainment, accounting for about 13 percent of the rise. Those affected experienced about a 14 percent increase in their annual income. Compelling would-be-dropouts to take additional education also lowered the chances for unemployment, decreased the chances of working in a manual occupation, and raised the fraction reporting speaking both English and French. There is little, if any, evidence suggesting that the law changes affected income of other cohorts indirectly. The results presented here reinforce similar estimates of the benefits from compulsory schooling found in the United States and United Kingdom. Taken together, they suggest compelling early school leavers to stay on longer generated real gains. Whether these gains were offset by the direct costs of attending school another year is subject to debate. The costs would have to exceed at least 2 times a dropout’s maximum annual income for a social planner to have preferred not imposing the law changes. Compulsory attendance laws have existed for more than a hundred years, and policies to mandate further education continue to be discussed. The implications of raising the minimum school leaving age further are not well understood. Evidence presented here suggests these types of policies were previously very effective in raising lifetime welfare.

Analytical Studies – Research Paper Series Statistics Canada Catalogue no. 11F0019 No. 251 -22-
School leaving age = 14 0.228 0.1926 0.1179 0.1001 0.1108 0.2047[0.0608]*** [0.0644]*** [0.0601]* [0.0603]* [0.0640]* [0.0645]***
School leaving age = 15 0.8555 0.702 0.6142 0.4939 0.5181 0.6111[0.0576]*** [0.0683]*** [0.0644]*** [0.0646]*** [0.0699]*** [0.0862]***
School leaving age = 16 0.482 0.3033 0.3243 0.2105 0.2207 0.2878[0.0524]*** [0.0664]*** [0.0584]*** [0.0682]*** [0.0734]*** [0.0787]***
Exemptions to leaving age allowed -0.2668 -0.2518 -0.2717 -0.2616 -0.2583[0.0295]*** [0.0274]*** [0.0280]*** [0.0291]*** [0.0328]***
School entry age = 7 0.3191 0.3544 0.3272 0.3207[0.0512]*** [0.0509]*** [0.0548]*** [0.0563]***
School entry age = 6 0.1835 0.1117 0.1002 0.095[0.0280]*** [0.0286]*** [0.0272]*** [0.0255]***
Number of mandatory school years 0.1851 0.1324[0.0121]*** [0.0127]***
Log provincial school expenditure 0.1823 0.1531 0.1774 0.2832[0.0318]*** [0.0347]*** [0.0331]*** [0.0487]***
Fraction in province in rural area -0.0832 -0.164 -1.1994[0.1939] [0.1843] [0.3302]***
Fraction in province in manufacturing 4.0468 4.0591 4.9888[1.3602]*** [1.3442]*** [2.3131]**
Number of schools in province per student 3.3149 4.2732[2.4471] [2.4987]*
Number of teachers in province per student -21.8088 -15.3073[6.6833]*** [9.7826]
Number of individuals
Grouped observations 2010 2010 2010 2010 2010 2010 2010 2010
R-squared 0.96 0.97 0.97 0.97 0.97 0.97 0.94 0.95
Table 1Effects of compulsory schooling and child labour laws on education attainment
Full sample: (Grade attainment mean = 10.27)Dependent Variable = Grade Attainment
Notes: Regressions are on cell means from Census data, grouped by birth cohort, province, and census year. All regressions are weighted by cell sample size and include fixedeffects for province, birth cohort, and census year. Huber-White standard errors are shown, clustered by province and birth cohort. One, two, and three asterisks indicatecoefficient is significantly different from zero at a 10%, 5%, and 1% confidence level. See text for details.

Analytical Studies – Research Paper Series Statistics Canada Catalogue no. 11F0019 No. 251 -23-
Gr. 7 Attained Gr. 8 Attained Gr. 9 Attained Gr. 10 Attained Gr. 11 Attained High School Cert. College College or More University Degree
School dropout age =14 0.0493 0.0148 0.0067 -0.0061 -0.0134 -0.0024 0.002 0.0013 -0.0004[0.0116]*** [0.0141] [0.0092] [0.0095] [0.0084] [0.0060] [0.0058] [0.0061] [0.0035]
School dropout age =15 0.0974 0.1169 0.0725 0.0682 0.0311 -0.004 0.0028 0.0019 0.0015[0.0148]*** [0.0200]*** [0.0120]*** [0.0127]*** [0.0101]*** [0.0071] [0.0059] [0.0066] [0.0039]
School dropout age =16 0.0559 0.0455 0.0275 0.0152 -0.014 -0.0037 0.0112 -0.0063 -0.0088[0.0135]*** [0.0180]** [0.0109]** [0.0116] [0.0086] [0.0057] [0.0046]** [0.0056] [0.0034]**
Exemptions to leaving age -0.0463 -0.0664 -0.0327 -0.028 -0.0223 0.0052 -0.0018 -0.0025 -0.001allowed [0.0054]*** [0.0079]*** [0.0045]*** [0.0051]*** [0.0038]*** [0.0023]** [0.0017] [0.0021] [0.0013]
School entry age = 7 0.0592 0.0458 0.0512 0.0089 -0.001 0.0019 -0.0011 -0.0006 0.0018[0.0086]*** [0.0119]*** [0.0094]*** [0.0103] [0.0096] [0.0075] [0.0054] [0.0054] [0.0028]
School entry age = 6 0.0244 0.0225 0.0098 -0.004 -0.0058 0.003 -0.0013 -0.0126 -0.0051[0.0041]*** [0.0056]*** [0.0043]** [0.0052] [0.0041] [0.0032] [0.0023] [0.0024]*** [0.0015]***
Mandatory number ofschool years 0.0255 0.027 0.019 0.0118 0.0037 0.0007 0.0004 -0.0007 -0.0006(separate regression) [0.0014]*** [0.0016]*** [0.0014]*** [0.0012]*** [0.0010]*** [0.0009] [0.0008] [0.0009] [0.0006]
Table 2Effects of compulsory schooling and child labour laws on various education attainment levels
Detailed specification
Summary specification
Notes: Regressions are on cell means from Census data, grouped by birth cohort, province, and census year. All regressions are weighted by cell sample size. The regressions include controls for log provincial public school expenditure,fraction by province in rural area, fraction by province in manufacturing sector, number of schools in province, number of teachers in province, and fixed effects for province, birth cohort, and census year. Huber-White standard errors areshown, clustered by province and birth cohort. One, two, and three asterisks indicate coefficient is significantly different from zero at a 10%, 5%, and 1% confidence level. See text for details.

Analytical Studies – Research Paper Series Statistics Canada Catalogue no. 11F0019 No. 251 -24-
Full sample Dropout sample Full sample Dropout sample
School dropout age =14 0.2047 0.0813 0.4031 0.2955[0.0645]*** [0.0750] [0.0488]*** [0.0627]***
School dropout age =15 0.6111 0.6114 0.6737 0.6481[0.0862]*** [0.0927]*** [0.0621]*** [0.0808]***
School dropout age =16 0.2878 0.0394 0.3926 0.2776[0.0787]*** [0.0770] [0.0533]*** [0.0662]***
Exemptions to leaving age allowed -0.2583 -0.2079 -0.1083 -0.0335[0.0328]*** [0.0295]*** [0.0341]*** [0.0448]
School entry age = 7 0.3207 0.4416 0.3975 0.5655[0.0563]*** [0.0699]*** [0.0491]*** [0.0639]***
School entry age = 6 0.095 0.2605 0.3006 0.4922[0.0255]*** [0.0384]*** [0.0403]*** [0.0577]***
Grouped observations 2010 2010 2010 2010
Table 3
Population weights No weights
Effects of compulsory schooling on education attainment alternative samples and weighting
Notes: Regressions are on cell means from Census data, grouped by birth cohort, province, and census year. The first two columns areweighted by cell sample size. The last two columns give equal weight to provinces and birth cohorts. The regressions include controls forlog provincial public school expenditure, fraction by province in rural area, fraction by province in manufacturing sector, number ofschools in province, number of teachers in province, and fixed effects for province, birth cohort, and census year. Huber-White standarderrors are shown, clustered by province and birth cohort. One, two, and three asterisks indicate coefficient is significantly different fromzero at a 10%, 5%, and 1% confidence level. See text for details.

Analytical Studies – Research Paper Series Statistics Canada Catalogue no. 11F0019 No. 251 -25-
Full sample Dropout sample Full sample Dropout sample Full sample Dropout sample
Log income 0.112 0.097 0.1229 0.165 0.1421 0.1854[0.002]*** [0.005]*** [0.0138]*** [0.0148]*** [0.0249]*** [0.0258]***
Log earnings 0.1 0.085 0.0709 0.117 0.0783 0.1248[0.003]*** [0.006]*** [0.0085]*** [0.0140]*** [0.0180]*** [0.0208]***
Log income males 0.11 0.102 0.0787 0.1102 0.1161 0.153[0.004]*** [0.004]*** [0.0157]*** [0.0194]*** [0.0264]*** [0.0311]***
Log earnings males 0.088 0.076 0.0439 0.0823 0.07 0.1125[0.004]*** [0.004]*** [0.0106]*** [0.0156]*** [0.0213]*** [0.0280]***
Log household income 0.115 0.102 0.051 0.1044 0.1022 0.145[0.001]*** [0.004]*** [0.0190]** [0.0172]*** [0.0238]*** [0.0264]***
Table 4
OLS IV: No weights
OLS and IV estimates for the effect of grade attainment on earnings and income
IV: Population weights
Notes: Instrumental variable regressions instrument grade attainment on school leaving ages, an employment certificate exemption indicator, and school entry laws(first stage shown in previous tables). Regressions are on cell means from Census data, grouped by birth cohort, province, and census year. All regressions areweighted by cell mean sample sizes, except the last two columns, which are show unweighted results. The regressions include controls for log provincial publicschool expenditure, fraction by province in rural area, fraction by province in manufacturing sector, number of schools in province, number of teachers in province,and fixed effects for province, birth cohort, and census year. Huber-White standard errors are shown, clustered by province and birth cohort. One, two, and threeasterisks indicate coefficient is significantly different from zero at a 10%, 5%, and 1% confidence level. See text for details.

Analytical Studies – Research Paper Series Statistics Canada Catalogue no. 11F0019 No. 251 -26-
Grade attained 0.1229 0.0942 0.0888 0.1311 0.1607 0.165 0.1035 0.1439 0.1787 0.1857population weights [0.0138]*** [0.0145]*** [0.0114]*** [0.0126]*** [0.0134]*** [0.0148]*** [0.0193]*** [0.0152]*** [0.0116]*** [0.0167]***
Grade attained 0.1421 0.0925 0.088 0.1312 0.1205 0.1854 0.1209 0.1494 0.1815 0.1611no weights [0.0249]*** [0.0293]** [0.0117]*** [0.0306]*** [0.0196]*** [0.0258]*** [0.0399]** [0.0157]*** [0.0282]*** [0.0273]***
Years included All years 1920-50 1930-60 1940-70 1950-80 All years 1920-50 1930-60 1940-70 1950-80
Table 5
IVFull sample
IVDropout sample
OLS and IV estimates for the effect of grade attainment on earnings and income for different time periods
Notes: Instrumental variable regressions instrument grade attainment on school leaving ages, an employment certificate exemption indicator, and school entry laws (first stage shown inprevious tables). Regressions are on cell means from Census data, grouped by birth cohort, province, and census year. The top row is weighted by cell mean sample size, while the bottomrow excludes weights. The regressions include controls for log provincial public school expenditure, fraction by province in rural area, fraction by province in manufacturing sector, numberof schools in province, number of teachers in province, and fixed effects for province, birth cohort, and census year. Huber-White standard errors are shown, clustered by province and birthcohort. One, two, and three asterisks indicate coefficient is significantly different from zero at a 10%, 5%, and 1% confidence level. See text for details.

Analytical Studies – Research Paper Series - 27 - Statistics Canada Catalogue no. 11F0019 No. 251
MeanFull sample Dropouts Full sample Dropouts Full sample Dropouts
Unemployed; looking for work 0.044 -0.008 -0.004 0.005 -0.01 0.001 -0.008[0.001]*** [0.001]*** [0.002]* [0.003]*** [0.001] [0.002]***
Working 0.478 0.039 0.035 0.013 0.057 0.0393 0.059[0.003]*** [0.002]*** [0.010] [0.017]*** [0.0068]*** [0.0074]***
Manual occupation 0.237 -0.047 -0.027 -0.008 -0.05 -0.0189 -0.0636[0.003]*** [0.003]*** [0.006] [0.004]*** [0.0074]** [0.0036]***
Clerical service occupation 0.410 0.013 0.016 0.054 0.056 0.0335 0.0486[0.001]*** [0.001]*** [0.013]*** [0.012]*** [0.0061]*** [0.0053]***
Prof. manager 0.363 0.042 0.018 -0.026 -0.001 -0.01 0.0238[0.002]*** [0.003]*** [0.010]** [0.007] [0.0063] [0.0097]**
Bilingual 0.201 0.025 0.022 0.026 0.013 0.0431 0.0135[0.017] [0.017] [0.007]*** [0.007]*** [0.0118]*** [0.0094]
Below low income level 0.131 -0.041 -0.039 -0.051 -0.079 -0.0399 -0.0521[0.002]*** [0.001]*** [0.008]*** [0.010]*** [0.0027]*** [0.0049]***
Unemployment Insurance Benefits 0.118 -0.009 -0.002 0.009 0.005 0.0012 -0.0027[0.001]*** [0.002] [0.006] [0.011] [0.0057] [0.0068]
OLS and IV estimates for the effect of grade attainment on various outcomesTable 6
OLS IV: Equal weightIV: Population weight
Notes: Instrumental variable regressions instrument grade attainment on school leaving ages, an employment certificate exemption indicator, and school entry laws (first stage shown inprevious tables). Regressions are on cell means from Census data, grouped by birth cohort, province, and census year. All regressions are weighted by cell mean sample sizes, exceptthe last two columns, which are show unweighted results. The regressions include controls for log provincial public school expenditure, fraction by province in rural area, fraction byprovince in manufacturing sector, number of schools in province, number of teachers in province, and fixed effects for province, birth cohort, and census year. Huber-White standarderrors are shown, clustered by province and birth cohort. One, two, and three asterisks indicate coefficient is significantly different from zero at a 10%, 5%, and 1% confidence level.See text for details.

Analytical Studies – Research Paper Series Statistics Canada Catalogue no. 11F0019 No. 251 -28-
Discount rate Income Peak income(at age 16) (at age 47)
0.118 0.1 0.08
0.03 44,453 38,118 31,038 6,927 17,943
0.05 29,890 25,811 21,253 6,927 17,943
0.07 21,438 18,658 15,552 6,927 17,943
Table 7Average present value financial return from compelling extra grade(in 2001 Canadian dollars)
Constant annual return from an extra grade of high school

Analytical Studies – Research Paper Series Statistics Canada Catalogue no. 11F0019 No. 251 -29-
Cohort years Mand. years Mand. yearsapart Mand. years for later cohorts Mand. Years for later cohorts
-7 years 0.0141 -0.002 0.0141 0.0032[0.0026]*** [0.0022] [0.0038]*** [0.0020]
-6 years 0.0141 -0.0023 0.0158 0.0019[0.0024]*** [0.0021] [0.0036]*** [0.0019]
-5 years 0.014 -0.0024 0.0169 0.0008[0.0023]*** [0.0020] [0.0035]*** [0.0018]
-4 years 0.0137 -0.0023 0.0175 0.0002[0.0023]*** [0.0020] [0.0034]*** [0.0017]
-3 years 0.0132 -0.0019 0.0176 0.0002[0.0022]*** [0.0020] [0.0033]*** [0.0017]
0.0119 0.0177[0.0023]*** [0.0033]***
3 years 0.0132 -0.0019 0.0176 0.0002[0.0022]*** [0.0020] [0.0033]*** [0.0017]
4 years 0.0137 -0.0023 0.0175 0.0002[0.0023]*** [0.0020] [0.0034]*** [0.0017]
5 years 0.014 -0.0024 0.0169 0.0008[0.0023]*** [0.0020] [0.0035]*** [0.0018]
6 years 0.0141 -0.0023 0.0158 0.0019[0.0024]*** [0.0021] [0.0036]*** [0.0019]
7 years 0.0141 -0.002 0.0141 0.0032[0.0026]*** [0.0022] [0.0038]*** [0.0020]
Table 8Effect of raising mandatory number of school years on average log incomefor different birth cohorts
Full sample Dropout sample

Analytical Studies – Research Paper Series Statistics Canada Catalogue no. 11F0019 No. 251 -30-
Figure 1 Minimum school leaving ages and maximum school entry ages by province, 1900 – 2000
6 8
12 14 16 18
6 8
12 14 16 18
6 8
12 14 16 18
1900 1920 1940 1960 1980 2000 1900 1920 1940 1960 1980 2000
1900 1920 1940 1960 1980 2000 1900 1920 1940 1960 1980 2000
Alberta British Columbia Manitoba New Brunswick
Newfoundland Nova Scotia Ontario P.E.I.
Quebec Saskatchewan
Minimum School Leaving Age
Maximum School Entry Age
AG
E

Analytical Studies – Research Paper Series Statistics Canada Catalogue no. 11F0019 No. 251 -31-
Figure 2 Average grade attainment by year turned 14 years old and province, 1900 – 2000
6
8
10
12
6
8
10
12
6
8
10
12
1900 1920 1940 1960 1980 2000 1900 1920 1940 1960 1980 2000
1900 1920 1940 1960 1980 2000 1900 1920 1940 1960 1980 2000
Alberta British Columbia Manitoba New Brunswick
Newfoundland Nova Scotia Ontario P.E.I.
Quebec Saskatchewan
Ave
rage
gra
de a
ttain
men
t

Analytical Studies – Research Paper Series Statistics Canada Catalogue no. 11F0019 No. 251 -32-
Figure 3 Adult education attainment and earnings for cohorts aged 14 before and after increases in the minimum school leaving age
-.04
-.01
0.0
1.0
2.0
3.0
4Lo
g An
nual
Ear
ning
s (n
orm
aliz
ed)
-.2-.1
0.1
.2.3
.8G
rade
Com
plet
ed (n
orm
aliz
ed)
-12 -10 -8 -6 -4 -2 0 2 4 6 8 10 12Leads and Lags before Compulsory School Year Increase...
Grade Completed (normalized)
Log Annual Earnings (normalized)
Analytical Studies – Research Paper Series Statistics Canada Catalogue no. 11F0019 No. 251 -33-
Figure 4 Average earnings profiles for males leaving school at ages 15 and 16 (2001 Canadian Dollars)
5000
1000
015
000
2000
0
16 20 25 30 35 40 45 50 55 60 65Age
Left School a t Age 15 Left School at Age 16

Analytical Studies – Research Paper Series - 34 - Statistics Canada Catalogue no. 11F0019 No. 251
References
Acemoglu, Daron and Joshua Angrist. 2002. “How Large are the Social Returns to Education? Evidence from Compulsory Schooling Laws.”NBER Macroeconomics Annual. Angrist, Joshua D., and Alan Krueger. 1991. “Does Compulsory School Attendance Affect Schooling and Earnings?” Quarterly Journal of Economics. 106, 4: 979–1014. Axelrod, Paul. 1997. The Promise of Schooling: Education in Canada, 1800–1914. University of Toronto Press. Toronto. Becker, Gary S. 1965. Human Capital: A Theoretical and Empirical Analysis, with Special Reference to Education. Columbia University Press for the National Bureau of Economic Research. second edition. New York, NY. Bound, John, David A. Jaeger, and Regina M. Baker. 1995. “Problems with instrumental variables estimation when the correlation between the instruments and the endogenous explanatory variable is weak.” Journal of the American Statistical Association. 90, 430: 443–450. Chiswick, Barry R. 1967. “Minimum Schooling Legislation and the Cross-Sectional Distribution of Income.” The Economic Journal. 79, 315: 495–507. Cruz, Louis M. and Marcelo Moreira. 2002. “Recipes for Applied Researchers: Inference when Instruments may be Weak.” Mimeo, University of California, Berkeley. Dee, Thomas. 2003.“Are there civic returns to education?” NBER Working Paper No. 9588. National Bureau of Economic Research. Cambridge, Mass. Eckstein, Zvi and Itzhak Zilcha. 1994. “The effects of compulsory schooling on growth, income distribution and welfare,” Journal of Public Economics. 54, 3: 339–359. Goldin, Claudia, and Lawrence F. Katz. 2003. “Mass Secondary Schooling and the State: The Role of State Compulsion in the High School Movement.” Mimeo. Henley, Richard. 1993. “The School Question Continued: The Issue of Compulsory Schooling in Manitoba.” Chapter 2 in Issues in the History of Education in Manitoba: From the Construction of the Common School to the Politics of Voices. Rosa del C. Bruno-Jofre (ed.) Edwin Mellen Press. Queenston, Ontario. Lang, K. and D. Kropp. 1986. “Human Capital vs. Sorting: The Effect of Compulsory Attendance Laws.” Quarterly Journal of Economics. 101, 3: 609–624.

Analytical Studies – Research Paper Series - 35 - Statistics Canada Catalogue no. 11F0019 No. 251
Lleras-Muney, Adriana. 2002a. “The Relationship Between Education and Adult Mortality in the U.S.” NBER Working Paper No. 8986. National Bureau of Economic Research. Cambridge, Mass. Lleras-Muney, Adriana. 2002b. “Were Compulsory Attendance and Child Labor Laws Effective? An Analysis from 1915 to 1930.” Journal of Law and Economics. 45, 2 (Pt.1): 401–435. Lochner, Lance, and Enrico Moretti. 2001. “The Effect of Education on Crime: Evidence from Prison inmates, Arrests, and Self-Reports.” NBER Working Paper No. 8986. National Bureau of Economic Research. Cambridge, Mass. Milligan, Kevin, Enrico Moretti, and Philip Oreopoulos. 2003. “Does education improve citizenship? Evidence from the U.S. and the U.K.” NBER Working Paper No. 9584. National Bureau of Economic Research. Cambridge, Mass. Oreopoulos, Philip. 2003. “Do Dropouts Drop Out Too Soon? International Evidence from Changes in School-Leaving Laws.” NBER Working Paper No. 10155. National Bureau of Economic Research. Cambridge, Mass. Oreopoulos, Philip, Marianne Page and Ann Stevens. 2003 “Does Human Capital Transfer from Parent to Child? The Intergenerational Effect of Compulsory Schooling.” Mimeo. Phillips, Charles E. 1957. The Development of Education in Canada. W.J. Gage and Company Limited. Toronto. Prentice, Alison L. and Susan E. Houston. 1975. Family, School and Society in nineteenth century Canada. Oxford University Press. Toronto. Province of New Brunswick. 1998. School Leaving Age Task Force, “High School Graduation: The New School Leaving Age: Findings and Recommendations of The School Leaving Age Task Force.” Province of New Brunswick. Mimeo. Schmidt, Stefanie. 1996. “School Quality, Compulsory Education Laws, and the Growth of American High School Attendance. 1915–1935.” MIT Ph.D. Dissertation. Staiger, Douglas, and James Stock. 1997. “Instrumental Variables Estimation with Weak Instruments.” Econometrica. 65, 3: 557–86. Sweetman, Arthur. 2001. “What if High School Were a Year Longer? Evidence from Newfoundland.” Mimeo.

Analytical Studies – Research Paper Series - 36 - Statistics Canada Catalogue no. 11F0019 No. 251
Data Appendix
A. Constructing the Compulsory School Law Variables The three compulsory school law variables used in this paper summarize a complex set of policies. For most of the provinces, identifying the minimum school leaving age since 1900 was straightforward from accessing historical provincial legislation and the Dominion Bureau of Statistics’ annual survey of education. On occasion in the first half of the century, some provinces had two school leaving ages: one for towns and one for rural areas. There were not enough of these cases to identify accurately separate effects. In these cases, the town school leaving age was used. Some provinces exempted students from attending school. The exemption requirements varied widely from province to province and year to year. The exemptions indicator variable equals one if: home permits or work certificates were allowed in any form; parents could claim their children had to work for reasons of subsistence; or mandatory attendance was for 6 months or less in a year. The variable equals zero otherwise. In 1920, 36 percent of 14-year olds faced some type of exemption. By 1970, 14 percent of 14-year olds faced exemptions. The mandatory number of school years variable was created as the difference between the school leaving age an individual faced when aged 14 and the school entry age faced when aged 6. If no dropout age existed, a dropout age of 10 was used, and if no school entry age existed, an entry age of 8 was used. If youths had to remain until the end of the school year, even after attaining the school leaving age, before being allowed to leave, the mandatory number of school years was increased by 0.5. B. Constructing the Provincial Controls The regressions in the paper include five controls for provincial economic and social trends: log education expenditure per student, number of schools per student, number of teachers per student, fraction in province in a rural area, and fraction of workers in province working in the manufacturing sector. Aggregates of the first three variables come from the Dominion Bureau of Statistics’ Annual Surveys of Education. Values exist for most years between 1920 and 1970. The Consumer Price Index was used to convert total education expenditure by province and year into real terms (in 1991 dollars). All variables were smoothed using STATA’s ksm function, with a bandwidth of 0.1. Values are imputed for missing years by linear interpolation and the aggregate values by the population of 5 to 16 year olds by province and year are divided. The population data comes from Statistics Canada’s social-economic database, CANSIM. The rural and manufacturing variables were created using tables published from the 1921, 1931, 1941, 1951, 1956, 1961, 1966, and 1971 Censuses. For the fraction in a rural area, the number of individuals in a rural area (for each province) are divided by the total provincial population. For the fraction of workers in the manufacturing sector, the

Analytical Studies – Research Paper Series - 37 - Statistics Canada Catalogue no. 11F0019 No. 251
number of workers in the manufacturing sector are divided by the total number of workers. Missing values were imputed by linear interpolation.

Analytical Studies – Research Paper Series - 38 - Statistics Canada Catalogue no. 11F0019 No. 251
Data Appendix References Axelrod, Paul Douglas. The Promise of Schooling, University of Toronto Press Incorporated, Toronto, 1997. Dominion Bureau of Statistics, Advance Statistics of Education, Ottawa, 1967-1979. Dominion Bureau of Statistics, Elementary and Secondary Education in Canada, Ottawa, 1936-1958. Dominion Bureau of Statistics, Historical Statistical Survey of Education in Canada, Ottawa, 1919-1933. Dominion Bureau of Statistics, Survey of Education Finance, Ottawa, 1961-1965. Dominion Bureau of Statistics, Survey of Elementary and Secondary Education, Ottawa, 1958-1963. Phillips, Charles E., Development of Education in Canada, W.J. Gage and Company Limited, Toronto, 1957. Statistics Canada, Education in Canada: A Statistical Review, Ottawa, 1973-2000. Statistics Canada, Elementary & Secondary School Enrolment, Ottawa, 1978/79-1991/92. Statistics Canada, Financial Statistics of Education, Ottawa, 1980/81-1985/86. Statutes and Revised Statutes for the Province of Quebec, “Children’s Apprenticeship Act,” The Government of Quebec, Québec, Various years. The Government of Alberta, Statutes and Revised Statutes for the Province of Alberta, “An Act Respecting School Attendance,” Edmonton, Various years. The Government of Alberta, Statutes and Revised Statutes for the Province of Alberta, “An Act Respecting Truancy and Compulsory School Attendance,” Edmonton, Various years. The Government of Alberta, Statutes and Revised Statutes for the Province of Alberta, “Labour Act, The,” Edmonton, Various years. The Government of Alberta, Statutes and Revised Statutes for the Province of Alberta, “The School Act,” Edmonton, Various years. The Government of Alberta, Statutes and Revised Statutes for the Province of Alberta, “The School Attendance Act,” Edmonton, Various years.

Analytical Studies – Research Paper Series - 39 - Statistics Canada Catalogue no. 11F0019 No. 251
The Government of British Columbia, Statutes and Revised Statutes for the Province of British Columbia, “An Act to Control the Employment of Children Act,” Victoria, Various years. The Government of British Columbia, Statutes and Revised Statutes for the Province of British Columbia, “Employment Standards Act, Victoria, Various years. The Government of British Columbia, Statutes and Revised Statutes for the Province of British Columbia, “Factories Act,” Victoria, 1911. The Government of British Columbia, Statutes and Revised Statutes for the Province of British Columbia, “The Public School Act,” Victoria, Various years. The Government of British Columbia, Statutes and Revised Statutes for the Province of British Columbia, “The School Act,” Victoria, Various years. The Government of Manitoba, Statutes and Revised Statutes for the Province of Manitoba, “An Act Respecting School Attendance,” Winnipeg, Various years. The Government of Manitoba, Statutes and Revised Statutes for the Province of Manitoba, “The Public School Act,” Winnipeg, Various years. The Government of Manitoba, Statutes and Revised Statutes for the Province of Manitoba, “The School Attendance Act,” Winnipeg, Various years. The Government of Manitoba, Winnipeg, Statutes and Revised Statutes for the Province of Manitoba, “The Child Welfare Act,” Various years. The Government of New Brunswick, Statutes and Revised Statutes for the Province of New Brunswick, “The Schools Act,” Fredericton, Various years. The Government of New Brunswick, Statutes and Revised Statutes for the Province of New Brunswick, “The School Attendance Act,” Fredericton, Various years. The Government of Newfoundland, Statutes and Revised Statutes for the Province of Newfoundland, “The Child Welfare Act,” St. John’s, Various years. The Government of Newfoundland, Statutes and Revised Statutes for the Province of Newfoundland, “The School Attendance Act,” St. John’s, Various years. The Government of Newfoundland, Statutes and Revised Statutes for the Province of Newfoundland, “The Welfare of Children Act,” St. John’s, Various years. The Government of Nova Scotia, Halifax, Statutes and Revised Statutes for the Province of Nova Scotia, “The Education Act,” Various years.
Analytical Studies – Research Paper Series - 40 - Statistics Canada Catalogue no. 11F0019 No. 251
The Government of Nova Scotia, Halifax, Statutes and Revised Statutes for the Province of Nova Scotia, “Employment of Children Act,” Various years. The Government of Nova Scotia, Statutes and Revised Statutes for the Province of Saskatchewan, “An Act Respecting the Employment of Children,” Halifax, Various years. The Government of Nova Scotia, Statutes and Revised Statutes for the Province of Nova Scotia, “Compulsory Attendance At School Act,” Halifax, Various years. The Government of Nova Scotia, Statutes and Revised Statutes for the Province of Nova Scotia, “Labour Standards Act,” Halifax, Various years. The Government of Ontario, Statutes and Revised Statutes for the Province of Ontario, “Adolescent School Attendance Act,” Toronto, Various years. The Government of Ontario, Statutes and Revised Statutes for the Province of Ontario, “Factories, Shops, Office Buildings Act,” Toronto, Various years. The Government of Ontario, Statutes and Revised Statutes for the Province of Ontario, “The School Attendance Act,” Toronto, Various years. The Government of Ontario, Toronto, Statutes and Revised Statutes for the Province of Ontario, “The Education Act,” Various years. The Government of Prince Edward Island, Statutes and Revised Statutes for the Province of Prince Edward Island, “The Minimum Age of Employment Act,” Charlottetown, Various years. The Government of Prince Edward Island, Statutes and Revised Statutes for the Province of Prince Edward Island, “The Public School Act,” Charlottetown, Various years. The Government of Prince Edward Island, Statutes and Revised Statutes for the Province of Prince Edward Island, “The Public Schools Act,” Charlottetown, Various years. The Government of Prince Edward Island, Statutes and Revised Statutes for the Province of Prince Edward Island, “The School Act,” Charlottetown, Various years. The Government of Prince Edward Island, Statutes and Revised Statutes for the Province of Prince Edward Island, “Youth Employment Act,” Charlottetown, Various years. The Government of Quebec, Statutes and Revised Statutes for the Province of Quebec, “An Act Respecting Compulsory School Attendance,” Québec, Various years. The Government of Quebec, Statutes and Revised Statutes for the Province of Quebec, “An Act Respecting Industrial Schools,” Québec, Various years.

Analytical Studies – Research Paper Series - 41 - Statistics Canada Catalogue no. 11F0019 No. 251
The Government of Quebec, Statutes and Revised Statutes for the Province of Quebec, “Compulsory School Attendance Act,” Québec, Various years. The Government of Quebec, Statutes and Revised Statutes for the Province of Quebec, “The Education Act,” Québec, Various years. The Government of Saskatchewan, Statutes and Revised Statutes for the Province of Saskatchewan, “An Act Respecting School Attendance,” Regina, Various years. The Government of Saskatchewan, Statutes and Revised Statutes for the Province of Saskatchewan, “The Education Act,” Regina, Various years. The Government of Saskatchewan, Statutes and Revised Statutes for the Province of Saskatchewan, “The School Act,” Regina, Various years. The Government of Saskatchewan, Statutes and Revised Statutes for the Province of Saskatchewan, “The School Attendance Act,” Regina, Various years.