analytical method development and...
TRANSCRIPT

50
Overview:
The primary focus of this chapter is on general approaches and considerations toward development of chromatographic (HPLC/UPLC) methods for separation, identification, and quantification of pharmaceutical compounds, which may be applied within the various functions in the drug development continuum. The chapter also discusses the issues and parameters that must be considered in the validation of analytical methods. At the end of the chapter, a scope of the present research study is covered.
Chapter-2
Analytical Method Development and Validation

51
Analytical Method Development and Validation
2.1 GENERAL INTRODUCTION
The number of drugs introduced into the market is increasing every year. These drugs may be
either new entities or partial structural modification of the existing one. Very often there is a time
lag from the date of introduction of a drug into the market to the date of its inclusion in
pharmacopoeias. This happens because of the possible uncertainties in the continuous and wider
usage of these drugs, reports of new toxicities (resulting in their withdrawal from the market),
development of patient resistance and introduction of better drugs by competitors. Under these
conditions, standards and analytical procedures for these drugs may not be available in the
pharmacopoeias. There is a scope, therefore to develop newer analytical methods for such drugs.
Analytical methods development and validation play important roles in the discovery,
development, and manufacture of pharmaceuticals [1-4]. Pharmaceutical products formulated
with more than one drug, typically referred to as combination products, are intended to meet
previously unmet patients need by combining the therapeutic effects of two or more drugs in one
product. These combination products can present daunting challenges to the analytical chemist
responsible for the development and validation of analytical methods. The official test methods
that result from these processes are used by quality control laboratories to ensure the identity,
purity, potency, and performance of drug products.
Identification and quantification of impurities is a crucial task in pharmaceutical process
development for quality and safety [5-7]. Related components are the impurities in
pharmaceuticals which are unwanted chemicals that remain with the active pharmaceutical
ingredients (APIs), or develop during stability testing, or develop during formulation or upon
aging of both API and formulated APIs to medicines. The presence of these unwanted chemicals
even in small amounts may influence the efficacy and safety of the pharmaceutical products.
Various analytical methodologies are employed for the determination of related components in

Chapter-2
52
pharmaceuticals. There is a great need for development of new analytical methods for quality
evaluation of new emerging drugs.
Basic criteria for new method development of drug analysis: [8]
The drug or drug combination may not be official in any pharmacopoeias.
A proper analytical procedure for the drug may not be available in the literature due to
patent regulations.
Analytical methods may not be available for the drug in the form of a formulation due
to the interference caused by the formulation excipients.
Analytical methods for the quantitation of the drug in biological fluids may not be
available.
Analytical methods for a drug in combination with other drugs may not be available.
The existing analytical procedures may require expensive reagents and solvents. It may
also involve cumbersome extraction and separation procedures and these may not be
reliable.
2.2 DEVELOPMENT PROCESS
There are three phases in the Analytical Method Development.
2.2.1 Phase-1 (Planning)
Determine the purpose and regulatory requirements of the method to be developed.
Gather existing information (technical and safety) of the drug substance, known
related substances, and formulation ingredients.
Understand the QC expectations (e.g. analysis time, ease of use, analysis costs,
available instrumentation, etc…).
Estimate the requirements and availability of resources (reference standards, impurity
standards, required sensitivity, selectivity, chirality’s, chemicals, etc…).
Analytical method development and validation
53
In case of troubleshooting of earlier method, review all the data generated by using
the earlier method and plan the study. The samples analyzed by earlier method needs
to be tested by new revised method.
In case compendial method is available, preferably use this method.
2.2.2 Phase-2 (Method development)
Once the planning phase is completed and the parameters are selected for the initial
development, perform the trials and optimize the final method. The method should be capable of
following;
Method should be practical and efficient.
Method is capable to be validated (perform few method validation experiments
during development like Specificity, Accuracy, Solution stability and LOQ).
Method should be specific and stability indicating.
Meaningful system suitability criteria needs to be incorporated for daily usage of the
method like % RSD of area of standard, theoretical plates, tailing factor and
resolution between the closely eluting peaks.
If the method is a troubleshooting of the earlier developed method the samples and
analyzed by earlier method to be analyzed by the new revised method and results
needs to be discussed with advantages of new revised method.
In case of pharmacopoeia method minimum study of excipient interference,
Specificity and solution stability has to be performed in order to check the suitability
of the method for the in-house formulation.
In case of residual solvents it is preferred to adopt the drug substance manufacturer
test method for establishing the workability at our laboratory. If the method is not
working or if there is any specific constraint in such cases alternate test method shall
be adopted which should be validated completely.

Chapter-2
54
In case of Non-compendial product, as far as possible use the Drug substances
method. This will reduce the time of method development and discrepancies related
to Relative response factors, elution pattern, and resolution of degradants from the
main analyte.
Use the available columns in the laboratory in order to develop the method. In case
the separation is inadequate use the readily available columns in the markets.
During development evaluate the critical factors which has impact on the
Repeatability, reproducibility, Accuracy and Resolution between the critical closely
eluting peaks. Add a precautionary note in the final test method.
2.2.3 Phase-3
Issuance of analytical method for routine analysis and method validation
Method issued for routine analysis and Method validation should include at least following
parameters
Name of the method and name of drug substance or drug product for which the
method is issued.
A list of reagents (with grades), standards, instrumentation and equipments.
A list of solution preparations (mobile phase, standards, system suitability solution,
system sensitivity solution and samples).
A list of method conditions (flow rate, wavelength, gradient profile, equilibration
procedure, column temperature, etc…).
System suitability requirements for chromatography and how to calculate.
Sample sequence scheme with diluents, placebo, system suitability, system
sensitivity, standards, samples and bracketing standards.
Calculation formulas.

Analytical method development and validation
55
A table of analyte relative retention times (RRTs) and relative response factors
(RRFs) or response factor (RF).
A representative labeled chromatogram of diluents, placebo, system suitability,
system sensitivity solution, standards and sample solution.
2.2.4 Review of technical package
A comprehensive review should be made on the technical package after the receipt of the same
from the drug substance manufacturer.
Following aspects needs to be taken into consideration:
Adequacy of analytical methods described.
Discussion on the impurities.
Polymorphic characteristics wherever applicable.
Accelerated stability data available.
Forced degradation studies.
Method validation reports.
2.2.5 Evaluation of drug substances
Drug substance lots received from the drug substance manufacturer (procured by purchase
department) should be evaluated for critical parameters using the methods chosen for testing. The
results of the same should be compared against that reported in the COA (certificate of analysis)
of manufacturer. The consistency in quality within the lots should be evaluated. Any
discrepancies observed in the test result should be intimated to purchase and the manufacturer.
2.3 PRELIMINARY ANALYTICAL METHOD
Analytical method development involves continuous process of method improvement in terms of
various experiments and experience being gathered on the project. At the beginning of the

Chapter-2
56
product development a comprehensively developed methods may not be available in absence of
the availability of compendial monograph for the drug product. In such cases the initial analysis
shall be carried out using the preliminary analytical methods.
Following aspects should be looked into while adopting the preliminary analytical method:
2.3.1 Dissolution by UV method
No interference from placebo.
Wavelength selection (for interested compound).
Working concentration having optimum absorbance.
Standard and sample solution stability.
Compatibility with inline filter and syringe filter.
2.3.2 Dissolution by HPLC/UPLC/RRLC method
Column selection.
Mobile phase/ solvent selection.
Mobile phase/ solvent pH selection.
No interference from placebo.
No interference from major degradation product.
No interference from dissolution media.
Working concentration having optimum peak response.
Optimum injection volume.
Wavelength selection.
2.3.3 Assay by HPLC/UPLC/RRLC method
Column selection.
Mobile phase/ solvent selection.
Mobile phase/ solvent pH selection.

Analytical method development and validation
57
No interference from placebo.
No interference from major degradation product.
Working concentration having optimum peak response.
Diluents selection based on solubility of drug substance.
Dilution selection based on sample matrix.
Primary extraction condition (essential for extended release product).
Optimum injection volume.
Wavelength selection.
Compatibility with inline filter and syringe filter.
Solution stability.
2.3.4 Related substances by HPLC/UPLC/RRLC method
Column selection.
Mobile phase/ solvent selection.
Mobile phase/ solvent pH selection.
No interference from placebo at the RT (retention time) of interested peak.
Separation of major degradation product.
Working concentration having optimum peak response.
Diluents selection based on solubility of drug substance and impurities.
Dilution selection based on sample matrix.
Primary extraction condition (essential for extended release product).
Optimum injection volume.
Wavelength selection.
Compatibility with inline filter and syringe filter.
Solution stability.
Tentative response factor or related response factor.
Method sensitivity (target LOQ, 0.05 %).

Chapter-2
58
2.3.5 Blend analysis and content uniformity/ dose content uniformity/ spray
content uniformity by HPLC/UPLC/RRLC method
In absence of the placebo interference, an UV method will be preferred for the content
uniformity analysis. The same method shall be adopted for the blend uniformity of the in-process
blend and composite assay of blend with suitable dilutions.
Wherever significant placebo interference (i.e. more than 2.0 %) is observed in the UV
methodology, HPLC/UPLC/RRLC method adopted for assay shall be employed for the content
uniformity with suitable dilutions. The workability of the content uniformity method should be
verified by preparing sample preparation from ten individual dosage units of the final
formulation.
Following aspects should be looked into while adopting the preliminary analytical method
Column selection.
Mobile phase/ solvent selection.
Mobile phase/ solvent pH selection.
No interference from placebo.
No interference from major degradation product.
Working concentration having optimum peak response.
Diluents selection based on solubility of drug substance.
Dilution selection based on sample matrix.
Primary extraction condition (essential for extended release product).
Optimum injection volume.
Wavelength selection.
Compatibility with syringe filter.
Solution stability.

Analytical method development and validation
59
2.4 AVAILABLE INFORMATION FOR HPLC / UPLC / RRLC
ANALYTICAL METHOD DEVELOPMENT
2.4.1 Buffer selection
A partial list of common buffers and their corresponding useful pH range is supplied. Perhaps the
most common buffer in HPLC is the phosphate ion. Although, with the growth of LC-MS,
volatile buffers such as TFA, acetate, formate, and ammonia are becoming more frequently used.
Remember, the purpose of a buffer in the mobile phase is to inhibit a pH change in the mobile
phase after the introduction of a sample. When developing a method, it is important to select a
mobile phase with a final pH at least one pH unit away from any analytes pK value. As a rule of
thumb, one should work within a ±1 pH unit of the buffer pKa. Typical buffer concentrations for
HPLC tend to be 10-100 mill molar level. Buffer pH range, pKa and its UV cutoff are shown in
Table 2.1 and Table 2.2. Physical properties of acids are also summarized in Table 2.3.
Table 2.1 Buffers for reversed phase UPLC/HPLC [9]
Buffer pKa Buffer
Range UV Cutoff (nm)
Phosphate pK1 2.1 1.1-3.1
210 pK2 7.2 6.2-8.2
pK3 12.3 11.3-13.3
Citrate pK1 3.1 2.1-4.1
230 pK2 4.7 3.7-5.7
pK3 5.4 4.4-6.4
Formate 3.8 2.8-4.8 210
Acetate 4.8 3.8-5.8 230
Tris (hydroxymethyl) aminomethane 8.3 7.3-9.3 220
Borate 9.2 8.2-10.2 210
Triethylamine 10.8 9.8-11.8 200

Chapter-2
60
Table 2.2 Buffers information for UPLC/HPLC, MS and ELSD
Buffer pH range UV range, nm MS, ELSD
TFA 1.5-2.5 >210 +
Acetic acid 3.5-5.0 >220 ++
Formic acid 2.5-4.0 >220 ++
H2SO4 1.0-2.5 >195 +
HClO4 1.5-2.5 >195 -
H3PO4 1.5-3.0 >195 --
TEA phosphate 1.8-3.1 >195 --
Sodium phosphate 1.8-3.1 >195 --
Sodium phosphate 6.0-7.0 >195 --
Ammonium phosphate 1.8-3.1 >195 --
TEA formate 2.5-4.0 >220 +
TEA Acetate 3.5-5.0 >220 +
Ammonium formate 2.5-4.0 >220 ++
Ammonium acetate 3.5-5.0 >220 ++
Table 2.3 Physical properties of acids (for HPLC/ UPLC/ RRLC application)
Name Formula Density,
g/ml
Boiling
point, oC
UV range,
nm
Ion strength of
0.1% solution,
mM
pH of 0.1%
solution
Sulfuric acid H2SO4 1.84 high >195 20 2
Perchloric HClO4 1.664 high >195 20 2
Phosphoric acid H3PO4 1.685 high >195 15 2.1
Trifluoroacetic
acid (TFA) CF3COOH 1.493 75 >210 20 2
Methanesulfonic
acid CH3SO3H 1.481 high >195 20 2
Formic acid HCOOH 1.22 100 >220 2 3
Acetic acid CH3COOH 1.049 117 >220 0.2 4
Analytical method development and validation
61
2.4.2 Mobile phase preparation
It should be understood that slight variations in pH and buffer concentration could have a
dramatic affect on the chromatographic process, consistent and specific techniques should be a
regular practice in the preparation of mobile phases. A common practice is to place a sufficient
amount of pure water into a beaker and add an accurate amount of buffer. Dissolve and then
dilute to final volume of water. The pH of the solution should be adjusted, if necessary, Then,
add a volumetrically measured amount of organic solvent to obtain the final mobile phase.
Degassing and filtering is required prior to use.
2.5 DETECTOR SELECTION
Chemical nature of analyte and interferences.
Limit of detection and quantification are required.
Availability and cost of the detector.
2.5.1 Ultraviolet/ visible absorbance (UV/VIS)
Analyte must absorb more light than the sample matrix at some wavelengths.
Photo-Diode Array (PDA) detector can monitor multiple wavelengths.
Choose the wavelength that maximizes the sensitivity and specificity.
Solvents used may cause slight shift in UV max from published values (2-5nm)
check absorbance in mobile phase.
Mobile phase solvents have UV cut-offs, operating below the cutoff wavelength will
reduce the sensitivity and increase baseline noise.
2.5.2 Mass spectrometer (MS)
Analyte must be ionizable.
Can discriminate between the co-eluting peaks in selective ion mode.
For best sensitivity, work at pH where analytes are ionized.
Chapter-2
62
For acids work in pH range of 7-9.
For bases work in pH range of 3-4.
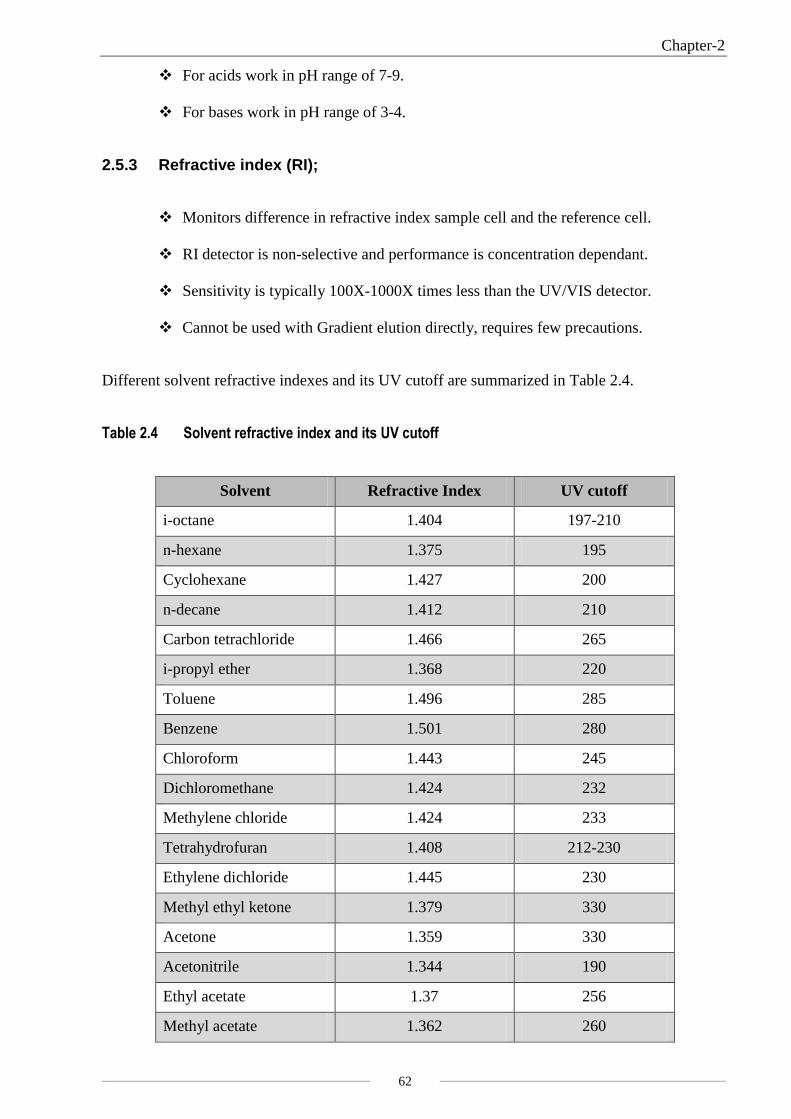
2.5.3 Refractive index (RI);
Monitors difference in refractive index sample cell and the reference cell.
RI detector is non-selective and performance is concentration dependant.
Sensitivity is typically 100X-1000X times less than the UV/VIS detector.
Cannot be used with Gradient elution directly, requires few precautions.
Different solvent refractive indexes and its UV cutoff are summarized in Table 2.4.
Table 2.4 Solvent refractive index and its UV cutoff
Solvent Refractive Index UV cutoff
i-octane 1.404 197-210
n-hexane 1.375 195
Cyclohexane 1.427 200
n-decane 1.412 210
Carbon tetrachloride 1.466 265
i-propyl ether 1.368 220
Toluene 1.496 285
Benzene 1.501 280
Chloroform 1.443 245
Dichloromethane 1.424 232
Methylene chloride 1.424 233
Tetrahydrofuran 1.408 212-230
Ethylene dichloride 1.445 230
Methyl ethyl ketone 1.379 330
Acetone 1.359 330
Acetonitrile 1.344 190
Ethyl acetate 1.37 256
Methyl acetate 1.362 260

Analytical method development and validation
63
Pyridine 1.51 305-330
2- Methoxyethanol 1.401 220
2- Propanol 1.38 210
Ethanol 1.361 205-210
Methanol 1.329 205
Acetic acid 1.372 210
Water 1.333 180
2.5.4 Evaporative light scattering (ELSD)
Detector is mass dependant and non-selective.
Ideal for high molecular weight compounds, sugars and less volatile acids.
Amount of light scattering is related to the molecular mass of analyte.
Can be used with gradient elutions.
Solvents should be volatile for the best results.
2.5.5 Fluorescence detector (FLD)
Analyte must fluoresce.
Excite at one wavelength, measure the emission at longer wavelength.
Up to 1000X more sensitive than UV/VIS.
High specificity.
Concentration dependant.
Operation similar to UV/VIS detector.
2.5.6 Electrochemical (EC)
Analytes should be oxidizable or reducible by Electric current.
More sensitive than the fluorescence detector.
Not as selective as fluorescence detector.
Not compatible with Gradient elution.

Chapter-2
64
2.6 HPLC MODE SELECTION
2.6.1 Part – A (If molecular mass is less than 2000)
2.6.2 Part – B (If molecular mass is greater than 2000)

Analytical method development and validation
65
2.6.3 Basic column selection chemistry
Bonded
group
Polarity Retention mechanisms Comments
C18, C8, C4 Non-polar Vander Waals C8 does not retain hydrophobic
compounds as strongly as C18
Phenyl Non-polar Hydrophobic and pi-pi NA
Cyano Intermediate Hydrophobic, dipole-
dipole and pi-pi
Resolve polar organic compounds by
reversed-phase or normal-phase
chromatography
Amino Polar (-NH2)
or ionic
(-NH3+)
Dipole-dipole and H-
bonding
Normal-phase or ion-exchange
separation; separates carbohydrates,
polar organic compounds, and inorganic
ions; reacts with aldehydes and ketones
Bare silica Very polar H-bonding Normal-phase separations
2.7 DISSOLUTION METHOD DEVELOPMENT
Precision: Dissolution results may be considered highly variable if the relative standard
deviation (RSD) is greater than 20% at time points of 10 minutes or less and greater than 10%
RSD at later time points.
Discrimination: The procedure should be appropriately discriminating, capable of distinguishing
significant changes in a composition or manufacturing process that might be expected to affect in
vivo performance. Also it should reflect changes over period of stability. For compounds with
high solubility and high permeability (as defined by the Biopharmaceutics Classification
System), the choice of medium and apparatus may be influenced by the referenced FDA
Guidance.
Centrifugation: Centrifugation of samples is not preferred, because dissolution can continue to
occur and because there may be a concentration gradient in the supernatant. A possible exception
might be for compounds that adsorb onto all common filters.
Media selection: In case of media selection the solubility and solution state stability of the drug
as a function of the pH value needs to study. When selecting the composition of the medium, the

Chapter-2
66
influence of buffers, pH value, and surfactants on the solubility and stability of the drug need to
be evaluated. One goal is to have sink conditions, defined as the volume of medium at least three
times that required in order to form a saturated solution of drug substance. When sink conditions
are present, it is more likely that dissolution results will reflect the properties of the dosage form.
Using an aqueous–organic solvent mixture as a dissolution medium is discouraged. The
dissolution characteristics of an oral formulation should be evaluated in the physiologic pH range
of 1.2 to 6.8 (1.2 to 7.5 for modified-release formulations). If the compound dissolves quickly in
the stomach and is highly permeable, the dissolution test should demonstrate that the drug is
released quickly under typical gastric (acidic) conditions. On the other hand, if dissolution occurs
primarily in the intestinal tract (e.g., for a poorly soluble, weak acid), a higher pH range (e.g.,
simulated intestinal fluid with a pH of 6.8) may be more appropriate. Typical media for
dissolution may include the following (not listed in order of preference): dilute hydrochloric acid,
buffers in the physiologic pH range of 1.2 to 7.5, simulated gastric or intestinal fluid (with or
without enzymes), water, and surfactants (with or without acids or buffers) such as polysorbate
80, sodium lauryl sulfate, and bile salts.
Media Volume: Normally, for basket and paddle apparatus, the volume of the dissolution
medium is 500 mL to 1000 mL, with 900 mL as the most common volume. The volume can be
raised to between 2 and 4 L, using larger vessels and depending on the concentration and sink
conditions of the drug; justification for this procedure is expected.
Deaeration: The significance of deaeration of the medium should be determined, because air
bubbles can interfere with the test results, acting as a barrier to dissolution if present on the
dosage unit or basket mesh. Further, bubbles can cause particles to cling to the apparatus and
vessel walls. On the other hand, bubbles on the dosage unit may increase buoyancy, leading to an
increase in the dissolution rate, or may decrease the available surface area, leading to a decrease
in the dissolution rate. A dearation method includes heating the medium, filtering, and drawing a

Analytical method development and validation
67
vacuum for a short period of time. Media containing surfactants are not usually deaeration
because the process results in excessive foaming.
Sinkers: When sinkers are used, a detailed description of the sinker must be stated in the written
procedure. It may be useful to evaluate different sinkers, recognizing that sinkers can
significantly influence the dissolution profile of a dosage unit.
Apparatus selection: For solid oral dosage forms, Apparatus 1 and Apparatus 2 are used most
frequently. Apparatus 3 (Reciprocating Cylinder) has been found to be especially useful for
bead-type modified-release dosage forms. Apparatus 4 (Flow-Through Cell) may offer
advantages for modified-release dosage forms that contain active ingredients with limited
solubility. In addition, Apparatus 3 or Apparatus 4 may have utility for soft gelatin capsules,
bead products, suppositories, or poorly soluble drugs. Apparatus 5 (Paddle over Disk) and
Apparatus 6 (Rotating Cylinder) have been shown to be useful for evaluating and testing
transdermal dosage forms. Apparatus 7 (Reciprocating Holder) has been shown to have
application to nondisintegrating oral modified-release dosage forms, as well as to transdermal
dosage forms. Some changes can be made to the apparatus; for example, a basket mesh size other
than the typical 40-mesh basket (e.g., 10, 20, 80 mesh) may be used when the need is clearly
documented by supporting data.
Agitation: For immediate-release capsule or tablet formulations, Apparatus 1 (baskets) at 100
rpm or Apparatus 2 (paddles) at 50 or 75 rpm are most commonly used.
Time points: Dissolution profiles of immediate-release products typically show a gradual
increase reaching 85% to 100% at about 30 to 45 minutes. Thus, dissolution time points in the
range of 15, 20, 30, 45, and 60 minutes are usual for most immediate-release products. For
rapidly dissolving products, including suspensions, useful information may be obtained from
earlier points, e.g., 5 to 10 minutes and 85% or more of the active drug substance dissolved
within 15 minutes. For an extended-release dosage form, at least three test time points are

Chapter-2
68
chosen to characterize the in vitro drug release profile for Pharmacopeial purposes. Additional
sampling times may be required for drug approval purposes. An early time point, usually 1 to 2
hours, is chosen to show that there is little probability of dose dumping. An intermediate time
point is chosen to define the in vitro release profile of the dosage form, and a final time point is
chosen to show the essentially complete release of the drug.
Infinity point: The paddle or basket speed is increased at the end of the run for a sustained
period (typically 15 to 60 minutes), after which time an additional sample is taken. Although
there is no requirement for 100% dissolution in the profile, the infinity point can provide data
that may supplement content uniformity data and may provide useful information about
formulation characteristics during initial development or about method bias.
Filters: Filtration removes insoluble excipients that may otherwise cause high background or
turbidity. Filters can be in-line or at the end of the sampling probe or both. The pore size can
range from 0.45 to 70 µm.
2.8 METHOD DEVELOPMENT FOR RESIDUAL SOLVENT BY GC
Classification of residual solvents by risk assessment:
Class-1, residual solvents:
Solvents to be avoided, known human carcinogens strongly suspected human carcinogens
environmental hazards.
Solvent Concentration limit (ppm) Concern
Benzene 2 Carcinogen
Carbon tetrachloride 4 Toxic and environmental hazard
1,2-Dichloroethane 5 Toxic
1,1-Dichloroethane 8 Toxic
1,1,1-Trichloroethane 1500 Environmental hazard

Analytical method development and validation
69
Class-2, residual solvents:
Solvents to be limited nongenotoxic, animal carcinogens or possible causative agents of other
irreversible toxicity, such as neurotoxicity or teratogenicity. Solvents suspected of other
significant but reversible toxicities.
Solvent PDE (mg/day) Concentration limit (ppm)
Acetonitrile 4.1 410
Chlorobenzene 3.6 360
Chloroform 0.6 60
Cyclohexane 38.8 3880
1,2-Dichloroethene 18.7 1870
1,2-Dimethoxyethane 1 100
N,N-Dimethylacetamide 10.9 1090
N,N-Dimethylformamide 8.8 880
1,4-Dioxane 3.8 380
2-Ethoxyethanol 1.6 160
Ethylene glycol 6.2 620
Formamide 2.2 220
Hexane 2.9 290
Methanol 30 3000
2-Methoxyethanol 0.5 50
Methylbutylketone 0.5 50
Methylcyclohexane 11.8 1180
Methylene chloride 6 600
N-Methylpyrrolidone 5.3 530
Nitromethane 0.5 50
Pyridine 2 200
Sulfolane 1.6 160
Tetrahydrofuran 7.2 720
Tetralin 1 100
Toluene 8.9 890
Trichloroethylene 0.8 80
Xylene
(Usually 60 % m-xylene, 14 % p-xylene,
9 % o-xylene with 17 % ethyl benzene)
21.7 2170

Chapter-2
70
OPTIONS FOR DETERMINING LEVELS OF CLASS 2 RESIDUAL SOLVENTS
Option-1:
The concentration limits in ppm stated in above table (Class-2 section) are used. They were
calculated using equation (1) below by assuming a product weight of 10 g administered daily.
1000 x PDE
Concentration (ppm) = ------------------- …………. equation (1)
Dose
Where, PDE is given in terms of mg per day and dose is given in terms of g per day
These limits are considered acceptable for all drug substances, excipients, and drug products.
Therefore, this option may be applied if the daily dose is not known or fixed. If all drug
substances and excipients in a formulation meet the limits given in Option-1, these components
may be used in any proportion. No further calculation is necessary provided the daily dose not
exceed 10 g. Products that are administered in doses greater than 10 g per day are to be
considered under Option-2.
Option-2:
The PDE in terms of mg per day as stated in above table (Class-2 section) can be used with the
known maximum daily dose and equation (1) above to determine the concentration of residual
solvent allowed in a drug product.
Option-2 may be applied by adding the amounts of a residual solvent present in each of the
components of the drug product. The sum of the amounts of solvent per day should be less than
that given by the PDE.
Class-3, residual solvents:
Solvents with low toxic potential solvents with low toxic potential to humans; no health-based
exposure limit is needed.

Analytical method development and validation
71
Unless otherwise stated in the individual monograph, Class-3 residual solvents are limited to not
more than 50 mg per day (corresponding to 5000 ppm or 0.5% under Option-1). If a Class-3
solvent limit in an individual monograph is greater than 50 mg per day, that residual solvent
should be identified and quantified.
Acetic acid Heptane Ethyl acetate
Acetone Isobutyl acetate Ethyl ether
Anisole Isopropyl acetate Ethyl formate
1-Butanol Methyl acetate Formic acid
2-Butanol 3-Methyl-1-butanol 1-Propanol
Butyl acetate Methylethylketone 2-Propanol
Tert-butylmethyl ether Methylisobutylketone Propyl acetate
Cumene 2-Methyl-1-propanol Ethanol
Dimethyl sulfoxide Pentane 1-Pentanol
Other Residual Solvents
(For which no adequate toxicological data was found)
1,1-Diethoxypropane Methyl isopropyl ketone
1,1-Dimethoxymethane Methyltetrahydrofuran
2,2-Dimethoxypropane Hexane
Isooctane Trichloroacetic acid
Isopropyl ether Trifluoroacetic acid
Method development:
In case of Class-1 and Class-2, Residual Solvent method development is based on the solubility
of the material, there are different procedures for the water soluble and water insoluble materials
mentioned in the USP, BP and EP.
If only class-3 solvents are present, the level of residual solvents is to be determined as directed
under loss on drying. If the loss on drying value is greater than 0.5 %, a water determination
should be performed on the test sample as directed under water determination.

Chapter-2
72
2.9 METHOD WORKABILITY STUDY (HPLC/UPLC and GC METHOD)
Once the final formulation for scaling-up clinical batch is available method workability should
be studied to assess the following:
Whether the proposed method fulfils specificity, precision and accuracy criteria.
To optimize a suitable sample preparation according to the final formula.
To optimize the stress study conditions that is to be followed for method validation.
For method workability checking below mentioned parameters can be performed during
analytical method development.
Sr.
No.
Parameter Assay Related
Substances
Dissolution
1 System precision Yes Yes Yes
2 System suitability parameters Yes Yes Yes
3 Specificity
a) Interference from placebo Yes Yes Yes
b) Interference from degradants Yes Yes (major degradants)
4 Extraction time Yes Yes ----
5 Filter paper compatibility Yes Yes Yes
6 Accuracy (Recovery) Yes Yes ----
7 Method precision Yes Yes Yes
8 Stability of analytical solution Yes Yes Yes
9 Selectivity (Impurity elution) Yes Yes ----
10 Robustness ---- Yes ----
2.9.1 System precision, system suitability and selectivity (Impurity elution)
The purpose of this study is to establish the precision of the HPLC/ UPLC/ RRLC system being
used for the analysis. Following sequence can be followed.

Analytical method development and validation
73
Sr. No. Injection sequence No. of Injections
1. Mobile phase 1
2. Diluents 1
3. Resolution solution (If applicable) 1
4. Standard solution (specification level) 6
5. Standard preparation in duplicate 1
6. Impurity standard solution 1
7. Composite impurity solution with drug substance 1
Prefer acceptance criteria:
In case of pharmacoepial methods, % RSD of standard should be less than that
mentioned in the individual test method.
In case of in-house assay methods, % RSD of standard should be below 2.0 %.
Similarity between two standard preparations should be within 0.98 to 1.02 or 0.95 to
1.05.
Theoretical plates for analyte peak in Assay should not be less than 3000 (if applicable).
Tailing factor for analyte peak should not be more than 2.0.
Resolution of the analyte with closest eluting impurity should be at least 1.5.
% RSD of six replicate standard injections in Related Substances should be below 10.0.
% RSD of six replicate standard injections in GC should be below 15.0.
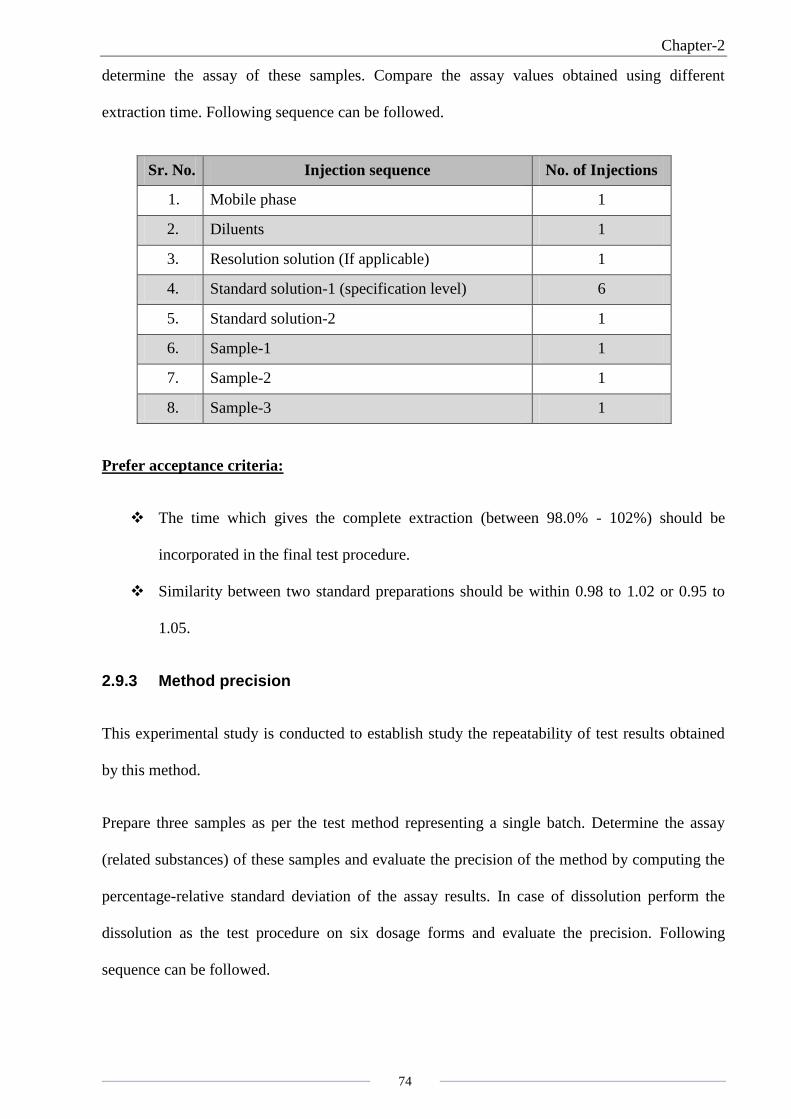
2.9.2 Extraction time
This experimental study is conducted to establish the minimum time required for the
complete extraction of active ingredient from the formulation matrix.
Prepare three sample solutions by weighing a suitable quantity of sample and sonicate the above
three preparations for different time period (e.g. 15 minutes, 30 minutes and 45 minutes) after
adding a suitable quantity of diluents. After completion of sonication suitably dilute and
Chapter-2
74
determine the assay of these samples. Compare the assay values obtained using different
extraction time. Following sequence can be followed.
Sr. No. Injection sequence No. of Injections
1. Mobile phase 1
2. Diluents 1
3. Resolution solution (If applicable) 1
4. Standard solution-1 (specification level) 6
5. Standard solution-2 1
6. Sample-1 1
7. Sample-2 1
8. Sample-3 1
Prefer acceptance criteria:
The time which gives the complete extraction (between 98.0% - 102%) should be
incorporated in the final test procedure.
Similarity between two standard preparations should be within 0.98 to 1.02 or 0.95 to
1.05.
2.9.3 Method precision
This experimental study is conducted to establish study the repeatability of test results obtained
by this method.
Prepare three samples as per the test method representing a single batch. Determine the assay
(related substances) of these samples and evaluate the precision of the method by computing the
percentage-relative standard deviation of the assay results. In case of dissolution perform the
dissolution as the test procedure on six dosage forms and evaluate the precision. Following
sequence can be followed.

Analytical method development and validation
75
Sr. No. Injection sequence No. of Injections
1. Mobile phase 1
2. Diluents 1
3. Resolution solution (If applicable) 1
4. Standard preparation-1 (system suitability) 6
5. Standard preparation-2 (for similarity) 1
6. Precision sample-1 to 6 1
7. Bracketing standard (from standard preparation-1) 1
Prefer acceptance criteria:
In case of assay % RSD for assay of three preparations is NMT 2.0.
In case of content uniformity % RSD for assay of six/ten preparations is NMT 6.0.
In case of preservatives/antioxidants content % RSD for assay of three preparations is
NMT 10.0.
In case of residual solvents % RSD for three preparations is NMT 10.0.
In case of related substances below mentioned limit can be follow.
Impurity level % RSD
0.05 % to 0.10 % 25.0 %
0.11 % to 0.50 % 15.0 %
0.51 % to 1.0 % 10.0 %
More than 1.0 % 5.0 %
2.9.4 Accuracy (recovery)
This experimental study is conducted to establish the recovery of test results obtained by the
method.
Assay: Prepare recovery samples (i.e. spiking placebo {containing every colors of all strengths}
with known quantities of API) at the level of 50 %, and 150 % of target concentration. Prepare
the recovery samples in triplicate.

Chapter-2
76
Related Substances: Prepare recovery samples (i.e. spiking placebo {containing every colors of
all strengths} with known quantities of all known impurities of API) at the level of LOQ (i.e.
0.05 %), 50 %, and 150 % of target concentration. Prepare the recovery samples in triplicate.
Dissolution: Perform from 25% of lowest (lower) strength to 150% of highest (higher) strength.
Sr. No. Injection sequence No. of Injections
1. Mobile phase 1
2. Diluents 1
3. Resolution solution (If applicable) 1
4. Standard preparation-1 (system suitability) 6
5. Standard preparation-2 (for similarity) 1
6. Recovery (LOQ) preparation-1 1
7. Recovery (LOQ) preparation-2 1
8. Recovery (LOQ) preparation-3 1
9. Recovery (at 50 %) preparation-1 1
10. Recovery (at 50 %) preparation-2 1
11. Recovery (at 50 %) preparation-3 1
12. Recovery (at 150 %) preparation-1 1
13. Recovery (at 150 %) preparation-2 1
14. Recovery (at 150 %) preparation-3 1
15. Bracketing standard (from standard preparation-1) 1
Prefer acceptance criteria:
Test % Recovery % RSD
Assay 98.0 to 102.0 2.0 %
Dissolution/ content uniformity 95.0 to 105.0 5.0 %
Preservative content/ anti oxidants 90.0 to 110.0 5.0 %
Related Substances
Impurity levels Acceptable % recovery
Between 0.05 and 0.10 % Between 50.0% to 150.0%
Between 0.11 and 0.50 % Between 70.0% to 130.0%
Between 0.51 and 1.0 % Between 80.0% to 120.0%
More than 1.0 % Between 90.0% to 110.0%
Analytical method development and validation
77
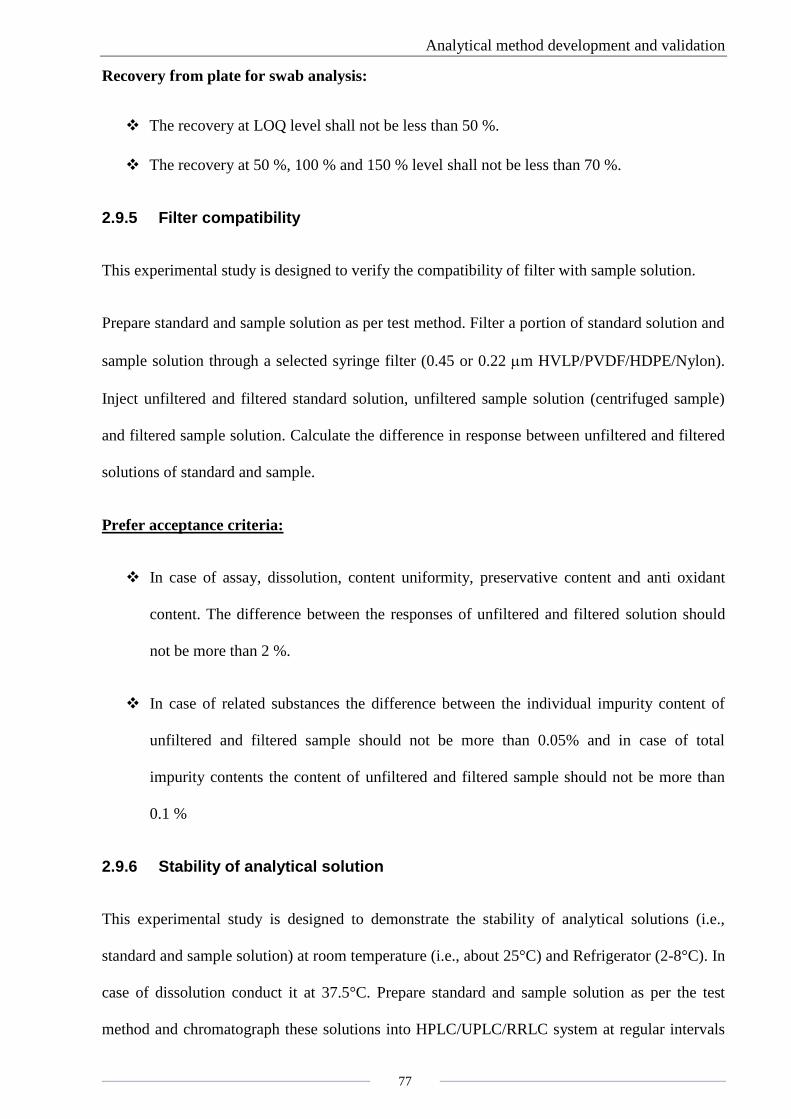
Recovery from plate for swab analysis:
The recovery at LOQ level shall not be less than 50 %.
The recovery at 50 %, 100 % and 150 % level shall not be less than 70 %.
2.9.5 Filter compatibility
This experimental study is designed to verify the compatibility of filter with sample solution.
Prepare standard and sample solution as per test method. Filter a portion of standard solution and
sample solution through a selected syringe filter (0.45 or 0.22 m HVLP/PVDF/HDPE/Nylon).
Inject unfiltered and filtered standard solution, unfiltered sample solution (centrifuged sample)
and filtered sample solution. Calculate the difference in response between unfiltered and filtered
solutions of standard and sample.
Prefer acceptance criteria:
In case of assay, dissolution, content uniformity, preservative content and anti oxidant
content. The difference between the responses of unfiltered and filtered solution should
not be more than 2 %.
In case of related substances the difference between the individual impurity content of
unfiltered and filtered sample should not be more than 0.05% and in case of total
impurity contents the content of unfiltered and filtered sample should not be more than
0.1 %
2.9.6 Stability of analytical solution
This experimental study is designed to demonstrate the stability of analytical solutions (i.e.,
standard and sample solution) at room temperature (i.e., about 25°C) and Refrigerator (2-8°C). In
case of dissolution conduct it at 37.5°C. Prepare standard and sample solution as per the test
method and chromatograph these solutions into HPLC/UPLC/RRLC system at regular intervals

Chapter-2
78
for minimum 12 hours. Monitor the area of the analyte and impurity peaks for both standard and
sample solutions. Calculate the % deviation of analyte and impurity peaks area from initial for
both standard and sample solutions.
For assay, dissolution, preservative and antioxidant content:
The response of standard and sample solution should not differ by more than 2.0 % from
the initial response.
For related substances:
The individual impurity should not differ by more than 0.05 and total impurities by more
than 0.1 from the initial value.
The response obtained for each component shall be above the corresponding LOQ level
response.
The System suitability solution shall be used as long as the elution pattern matches with
that of chromatogram injected during system suitability experiment.
For swab analysis by HPLC/UPLC/RRLC:
The response of standard solution should not differ by more than 10.0 % from the initial
response.
For dissolution/assay by UV:
The deviation in test result should not be more than 2 % of the initial value.
2.9.7 Specificity
The purpose of this study is to examine stability indicating nature of the test methodology. This
will be studied in two parts.

Analytical method development and validation
79
Part-A: Interference from placebo and known impurities
In case of look-alike formulations placebo of lowest (lower) strength shall be prepared.
In case of dose proportional formulations placebo of highest strength shall be prepared.
In case of multiple colored formulations placebo with all colors mixed shall be prepared.
Prefer acceptance criteria:
There should be no interference of placebo at the retention time of Analyte as well as
known impurities of Drug substances. The known impurities should not co-elute with the
main active peak, at the same time the process related impurities should not co-elute with
the degradants.
Peak purity of analyte peak should be not less than 990/0.995
Swab absorbance should not be more than 10.0 % of the standard absorbance.
In case of UV method:
Placebo absorbance should not be more than 2.0 % of the standard absorbance.
Interference from capsule shell should not be more than 2% of the labeled content.
Part-B: Interference from degradants
Before planning this study, evaluate the stability of the drug substance in different environmental
conditions based on the available stability data and forced degradation data provided in the
technical package. To evaluate the interference from degradation product, carry out the forced
degradation study. API, placebo (with all colors, wherever applicable) and formulation (with all
colors, wherever applicable), can be analyzed by the following conditions.

Chapter-2
80
Stress Type Condition
Acid hydrolysis Treat with suitable concentration of HCl for specific period
Alkali hydrolysis Treat with suitable concentration of NaOH for specific period
Peroxide oxidation Treat with suitable concentration of hydrogen peroxide solution
for specific period
Thermal degradation Expose the sample at 100C for suitable period.
Humidity degradation Expose the sample at 40C / 75 % RH for suitable period.
Photolytic degradation Expose under UV light for 24 hours in a photo stability chamber
( under degradation mode)
For highly unstable products, apply mild conditions to achieve about 5 to 10 % degradation.
For highly stable products, apply strong conditions to achieve maximum possible degradation
(e.g. stress period up to 12 hours).
Chromatograph the above stress samples into HPLC/ UPLC/ RRLC system equipped with a
diode array detector. Evaluate the peak purity of analyte peak and the assay of formulation under
each stressed condition.
Prefer acceptance criteria:
Peak purity of analyte should be above 990.
All degradants should be well separated from the analyte peak, impurity peaks and
placebo peaks.
ICH guidance:
As per ICH guideline the unknown impurities obtained during the Stability studies needs
Identified, characterized as per the thresholds proposed in the guideline. Degradation study will
help in predicting these unknown degradants well before the submission batch stability. Drug
substances impurity threshold are presented in Table 2.5.

Analytical method development and validation
81
Table 2.5 Drug substances impurities thresholds
Maximum
daily dose a
Reporting
threshold b c
Identification threshold
c Quantification threshold
c
< 2 g/day 0.05 % 0.01 % or 1.0 mg/day
intake (whichever is less)
0.15 % or 1.0 mg/day intake
(whichever is less)
> 2 g/day 0.03 % 0.05 % 0.05 %
a The amount of drug substance administered per day.
b Higher reporting threshold should be scientifically justified.
c Lower threshold can be appropriate if the impurities are unusually toxic.
Drug product impurity threshold are presented in the Figure 2.1.
Figure 2.1 ICH Q3B(R) Drug products impurity thresholds

Chapter-2
82
2.10 FLOW OF METHOD DEVELOPMENT IN HPLC

Analytical method development and validation
83
2.11 METHOD SELECTION OF DRUG SUBSTANCES – ASSAY AND
RELATED SUBSTANCES

Chapter-2
84
2.12 METHOD SELECTION FOR DRUG PRODUCT – ASSAY
2.13 METHOD SELECTION FOR DRUG PRODUCT – RS

Analytical method development and validation
85
2.14 METHOD SELECTION FOR DISSOLUTION AND CU
2.15 METHOD VALIDATION
Once an analytical method is developed for its intended use, it must be validated. The extent of
validation evolves with the drug development phase. Usually, a limited validation is carried out
to support an Investigational New Drug (IND) application and a more extensive validation for
New Drug Application (NDA) and Marketing Authorization Application (MAA). Typical
parameters recommended by FDA, USP, and ICH are as follow [10]:

Chapter-2
86
1. Specificity
2. Linearity & Range
3. Precision
(A) Method precision (Repeatability)
(B) Intermediate precision (Ruggedness)
4. Accuracy (Recovery)
5. Solution stability
6. Limit of Detection (LOD)
7. Limit of Quantification (LOQ)
8. Robustness
Method validation is vast area which includes many validation parameters with different
approaches for different level of requirement based on intended use of analytical method,
criticality and regulatory requirements. Validated method also can give the unpredicted or
unknown problem during the course of routine usage, because validated method has also limited
level of confidence, as method was validated for known or predicted variable parameters or
every method can fail sooner or later [11]. But still after method development it needs to be
validated as per requirement which gives certain level of confidence for its intended use. A
common method validation protocol is followed for all the method developed during the research
project (FDA, ICH Q2A & Q2B, 2005).
2.15.1 Specificity
Specificity is the ability of the method to measure the analyte in the presence of other relevant
components those are expected to be present in a sample. The relevant components might include
impurities, degradants, matrix, etc. Lack of specificity of an individual procedure may be
compensated by other supporting analytical procedure(s).
Specificity can also be demonstrated by verification of the result with an independent analytical
procedure. In the case of chromatographic separation, resolution factors should be obtained for
Analytical method development and validation
87
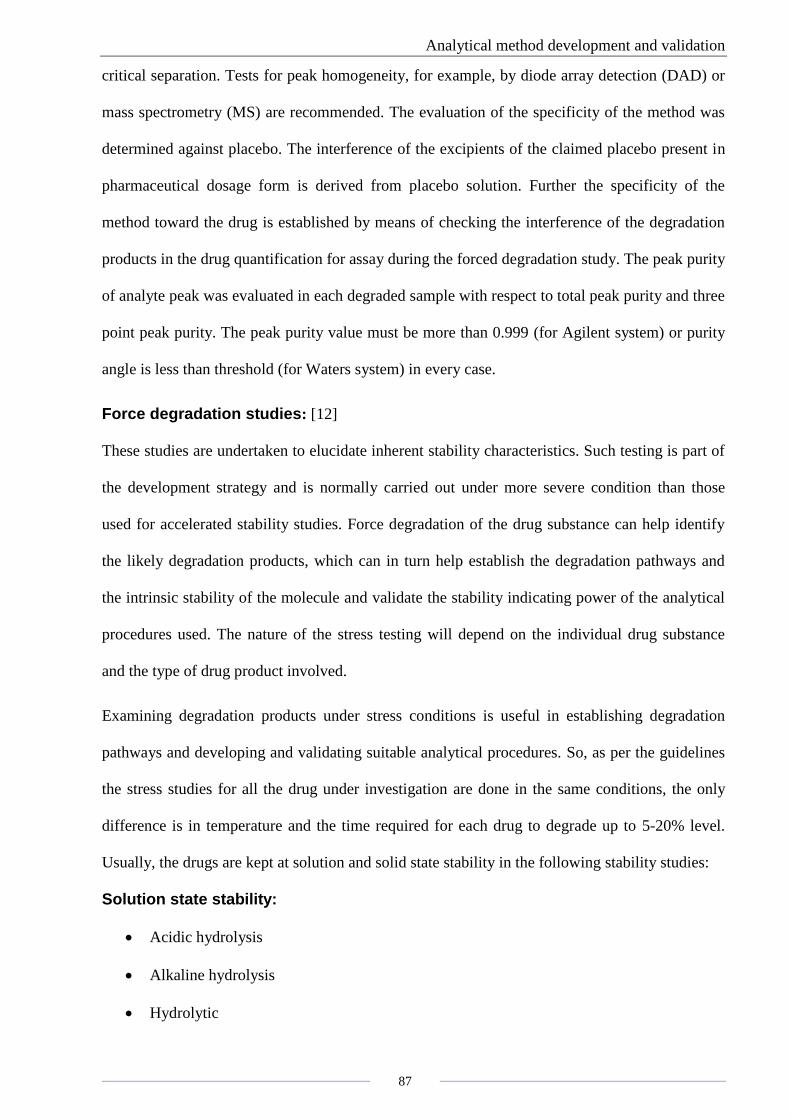
critical separation. Tests for peak homogeneity, for example, by diode array detection (DAD) or
mass spectrometry (MS) are recommended. The evaluation of the specificity of the method was
determined against placebo. The interference of the excipients of the claimed placebo present in
pharmaceutical dosage form is derived from placebo solution. Further the specificity of the
method toward the drug is established by means of checking the interference of the degradation
products in the drug quantification for assay during the forced degradation study. The peak purity
of analyte peak was evaluated in each degraded sample with respect to total peak purity and three
point peak purity. The peak purity value must be more than 0.999 (for Agilent system) or purity
angle is less than threshold (for Waters system) in every case.
Force degradation studies: [12]
These studies are undertaken to elucidate inherent stability characteristics. Such testing is part of
the development strategy and is normally carried out under more severe condition than those
used for accelerated stability studies. Force degradation of the drug substance can help identify
the likely degradation products, which can in turn help establish the degradation pathways and
the intrinsic stability of the molecule and validate the stability indicating power of the analytical
procedures used. The nature of the stress testing will depend on the individual drug substance
and the type of drug product involved.
Examining degradation products under stress conditions is useful in establishing degradation
pathways and developing and validating suitable analytical procedures. So, as per the guidelines
the stress studies for all the drug under investigation are done in the same conditions, the only
difference is in temperature and the time required for each drug to degrade up to 5-20% level.
Usually, the drugs are kept at solution and solid state stability in the following stability studies:
Solution state stability:
Acidic hydrolysis
Alkaline hydrolysis
Hydrolytic

Chapter-2
88
Oxidative degradation
Solid state stability:
Thermal degradation
Photolytic degradation
2.15.2 Linearity and Range
The linearity of an analytical procedure is its ability (within a given range) to obtain test results,
which are directly proportional to the concentration (amount) of analyte in the sample. A linear
relationship should be evaluated across the range of the analytical procedure. It is demonstrated
directly on the drug substance by dilution of a standard stock solution of the drug product
components, using the proposed procedure. For the establishment of linearity, minimum of five
concentrations are recommended by ICH guideline. The value of correlation co-efficient (r2)
should fall around 0.99.
2.15.3 Precision
The precision of an analytical procedure expresses the closeness of agreement (degree of scatter)
between a series of measurements obtained from multiple sampling of the same homogeneous
sample. Precision may be considered at two levels: repeatability and intermediate precision. The
precision of an analytical procedure is usually expressed as the variance, standard deviation or
coefficient of variation of a series of measurements.
Repeatability: Repeatability study is performed by preparing a minimum of 6 determinations at
100% of the test concentration and analyzed as per the respective methodology.
Intermediate Precision: The extent to which intermediate precision should be established
depends on the circumstances under which the procedure is intended to be used. The analyst
should establish the effects of random events on the precision of the analytical procedure.
Typical variations to be studied include days, analysts, equipment, etc. It is not considered
necessary to study these effects individually. Here, intermediate precision of the method is

Analytical method development and validation
89
checked by carrying out six independent assays of test sample preparation on the different day by
another person under the same experimental condition and calculated the % RSD of assays.
2.15.4 Accuracy
The accuracy of an analytical procedure expresses the closeness of agreement between the value
which is accepted either as a conventional true value or an accepted reference value and the value
found. The evaluation of accuracy has got very prime importance as it deliberately force the
method to extract the drug and impurities at higher and lower level.
2.15.5 Solution stability
Drug stability in pharmaceutical formulations/active pharmaceutical ingredients is a function of
storage conditions and chemical properties of the drug, preservative and its impurities. Condition
used in stability experiments should reflect situations likely to be encountered during actual
sample handling and analysis. Stability data is required to show that the concentration and purity
of analyte in the sample at the time of analysis corresponds to the concentration and purity of
analyte at the time of sampling. Stability of sample solution was established by storage of sample
solution at ambient temperature (25°C) for 24h.
2.15.6 Limit of detection
The limit of detection (LOD) for an individual analytical procedure is the lowest amount of
analyte in a sample, which can be detected but not necessarily quantitated as an exact value.
Determination of the signal-to-noise ratio is performed by comparing measured signals from
samples with known low concentrations of analyte with those of blank samples and establishing
the minimum concentration at which the analyte can be reliably detected. A signal-to-noise ratio
between 3 or 2:1 is generally considered acceptable for estimating the detection limit. The limit
of detection is evaluated by serial dilutions of analyte stock solution in order to obtain signal to
noise ratios of 3:1.
Chapter-2
90
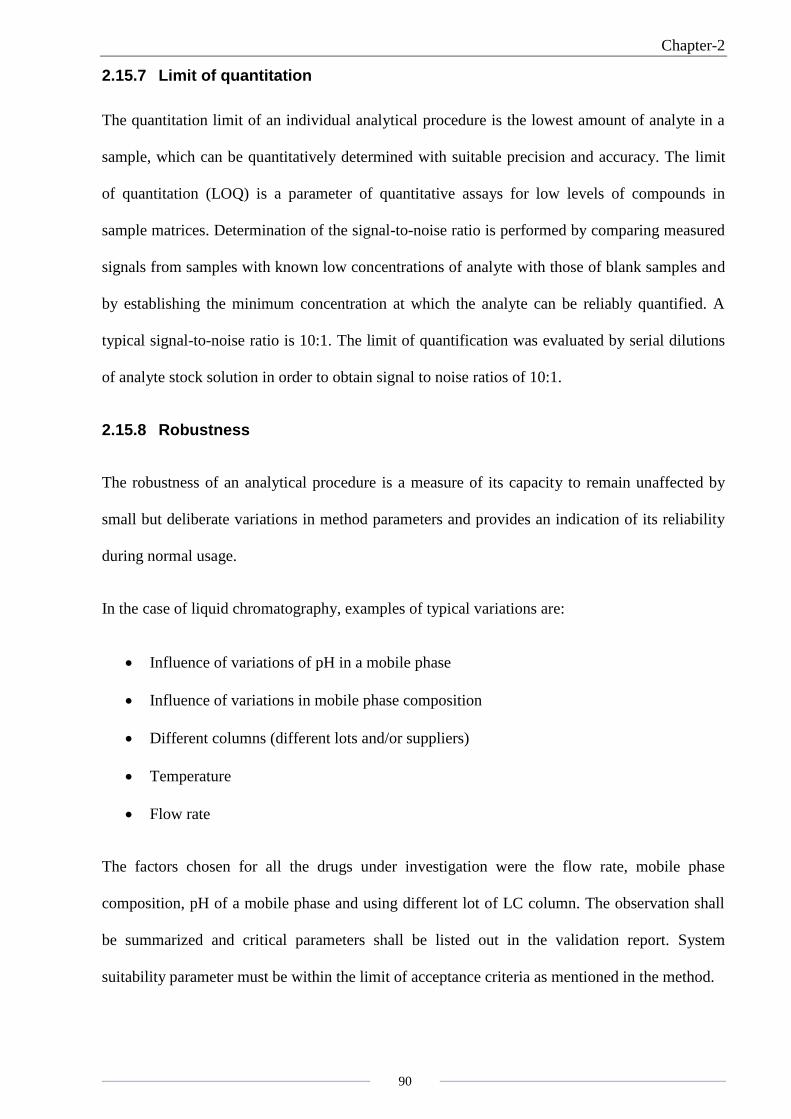
2.15.7 Limit of quantitation
The quantitation limit of an individual analytical procedure is the lowest amount of analyte in a
sample, which can be quantitatively determined with suitable precision and accuracy. The limit
of quantitation (LOQ) is a parameter of quantitative assays for low levels of compounds in
sample matrices. Determination of the signal-to-noise ratio is performed by comparing measured
signals from samples with known low concentrations of analyte with those of blank samples and
by establishing the minimum concentration at which the analyte can be reliably quantified. A
typical signal-to-noise ratio is 10:1. The limit of quantification was evaluated by serial dilutions
of analyte stock solution in order to obtain signal to noise ratios of 10:1.
2.15.8 Robustness
The robustness of an analytical procedure is a measure of its capacity to remain unaffected by
small but deliberate variations in method parameters and provides an indication of its reliability
during normal usage.
In the case of liquid chromatography, examples of typical variations are:
Influence of variations of pH in a mobile phase
Influence of variations in mobile phase composition
Different columns (different lots and/or suppliers)
Temperature
Flow rate
The factors chosen for all the drugs under investigation were the flow rate, mobile phase
composition, pH of a mobile phase and using different lot of LC column. The observation shall
be summarized and critical parameters shall be listed out in the validation report. System
suitability parameter must be within the limit of acceptance criteria as mentioned in the method.

Analytical method development and validation
91
2.15.9 Validation characteristics of the tests
Validation characteristics of the various types of tests are listed in Table 2.6.
Table 2.6 Validation characteristics of the tests*
2.15.10 Advantages of analytical method validation
The advantages of the analytical method validation are as follow: [8]
The biggest advantage of method validation is that it builds a degree of confidence, not
only for the developer but also to the user.
Although the validation exercise may appear costly and time consuming, it results
inexpensive, eliminates frustrating repetitions and leads to better time management in the
end.
Minor changes in the conditions such as reagent supplier or grade, analytical setup are
unavoidable due to obvious reasons but the method validation absorbs the shock of such
conditions and pays for more than invested on the process.

Chapter-2
92
2.16 PRESENT WORK
Pharmaceutical analytical chemistry is an important part in monitoring the quality of
pharmaceutical products for safety and efficacy. With the advancement in synthetic organic
chemistry and other branches of chemistry including bioanalytical sciences and biotechnology,
the scope of analytical chemistry has enhanced too much higher levels. The emphasis in current
use of analytical methods particularly involving advance analytical technology has made it
possible not only to evaluate the potency of active ingredients in dosage forms and APIs but also
to characterize, elucidate, identify and quantify important constituents like active moiety,
impurities, metabolites, isomers, chiral components and prediction of the degradations likely
impurities being generated. Pharmacopoeias rely more on instrumental techniques rather than the
classical wet chemistry method. In the present research work a modest attempt has been made to
develop validated analytical methods for the determination of assay, related substances,
dissolution, preservative and antioxidant in single or combined dosage form, by using a
HPLC/UPLC technique.
The present research work is divided into eight chapters of the thesis.
Chapter-1 introduces the principles of chromatographic separations, the underlying theory and
how it relates to practical chromatography and instrumentation of high performance liquid
chromatography and ultra performance liquid chromatography.
The HPLC/UPLC method development for the separation, identification and quantification of
APIs/ impurities/ preservative/ antioxidant present in the pharmaceutical formulations and its
validation as per guidelines is furnished in chapter-2.
Related components are the impurities in pharmaceuticals which are unwanted chemicals that
remain with the active pharmaceutical ingredients (APIs), or develop during stability testing, or
develop during formulation or upon aging of both API and formulated APIs to medicines. The
presence of these unwanted chemicals even in small amounts may influence the efficacy and

Analytical method development and validation
93
safety of the pharmaceutical products. Preservative and antioxidants are part of the
pharmaceutical product, so they required control and monitoring during shelf life of the product.
Various analytical methodologies were employed for the determination of assay, related
compounds, dissolution, antioxidant and preservative in pharmaceuticals drug product. There is a
scope for development of new analytical methods for quality evaluation of new emerging drugs.
Stability indicating method is developed for the rapid determination of sodium bisulfate
(inorganic compound commonly used as an antioxidant) in the injectable pharmaceutical
formulation by RP-HPLC technique and its validation are covered in chapter-3.
Chapter-4 emphasizes on the development of rapid and stability indicating method for the
determination of rosuvastatin related substances in solid oral dosage form by RP-UPLC method
and validation of the developed method as per regulatory guidelines.
The development and validation of reversed phase, high performance liquid chromatographic
method for the determination of rupatadine and its related substances in solid oral dosage form
are presented in chapter-5.
Chapter-6 includes the method development and validation for the determination of
benzalkonium chloride (low concentration preservative) in sparfloxacin eye drop by RP-HPLC
technique.
Chapter-7 emphasizes on the development of rapid and stability indicating method for the
determination of omeprazole assay and its related substances in solid oral dosage form by RP-
HPLC method and validation of the developed method as per ICH guidelines.
The following Chapter-8 deals with the development and validation of RP-HPLC method for the
in-vitro determination of azethromycine in solid oral dosage form.

Chapter-2
94
2.17 REFERENCES
[1] U.S. Food and Drug Administration Guidance for Industry, ICH Q3A, Impurities in
New Drug Substances, 2003.
[2] U.S. Food and Drug Administration Guidance for Industry, ICH Q3B, Impurities in
New Drug Products, 2006.
[3] U.S. Food and Drug Administration Guidance for Industry, ICH Q3C, Impurities:
Residual Solvents, 1997.
[4] U.S. Food and Drug Administration Guidance for Industry, ICH Q6A, Specifications:
Test Procedure and Acceptance Criteria for New Drug Substances and New Drug
Products: Chemical Substances, 1999.
[5] Arup KB, Andre SR, Ali HAH, Scott F, Nashed IS, Devinder SG, Hasmukh BP et al.,
“Pharmaceutical Impurities: Regulatory Perspective for Abbreviated New Drug
Applications” Adv Drug Deli, 2007; 59: 64-72, doi:10.1016/j.addr.2006.10.010.
[6] ICH, Stability testing of new Drug substances and products, International Conference
on Harmonisation, IFPMA, Geneva, 1993.
[7] ICH, Impurities in new drug products, International Conference on Harmonisation,
IFPMA, Geneva, 1996.
[8] Rakshit KT and Mukesh CP “Development and validation of new analytical method for
bioactive compounds” URI: http://hdl.handle.net/10603/8513.
[9] http://www.chem.agilent.com/cag/cabu/buffersel.html
[10] ICH guideline, Q2(R1) step 4, Validation of Analytical Procedures: Text and
Methodology (2005).
[11] Johan W Dolan, LCGC North America, 2006; 24(4): 374.
[12] Reynolds DW, Facchine KL, Mullaney JF, Alsante KM, Hatajik TD and Motto MG,
“Available guidance and best practices for conducting forced degradation studies”
Pharmaceutical Technology, 2002; 26(2): 48-54.