analytical assessment of the proposed raw water intake
TRANSCRIPT
UNIVERSITY OF MINNESOTA ST. ANTHONY FALLS LABORATORY Engineering, Environmental and Geophysical Fluid Dynamics
Project Report No. 413
Analytical Assessment of the Proposed Raw Water Intake Pollutant Diversion Structure
by
Richard L. Voigt, Jr.
and
Svetlana Kostic
Prepared for
SHORT~ELLIOTT~HENDRICKSON
st. Paul, Minnesota
for
The City of Minneapolis Water Works Dike Diversion
December 1997 Minneapolis, Minnesota

"
The University of Minnesota is committed to the policy that all persons shall have equal access to its programs, facilities, and employment without regard to race, religion, color, sex, national origin, handicap, age or veteran status.
Prepared for: For Record/SEH Last Revised: February 16, 1998 Disk Locators: (Zip Disk #7/Subaccounts!reports)
R-SEH2.doc

TABLE OF CONTENTS
INTRODUCTION""~"""""t,.t""""""t.".,.,.""t, .. "" .. "",."~,." .. ,.".",.,.t,.,."",,,.t •• """,.",1
PROBLEM STATEMENT ............................................................................................ 2
ASSESSMENT OF SEDIMENT RELATED ISSUES ................................................ 3
Field Reconnaissance and Profile Analysis .......................................................... 3
Grain Size Analysis" ...... "., ............ ,"', ..... ,',." ...... " .. ~""."' .. "'t!"'."""." •• , ••• , ••• ,." •• 4
Percentage of Occurrence of Operation and Its Related Effects
on Sediment Analysis ............................................................................... 4
ISLAND STABILITy ..................................................................................................... 7
POLLUTANT DIVERSION .......................................................................................... 9
RECOMMENDATIONS AND CONCLUSIONS ....................................................... 1 0
APPENDIX A - Cross Sectional and Velocity Data ....................................... 11
APPENDIX B - Grain Size Analysis .............................................................. .30

INTRODUCTION
The St. Anthony Falls Laboratory was contracted by Short ElBott Hendrickson to perform an assessment of potential sedimentation related issues associated with the installation of a flow diversion structure at the Minneapolis Water Works raw water intake. The Minneapolis Water Works raw water intake withdraws water from the Mississippi river at approximately river mile 858.5, Following treatment, the water becomes the primary water supply for Minneapolis and some suburbs. To continue to operate following a contaminant spill upstream of the intake requires the installation of a diversion structure which can effectively divert non~water soluble contaminants past the intake structure.
The project involved the review of key riverine related issues including:
• The potential for siltation to occur in the region downstream of the diversion structure between the island and intake.
• The potential for erosion of the far bank and the island caused by channel constriction.
• The potential for de~pening of the primary channel due to the constriction.
• The potential for sediment and contaminants to enter the downstream end of the channel.
• The general stability of the island.
In addition to these issues, several secondary operational related issues were also reviewed.
1

PROBLEM STATEMENT
The installation of any river training device has associated beneficial and potentially detrimental results. Installation of the proposed diversion structure at the Minneapolis Water Works will block approximately 20 percent of the existing channel. Following review of the potential alternatives, the Minneapolis Water Works selected an inflatable rubber dam for the diversion structure. The proposed dam will consist of two independent bays and will be kept in an uninflated position except when needed or when periodically exercised to assure performance. Since in its normal position it does not effect flow, election of this alternative greatly reduces sedimentation and scour concerns which could have been very significant with a permanent flow blocking structure.
Selection of the rubber dam shifted the focus of SAFL' s portion of the project from an assessment of river mechanics issues to an assessment of the time~dependent nature of scour in conjunction with the statistical probability of the dam being inflated .
. When the dam is in its inflated position, it will increase velocity in the remaining channel, thereby increasing the sediment erosion potential, and subsequently creating the potential need for scour countermeasures. In addition, the flow direction will be changed, which in turn could have specific effects on the primary channel side of the island. Since the intake and island are located on the outside of a gradual bend in the river, inflating the dam for an extended period could have major effects on the island.
2

ASSESSMENT OF SEDIMENT RELATED ISSUES
A rubber inflatable dam was evaluated to determine the degree to which sediment related problems may occur as a result· of its installation and further to provide a preliminary assessment of possible countermeasures as necessary.
Field Reconnaissance and Profile Analysis The first step of this evaluation was a field reconnaissance and the assessment of
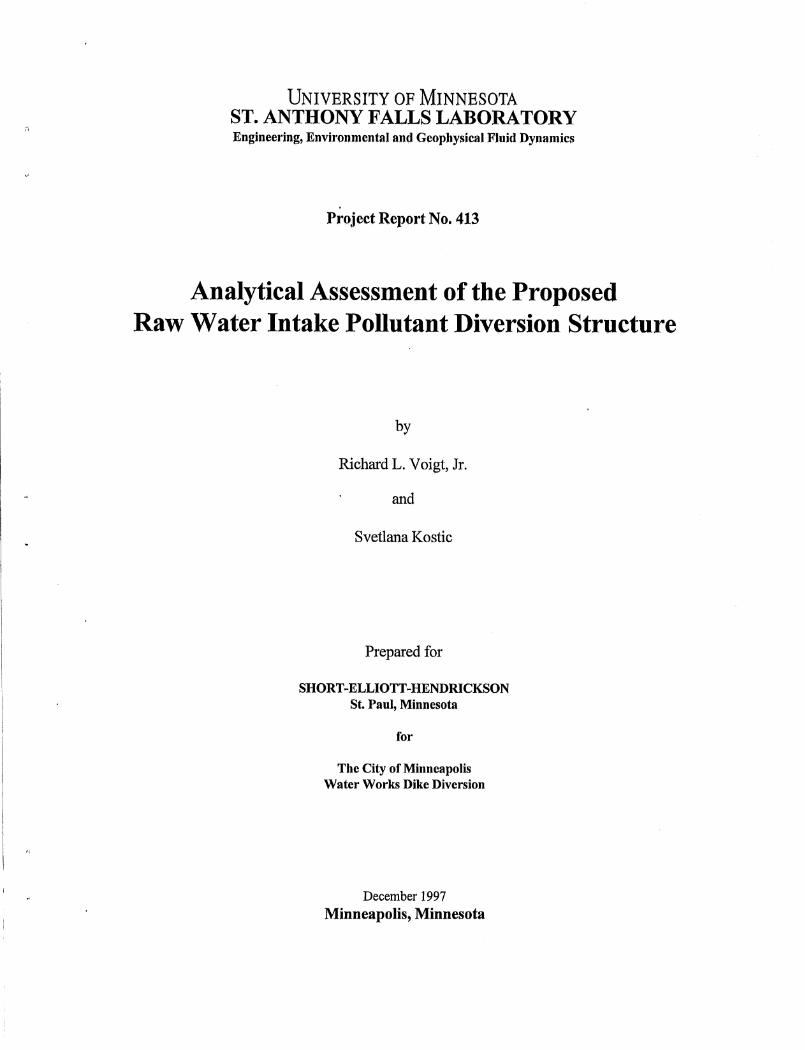
the velocity and cross-sectional profiles attained by HydroScience, Ltd. under a separate contract. The data provided in the HydroScience report and supplemental disks provided cross-sectional and velocity data for both relatively low and high water conditions. This information will help provide validity of the assessment contained herein. Crosssectional data was reviewed to determine if significant profile changes occur with change in discharge. Velocity data were evaluated for both magnitude and direction.
The field reconnaissance involved several site visits in 1996 and 1997. The large 1997 spring flood helped the evaluation by providing a good indication of what can be expected naturally, and in extreme conditions. Numerous zones of localized erosion and depositional zones were noted; however no regions of wide-spread erosion were encountered. It should be noted that the most likely place for bank erosion to occur is the bank immediately adjacent to the Minneapolis Water Works Intake and Engineering Building and that most of this bank has some type of erosion protection system presently in pla~e.
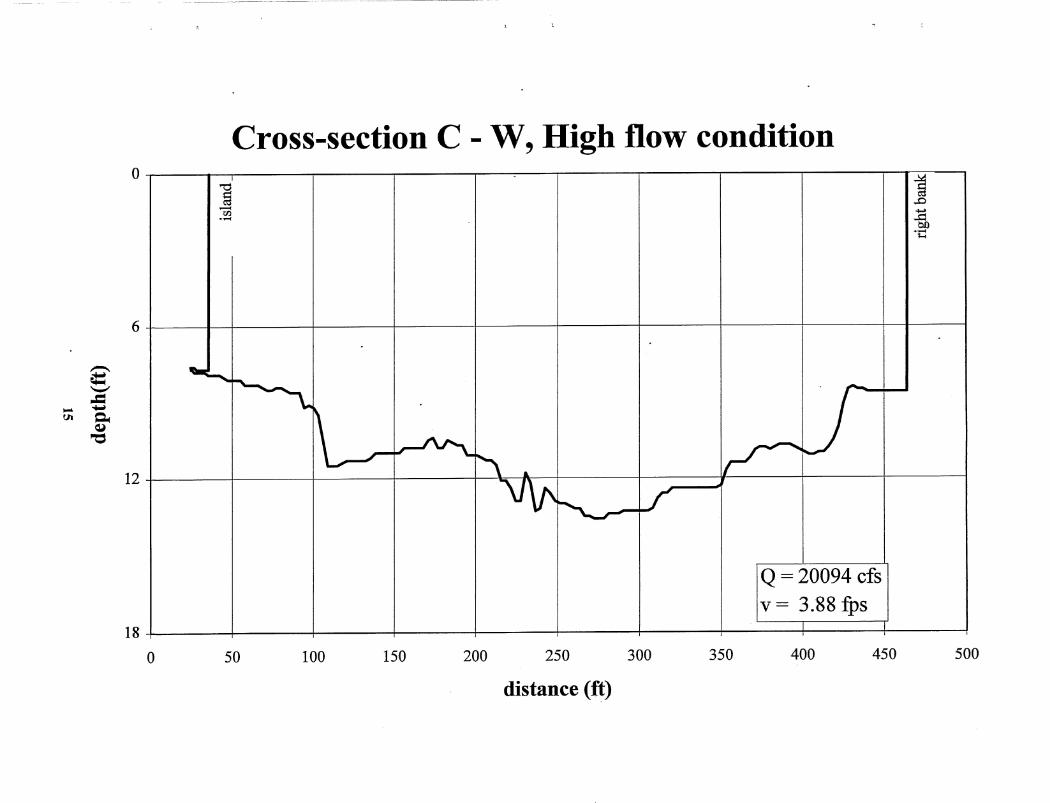
Review of the data for cross sections C, D, E (shown in Appendix A) does indicate a general deepening of the left-hand side of the main and side channels during increased discharge. It is probable that this deepening was greater at the time of maximum discharge. Most events which cause a substantial magnitude of bank. and bed erosion are related to approximately bankfull events with a typical return interval of about two years. As the data indicates, the spring 1997 flood was certainly in excess of that necessary to cause scouring; the scoured channels can rapidly refill as the flood subsides, leaving little, if any, evidence of occurrence. Should ongoing assessment indicate that a countermeasure is necessary at a site, periodic deepening should be taken into account in the design of any erosion countermeasures.
The velocity data showed no unexpected trends; however, both the velocity data and the cross-sectional data provide a strong factual basis upon which the sediment analysis can be based.
3

Grain Size Analysis
Sediment samples were attained at a total of twelve locations as shown in figure 1. The samples were geographically distributed to review all regions undergoing assessment. Sediment size distributions for each of the locations are provided in Appendix B. The first letter of the sample code indicates the cross section, and the second the location along the section from which the sample was attained (for example AR is cross section A along the right baI)lc). The samples indicate that the sediment is predominantly fine sand of about 0.4 to 0.5 mm. One location in the center of the river at cross section B showed some possible armoring. Some samples were relatively dominated by one or more small rocks in the sample which can greatly skew the apparent size distribution.
The results of this analysis were used as input for the sediment transport analysis conducted as past of this study.
Percentage of Occurrence of Operation and Its Related Effects on Sediment Analysis
One of the most beneficial features associated with the inflatable rubber dam is that the dam is inflated only when needed, thereby significantly reducing scour erosion and sediment deposition potential. The likelihood of the dam being raised to divert the passage of water borne pollutants is statistically small. When combined with the small percentage of time that the river discharge is sufficient to cause bank and bed erosion, the potential for wide-spread erosion becomes further reduced. It is estimated that either half of the dam can be inflated for maintenance and operation for two, two or three day periods each year. The widespread effect of this should be very small, due in part to an approximately 3% occurrence and also to the ability to schedule the inflation of the dam to coincide with non-flood flow conditions.
Since the probability of having an inflated dam and damaging discharges occurring coincidentally is relatively remote, the corresponding likelihood of sediment related problems is equally remote. That notwithstanding, the potential effects of long duration raising of the dam were evaluated. If the dam were permanently inflated the constricted reach of river will ultimately try to again reach eqUilibrium with natural conditions. If the top of the dam is below that of major flood events, the effects would be reduced from those stated below, but the analysis is still appropriate. The analysis is based on those references listed in the appendix.
4

"
i-l075<101JH
B c
+.
c
+
D c
+
E
5

After assessment of the riverine planform and the inflatable dam proposed for installation, Dr. Gary Parker, Director of the St. Anthony Falls Laboratory, recommended that ASeE Manuals and Reports on Engineering Practice No. 54 ~ Sedimentation Engineering ~ be used for analysis of potential changes in the river bed due to the new structure. The prediction method recommended in Manual No. 54 for analyzing bed degradation associated with a long constriction should provide a good indication of the river conditions to be expected should the dam be left permanently inflated. The analysis reviewed the potential for the sediment to move both in the existing and the modified channel when treated as a long constriction as per ASeE manual 54 under mean annual and flood discharges of 2 (Q=30,600 cfs), 5 (Q=44,400 cfs), 10 (Q=50,300 cfs), and 25 (Q=72,000 cfs) years. Of most interest was 2-year along with the 5 to 1 O~year floods, as these typically cover the island. Larger events overtop the dam to the extent that jts effect is minimal on the overall resultant effect.
A flood event with a return interval of approximately 2 years is large enough to cause significant sediment movement and frequent enough to have a cumulative effect.
The channel between the island and the shore is nominally 150 ft in width, with the full channel width in the river reach upstream and downstream of the intake averaging around 700 ft. Given adequate time, the constricted reach would try to regain this forced reduction in width. Attempts to maintain existing bank position through the use of riprap or a similar bank protection system would be counteracted with channel deepening of about 5 ft. Both of these results are undesirable and would require substantial mitigation efforts.
6

ISLAND STABILITY
The longitudinal position of the island has remained generally unchanged since 1937. The downstream end has changed noticeably with a general narrowing due to the removal of a bar on the east side. rhis island narrowing has made the secondary channel more uniform in width, as the downstream end of the channel can be seen to have been previously narrower. Most of this change appeared to occur between 1940 and 1967; it was not possible to determine if the bar was natural or the result of intake construction. The extent of the channel widening can be seen in figure 2. While several other islands in the reach have changed to varying degrees, the probable dam location on this island appears to have been relatively stable throughout the past 60 years
7

c
8

POLLUTANT DIVERSION
While it was beyond the s~ope of this task to perform a complete analysis of the flow patterns around the island, a brief general discussions follows. The estimated maximum mean intake approach velocity is about 0.5 ftls, while the mean river velocity associated with a blocked side channel and the 90 percent exceedance discharge is approximately 0.7 ftls. This, in addition to the data showing that the west side of the side channel being generally deeper than the east at low flows should provide the elements necessary for bedload pollutants to pass (without entering) the intake. It may be possible to test this with a suitable non-contaminating tracer after the dam has been installed.
The potential exists for pollutants to deposit upstream of the dam while the dam is inflated. Because of the wide-ranging nature of the pollutants and the potential for zones of slack water to occur upstream of the dam, it is not possible to predict the extent of occurrence. A tracer test could provide a realistic indication of the potential for pollutant deposition.
9

RECOMMENDATIONS AND CONCLUSIONS
The selection of the rubber dam alternative alleviates many of the concerns associated with permanent blockage of the side channel. Several items of concern still exist; however these can be addressed through operational guidelines and periodic monitoring.
• The dam should remain deflated except for testing and emergency operations.
• The dam should be raised for operational testing only during periods of low flow. It may be possible to minimize any problems associated with near dam sediment deposition by performing one of the operational tests as soon as the spring flood has receded. The near~shore dam s,hould be inflated first to allow sediment passage away from the intake first.
• During the first few inflation, regions around the dam and zones along the near shore and the island should be evaluated using drift bodies to perform velocity measurements. Prior to spring inflation a topographic survey should be taken upstream of the dam. Following each inflation, a series of bed topography measurements should be taken near the dam and the island. These tests will provide valuable information regarding sedimentation, as well as the need for scour countermeasures.
• If the dam is not monitored and periodically inflated, the structure may become subject to siltation causing the dam to fail to inflate or to inflate improperly.
• Following any discharge event of half bankfull or greater discharge, the island and both river banks should be evaluated to assess their stability. Should evaluation indicate a necessity for bank protection, a preliminary analysis has indicated that Class I riprap should be adequate for the island and bank shores.
Riprap should be installed in the immediate area around the dam and is suggested along the upstream end of the island at the time of initial construction to add to the stability of the structure.
10

Appendix A
Cross Sectional
and Velocity Data
11

Cross-section A, High flow condition o
§ § .£J ~ .£J
(!) ~ ........ bD .-;..,.
6
,-.. ¢:: '-" ..= - .......
- -
", . W ~~
d "-...-
N ~ ~
"'0
12 ~ M ~ , V ~--~
Q=25446 cfs v = 3.48 fps
, , , , 18
o 100 200 300 400 500 600 700 800
distance (ft)

Z' ~ ---..= - .....
c.J ~ ~
"'CS
o ..- § .n ~ -
6
12
Cross-section B , High flow condition
Q=24857 efs v = 3.40 fps
m .n
fn --;....,
18~'--------~------~-------+------~--------4--------+--------r-----~
o 100 200 300 400
distance (ft)
500 600 700 800

Cross-section C - E, High flow condition o
§ "'0 1
,..0 § ¢:: ......
rIl Q) .-......
6
~
4:= '-' ,.c: - .......
,j:". ~ ~
"t:I
12
V /"
v---~
~ ./
/ --Q=5499 cfs -v= 3.10 fps I
18 , , ,
o 20 40 60 80 100 120 140 160
distance (ft)
-----------------
Cross-section C - W, High flow condition o - 1 § ..D .......
rI.l ~ .- bI) .-;..,
6
Z' ~ '-' .=
~ ..... til Co!
~ "'t:I
12
........... ~~ . .-.
~ J ~ ,-J--~ I\~
\1'" ~-f
Q=20094cfs v= 3.88 fps
18
o 50 100 150 200 250 300 350 400 450 500
distance (ft)
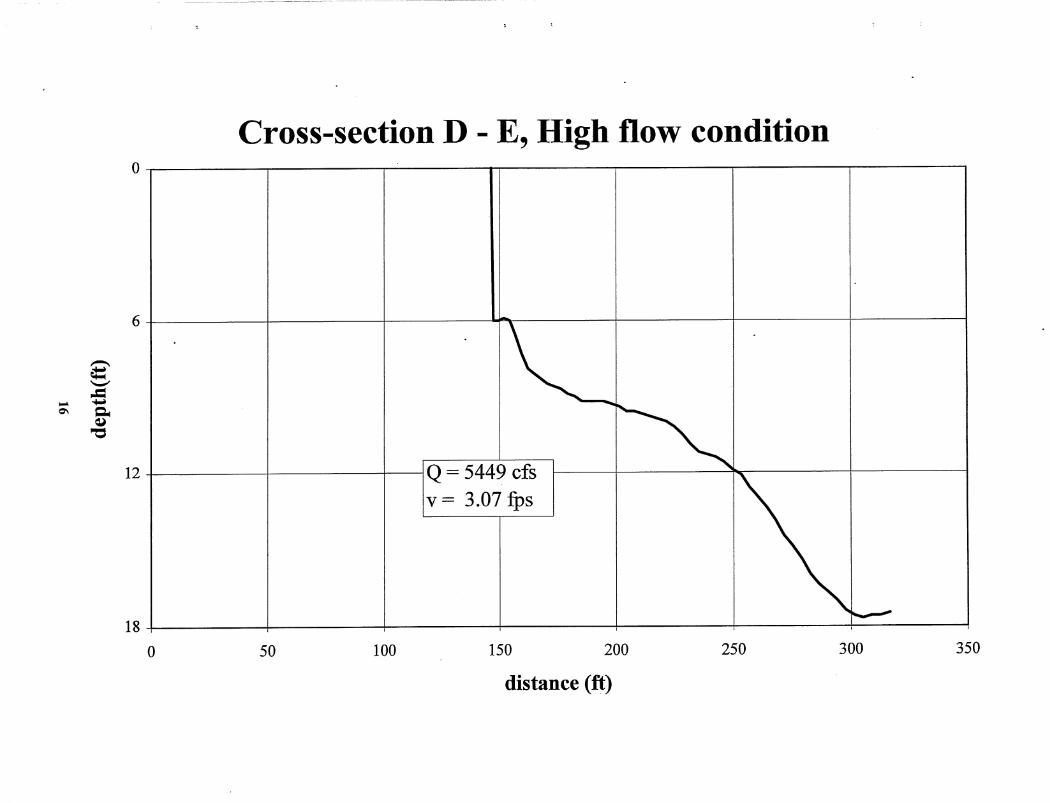
Cross-section D - E, High flow condition o
6
Z' ~ ~ -= ... .....
~ ~ ~ ~
12
i i
~ Q = 5449 cfs v = 3.07 fps I
--, , 18
o 50 100 150 200 250 300 350
distance (ft)

o
6
,-..... ¢:: '-' ,..= - ....
-.l Co. ~
"e
12
18
o
Cross-section D - W, High flow condition
, ,
100 200 300 400
~
~V
,
500
distance (ft)
600
L! ,~ U --~
Q = 21344 cfs v = 4.08 fps
,
700 800 900 1000

~
¢: '-' ..= .... .....
QO ~ ~
"t:I
Cross-section E, High flow condition
o I I ~ I III 6
12
Q=26083 cfs v = 3.66 fps
18L'----------~----------+_--------~----------_+----------~--------~ o 100 200 300 400 500 600
distance (ft)

Cross-section A , Low flow condition o
§ § ,..0 ,..0
ct::: .E (1) 0.0 ,- .-;....
--'
6
,-... 4:: ---..= ..... .....
\C ~ ~
"t:I
12
\ V .~ ~
. V /
V Q=9956 cfs v = 2.06 fps
18 , ,
o 100 200 300 400 500 600 700 800
distance (ft)

,-... ¢: '-' ..c:
~ ..... = Q. ~
"t:S
Cross-section B , Low flow condition o
~ ..0
~ ..0
c:t:: I!) ..- ~ .-1-<
6 I "\: " I l""= I=-'£
124-------~~-----+------~--------~_r==~~~~~_[------_t------~ Q = 10122 cfs v = 1.97 fps
i
18t'--------~------~------_+------~L-------4_------_+------__ r_----~
o 100 200 300 400 500 600 700 800
distance (ft)

--- -- --- -._----
Cross-section C - E, Low flow condition o
§ '"0 §
.0 ...... TIl
~ .-CD ......
6 ~ --... 'Z' ~ '-' -= ~ ..... - ~
-....... ~ ~ ./
~ - -"t:S
12
Q=2429cfs v = 2.15 fps
18
o 20 40 60 80 100 120 140 160
distance (ft)

Cross-section C - W, Low flow condition o
~ § § ..-
17.l ..0 .- j:! on ........ ;....
6
,-.... ¢:: ......, ..=
N .....-N ~
~ "0
~
~ v' / ~
~ ~ ~ v -' -
12
Q= 8168 efs v= 2.23 fps
I
, , , 18
o 50 100 150 200 250 300 350 400 450 500
distance (ft)

o
6
Z' ~ '-' ..=
t-) ...... ~ c..
~ ~
12
18
o
Cross-section D - E, Low flow condition
§ .D ct::
(1) ..-
~
Q =2354 cfs v= 2.-07 fps
,
20 40 60
---........ ~ ~ ~
80
distance (ft)
100 120
"'0 §
..-tf.l .-
,
140 160

Cross-section D- W, Low flow condition o ""-"0
g § ..-lZl .0 .,.....
~ OJ) .,..... I-<
6
Z' ~ '-"
'\ ~ ~ " V ......
~ V """"--""
.......... ..c:
to) ..... ~ ~
~ "0 -..J ~
12
Q = 8386 cfs v = 2.42 fps
18 , ,
o 50 100 150 200 250 300 350 400 450
distance (ft)

)JU13qll{~P
~ u 0 lr) 1..0 0 ~
II
= CI Q .~ ~ .,....c
~ = Q u
~ Q = ~ Q ~
.... ~
= Q .~ ~ U QJ rIJ. I
rIJ. rIJ. Q ~
U
o
25
rI)
~ ('.l ('.l . ('.l
II I>
<=> <=> \0
0 0 l()
0 0
""
0 <=> ~
0 0 ~
0 - 0
00 -
-
<=>
Z' 5 ~ ~ = = .. Vi . ,...
"Cj

VELOCITY ANALYSIS
The objective of the analysis was to classify the large amount of significantly scattered measured data, so that they can be used for further engineering studies.
In order to choose the appropriate X~ Y projection for each cross section, the least square method was employed. The criterion for minimizing the objective function was to get a projection with the least square discrepancies with respect to a straight line between river banks.
For each (x, y, z) point of the cross section, velocity components u and v were averaged over depth, while w component was neglected. Some points on the same vertical had invalid velocities (i.e. u = ~.99.99 ft/s) , so the whole vertical was left out from further consideration. Every cross section was defined by approximately 50 (x, y) points. The analysis was carried out for low and high flow conditions. The velocity cross-sections attained for the high discharge at cross sections C east and west along with cross section E were omitted from the data analysis. Because of the consistency between surrounding cross sections and E being at the downstream end of the reach analyzed, omitting them did not significantly affect the sedimentation analysis that was conducted.
Velocity output files contain the following cross-section data:
x
Y H u
v
Iv I
v/u=tan a
transverse coordinate (ft)
longitudinal coordinate (ft)
Local depth (ft)
(the origin is located at the left river bank)
depth - averaged transverse velocity component (ft/s)
depth - averaged longitudinal velocity component (ft/s)
magnitude of velocity vector (~ u2 + V 2 )
a defines direction of velocity vector with respect to X-axis
Velocity profiles for all seven cross sections under specified flow conditions are displayed on the same graph, with the length scale in dimensionless form (XlL).
For the purpose of velocity analysis, files with the extension PLT were used! No additional velocity measurements are needed at this time.
26

(20) I 04 Nov 1997 I VELOCITY DISTRIBUTION FOR HIGH FLOW CONDITIONS
Velocity Distribution for High Flow Condition
IXCD w~ G41s.9 fi]
IXCD E~ L =135.6 HI
~
IxeB: L =747.6 ftl
1 fps [XCA:LU = 714.3li]
0:0 0:2 0:4 0:6 0:8 1 :0 X/L

(20)
N go
0:0
Velocity D istributionfor Low Flow Condition
0:2 0:4 0:6 0:8 X/L
IXCE~ L = 521.0 ftl
IXCD W: G43-3:6 HJ
IXCD E: L = 138.7ft]
IXCC W: L = 428.7 ftJ
IXCCE: L --;u131.4 HI
IXCB:L = 738.5li]
1 fps
IXCA: L = 683.2 HI
1:0

Cross - sectional analysis
The objective of the analysis was to define all seven cross sections on the Upper Mississippi River (in the vicinity of Pump Station #5) by using the results oflow~flow and high~flow discharge measurements. .
Since the transverse coordinate X and the longitudinal coordinate Y for each cross section
were laying on the straight line, new coordinate Z*, found as ~x'). +y'). , was introduced as a measure of the distance from the origin.
All seven cross sections for specified flow condition were displayed on the separate graphs, along with information on total cross~ sectional discharge and velocity. Cross sections D ~ E and D " Ware uncompleted due to lack of data.
Comment: The way the analysis was conducted is shown in the enclosed table (the case of cross section A, for high flow condition). The calculation is based on the data from files with tbe extension AVO!
29

Appendix B
Grain Size Analysis
30

~ ....
o (mm)
5.6 4 2
0.833 OA2 0.25
0.149 0.105 0.074
2:=
D (mm)
5.6 4 2
0.833 OA2 0.25
0.149 0.105 0.074
2:=
mass (g)
475.3 72.0 70.1
134.5 119.1 150.8 44.5 27.1
1093A
mass (g) 1728.2 279A 326A 149.7 644.8 586.8 157.2
11.8 2.9
3887.2
EL cum. mass (g) pf(%) mass (g)
1093A 100.0 4.5 618.1 56.5 17.0 546.1 49.9 139.7 476.0 43.5 899.3 341.5 31.2 467.0 222A 20.3 45.6
71.6 6.5 1.3 27.1 2.5 0.6
1575.0
BC cum. mass (g) pf(%) mass (g)
3887.2 100.0 2159.0 55.5 0.8 1879.6 48A 0.3 1553.2 40.0 0.9 1403.5 36.1 2.1 758.7 19.5 7.8 171.9 4A 33.7
14.7 OA 11.8 2.9 0.1 9.6
67.0
DC ER cum. mass (g) pf(%) mass (g) cum. mass (g) pf(%)
1575.0 100.0 1.9 229.0 100.0 1570.5 99.7 0.2 227.1 99.2 1553.5 98.6 1.6 226.9 99.1 1413.8 89.8 6.1 225.3 98A
514.5 32.7 33.6 219.2 95.7 47.5 3.0 136.3 185.6 81.0
1.9 0.1 31.9 49.3 21.5 0.6 0.0 17A 17A 7.6
229.0
AR BR cum. mass (g) pf(%) mass (g) cum. mass (g) pf(%)
267.7 682.5 100.0 67.0 100.0 40.2 414.8 60.81 66.2 98.8 65.5 374.6 54.9 65.9 98A 54.0 309.1 45.3 65.0 97.0 58.7 255.1 37A 62.9 93.9 68.3 196.4 28.8 55.1 82.2 96.0 128.1 18.8 21A 31.9 18.8 32.1 4.7
9.6 14.3 13.3 13.3 1.9 682.5

t.J ~
o (mm)
5.6 4 2
0.833 0.42 0.25
0.149 0.105 0.074
L=
O (mm) 5.6 4 2
0.833 0.42 0.25
0.149 0.105 0.074
2:=
mass (g)
0.6 0.4 1.2
212.8 1365.9
467.9 69.5 58.6
2176.9
mass (g)
86.1 63.8 36.2 44.9
611.4 541.6
96.0 95.8
1575.8
CI cum. mass (g) pf(%) mass (g)
224.8 2176.9 100.0 11.1 2176.3 100.0 12.2 2175.9 100.0 15.5 2174.7 99.9 39.8 1961.9 90.1 29.6 596.0 27.4 82.9 128.1 5.9 21.7
58.6 2.7 12.1 449.7
AL cum. mass (g) pf(%) mass (9)
1575.8 100.0 39.9 1489.7 94.5 39.8 1425.9 90.5 59.0 1389.7 88.2 88.5 1344.8 85.3 396.1
733.4 46.5 477.5 191.8 12.2 75.3
95.8 6.1 47.5 1223.6
c,
CR OJ cum. mass (g) pf(%) mass (g) cum. mass (g) pf(%)
449.7 100.0 190 733.4 100.0 224.9 50.0 24.7 543.4 74.1 213.8 47.5 45.3 518.7 70.7 201.6 44.8 68.0 473.4 64.5 186.1 41.4 124.8 405.4 55.3 146 .. 3 32.5 127.9 280.6 38.3 116 .. 7 26.0 130.6 152.7 20.8 33.8 7.5 15.2 22_1 3.0 12.1 2.7 6.9 6.9 0.9
733.4 I
BL OR-cum. mass (g) pf(%) mass (9) cum. mass (g) pf(%)
1223.6 100.0 90.1 951.7 100.0 1183.7 96.7 28.0 861.6 90.5 1143.9 93.5 74.0 833.6 87.6 1084.9 88.7 279.9 759.6 79.8
996.4 81.4 203.1 479.7 50.4 600.3 49.1 217.1 276.6 29.1 122.8 10.0 37.2 59.5 6.3
47.5 3.9 22.3 22.3 2.3 951 .. 7

,.\
-?ft. ~ Q.
GRAIN SIZE DISTRIBUTION 100
80
60
40
f'~ p' .. ..... "" ~I /,- "
__ I
..- ,,- PI'-" ...-:,.,:... --- -- I I • I
/ I . 1
I I I
I ,
I I
I I I I
/ I .
- ,I I
I I -' . ,.-- ' I I -.-I ,- ' .... ··PC .
//' " ,,,," . v --ER .... ... , , I 20 --- AL ~I ,
~ . . ",,"',~ I
I . _. _. EL
~ .. ~ o 0.1
100
80
. . ' 1
D(mm)
GRAIN SIZE DISTRIBUTION
.? ........ "' .. "' .......... ,. ...... ; . ..;.-:.;.;,.:.-.... " ,. ............ ..- __ -----.- ".;"''1'
.. ,,,- , ........ -..... - -"-"-" " " .I"
........ "'"'"' . ..-I . / . , ,
/ I , _ 60 ?ft.
, . I , ,
,I' " 'I . I I
I ./ .. · .. ·AR , l;::' Q. 40 . I / .
1:// .' ... // ;' ,
IZ /' ....... 20
o 0.1
--. CI -·_·DR --- BL
1
D (mm)
33
I--
-
10
-
r---
10

I, GRAIN SIZE DISTRIBUTION 100
80
- 60 ?f!. --Q. 40
20
0
.I ..... -Be -
J --BR p'~ .. ...-
--- CR "'" . . .- ~
- ,"'" k:;:" _. _. DI / ,. ,. ,. ,. I
/ .-~ ..-::-~~~ ..
~ ... ,,,, , r,1" ,,'
f. ,,' '*
I. " , , ,
0.01 0.1 1 10
o (mm)
1.)
34