analytic scaling functions applicable to dispersion measurements in percolative metal-insulator...
TRANSCRIPT
PHYSICAL REVIEW B 15 NOVEMBER 1998-IIVOLUME 58, NUMBER 20
Analytic scaling functions applicable to dispersion measurementsin percolative metal-insulator systems
D. S. McLachlan, W. D. Heiss, C. Chiteme, and Junjie WuDepartment of Physics, University of the Witwatersrand, PO Wits 2050, Johannesburg, South Africa
~Received 15 June 1998!
Scaling functions,F1(v/vc1) and F2(v/vc
2) for f.fc and f,fc , respectively, are derived from anequation for the complex conductivity of binary conductor-insulator composites. It is shown that the real andimaginary parts ofF6 display most properties required for the percolation scaling functions. One difference isthat, forv/vc,1, ReF2(v/vc) has anv dependence of (11t)/t and notv2 as previously predicted, but neverconclusively observed. Experimental results on a graphite–Boron nitride system are given, which are inreasonable agreement with thev (11t)/t behavior for ReF2 . Anomalies in the real dielectric constant just abovefc are also discussed.@S0163-1829~98!07443-8#
orors.
ho
ioerioityanviin
re
y.io. Ilt
bes
on
s
etricaf t-
ted
ith
ere. Inone
tlyea-andthis
canf
.reions
de-of
er
pre-theeure-y
ea-withtoisinonlted
I. INTRODUCTION
The ac and dc conductivities of resistor and resistcapacitor (RC) networks and continuum conductor-insulatcomposites have been extensively studied for many yearsystems where there is a very sharp change~metal-insulatortransition or MIT! in the dc conductivity at a critical volumefraction or percolation threshold denoted byfc , the mostsuccessful model, for both the dc and ac properties,proved to be percolation theory. Early work concentratedthe dc properties, but since it was realized1–6 that the per-colation threshold is a critical point, and that the percolatequations could be arrived at from a scaling relation, sevpapers, which are referenced and discussed in a prevpaper,7 reporting experimental results on the ac conductivhave appeared. Review articles, containing the theorysome experimental results, on the complex ac conductiand other properties of binary metal-insulator systemsclude Refs. 8–10.
In another paper, extensive dc conductivity and low fquency dielectric constant results on systems basedgraphite~G! and hexagonal boron nitride~BN!, which havewhat are probably the cleanest and sharpest dc MIT’sobserved in a continuum system, have been reported11,12
These G-BN results were found to obey the percolatequations, as a function of volume fraction in Refs. 11, 12Ref. 7 it was shown that the experimental dispersion resufor samples with various volume fractions of G, canscaled onto two curves that are consistent with previoumeasured percolation parameters;11,12 one curve refers to thereal conductivity above and the other to the imaginary cductivity ~real dielectric constant! below the critical volume.Unfortunately, the parametersvc
6 that had to be used toachieve this scaling were found to be different from thoexpected from the scaling models (RC lattice8 and anoma-lous diffusion13!, no matter whether thevc
1 and vc2 were
calculated using the accepted universal parameters or thready reported dc conductivity and low-frequency dielecresults.11,12 However, there is agreement between the critiexponents, characterizing the frequency dependence oreal conductivity whenf.fc ~where f denotes the con
PRB 580163-1829/98/58~20!/13558~7!/$15.00
-
In
asn
nalus
dty-
-on
et
nns,
ly
-
e
al-clhe
ducting volume fraction!, the imaginary conductivity forf,fc and the exponents found from the previously repordc and low frequency ac results.11,12
One measurable scaling function that did not agree wthe previous power law predictions8–10 was that for the losscomponent in the insulating region. As these results wsomewhat controversial they were not discussed in Ref. 7the meantime further measurements have been made onof the G-BN systems11,12and other systems, using a recenacquired dielectric spectrometer system that is able to msure far smaller dielectric loss parameters as well as lossphase angles. Some of these results are presented inpaper.
The present paper introduces scaling functions thatdepend oncomplexconductivities. They closely fit results othe medium conductancesM , in particular the frequency~v!dependence of the first-order real part forf.fc and thefirst-order imaginary part forf,fc as was shown in Ref. 7Most of the scaling power laws given in Refs. 8–10 aobtained; the range of parameters over which these functcan be expected to generate accurate scaling functions isrived. It is also shown that, while the second-order termsthe scaling functions have the exponentst/(s1t) for f'fc andv/vc@1 as given in Refs. 8–10, the second-ordexponents for low frequencies andf*0 or f&1 differ fromthose of Refs. 8–10. Experimental results forsM(v,f) arepresented that agree reasonably well with the exponentsdicted by the introduced scaling functions, provided thatcomplexconductivities of the dielectric components of thcontinuum systems are taken into account. The measments forsM (f,fc) in the G-BN systems are definitelnot in accord with thev2 prediction given in Refs. 8–10.
A feature of the experimental results is that, where msurable, the real dielectric constant continues to increasef for f.fc and certainly does not decrease according(f2fc)
2s as given in Refs. 8–10. However, this increasequalitatively consistent with the expressions introducedthis paper. The effect is more clearly observed in carbblack-polyethylene compounds14 and in three-dimensionasystems where various conducting powders are distribuon the surfaces of large insulating grains.15
13 558 ©1998 The American Physical Society
innt
ee
r-
iu
tr
ac
tieq.
reo
n
yr
ersari-
forse
nthatther
igh
e.,
PRB 58 13 559ANALYTIC SCALING FUNCTIONS APPLICABLE TO . . .
II. THEORY
The equation
~12f!~s I1/s2sM
1/s!
~s I1/s1AsM
1/s!1
f~sC1/t2sM
1/t!
~sC1/t1AsM
1/t!50 ~1!
gives aphenomenologicalrelationship betweensC , s I , andsM , which are the conductivities of the conducting andsulating component and the mixture of the two componerespectively.7,16 Results obtained from an earlier version17 ofEq. ~1! are reviewed in Ref. 18 and references therein, whthe dc conductivities of some two phase systems are succfully modeled fors5t. The conducting volume fractionfranges between 0 and 1 withf50 characterizing the pureinsulator substance (sM[s I) andf51 the pure conductosubstance (sM[sC). The critical volume fraction, or percolation threshold, is denoted byfc , where a transition froman essentially insulating to an essentially conducting medtakes place. We use the notationA5(12fc)/fc . For s5t51 the equation is equivalent to the Bruggeman symmemedia equation.18,19 The equation yields the two limits
usCu→`: sM5s I
fcs
~fc2f!s , f,fc ~2!
us I u→0: sM5sC
~f2fc!t
~12fc!t , f.fc , ~3!
which characterize the exponentss and t. Note that Eqs.~2!and ~3! are the normalized percolation equations. Formeasurements, Refs. 8–10 have given equations for thewheresC is real ands I52 ive0e I , which characterizes alossless dielectric. However, we note that all three quantis I , sC , andsM can in principle be complex numbers in E~1!. A solution forsM can be obtained after rewriting Eq.~1!using the variablez5sM
1/t , viz.,
Az11a2za~Af1f21!sC1/t2z~A2Af2f!s I
a/t
2~s IasC!1/t50 ~4!
with a5t/s. We note in passing that Eq.~4! has explicitsolutions fora51, 2, and 3, while numerical solutions aeasily obtained for larger integer values. Our interest is nfocused on the question as to what extent the solution forsMcan be used to obtain valid scaling functions.
The scaling conditions, which are based on those giveRefs. 8–10, read
sM5H sC
~fc2f! t
fct F2~x2!, f,fc ~5!
sC
~f2fc!t
~12fc!t F1~x1!, f.fc , ~6!
where the scaling functionsF6(x6) depend on the scalingparameters
x25s I
sC
fcs1t
~fc2f!s1t 52 iv
vc2 , f,fc ~7!
with
-s,
ress-
m
ic
case
s
w
in
vc25
sC
e0e I
~fc2f!s1t
fcs1t ,
and
x15s I
sC
~12fc!s1t
~f2fc!s1t 52 i
v
vc1 , f.fc ~8!
with
vc15
sC
e0e I
~f2fc!s1t
~12fc!s1t .
The expressions involvingv6 assume specifically a purelreal sC and imaginarys I . To ensure that curves drawn foF6 fall on top of each other for differentfc , the normaliza-tion employed in all the equations used in this paper diffsomewhat from the one used in Refs. 8–10. Using the vable u5F2
1/t an equation is found foru by the substitutionz5usC
1/t(fc2f)/fc in Eq. ~4!. It reads forf,fc as
Au11a1ua2u~fc2f!~12f2fc!
fc2
x21/s2x2
1/s50. ~9!
In a similar way, the substitutionz5usC1/t(f2fc)/(1
2fc) leads to an equation forF11/t ~again denoted byu) for
f.fc
Au11a2Aua2u~f2fc!~12f2fc!
fc~12fc!x1
1/s2x11/s50. ~10!
If the term linear inu of Eqs. ~9! and ~10! could be ne-glected, the scaling functionsF6 would manifestly dependonly on the respective variablesx6 . It is due to this term thatscaling is invalidated to a certain degree by the solutionsM of Eq. ~1!. The range and extent to which this is the caare discussed below. An interesting aspect of Eqs.~9! and~10! is exact scaling atf5fc and f512fc . Whether ornot exact scaling forf512fc is merely a coincidence caonly be revealed by appropriate experiments. We stressall results obtained in this section are independent of whethe conductances and hence the scaling functionsF6 aregenuinely complex or real.
Exact solutions of Eqs.~9! and~10! can be read off at thelimit points of the concentration. Atf50, it is ua5x2
1/s , i.e.,F2[x2 and atf51, it is u51, i.e., F1[1. From thesesolutions, Eqs.~2! and~3! are obtained from Eqs.~5! and~6!,respectively. In fact, the respective solutions are valid to haccuracy forf.0 andf,1 as long asux6u!1 or for fvery close to eitherfc or 12fc . Correction terms are givenbelow.
For the opposite limit of the scaling parameters, i.ux6u@1, we obtain for the leading term atf'fc the solu-tion Au11a5x1/s from both equations,~9! and ~10!. Thistranslates into
F65~x6! t/~s1t !A2st/~s1t !, ~11!
which gives
sM5sC
Ast/~s1t ! S s I
sCD t/~s1t !
at f5fc . ~12!
l-
i-
n
aw
m
ds
-n
hansta
rm
aly
g is
n
s
vior
for
en-
romsi-eri-m-
i-
sed
r
t no
13 560 PRB 58McLACHLAN, HEISS, CHITEME, AND WU
Note that Eq.~12! conveniently lends itself for complex vaues ofs I andsC ; in particular, ifs I is purely imaginary andsC real one obtains
Im sM52sC
Ast/~s1t ! U ve0e I
sCU t/~s1t !
sinS pt
2~s1t ! D , ~13!
Re sM51sC
Ast/~s1t ! Uve0e I
sCU t/~s1t !
cosS pt
2~s1t ! D . ~14!
From Eq.~11! it follows that the slope of the real and imagnary part of ln(F6) is t/(t1s) when plotted against ln(x6)for ux6u@1. Equations~13! and ~14! show that, withs I52 ive0e I , the frequency dependence of both real aimaginary sM is v t/(s1t). This dispersion law is given inRefs. 7–10. Experimental results validating this power lare found in Refs. 7, 12, 20–24. The loss angled5arctan$pt/@2(s1t)#% implied by Eqs.~13! and ~14! is alsogiven in Ref. 8.
It is of physical interest to determine the correction terof next order in Eqs.~2! and ~3!. Note that Eq.~2! yields apurely imaginary result forsM if s I is imaginary. However,a loss term should emerge forv.0 when f.0. This isobtained by expanding the solution of Eq.~9! for f*0. Onefinds for the scaling function
F25x22sf
fc2 x2
x21/t
Ax21/t11
5s I
sCS 11~s1t !
f
fc2s
f
fc2
~s I /sC!1/t
A~s I /sC!1/t11D , ~15!
which can be used for real or complexs I or sC . CombiningEq. ~15! with Eq. ~5! one obtains for smallf/fc , as ex-pected, both an enhanced dielectric loss term ResI(11sf/fc) and a composite loss term. Taking specificallys Ipurely imaginary andsC real, the composite loss term reaexplicitly up to terms linear inf/fc
Re sM5ssC
f
fc2
u s I /sCu~11t !/tsin~p/2t !
Aus I /sCu2/t12Aus I /sCu1/tcos~p/2t !11.
~16!
An important consequence of Eq.~16! is the small frequencybehavior of the loss term~recall s I52 ive0e I), which im-plies
Re sM;v~11t !/t, ~17!
which differs from thev2 behavior predicted by the expansions used forF2 in Refs. 8–10. We note that these expasions assume analytic behavior forsM aroundv50, whichis in contrast to our findings; also we obtain a loss term tvanishes forf→0, which is not the case for the expressioin Refs. 8–10. The following section presents experimenresults that appear to confirm the power law expressedEq. ~17!.
By similar means we obtain the first order correction tein the vicinity of f&1, which reads
d
s
-
t
lby
F1511t12f
fc~12fc!
x11/s
A1x11/s
511t12f
fc~12fc!
~s I /sC!1/s
A1~s I /sC!1/s . ~18!
Note that this term implies not only a correction to the repart ofsM in Eq. ~3! but also a switching on of an imaginarpart for complexs I . For purely imaginarys I this is
Im sM52t12f
fc~12fc!sC
3us I /sCu1/ssin~p/2s!
A212Aus I /sCu1/scos~p/2s!1us I /sCu2/s ~19!
which implies in this limit, fors I52 ive0e I , that ImsM;v1/s.
So far, we have concentrated on regions where scalinobeyed by the solution of Eq.~1! either exactly or to highaccuracy, that is, for 0<f,fc and fc,f<1, if ux6u!1,and forf'fc , if ux6u@1. There is an intermediate regioux6u;1, where the linear term inu of Eqs. ~9! and ~10!invalidates the sole dependence ofF6 on x6 except forf5fc or f512fc . In fact, it can be shown that, as long athe inequality
v
v0,
fc
122fcwith v05U sC
e0e IU ~20!
is obeyed, the linear term of Eqs.~9! and ~10! is immaterialand scaling prevails. As a consequence, the leading behaof F6 , for x6@1, is governed by the power lawx6
t/(t1s) onlyup to the frequency that obeys the inequality~20!, for largerfrequenciesF6 becomes a linear function ofx6 . Note, how-ever, that the right-hand side of Eq.~20! depends onfc insuch a way that scaling is expected to be invalidated onlysmall values offc and sufficiently large values ofv. In turn,for fc.1/3 the right-hand side of Eq.~20! is larger thanunity, and forfc→1/2 no bound onv prevails.~Note thatfc51/3 is the Bruggeman value for spheres in three dimsions andfc51/2 for discs in two dimensions.18,19! As aconsequence, there should be no discernible deviations fscaling forfc.1/3. To what extent these results are phycally valid can only be assessed by experiment. No expments in this region appear to exist and the situation is coplicated by the fact thatsC and s I depend onv when vbecomes sufficiently large.
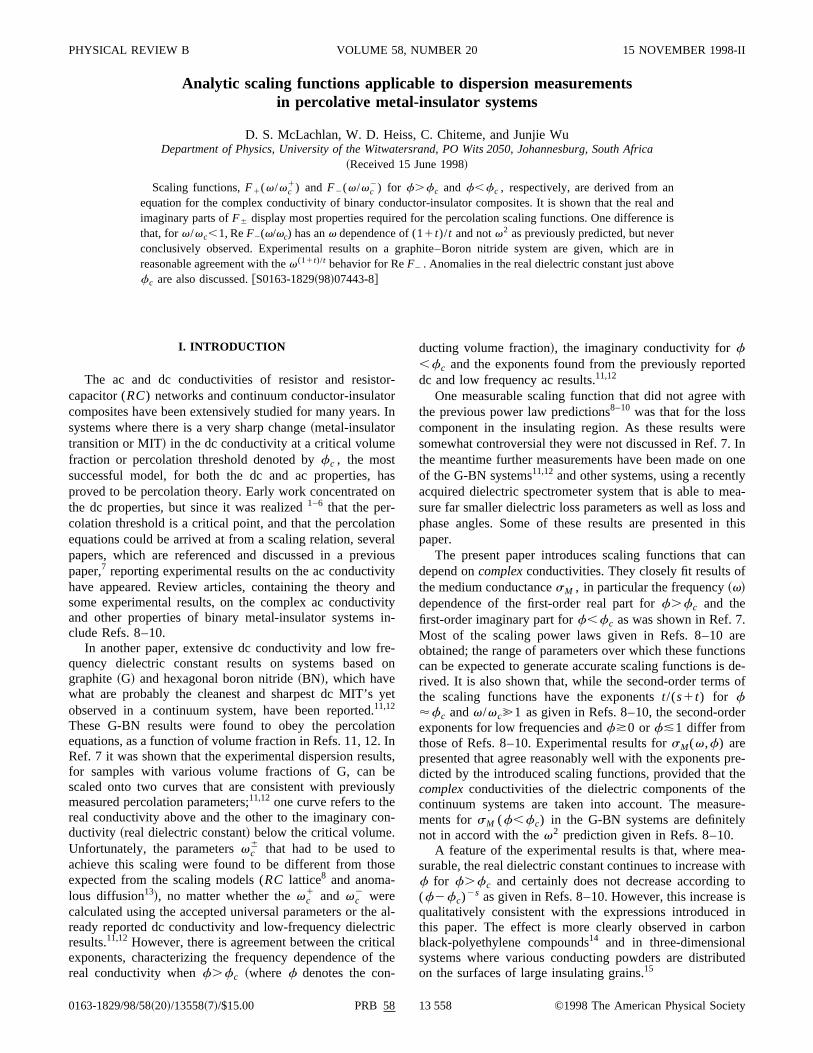
In Fig. 1 we illustrate the behavior of the real and imagnary parts ofF6(x6) for s51, t52 andf5fc50.16, thatis for the situation where scaling holds exactly. As discusabove, deviations are marginal whenf is near tofc andbecome noticeable only when the inequality~20! is apprecia-bly invalidated. Note the equal slopes for largex6 of all fourcurves in accordance with Eqs.~13! and ~14!. Also, sincet.s, the imaginary parts are larger than the real parts; fos5t all four curves would coincide asymptotically. Fors.tthe real parts would be larger than the imaginary parts busuch system has been observed or predicted.
We interpret the dependence ons I /sC of the percolationloss term as predicted by Eqs.~15!–~17! as follows: Con-
oly
thooheetis
-em
in
-ist-e
,
yt
ite
e
n
s-
d
ce-ibed
11
re.ined
axare
f the
olureing
of a
enr-re
-f
the
stfor
PRB 58 13 561ANALYTIC SCALING FUNCTIONS APPLICABLE TO . . .
sider a three-dimensional lattice, with ideal capacitorsnearly all the bonds but with a small number of randomdistributed resistors embedded in the capacitor matrix, eias isolated components or as small clusters, and chCv,1/R. If a voltage is applied to two opposite faces of tlattice, the displacement current in the lattice is determinalmost entirely by the capacitors. Therefore, as the currenthe resistors is evoked by a ‘‘fixed current source,’’ whichdetermined by the value of 1/(Cv), the dissipation is pro-portional to I 2R, i.e., the largerR the more power is dissipated. This argument can be extended to continuum systwhich qualitatively explains the dependence ons I /sC in Eq.~15!. The presence of the exponentt, which determines therate of increase of the conductivity beyondfc , would there-fore appear to have a role in the formation of the conductclusters, which determine the dissipation belowfc . How-ever, belowfc , the behavior of the complex effective conductivity is dominated by the imaginary component, whichprimarily determined by the interconnectivity of the insulaing medium, or more specifically its ability of keeping thclusters of the conducting medium disconnected belowfc ,which in turn is characterized by the exponents.
We note that the treatment given in Refs. 8–10 has not ors dependence forx2,1 or x1,1, respectively. Howeverour Eqs.~15! and ~18!, which are based upon Eqs.~9! and~10!, indicate that the exponentt, which characterizes theformation of the conducting backbone, continues to plarole for f,fc ; similarly, the real dielectric constant is noindependent ofs for f.fc .
III. EXPERIMENTAL METHOD
The percolation system7,11,12 that best exhibits the (11t)/t behavior is a lightly poured powder of 55% graph45% boron nitride, which is compressed, expelling air, incapacitive cell through the percolation threshold. As the pcolation threshold is at 0.124~volume fraction of G!, theinsulator at and around this point consists of 11.4% BN a88.6% dry air, which obviously has a Ree close to one and a
FIG. 1. Plots ofF1 andF2 againstx1(v/vc1) andx2(v/vc
2),respectively. The parameters used aref'fc50.16,s51, and t52. As f'fc the values used forsC must be accordingly large toyield a finitevc
6 . The upper solid curve is ReF1 and the lower oneReF2 ~the second order dielectric loss term!. The dashed line isIm F2 ~the first-order term belowfc), and the dotted line is ImF1 .Note how this term rises above ImF2 in the region wherex6 isbetween 1 and 100.
n
erse
din
s,
g
a
ar-
d
very low Im e term. The dissipation in more compacted sytems, such as compressed pellets of G-BN~Ref. 7! orpolyethylene-carbon black,14 would appear to be dominateby the dissipation in the dielectric component.
As the constructions of the cells and experimental produres for the G-BN powder have been adequately descrfor the dc and low-frequency ac measurements in Refs.and 12 as well as the dispersion measurements@sM(v) forfixed f# in Refs. 7 and 12, they will not be repeated heSome experimental results are presented, which are obtaby tumbling various conducting powders with larger wcoated insulating grains. The conductor coated grainsthen compressed into disks.15
The measurements presented here are the results oreal and imaginary parts of the conductivity between 1021
and 3.106 Hz, obtained using a newly acquired NovocontrDielectric Spectrometer. This instrument is able to measfar smaller loss components of the dielectric or insulatphase~equivalent to a resistor of 1018 V at 1021 Hz and108 V at 105 Hz in parallel with a perfect capacitor! and hada better resolution of loss or phase angle~a maximum oftand of .103 and a minimum of,1023 can be measured!than the instruments used in Ref. 7 or measurementssimilar nature.20–24
IV. RESULTS AND DISCUSSION
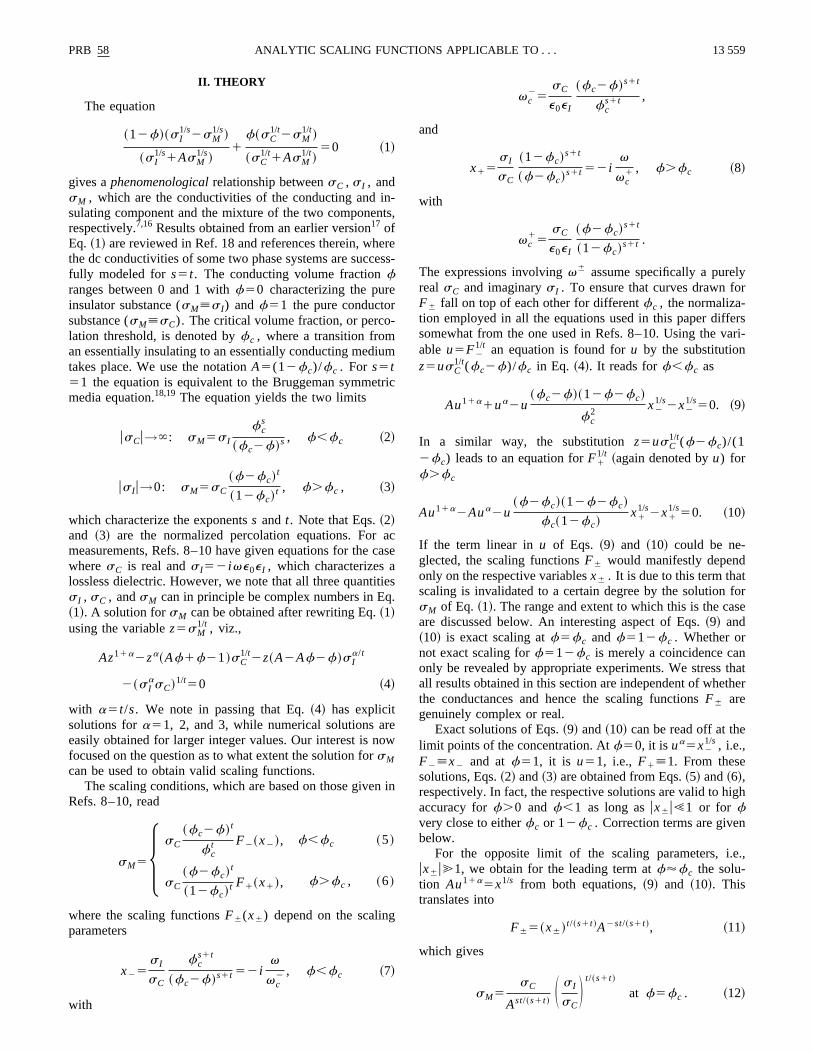
The experimental results for Ree and ResM for the55%G-45%BN powder as a function of frequency betwe1021 and 33106 Hz are given in Figs. 2 and 3. The dispesion results for the three highest-lying curves in Fig. 3 aconducting samples (f.fc) with dispersion free conductivities at low frequencies.8–10 The dielectric constant othese three samples~upper curves in Fig. 2! show a strongdispersion, which should go froms/(s1t)50.47/(0.4714.8)'0.09 atfc to 1/s'2 near tof51. The observedvalues range from 0.1 to 0.33. The dielectric constant for
FIG. 2. A plot of the real part of the dielectric constant againfrequency for a 55%-45% G-BN powder on a log-log scalevarious values off @f50.1309~open circles!, 0.1290~triangles!,0.1272 ~open squares!, 0.1236 ~plus!, 0.1219 ~crosses!, 0.1203~dots!, 0.1187~asterisks!, 0.1171~solid squares!#. These are relativevolume fractions, as the absolute error is about60.001.
-
yreathd
thth
lts
nisg
ou
r
esrerice
nelfon
inctpe
redne-disk
cy,
sur-t
ial
ainshthe
-s
re-
d,ve
, theing-
dc
foralue
fq.
sis
hisnt.
low
e-u
13 562 PRB 58McLACHLAN, HEISS, CHITEME, AND WU
conducting samples (f.fc) will be further discussed below.
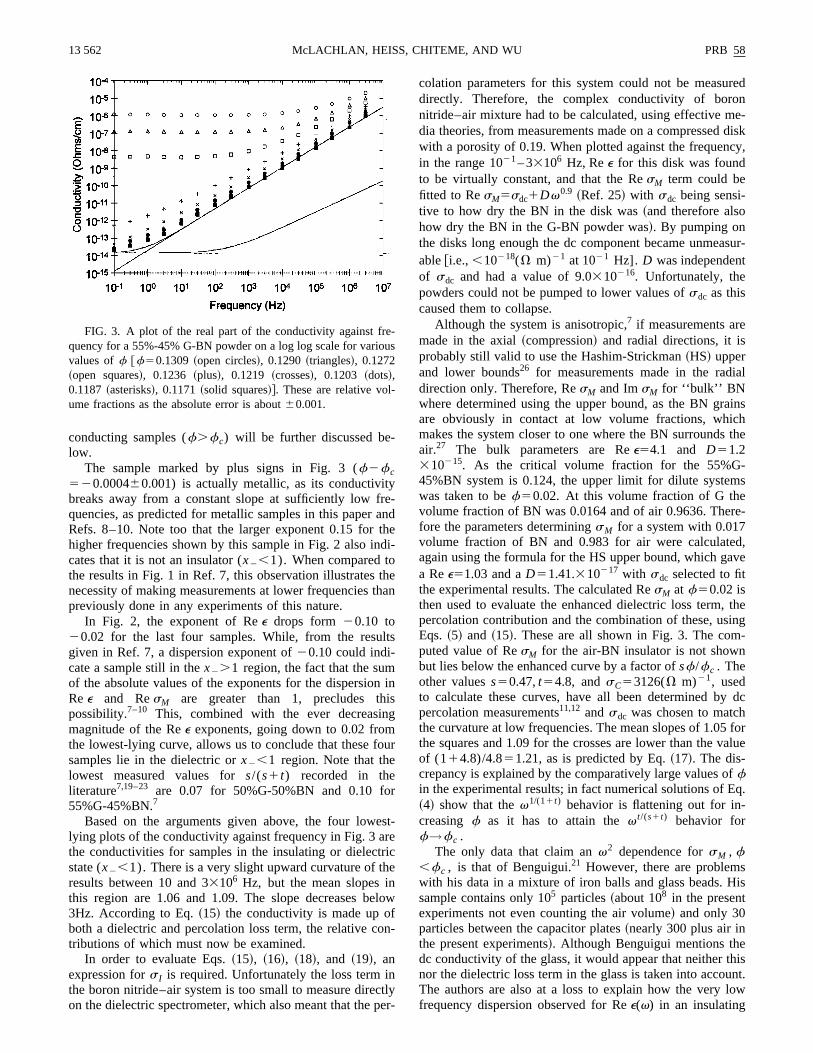
The sample marked by plus signs in Fig. 3 (f2fc520.000460.001) is actually metallic, as its conductivitbreaks away from a constant slope at sufficiently low fquencies, as predicted for metallic samples in this paperRefs. 8–10. Note too that the larger exponent 0.15 forhigher frequencies shown by this sample in Fig. 2 also incates that it is not an insulator (x2,1). When compared tothe results in Fig. 1 in Ref. 7, this observation illustratesnecessity of making measurements at lower frequenciespreviously done in any experiments of this nature.
In Fig. 2, the exponent of Ree drops form 20.10 to20.02 for the last four samples. While, from the resugiven in Ref. 7, a dispersion exponent of20.10 could indi-cate a sample still in thex2.1 region, the fact that the sumof the absolute values of the exponents for the dispersioRee and ResM are greater than 1, precludes thpossibility.7–10 This, combined with the ever decreasinmagnitude of the Ree exponents, going down to 0.02 fromthe lowest-lying curve, allows us to conclude that these fsamples lie in the dielectric orx2,1 region. Note that thelowest measured values fors/(s1t) recorded in theliterature7,19–23 are 0.07 for 50%G-50%BN and 0.10 fo55%G-45%BN.7
Based on the arguments given above, the four lowlying plots of the conductivity against frequency in Fig. 3 athe conductivities for samples in the insulating or dielectstate (x2,1). There is a very slight upward curvature of thresults between 10 and 33106 Hz, but the mean slopes ithis region are 1.06 and 1.09. The slope decreases b3Hz. According to Eq.~15! the conductivity is made up oboth a dielectric and percolation loss term, the relative ctributions of which must now be examined.
In order to evaluate Eqs.~15!, ~16!, ~18!, and ~19!, anexpression fors I is required. Unfortunately the loss termthe boron nitride–air system is too small to measure direon the dielectric spectrometer, which also meant that the
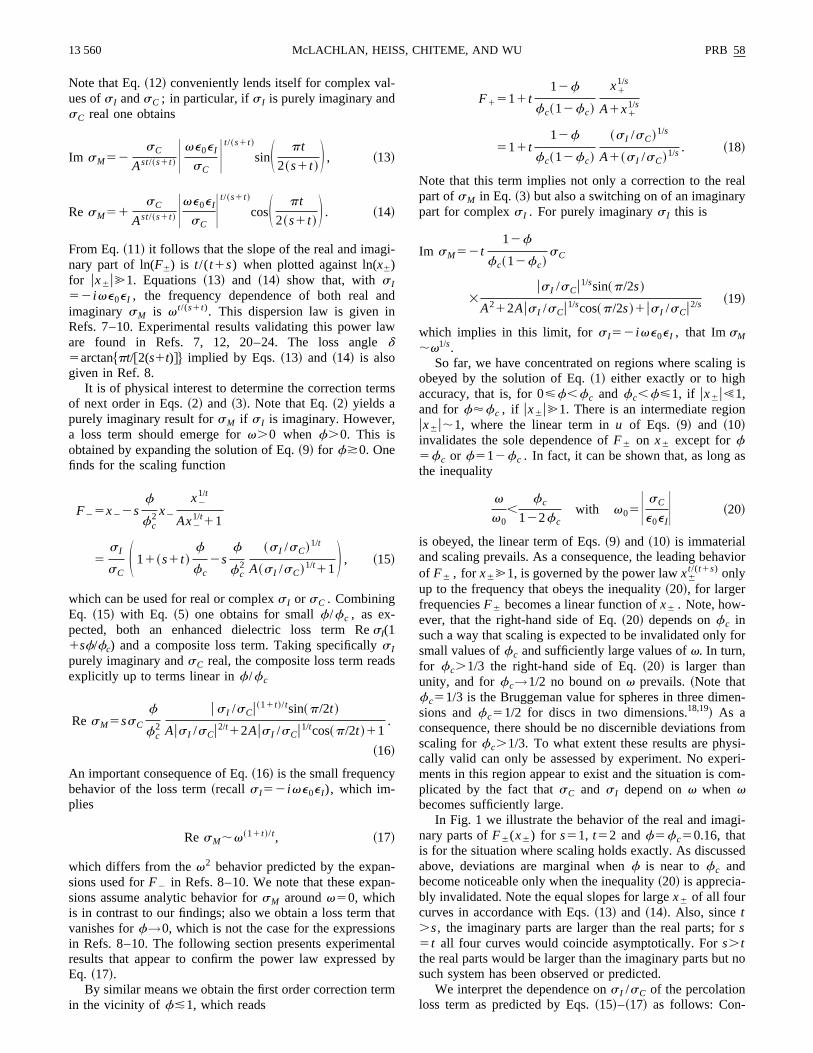
FIG. 3. A plot of the real part of the conductivity against frquency for a 55%-45% G-BN powder on a log log scale for variovalues off @f50.1309~open circles!, 0.1290~triangles!, 0.1272~open squares!, 0.1236 ~plus!, 0.1219 ~crosses!, 0.1203 ~dots!,0.1187~asterisks!, 0.1171~solid squares!#. These are relative vol-ume fractions as the absolute error is about60.001.
-ndei-
ean
in
r
t-
ow
-
lyr-
colation parameters for this system could not be measudirectly. Therefore, the complex conductivity of boronitride–air mixture had to be calculated, using effective mdia theories, from measurements made on a compressedwith a porosity of 0.19. When plotted against the frequenin the range 1021– 33106 Hz, Ree for this disk was foundto be virtually constant, and that the ResM term could befitted to ResM5sdc1Dv0.9 ~Ref. 25! with sdc being sensi-tive to how dry the BN in the disk was~and therefore alsohow dry the BN in the G-BN powder was!. By pumping onthe disks long enough the dc component became [email protected].,,10218(V m)21 at 1021 Hz]. D was independenof sdc and had a value of 9.0310216. Unfortunately, thepowders could not be pumped to lower values ofsdc as thiscaused them to collapse.
Although the system is anisotropic,7 if measurements aremade in the axial~compression! and radial directions, it isprobably still valid to use the Hashim-Strickman~HS! upperand lower bounds26 for measurements made in the raddirection only. Therefore, ResM and ImsM for ‘‘bulk’’ BNwhere determined using the upper bound, as the BN grare obviously in contact at low volume fractions, whicmakes the system closer to one where the BN surroundsair.27 The bulk parameters are Ree54.1 and D51.2310215. As the critical volume fraction for the 55%G45%BN system is 0.124, the upper limit for dilute systemwas taken to bef50.02. At this volume fraction of G thevolume fraction of BN was 0.0164 and of air 0.9636. Thefore the parameters determiningsM for a system with 0.017volume fraction of BN and 0.983 for air were calculateagain using the formula for the HS upper bound, which gaa Ree51.03 and aD51.41.310217 with sdc selected to fitthe experimental results. The calculated ResM at f50.02 isthen used to evaluate the enhanced dielectric loss termpercolation contribution and the combination of these, usEqs. ~5! and ~15!. These are all shown in Fig. 3. The computed value of ResM for the air-BN insulator is not shownbut lies below the enhanced curve by a factor ofsf/fc . Theother valuess50.47,t54.8, andsC53126(V m)21, usedto calculate these curves, have all been determined bypercolation measurements11,12 andsdc was chosen to matchthe curvature at low frequencies. The mean slopes of 1.05the squares and 1.09 for the crosses are lower than the vof (114.8)/4.851.21, as is predicted by Eq.~17!. The dis-crepancy is explained by the comparatively large values ofin the experimental results; in fact numerical solutions of E~4! show that thev1/(11t) behavior is flattening out for in-creasing f as it has to attain thev t/(s1t) behavior forf→fc .
The only data that claim anv2 dependence forsM , f,fc , is that of Benguigui.21 However, there are problemwith his data in a mixture of iron balls and glass beads. Hsample contains only 105 particles~about 108 in the presentexperiments not even counting the air volume! and only 30particles between the capacitor plates~nearly 300 plus air inthe present experiments!. Although Benguigui mentions thedc conductivity of the glass, it would appear that neither tnor the dielectric loss term in the glass is taken into accouThe authors are also at a loss to explain how the veryfrequency dispersion observed for Ree(v) in an insulating
s
le
re
e
in
rein
re-
ta
ete
e
eoeula
e
be-rect
tedkel
mre-
tefsted
k-s
eram-w
emelyex-n-
e
ical-
ing
rs
PRB 58 13 563ANALYTIC SCALING FUNCTIONS APPLICABLE TO . . .
20.0% iron balls sample~Fig. 2 in Ref. 21! can give aRee(v)v;Im sM(v) which varies asv2 when plottedagainst the frequency~Fig. 8 in Ref. 21!. Therefore we donot regard these experiments as definitive.
In Fig. 2 the dielectric results for the conducting sampare terminated at 1 kHz as for lower frequencies tand ex-ceeds 103 and the dielectric spectrometer gives spurioussults. However, the results at 1 kHz~a frequency commonlyused in low frequency experiments to measure Ree) clearlyshow that Ree continues to increase withf below and abovefc . This is in sharp disagreement with the predictions givin Refs. 8–10, where it is claimed that Ree should decreaseas (f2fc)
2s for f.fc .The smooth behavior of Ree as a function off passing
and extending beyondfc has also recently been observedcarbon black-polyethylene composites18 and a number ofsystems where various fine conducting powders are impnated onto the surface of almost spherical insulator grabefore the coated grains are compressed into a thdimensional continuum.19. Therefore there is now strong experimental evidence that the second order term forf.fcgiven in Refs. 8–10 is in disagreement with experimenevidence. Their second-order percolation term also failsvanish forf→1 in contrast to our result in Eq.~18!.
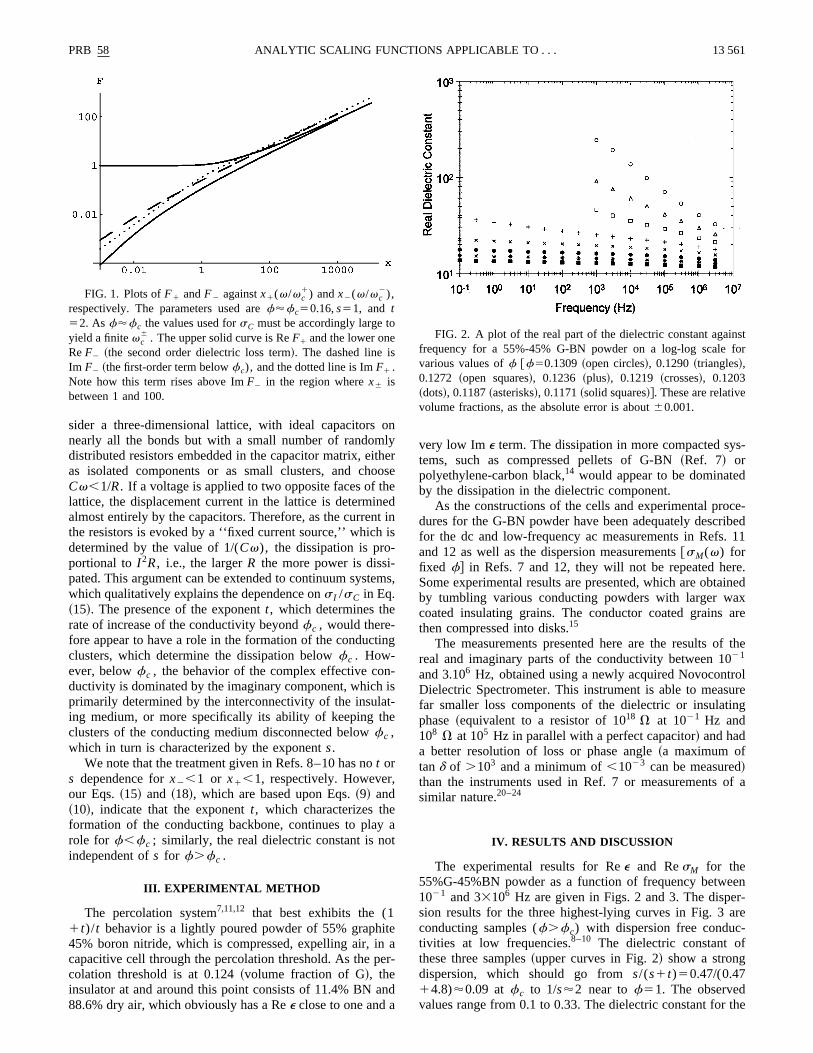
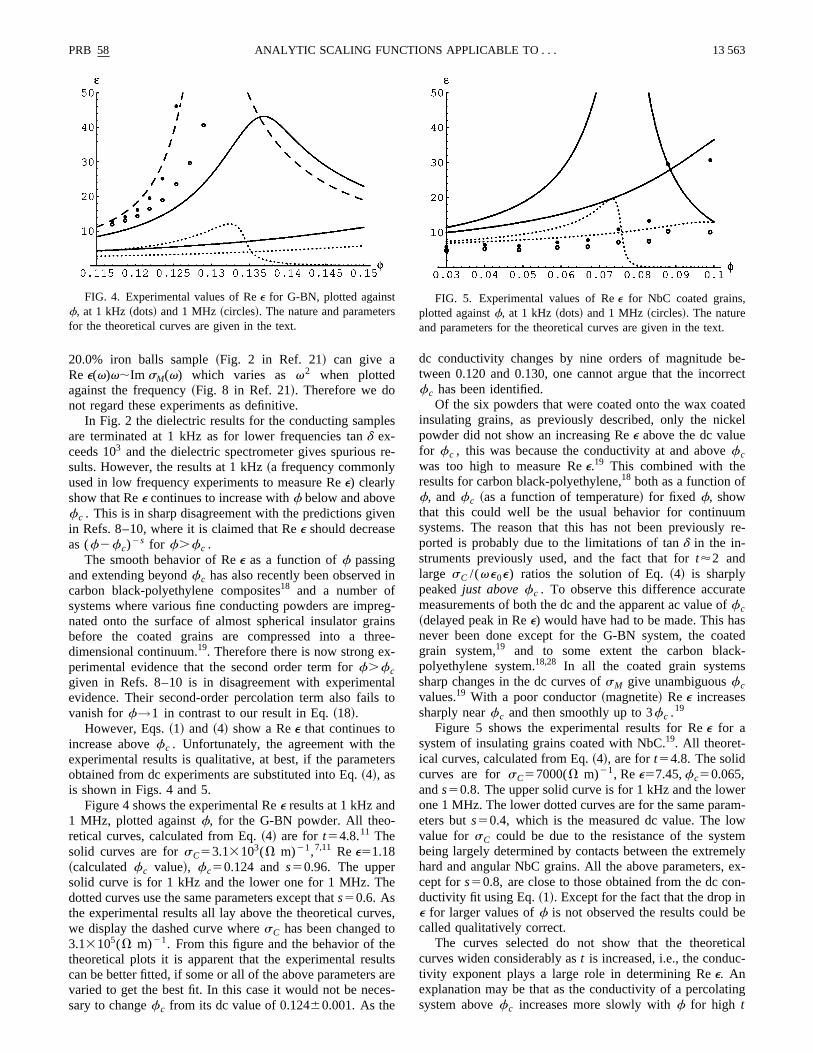
However, Eqs.~1! and ~4! show a Ree that continues toincrease abovefc . Unfortunately, the agreement with thexperimental results is qualitative, at best, if the parameobtained from dc experiments are substituted into Eq.~4!, asis shown in Figs. 4 and 5.
Figure 4 shows the experimental Ree results at 1 kHz and1 MHz, plotted againstf, for the G-BN powder. All theo-retical curves, calculated from Eq.~4! are for t54.8.11 Thesolid curves are forsC53.13103(V m)21,7,11 Ree51.18~calculatedfc value!, fc50.124 ands50.96. The uppersolid curve is for 1 kHz and the lower one for 1 MHz. Thdotted curves use the same parameters except thats50.6. Asthe experimental results all lay above the theoretical curvwe display the dashed curve wheresC has been changed t3.13105(V m)21. From this figure and the behavior of ththeoretical plots it is apparent that the experimental rescan be better fitted, if some or all of the above parametersvaried to get the best fit. In this case it would not be necsary to changefc from its dc value of 0.12460.001. As the
FIG. 4. Experimental values of Ree for G-BN, plotted againstf, at 1 kHz~dots! and 1 MHz~circles!. The nature and parametefor the theoretical curves are given in the text.
s
-
n
g-se-
lto
rs
s,
tsre
s-
dc conductivity changes by nine orders of magnitudetween 0.120 and 0.130, one cannot argue that the incorfc has been identified.
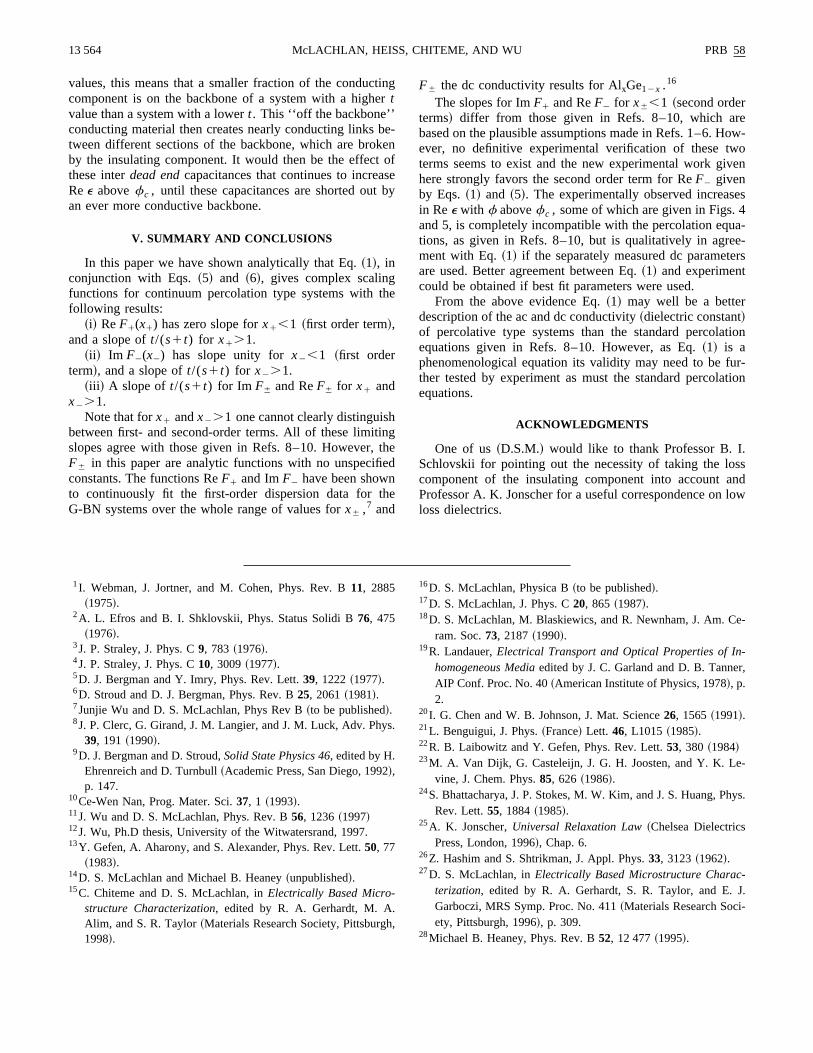
Of the six powders that were coated onto the wax coainsulating grains, as previously described, only the nicpowder did not show an increasing Ree above the dc valuefor fc , this was because the conductivity at and abovefcwas too high to measure Ree.19 This combined with theresults for carbon black-polyethylene,18 both as a function off, andfc ~as a function of temperature! for fixed f, showthat this could well be the usual behavior for continuusystems. The reason that this has not been previouslyported is probably due to the limitations of tand in the in-struments previously used, and the fact that fort'2 andlarge sC /(ve0e) ratios the solution of Eq.~4! is sharplypeakedjust abovefc . To observe this difference accurameasurements of both the dc and the apparent ac value ofc~delayed peak in Ree) would have had to be made. This hanever been done except for the G-BN system, the coagrain system,19 and to some extent the carbon blacpolyethylene system.18,28 In all the coated grain systemsharp changes in the dc curves ofsM give unambiguousfcvalues.19 With a poor conductor~magnetite! Ree increasessharply nearfc and then smoothly up to 3fc .19
Figure 5 shows the experimental results for Ree for asystem of insulating grains coated with NbC.19. All theoret-ical curves, calculated from Eq.~4!, are fort54.8. The solidcurves are forsC57000(V m)21, Ree57.45,fc50.065,ands50.8. The upper solid curve is for 1 kHz and the lowone 1 MHz. The lower dotted curves are for the same pareters buts50.4, which is the measured dc value. The lovalue for sC could be due to the resistance of the systbeing largely determined by contacts between the extremhard and angular NbC grains. All the above parameters,cept fors50.8, are close to those obtained from the dc coductivity fit using Eq.~1!. Except for the fact that the drop ine for larger values off is not observed the results could bcalled qualitatively correct.
The curves selected do not show that the theoretcurves widen considerably ast is increased, i.e., the conductivity exponent plays a large role in determining Ree. Anexplanation may be that as the conductivity of a percolatsystem abovefc increases more slowly withf for high t
FIG. 5. Experimental values of Ree for NbC coated grains,plotted againstf, at 1 kHz~dots! and 1 MHz~circles!. The natureand parameters for the theoretical curves are given in the text.
tiner
bkeosb
he
hinthed
he
eow-o
ven
es4a-e-
ers
tion
ur-tion
.ssndlow
13 564 PRB 58McLACHLAN, HEISS, CHITEME, AND WU
values, this means that a smaller fraction of the conduccomponent is on the backbone of a system with a hightvalue than a system with a lowert. This ‘‘off the backbone’’conducting material then creates nearly conducting linkstween different sections of the backbone, which are broby the insulating component. It would then be the effectthese interdead endcapacitances that continues to increaRee abovefc , until these capacitances are shorted outan ever more conductive backbone.
V. SUMMARY AND CONCLUSIONS
In this paper we have shown analytically that Eq.~1!, inconjunction with Eqs.~5! and ~6!, gives complex scalingfunctions for continuum percolation type systems with tfollowing results:
~i! ReF1(x1) has zero slope forx1,1 ~first order term!,and a slope oft/(s1t) for x1.1.
~ii ! Im F2(x2) has slope unity forx2,1 ~first orderterm!, and a slope oft/(s1t) for x2.1.
~iii ! A slope of t/(s1t) for Im F6 and ReF6 for x1 andx2.1.
Note that forx1 andx2.1 one cannot clearly distinguisbetween first- and second-order terms. All of these limitslopes agree with those given in Refs. 8–10. However,F6 in this paper are analytic functions with no unspecificonstants. The functions ReF1 and ImF2 have been shownto continuously fit the first-order dispersion data for tG-BN systems over the whole range of values forx6 ,7 and
ys
h,
g
e-nfey
ge
F6 the dc conductivity results for AlxGe12x .16
The slopes for ImF1 and ReF2 for x6,1 ~second orderterms! differ from those given in Refs. 8–10, which arbased on the plausible assumptions made in Refs. 1–6. Hever, no definitive experimental verification of these twterms seems to exist and the new experimental work gihere strongly favors the second order term for ReF2 givenby Eqs.~1! and ~5!. The experimentally observed increasin Ree with f abovefc , some of which are given in Figs.and 5, is completely incompatible with the percolation equtions, as given in Refs. 8–10, but is qualitatively in agrement with Eq.~1! if the separately measured dc parametare used. Better agreement between Eq.~1! and experimentcould be obtained if best fit parameters were used.
From the above evidence Eq.~1! may well be a betterdescription of the ac and dc conductivity~dielectric constant!of percolative type systems than the standard percolaequations given in Refs. 8–10. However, as Eq.~1! is aphenomenological equation its validity may need to be fther tested by experiment as must the standard percolaequations.
ACKNOWLEDGMENTS
One of us~D.S.M.! would like to thank Professor B. ISchlovskii for pointing out the necessity of taking the locomponent of the insulating component into account aProfessor A. K. Jonscher for a useful correspondence onloss dielectrics.
e-
-r,
-
hys.
-J.-
1I. Webman, J. Jortner, and M. Cohen, Phys. Rev. B11, 2885~1975!.
2A. L. Efros and B. I. Shklovskii, Phys. Status Solidi B76, 475~1976!.
3J. P. Straley, J. Phys. C9, 783 ~1976!.4J. P. Straley, J. Phys. C10, 3009~1977!.5D. J. Bergman and Y. Imry, Phys. Rev. Lett.39, 1222~1977!.6D. Stroud and D. J. Bergman, Phys. Rev. B25, 2061~1981!.7Junjie Wu and D. S. McLachlan, Phys Rev B~to be published!.8J. P. Clerc, G. Girand, J. M. Langier, and J. M. Luck, Adv. Ph
39, 191 ~1990!.9D. J. Bergman and D. Stroud,Solid State Physics 46, edited by H.
Ehrenreich and D. Turnbull~Academic Press, San Diego, 1992!,p. 147.
10Ce-Wen Nan, Prog. Mater. Sci.37, 1 ~1993!.11J. Wu and D. S. McLachlan, Phys. Rev. B56, 1236~1997!12J. Wu, Ph.D thesis, University of the Witwatersrand, 1997.13Y. Gefen, A. Aharony, and S. Alexander, Phys. Rev. Lett.50, 77
~1983!.14D. S. McLachlan and Michael B. Heaney~unpublished!.15C. Chiteme and D. S. McLachlan, inElectrically Based Micro-
structure Characterization, edited by R. A. Gerhardt, M. A.Alim, and S. R. Taylor~Materials Research Society, Pittsburg1998!.
.
16D. S. McLachlan, Physica B~to be published!.17D. S. McLachlan, J. Phys. C20, 865 ~1987!.18D. S. McLachlan, M. Blaskiewics, and R. Newnham, J. Am. C
ram. Soc.73, 2187~1990!.19R. Landauer,Electrical Transport and Optical Properties of In
homogeneous Mediaedited by J. C. Garland and D. B. TanneAIP Conf. Proc. No. 40~American Institute of Physics, 1978!, p.2.
20I. G. Chen and W. B. Johnson, J. Mat. Science26, 1565~1991!.21L. Benguigui, J. Phys.~France! Lett. 46, L1015 ~1985!.22R. B. Laibowitz and Y. Gefen, Phys. Rev. Lett.53, 380 ~1984!23M. A. Van Dijk, G. Casteleijn, J. G. H. Joosten, and Y. K. Le
vine, J. Chem. Phys.85, 626 ~1986!.24S. Bhattacharya, J. P. Stokes, M. W. Kim, and J. S. Huang, P
Rev. Lett.55, 1884~1985!.25A. K. Jonscher,Universal Relaxation Law~Chelsea Dielectrics
Press, London, 1996!, Chap. 6.26Z. Hashim and S. Shtrikman, J. Appl. Phys.33, 3123~1962!.27D. S. McLachlan, inElectrically Based Microstructure Charac
terization, edited by R. A. Gerhardt, S. R. Taylor, and E.Garboczi, MRS Symp. Proc. No. 411~Materials Research Society, Pittsburgh, 1996!, p. 309.
28Michael B. Heaney, Phys. Rev. B52, 12 477~1995!.