analytic democracy: spreading the wealth of insights
TRANSCRIPT

Tuesday, August 7, 2012

Twitter Tag: #briefr
Reveal the essential characteristics of enterprise software, good and bad
Provide a forum for detailed analysis of today’s innovative technologies
Give vendors a chance to explain their product to savvy analysts
Allow audience members to pose serious questions... and get answers!
Mission
Tuesday, August 7, 2012
Twitter Tag: #briefr
August: Analytics
September: Integration
October: Database
November: Cloud
December: Innovators
August: Analytics
Tuesday, August 7, 2012
Twitter Tag: #briefr
Analytics has always been about discovering insights that lead to better business decisions.
Organizations can be challenged by the complexity of information management as they try to leverage analytics against disparate sources.
A growing number of vendors are offering robust visualization tools to help customers quickly and easily perform analytics against data from any source, from any device.
Analytics
Tuesday, August 7, 2012
Twitter Tag: #briefr
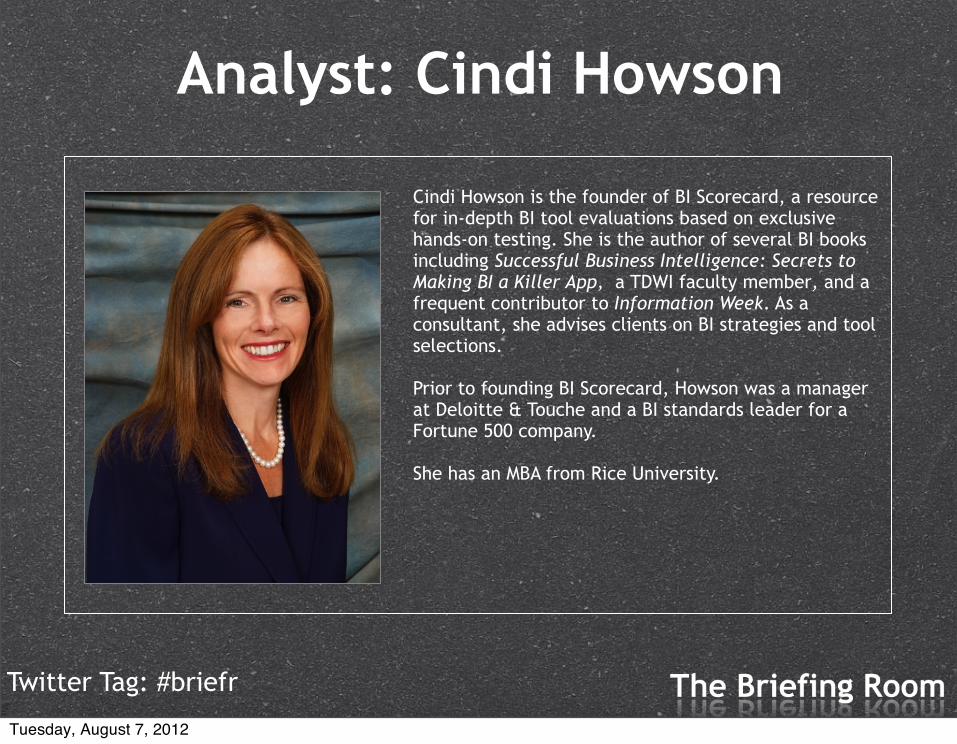
Analyst: Cindi Howson Cindi Howson is the founder of BI Scorecard, a resource for in-depth BI tool evaluations based on exclusive hands-on testing. She is the author of several BI books including Successful Business Intelligence: Secrets to Making BI a Killer App, a TDWI faculty member, and a frequent contributor to Information Week. As a consultant, she advises clients on BI strategies and tool selections.
Prior to founding BI Scorecard, Howson was a manager at Deloitte & Touche and a BI standards leader for a Fortune 500 company.
She has an MBA from Rice University.
Tuesday, August 7, 2012

Twitter Tag: #briefr
Tableau builds software for data visualization and rapid-fire business intelligence. Their mission is to help people see and understand data.
Tableau offers a wide variety of data representation possibilites.
Its BI platform fits both power users and casual BI users.
Tableau was recently ranked by Forrester as the #1 Advanced Data Visualization vendor.
Tableau
Tuesday, August 7, 2012
Twitter Tag: #briefr
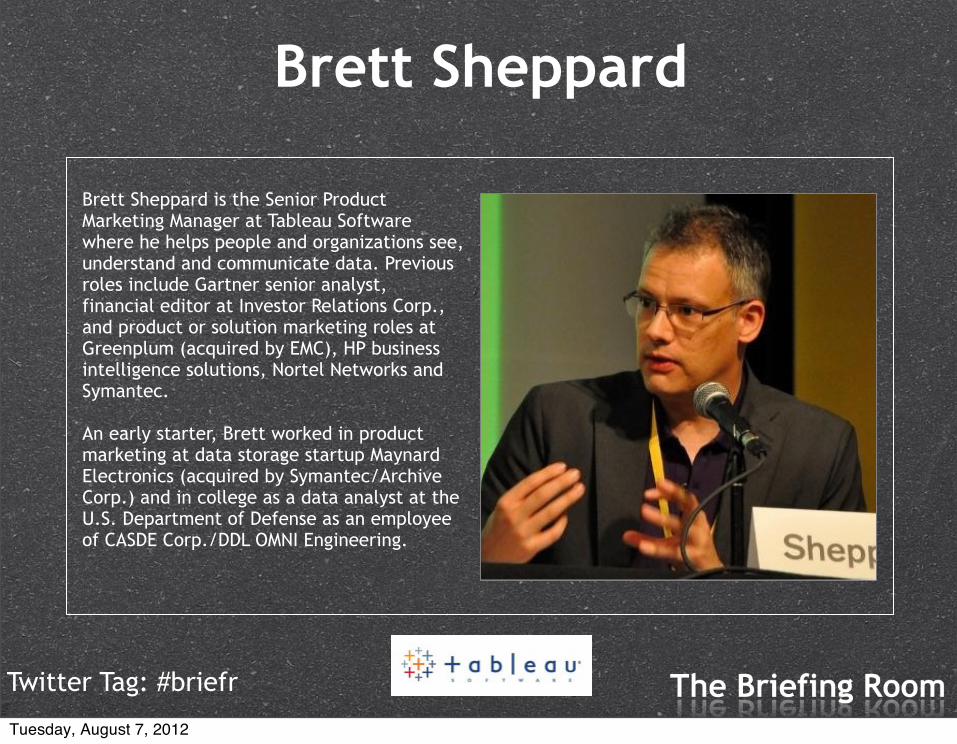
Brett Sheppard is the Senior Product Marketing Manager at Tableau Software where he helps people and organizations see, understand and communicate data. Previous roles include Gartner senior analyst, financial editor at Investor Relations Corp., and product or solution marketing roles at Greenplum (acquired by EMC), HP business intelligence solutions, Nortel Networks and Symantec.
An early starter, Brett worked in product marketing at data storage startup Maynard Electronics (acquired by Symantec/Archive Corp.) and in college as a data analyst at the U.S. Department of Defense as an employee of CASDE Corp./DDL OMNI Engineering.
Brett Sheppard
Tuesday, August 7, 2012
Bloor Group Briefing RoomAugust 7, 2012
Tuesday, August 7, 2012

Where we started…
Tuesday, August 7, 2012
Help peopletheir data
see and understand
Tuesday, August 7, 2012
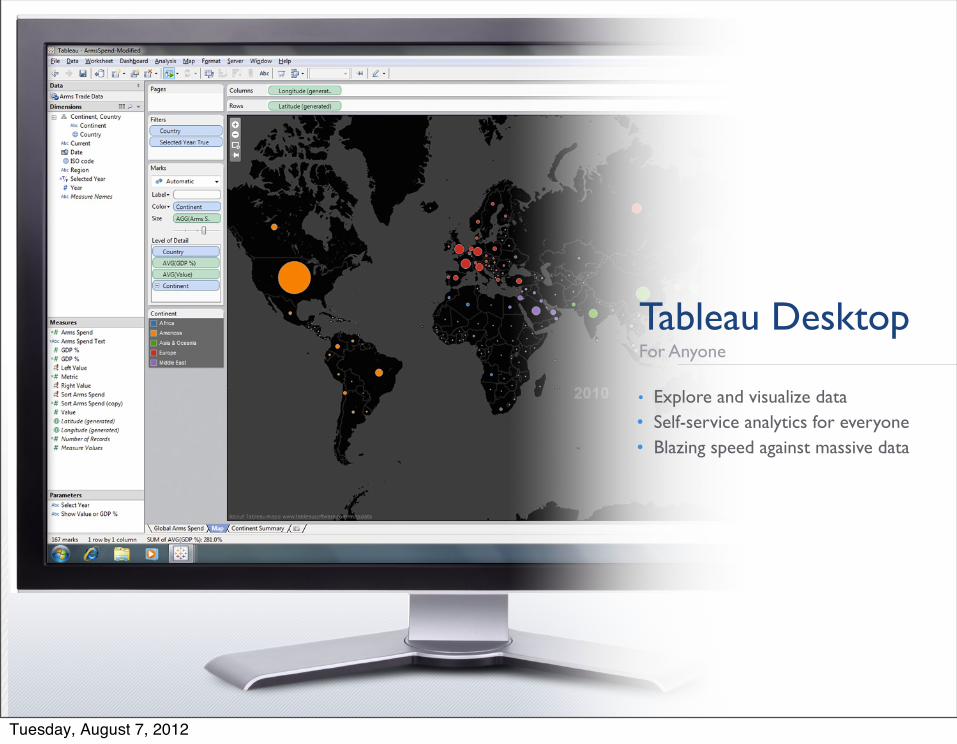
Tableau DesktopFor Anyone
• Explore and visualize data• Self-service analytics for everyone• Blazing speed against massive data
Tuesday, August 7, 2012

Tableau ServerFor Organizations
• An easy business intelligence system• Web dashboards and applications• Secure information management• Enterprise scalability
Tuesday, August 7, 2012

Any Data…
DATABASES AND CUBES
DATA WAREHOUSE
“BIG DATA”
FILES & SPREADSHEETS
Tuesday, August 7, 2012
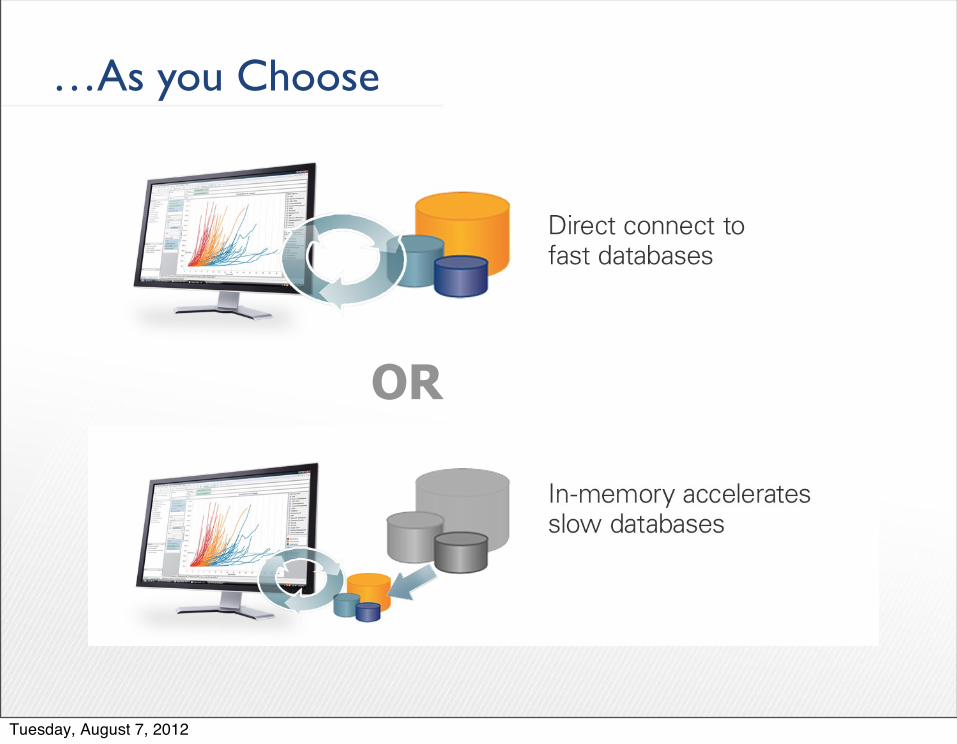
OR
…As you Choose
Tuesday, August 7, 2012

Author Once Experience for Mobile
Tuesday, August 7, 2012
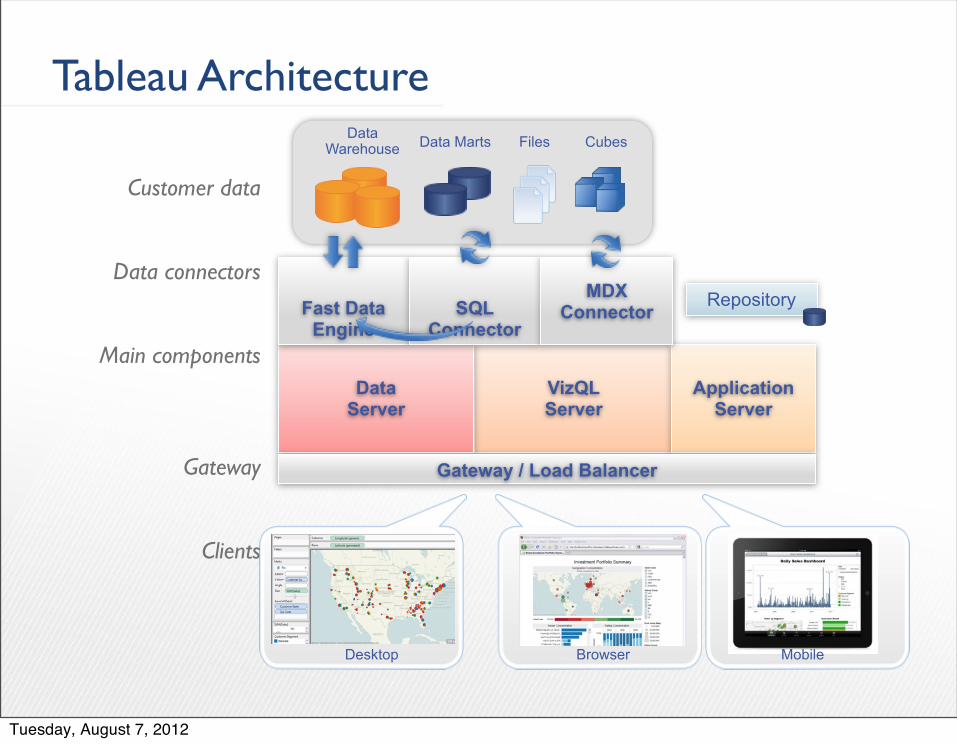
VizQLServer
DataServer
Application Server
Fast Data Engine
SQL Connector
MDX Connector
Data MartsData Warehouse Files Cubes
Gateway / Load Balancer
Repository
Customer data
Data connectors
Main components
Gateway
Clients
Desktop Browser Mobile
Tableau Architecture
Tuesday, August 7, 2012

What Customers Say
18
Tuesday, August 7, 2012

Demo
Tuesday, August 7, 2012

Twitter Tag: #briefr
Analyst: Cindi Howson
Perceptions & Questions
Tuesday, August 7, 2012

21
Analytic Democracy: Spreading the Wealth of Insight
Cindi HowsonFounder, BI Scorecard
Contact: [email protected]: BIScorecard
Tuesday, August 7, 2012

Visual Data Discovery Defined
22
Visual Data Discovery tools speed the time to insight through the use of visualizations, best practices in visual perception, and easy exploration. Such tools support business agility and self-service BI through a variety of innovations that may include in-memory processing and mashing of multiple data sources.
Tuesday, August 7, 2012

Business Users Are Excited About BI
23
Visual Data Discovery Drivers
Tuesday, August 7, 2012

Business Users Are Excited About BI
23
Visual Data Discovery Drivers
Visual Appeal
Tuesday, August 7, 2012

Business Users Are Excited About BI
23
Visual Data Discovery Drivers
Visual Appeal
Ease of Use
Tuesday, August 7, 2012

Business Users Are Excited About BI
23
Visual Data Discovery Drivers
Visual Appeal
Ease of Use
Freedom from IT
Tuesday, August 7, 2012

Business Users Are Excited About BI
23
Visual Data Discovery Drivers
Visual Appeal
Ease of Use
Freedom from IT
Social data
Tuesday, August 7, 2012
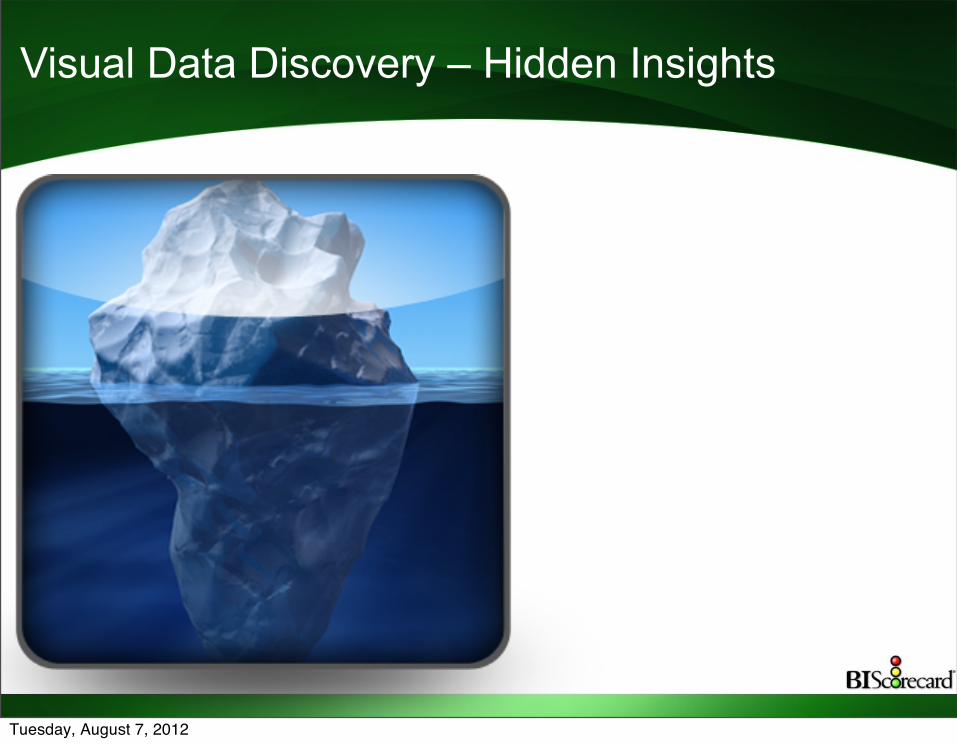
Visual Data Discovery – Hidden Insights
Tuesday, August 7, 2012

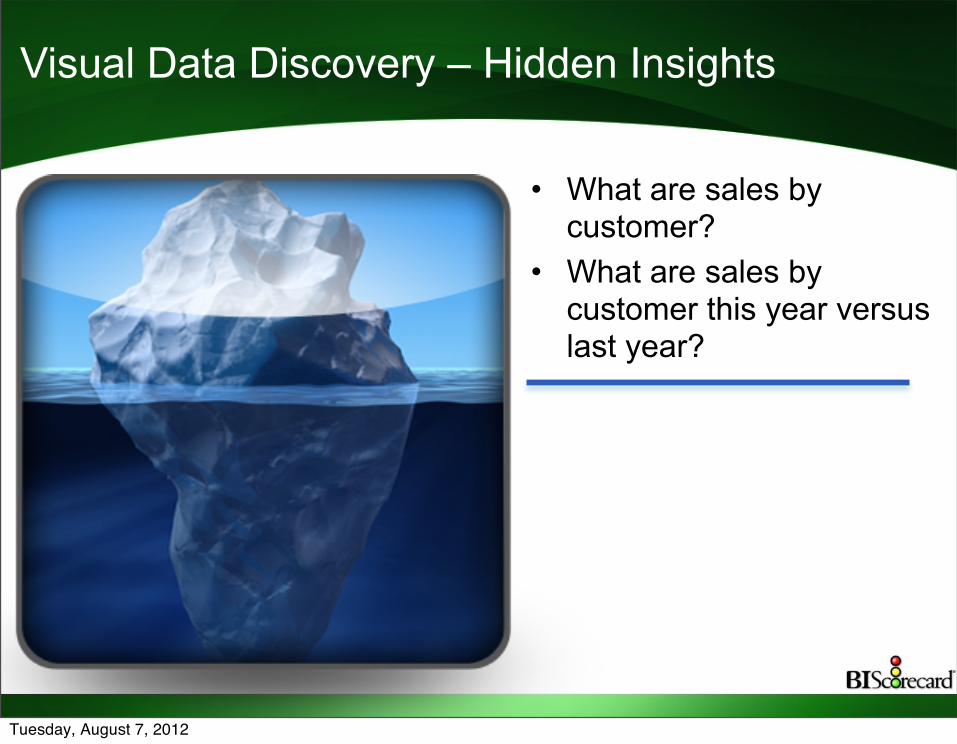
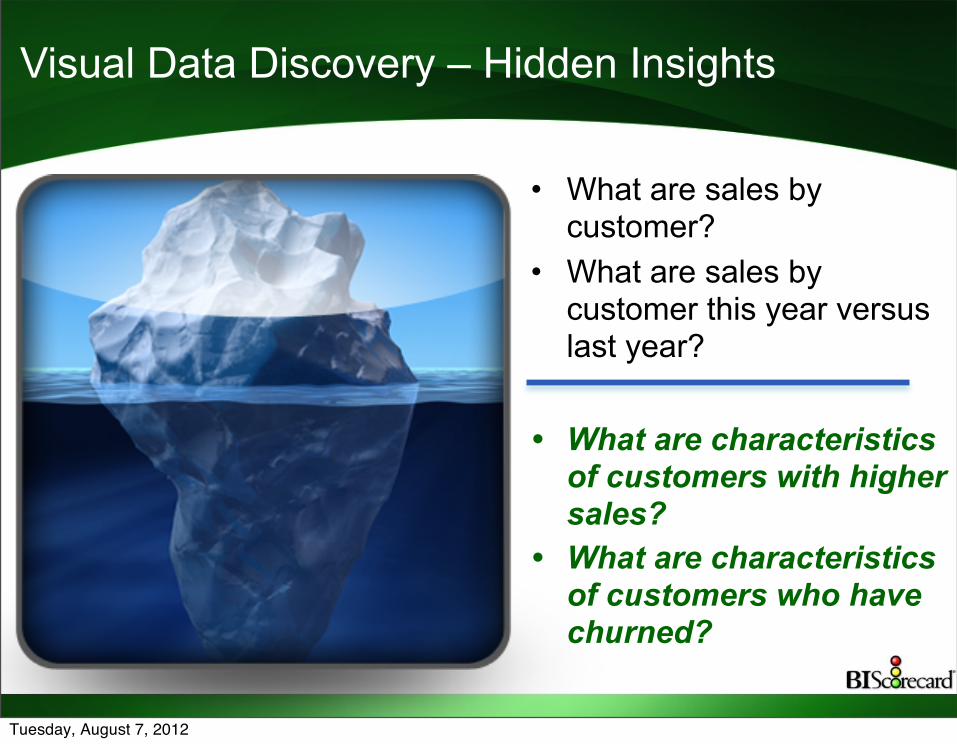
Visual Data Discovery – Hidden Insights
• What are sales by customer?
• What are sales by customer this year versus last year?
Tuesday, August 7, 2012
Visual Data Discovery – Hidden Insights
• What are sales by customer?
• What are sales by customer this year versus last year?
Tuesday, August 7, 2012
Visual Data Discovery – Hidden Insights
• What are sales by customer?
• What are sales by customer this year versus last year?
• What are characteristics of customers with higher sales?
• What are characteristics of customers who have churned?
Tuesday, August 7, 2012
25
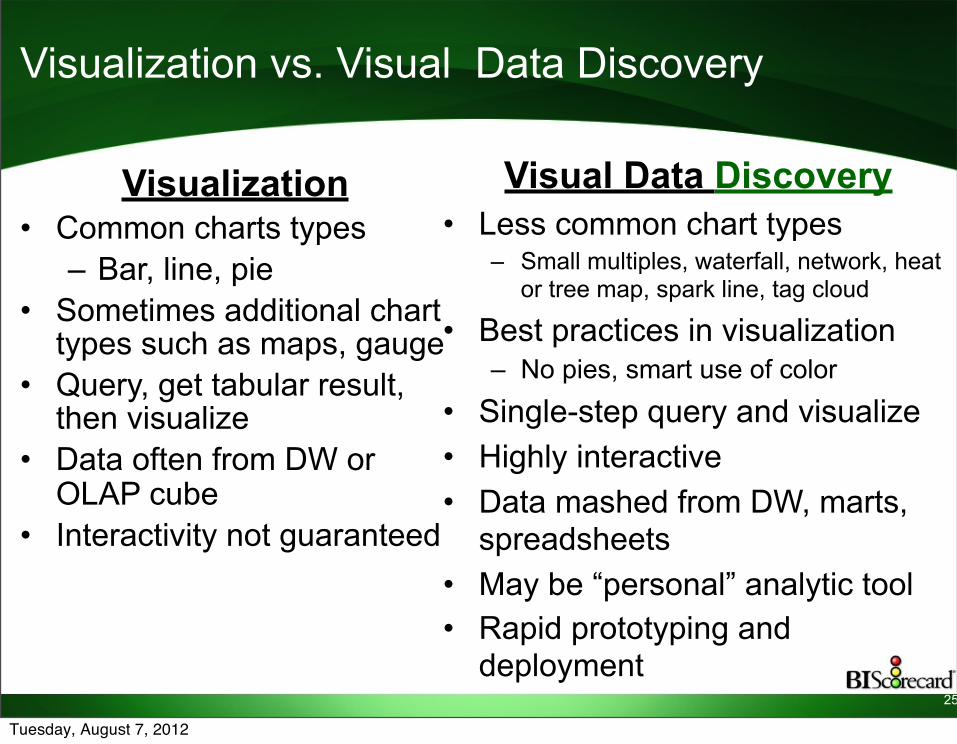
Visualization vs. Visual Data Discovery
Visualization• Common charts types
– Bar, line, pie• Sometimes additional chart
types such as maps, gauge• Query, get tabular result,
then visualize• Data often from DW or
OLAP cube• Interactivity not guaranteed
Visual Data Discovery• Less common chart types
– Small multiples, waterfall, network, heat or tree map, spark line, tag cloud
• Best practices in visualization– No pies, smart use of color
• Single-step query and visualize• Highly interactive• Data mashed from DW, marts,
spreadsheets• May be “personal” analytic tool• Rapid prototyping and
deployment
Tuesday, August 7, 2012

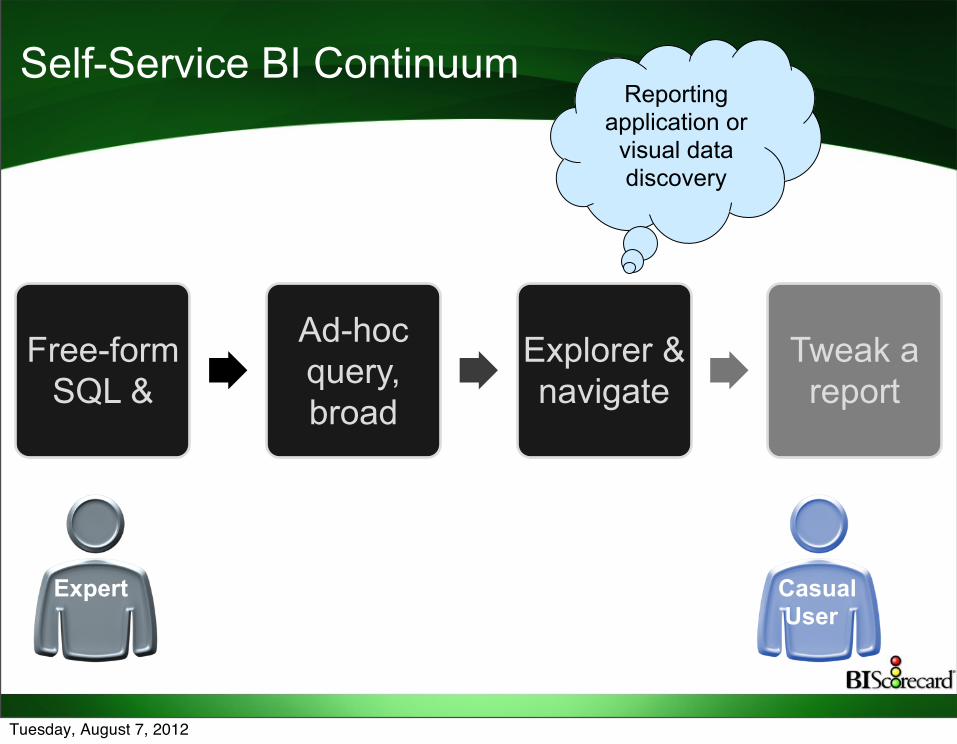
Self-Service BI Continuum
Tuesday, August 7, 2012

Self-Service BI Continuum
Free-form SQL &
Ad-hoc query, broad
Explorer & navigate
Tweak a report
Tuesday, August 7, 2012

Self-Service BI Continuum
Free-form SQL &
Ad-hoc query, broad
Explorer & navigate
Tweak a report
Reporting application or
visual data discovery
Tuesday, August 7, 2012

Self-Service BI Continuum
Free-form SQL &
Ad-hoc query, broad
Explorer & navigate
Tweak a report
Reporting application or
visual data discovery
Casual User
Tuesday, August 7, 2012
Self-Service BI Continuum
Free-form SQL &
Ad-hoc query, broad
Explorer & navigate
Tweak a report
Reporting application or
visual data discovery
Casual User
Expert
Tuesday, August 7, 2012

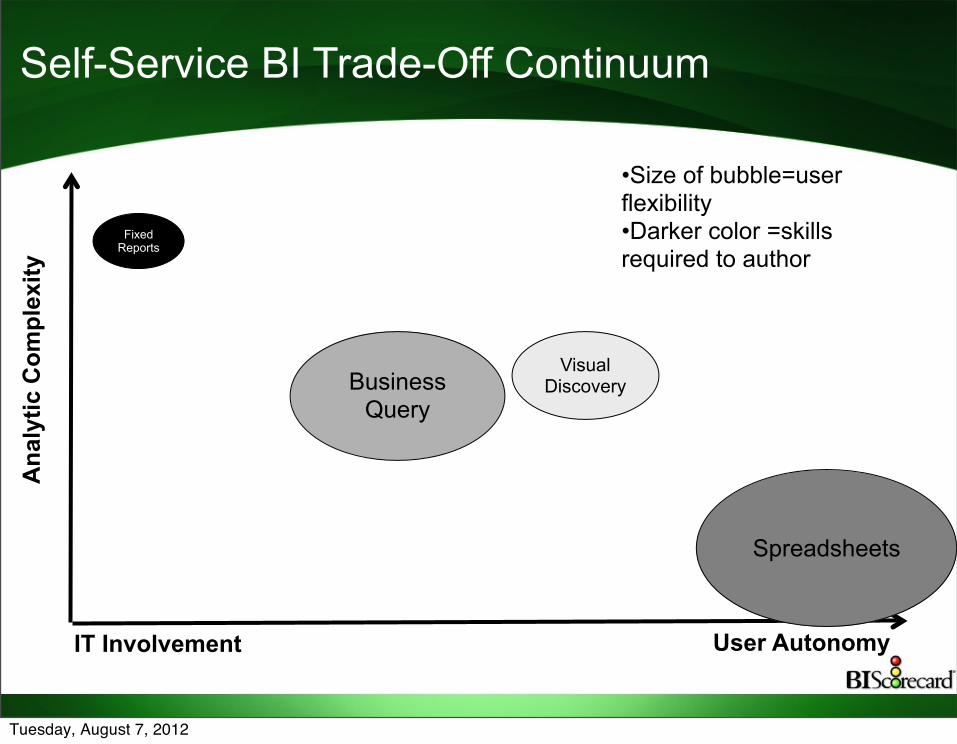
Self-Service BI Trade-Off Continuum
IT Involvement User Autonomy
Ana
lytic
Com
plex
ity
•Size of bubble=user flexibility•Darker color =skills required to author
Tuesday, August 7, 2012

Self-Service BI Trade-Off Continuum
IT Involvement User Autonomy
Ana
lytic
Com
plex
ity
Fixed Reports
•Size of bubble=user flexibility•Darker color =skills required to author
Tuesday, August 7, 2012

Self-Service BI Trade-Off Continuum
IT Involvement User Autonomy
Ana
lytic
Com
plex
ity
Fixed Reports
Spreadsheets
•Size of bubble=user flexibility•Darker color =skills required to author
Tuesday, August 7, 2012

Self-Service BI Trade-Off Continuum
IT Involvement User Autonomy
Ana
lytic
Com
plex
ity
Fixed Reports
Spreadsheets
Business Query
•Size of bubble=user flexibility•Darker color =skills required to author
Tuesday, August 7, 2012
Self-Service BI Trade-Off Continuum
IT Involvement User Autonomy
Ana
lytic
Com
plex
ity
Fixed Reports
Spreadsheets
Business Query
Visual Discovery
•Size of bubble=user flexibility•Darker color =skills required to author
Tuesday, August 7, 2012

Twitter Tag: #briefr
Tuesday, August 7, 2012
Twitter Tag: #briefr
August: Analytics
September: Integration
October: Database
November: Cloud
December: Innovators
Upcoming Topics
Tuesday, August 7, 2012

Twitter Tag: #briefr
Tuesday, August 7, 2012