analyst presentation may10 for screen.ppt … the group is on the standardised approach in terms of...
TRANSCRIPT

Results presentationFor the year ended
31 I 03 I 2010
Snapshot of the year
2

Improved operating environment
160
Strong rise in equity markets
Equity indices Interest rates
Stable interest rate environment
10
120
140
160
100 6
8
10
80
100
120
Reb
ased
to 1 +/-42%
0
2
4%
80
Mar-09 May-09 Jul-09 Sep-09 Nov-09 Jan-10 Mar-10
JSE FTSE ASX
Mixed exchange rate environment
0
Mar-09 May-09 Jul-09 Sep-09 Nov-09 Jan-10 Mar-10
JIBAR-3M LIBOR-3M AUSIB-3M USIB-3M
Euro/£Rand/£ A$/£
14.0
15.0
1.16
1.20
2.00
2.20
11.0
12.0
13.0
1.04
1.08
1.12
1.60
1.80
Source: Datastream, 3
10.0
Mar-09 May-09 Jul-09 Sep-09 Nov-09 Jan-10 Mar-10
1.00
Mar-09 May-09 Jul-09 Sep-09 Nov-09 Jan-10 Mar-10
1.40
Mar-09 May-09 Jul-09 Sep-09 Nov-09 Jan-10 Mar-10
Strength post the crisis
• Investec’s strength during and post the financial crisis coupled with g g p pcontinued investment in the brand has paid off.
4

Strengthened our capital position …
Capital adequacy and Tier 1 ratios Capital adequacy
31 Mar-10Capital
adequacy ratio
Tier 1 ratio 3000
3500
25
30Basel IIBasel I
ratio
Investec Limited 15.6% 12.1%
2000
250020
Investec Bank Limited 15.5% 11.7%
Investec plc 15.9% 11.3%
1000
1500
10
15
(£'m
n)
(%)
Investec Bank plc 16.9% 12.3%
Investec Bank (Australia) 19 2% 16 6% 0
500
1000
0
5
Limited19.2% 16.6% 00
Mar-05 Mar-06 Mar-07 Mar-08 Mar-09 Mar-10
Total shareholders’ equity
Investec Limited capital adequacy
5Note: The group is on the standardised approach in terms of Basel II and as a result has higher RWA than banks applying the advanced approach to similar portfolios, thus understating capital ratios
Investec plc capital adequacy
… and enhanced liquidity …
Surplus cash and near cash
9,000
10,000 Max: £9.3 bn
7,000
8,000
n
Ave: £6.4 bn
5,000
6,000 £'m
n
Min: £4.3 bn
3,000
4,000
Mar-09 May-09 Jul-09 Sep-09 Nov-09 Jan-10 Mar-10
Total 31 Mar-10 £9.1 bn
Investec Limited £4.4 bn
Investec plc £4.7 bn
6
p

… through building customer deposits
Customer accounts (deposits)
21.9
20
25 Up 51`%• Focused effort to diversify our deposit base
• Additional customer deposits raised across th th £7 3b
12.1
14.615
bn
the group over the year was £7.3bn
6.5
8.7
10.710
£‘
0
5
2005 2006 2007 2008 2009 20102005 2006 2007 2008 2009 2010
7
Significant growth in assets under management
Third party assets under management1%
60
70
80£73.6bnUp 51%Asset Management
• Record net inflows of £4.7bn for the year
40
50
60
£'bn
Private Wealth*
• Offer to purchase Rensburg Sheppards plc in the UK
10
20
30plc in the UK
o Shareholder vote and scheme meeting on 1 June 2010
o Court approval and implementation
0
10
2005 2006 2007 2008 2009 2010
Asset Management
o Court approval and implementation on 25 June 2010
• Consolidating our wealth management Asset Management
Private Wealth
Private Banking
Property Activities
Australia Private Equity and Capital Markets
g gbusinesses globally
q y p
8*Formerly Private Client Portfolio Management & Stockbroking

Impairments and defaults up but peaking
Defaults and core loans
• The slower pace of economic recovery has caused a delay in the improvement of non-performing loans
204%3.98%
17.9
• We have, however, seen an improvement towards the end of the financial year 10
15
2%
3%
n
51%
2%
£'b
1.16%
N t d f lt (b f ll t l) % f l
00%
Mar-05 Mar-06 Mar-07 Mar-08 Mar-09 Mar-10
Net defaults (before collateral) as a % of core loans and advances (lhs)
Credit loss ratio (lhs)
Net core loans (rhs)
9
Delivered a stable performance
Mar 10 Mar 09 % ChangeMar-10 Mar-09 % Change
Operating profit* before tax (£’000) 432 258 396 766 8.9%
Operating profit* before tax and impairment losses on loans and advances (£’000)
718 839 652 939 10.1%
Attributable earnings* (£’000) 309 710 269 215 15 0%Attributable earnings (£ 000) 309 710 269 215 15.0%
Adjusted EPS* (pence) 45.1 42.4 6.4%
DPS (pence) 16.0 13.0 23.1%
Net tangible asset value per share (pence) 324.1 266.3 21.7%
Core loans and advances to customers (£’bn) 17.9 16.2 10.2%
10*Before goodwill and non-operating items and after minorities

… ROE and EPS targets difficult to achieve in this environmentFinancial targets
ROE Dividend cover (Target: > 20%) (Target: 1.7 – 3.5 times)
Mar-10
13 5%Mar-09
14 8%Mar-10
2 8xMar-09
3 3x
Adjusted* EPS growth (Target: 10%> UK RPI)
Capital adequacy(Target : 14 17%)
13.5% 14.8% 2.8x 3.3x
(Target: 10%> UK RPI) (Target : 14-17%)
Mar-106.4%
Mar-09-25.5%
Mar-10Ltd: 15.6%Plc: 15.9%
Mar-09Ltd: 14.2%Plc: 16.2%
Cost to income(Target: <65%)
Plc: 15.9% Plc: 16.2%
Note: The original targets were disclosed in May 2004 and are medium to long-term targets. We aim to achieve them through varying market conditions. The capital adequacy and dividend cover targets were revised in November 2008
Mar-1057.8%
Mar-0955.9%
11*As determined in accordance with IFRS. Adjusted EPS is before goodwill, non-operating items and after the accrual of dividends attributable to perpetual preference shareholders;
November 2008.
Business modelBusiness model review
12

Strategic focus to build recurring revenue base
Total operating income*
1,657mn
1400
1600
1800
Operating income from associates
1000
1200
1400
n
Principal transactions
600
800
£'m
n
Net fees and commissions income
0
200
400
Net interest income
0
Mar-06 Mar-07 Mar-08 Mar-09 Mar-10
65% 60%57% 59% 70%Recurring income as a % of total income
13*Net of insurance claims
Revised mission statement
FROM: TO:O :
•We strive to be a distinctive •We strive to be a distinctive•We strive to be a distinctive specialist banking group, driven by commitment to our
•We strive to be a distinctive specialist bank and asset manager driven bydriven by commitment to our
core philosophies and values
manager, driven by commitment to our core philosophies and values.values. philosophies and values.
14
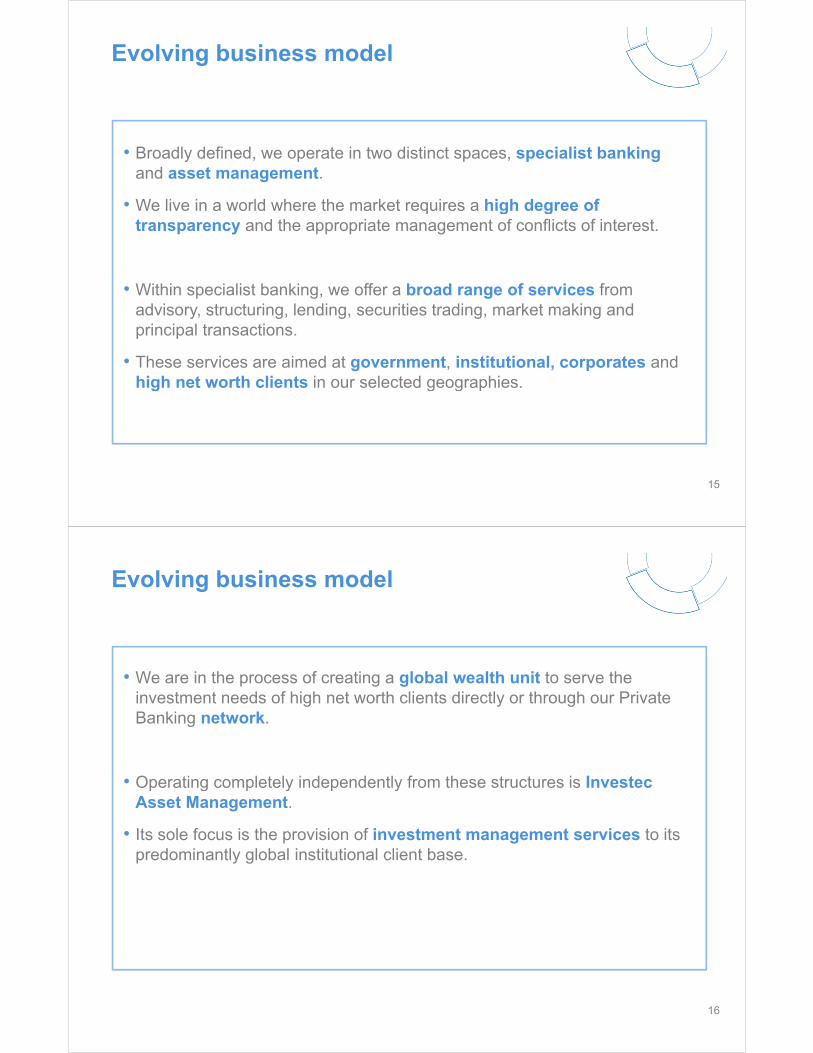
Evolving business model
• Broadly defined, we operate in two distinct spaces, specialist banking and asset management.
• We live in a world where the market requires a high degree of• We live in a world where the market requires a high degree of transparency and the appropriate management of conflicts of interest.
• Within specialist banking, we offer a broad range of services from advisory, structuring, lending, securities trading, market making and principal transactions.
• These services are aimed at government, institutional, corporates and high net worth clients in our selected geographieshigh net worth clients in our selected geographies.
15
Evolving business model
f• We are in the process of creating a global wealth unit to serve the investment needs of high net worth clients directly or through our Private Banking network.
• Operating completely independently from these structures is Investec p g p y p yAsset Management.
• Its sole focus is the provision of investment management services to its d i l l b l i i i l li bpredominantly global institutional client base.
16

Evolving business model
C it l li ht d fid iCapital intensive
Specialist Banking
Capital light and fiduciaryCapital intensive and proprietary
Asset Management
Asset Management
Wealth Management
Market makingPrincipal transactionsAdvisory
LendingStructured
transactionsTransactional
banking Specialist funds
• Build third party funds under management
• Clear differentiation of markets and products
• Grow loan portfolio
• Increase customer depositsClear differentiation of markets and products
• Separation of banking and non-banking operations
Increase customer deposits
• Price risk
Operational reviewp
18

Divisional performance
Operating profit* by business for 31 Mar-10
GroupS i
AssetManagement
19.3%
Services & Other
7.3%
Private Wealth^
6.0%
Property Activities,
7 7%
CapitalMarkets41.4%
£432mn
7.7%
PrivateBanking,
8.6%Investment Banking
9 6%9.6%
•Before goodwill, non-operating items, taxation and before minorities^Formerly Private Client Portfolio Management & Stockbroking 19
(19.3% of group)Asset Management
%
(15.4% of group total)
Overview of performance(£) Mar-10 Mar-09
% change
Operating profit* (mn) 83.4 66.2 26.0%• Key focus remains investment performance
which is competitive
p
Assets under management (bn)
46.4 28.8 60.9%• Record assets under management of £46bn and record net flows of £4.7bn
Cost to income 66.6% 66.9%
ROE (pre-tax)** 53.0% 41.4%
• Experienced and stable team supported by a clear organisational culture and business structure
20*Before goodwill, non-operating items, taxation and after minorities
**Return on adjusted shareholders’ equity (including goodwill and CCD’s)

Asset Management
Outlook
• Our long term strategy remains unchanged and we are committed to managing our clients’ money to the highest standard possible
• We now have a wide distribution footprint and seven distinct and scaleable investment capabilitiescapabilities
• Business and earnings momentum is positive
• Continue our strategy of scale, reinforcing our position as an independent pure play asset managermanager
21
(6.0% of group)Private Wealth(formerly Private Client Portfolio Management & Stockbroking)
% Overview of performanceMar-10 Mar-09 change
Operating profit* (£’mn) 25.9 24.1 7.4%• Private Client business in South Africa marginally up as a result of the lower levels f ti it ff tti th hi h f d d
p
Funds under management^ (£’bn)
22.5 16.3 38.2%
SA Funds under 113 0 85 0 33 0%
of activity offsetting the higher funds under management
management (R’bn)113.0 85.0 33.0%
Cost to income (excluding income from 64.6% 64.7%
• The UK results include Investec’s 47.3% share of the directors’ estimate of the post-tax profit of Rensburg Sheppards
associates)
ROE (pre-tax)** 101.5% 76.7%
*Before goodwill, non-operating items, taxation and after minorities **Return on adjusted shareholders’ equity (including goodwill and CCD’s)^Includes Rensburg Sheppards plc as reported in January 2010
22

Private Wealth (formerly Private Client Portfolio Management & Stockbroking)
Outlook
• On 30 March 2010, we reached agreement on the terms of a recommended all share offer in which we will acquire the entire issued and to be issued ordinary share capital of Rensburg Sh d l t l d d bSheppards plc not already owned by us.
• This provides a base for us to consolidate our wealth management businesses in the UK.
• In South Africa, we are in the process of integrating the Private Banking wealth management business with the Private Client Portfolio Management and Stockbroking.
• This will result in a global wealth management business - with a clear strategy to offer an integrated service to our domestic and international clients - that will have a total of £27bn of gfunds under management.
23
(7.8% of group)Property Activities
%
(7.2% of group)
Overview of performance(£) Mar-10 Mar-09 change
Operating profit* (mn) 33.5 24.7 35.6%• Performance supported by continued
enhancement of the investment property tf li
p
Cost to income 37.4% 35.2%
ROE (pre-tax)** 41.0% 47.5%
portfolio
Outlook
• Efforts to launch additional funds is gaining traction in all three geographies
24*Before goodwill, non-operating items, taxation and after minorities
**Return on adjusted shareholders’ equity (including goodwill and CCD’s)
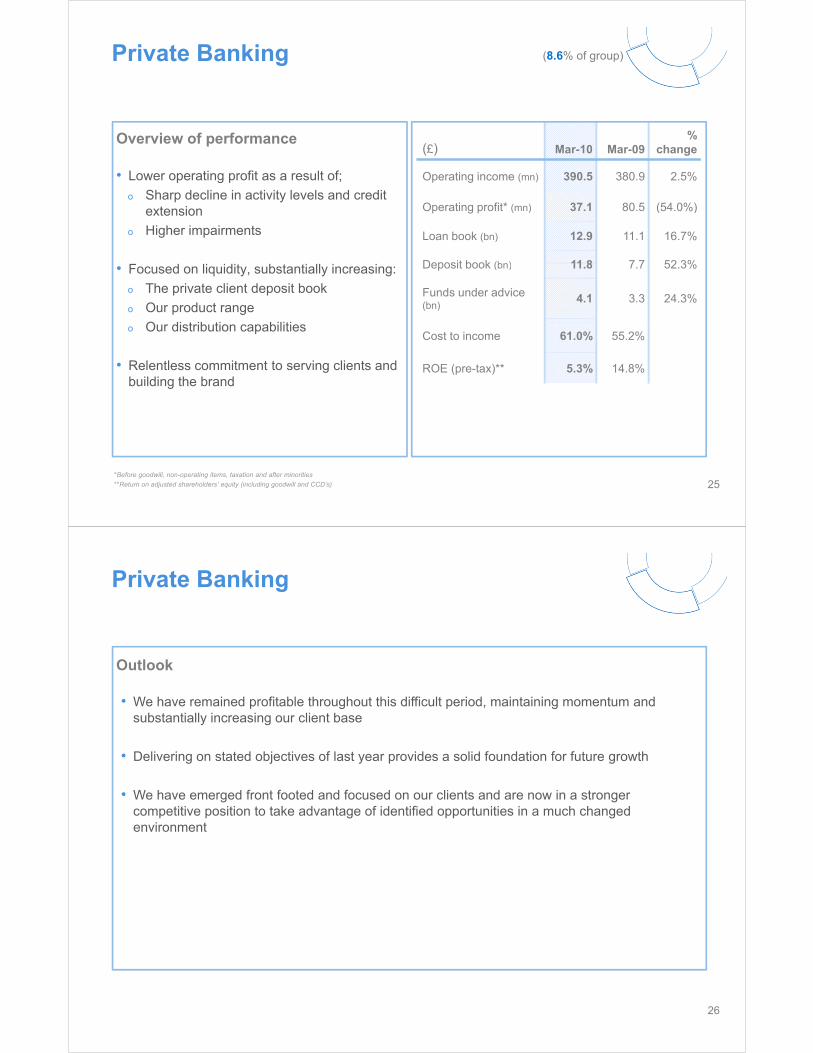
(8.6% of group)Private Banking
(£) M 10 M 09%
hOverview of performance
(£) Mar-10 Mar-09 change
Operating income (mn) 390.5 380.9 2.5%
O ti fit* ( ) 37 1 80 5 (54 0%)
• Lower operating profit as a result of;
o Sharp decline in activity levels and credit
p
Operating profit* (mn) 37.1 80.5 (54.0%)
Loan book (bn) 12.9 11.1 16.7%
Deposit book (bn) 11 8 7 7 52 3%
extension
o Higher impairments
Deposit book (bn) 11.8 7.7 52.3%
Funds under advice (bn)
4.1 3.3 24.3%
• Focused on liquidity, substantially increasing:
o The private client deposit book
o Our product range
O di t ib ti bilitiCost to income 61.0% 55.2%
ROE (pre-tax)** 5.3% 14.8%
o Our distribution capabilities
• Relentless commitment to serving clients and building the brandbuilding the brand
*Before goodwill, non-operating items, taxation and after minorities
**Return on adjusted shareholders’ equity (including goodwill and CCD’s) 25
Private Banking
Outlook
• We have remained profitable throughout this difficult period, maintaining momentum and substantially increasing our client base
• Delivering on stated objectives of last year provides a solid foundation for future growth
• We have emerged front footed and focused on our clients and are now in a stronger competitive position to take advantage of identified opportunities in a much changed environment
26

(9.6% of group)Investment Banking
(£) M 10 M 09%
h
(15.5% of group total)
Overview of performance(£) Mar-10 Mar-09 change
Operating profit pre
consolidated investments(mn)
62.5 46.5 34.4%• Good result overall with mixed
performance across geographies and b i ti it
p
( )
Agency and Advisory
(mn)6.9 15.9 (56.4%)
Principal Investments 55 6 30 6 81 3%
business activity
• The Agency and Advisory business, across all three geographies, closed
(mn)55.6 30.6 81.3%
Investments required to be consolidated (mn)
(20.9) (18.3) (14.0%)
g g p ,fewer deals compared to prior year and secondary commissions were impacted by lower volumes
Operating profit post
consolidated investments(mn)
41.6 28.2 47.6%
Cost to income^ 60 1% 63 9%
• Solid result from Principal Investments
o Improved performance from some of the investments held in the UK and Cost to income^ 60.1% 63.9%the investments held in the UK and Australian portfolio
o Good performance from Private Equity in South Africa
27*Before goodwill, non-operating items and taxation and after minorities^Adjusted for consolidated investments
Investment Banking
Outlook
• Outlook predominantly driven by equity markets
• Offering has expanded and we have grown the quality and size of our client base
• We continue to invest in building the capacity and quality of our platforms and have made a b f k hi th b inumber of key hires across the businesses
• Investment portfolios trading in line with expectations and outlook remains positive
• We are exceptionally well positioned to capture the opportunities which will present themselves in this changing environment
28

(41.4% of group)Capital Markets
% Overview of performance(£) Mar-10 Mar-09 change
Operating profit* (mn) 179.2 141.4 26.7%• The division was able to produce a solid
performance benefiting from:
p
Loan book (bn) 4.5 4.8 (6.1%)
Cost to income 47.2% 45.4%
o Reasonable but reduced levels of activity across the advisory businesses
o Select credit and trading
ROE (pre-tax)** 18.5% 18.7%
o Select credit and trading opportunities
• Balance sheet management activities gwere impacted by the lower rate environment and declining volatility
• Kensington produced a stable performance of £37.3mn
29*Before goodwill, non-operating items, taxation and after minorities
**Return on adjusted shareholders’ equity (including goodwill and CCD’s)
Capital Markets
Outlook
• SAo Corporate environment remains extremely liquid o Activity levels unlikely to increase until the second half of the yearo Well positioned with reasonably robust credit portfolio
• UK and Australia• UK and Australiao Activity is starting to pick upo Should benefit from changed competitive landscape to win new clients
• Overall, we expect impairment levels to reduce substantially. We remain well positioned in all three geographies to grow market share and extend our franchise
30

Group Services and Other Activities (7.3% of group)
Overview Operating profit*
(£) Mar-10 Mar-09%
change
International Trade 7 17 7 22 (0 6%)
• Central Funding performed well benefiting from:
Operating profit
Finance (mn)7.17 7.22 (0.6%)
Central Funding (mn) 97.7 90.7 7.7%
o The purchase of the group’s debt in the UK
o Improved return on investments held in the South African portfolio
Central Services (mn) (73.2) (66.1) 10.7%
Group Services and Other Activities
31.7 31.8 (0.2%)
the South African portfolio
o Partially offset by a lower return on surplus cash
Other Activities( )
*Before goodwill, non-operating items, taxation and after minorities
31
General
• Operational effective tax rate down from 21.1% to 20.6%Operational effective tax rate down from 21.1% to 20.6%
• Weighted shares from 634.6mn to 686.3mn
• Goodwill impairments
Goodwill impairment of £3 5mno Goodwill impairment of £3.5mn
o Largely relates to Asset Management businesses acquired in prior years
£• Losses attributable to minority interests
o Operating loss in relation to investments held in the Private Equity division
o Translation of preferred securities issued by subsidiary of Investec plc – transaction is hedged
£18.8mn
(£12.3mn)
(£6.9mn)
o Other £0.4mn
32
Strategy and outlookStrategy and outlook
33
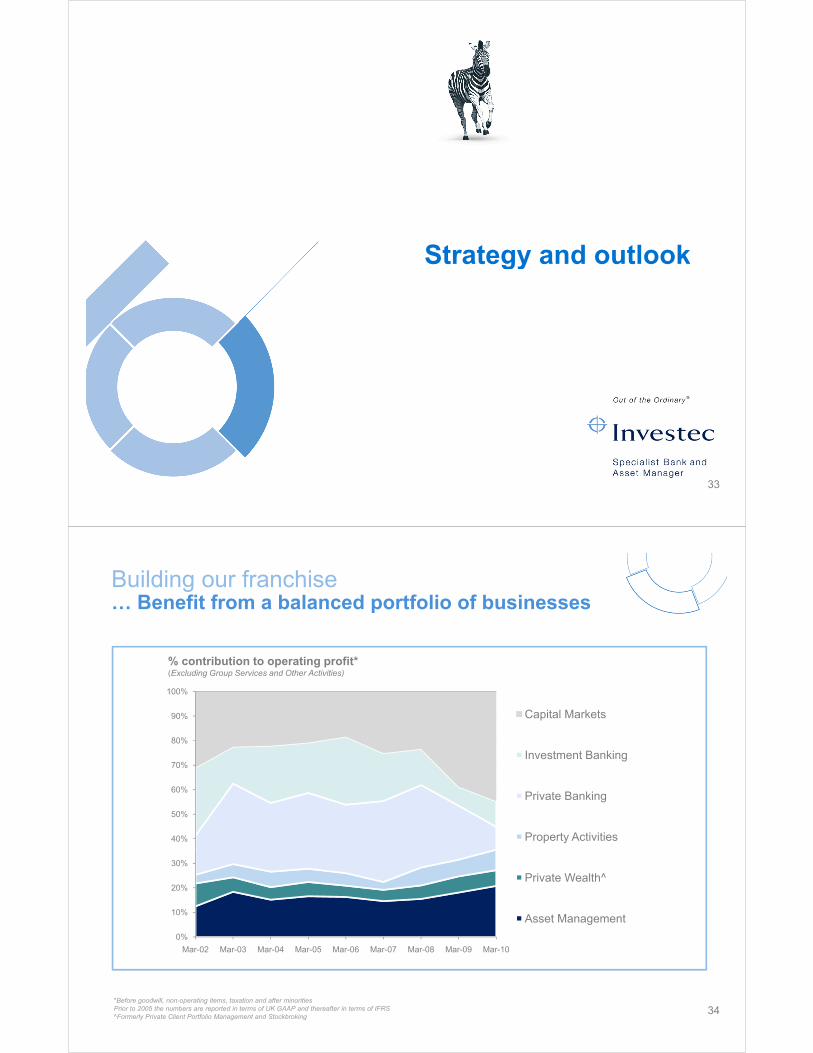
Building our franchise… Benefit from a balanced portfolio of businesses
% contribution to operating profit* (E l di G S i d Oth A ti iti )
p
(Excluding Group Services and Other Activities)
90%
100%
Capital Markets
60%
70%
80%
Investment Banking
40%
50%
60%Private Banking
Property Activities
20%
30%
Private Wealth^
0%
10%
Mar-02 Mar-03 Mar-04 Mar-05 Mar-06 Mar-07 Mar-08 Mar-09 Mar-10
Asset Management
*Before goodwill, non-operating items, taxation and after minoritiesPrior to 2005 the numbers are reported in terms of UK GAAP and thereafter in terms of IFRS^Formerly Private Client Portfolio Management and Stockbroking
34

Building our franchise… Continually align the business model
1,200
y g
600
800
1,000
'mn
)200
400
600 (£'
-
2002 2003 2004 2005 2006 2007 2008 2009 2010
Third party assets and advisory
Net interest income and principal transactions
Third party assets and Net interest income and
Net interest income and principal transactions
Net interest income and principal transactions after impairments
• Asset management
• Property funds
• Private equity funds
• Lending portfolios
• Principal transactions
• Structured transactions
Containing costsMaintaining credit quality
p yadvisory principal transactions
• Private equity funds • Structured transactions
• Market making
g q yStrictly managing risk and liquidity
35
… Maintain operational efficiencyBuilding our franchise
y
Efficiency ratio
1,600
1,800 • Cost to income ratio was 57.8% (well below our internal target of <65%)
T l b 14 9%
Operating income*CAGR: 13.0%
1,000
1,200
1,400
(£'m
n)
• Total expenses grew by 14.9% to £957.2mn as a result of:
o The appreciation of the Rand
An increase in variable remuneration in
600
800
o An increase in variable remuneration in certain divisions given improved profitability
Admin expenses*CAGR: 9.6%
200
400 • Total headcount continues to be tightly managed across the group
• A non cash deferred component has been -
2002 2003 2004 2005 2006 2007 2008 2009 2010
Expenses (excluding depreciation)
Operating income
• A non-cash deferred component has been introduced to variable remuneration payments
36*Before investments consolidated in the Private Equity portfolio

Building our franchise… Focus on clients and building the brand
• Strengthen existing client relationships
• Provide distinctive products and an increased breadth of services to clients
g
37
Building our franchise… Focus on our revenue drivers
• Generate high quality income through diversified revenue streams
• Further grow funds under managementFurther grow funds under management
• Increase loan growth
• Increase transactional activity
• Grow customer deposits
38
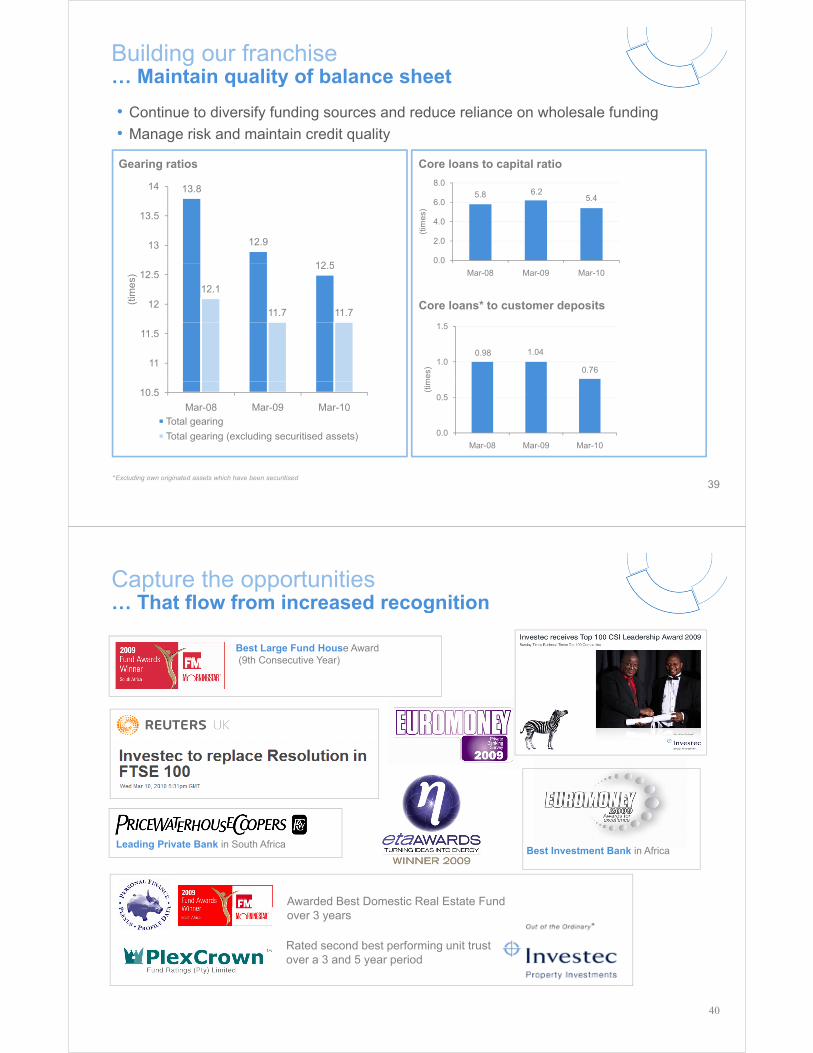
Building our franchise… Maintain quality of balance sheet
• Continue to diversify funding sources and reduce reliance on wholesale funding
• Manage risk and maintain credit quality
q y
Core loans to capital ratioGearing ratios
13.8145.8 6.2
5.46 0
8.0
12.9
12 5
13
13.5
0.0
2.0
4.0
6.0
(tim
es)
Core loans* to customer deposits
12.5
12.1
11.7 11.712
12.5
(tim
es)
0.0
Mar-08 Mar-09 Mar-10
11
11.5
0.98 1.04
0.761.0
1.5
mes
)
10.5
Mar-08 Mar-09 Mar-10Total gearing
Total gearing (excluding securitised assets) 0.0
0.5
(tim
*Excluding own originated assets which have been securitised39
g g ( g )Mar-08 Mar-09 Mar-10
… That flow from increased recognitionCapture the opportunities
Sydney AirportBest Large Fund House Award(9th Consecutive Year)
g
Investec Derby
Leading Private Bank in South AfricaB t I t t B k i Af i
g
Awarded Best Domestic Real Estate Fund
Best Investment Bank in Africa
Rated second best performing unit trust over a 3 and 5 year period
over 3 years
40

Outlook
• We have built our capital, liquidity and third party assets under management over the period under review.
• The foundation is now in place for further growth both in our non capital intensive asset management businesses as well as our core specialist banking businessesbanking businesses.
• Although the economic situation remains uncertain the business is oriented towards capturing available opportunities in all our core geographies.
41
Results presentationFor the year ended y
31 I 03 I 2010
42