analyst meeting 220916
TRANSCRIPT

1
ANALYST MEETING
MIKKO HELANDERJUKKA ERLUND
22.9.2016

2
MARKETS AND FINANCIAL
DEVELOPMENT

-4,0
-2,0
0,0
2,0
4,0
6,0
8,0
10,0
12,0
Estonia
Lithuania
Sweden
Norway
Latvia
Finland
RETAIL TRADE TRENDS IN OPERATING COUNTRIESROLLING 3 MO
3
Source: Eurostat, excl. motor vehicles and fuels
% (r
ollin
g3
mo)
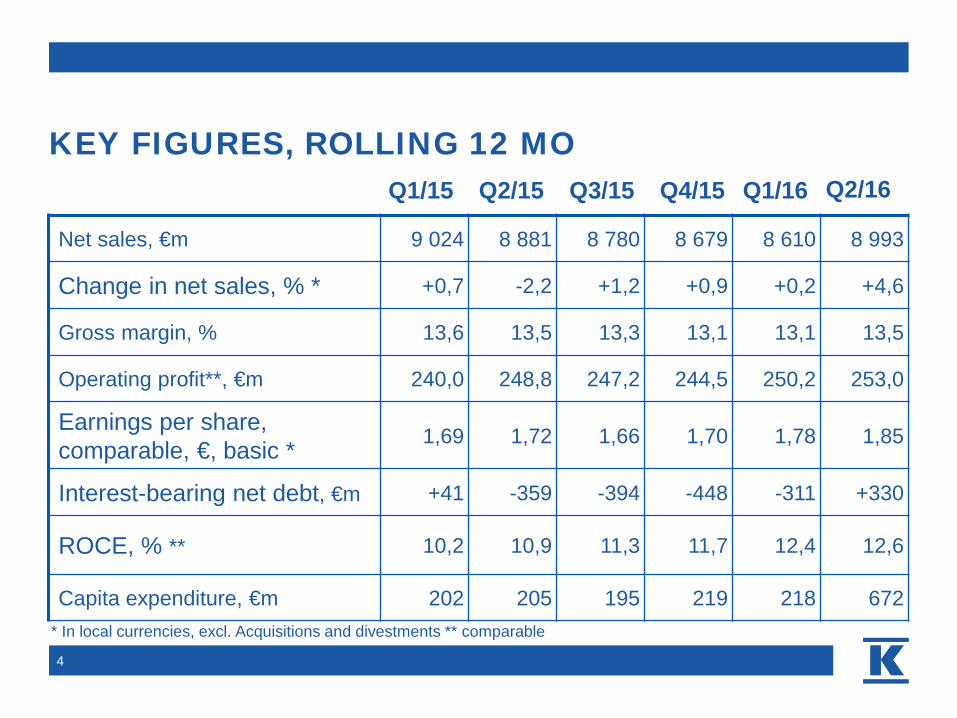
KEY FIGURES, ROLLING 12 MO
4
Net sales, €m 9 024 8 881 8 780 8 679 8 610 8 993
Change in net sales, % * +0,7 -2,2 +1,2 +0,9 +0,2 +4,6
Gross margin, % 13,6 13,5 13,3 13,1 13,1 13,5
Operating profit**, €m 240,0 248,8 247,2 244,5 250,2 253,0
Earnings per share, comparable, €, basic * 1,69 1,72 1,66 1,70 1,78 1,85
Interest-bearing net debt, €m +41 -359 -394 -448 -311 +330
ROCE, % ** 10,2 10,9 11,3 11,7 12,4 12,6
Capita expenditure, €m 202 205 195 219 218 672* In local currencies, excl. Acquisitions and divestments ** comparable
Q1/15 Q2/15 Q3/15 Q4/15 Q1/16 Q2/16
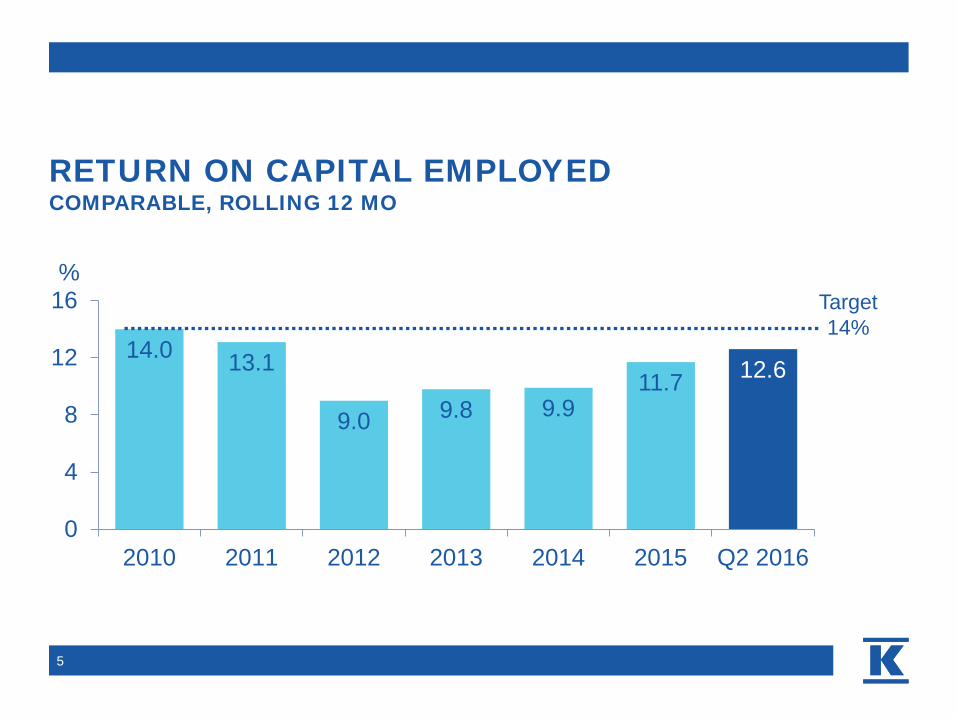
RETURN ON CAPITAL EMPLOYEDCOMPARABLE, ROLLING 12 MO
5
14.0 13.1
9.0 9.8 9.911.7 12.6
0
4
8
12
16
2010 2011 2012 2013 2014 2015 Q2 2016
%Target14%

RETURN ON CAPITAL EMPLOYED BY DIVISIONCOMPARABLE, ROLLING 12 MO
6
Group totalBuilding and technical trade
Grocery trade Car trade
%
22.2
10.1
22.5
12.6
0
5
10
15
20
25
30

KESKO GROUP'S SALES IN EUROS, EXCLUDING VAT, IN JANUARY-AUGUST 2016
7
1.1. - 31.8.2016 Comparable€ million Change, % change, %
Grocery trade, total 3,396.4 +10.3 +0.2Building and technical trade, Finland
1,379.1 +12.5 +0.7 Building and technical trade, other countries 1,241.0 +16.8 +5.9 Building and technical trade, total
2,620.0 +14.5 +3.2Car trade, total 570.4 +7.8 +7.8Common functions and eliminations -4.7Grand total 6,582.2 +11.6 +1.8
Finland, total 5,268.3 +10.4 +1.0 Other countries, total 1,313.9 +16.3 +7.2 Grand total 6,582.2 +11.6 +1.8
8
GROCERY TRADE

KESKO GROCERY TRADE
9
Net sales €4,867m
Operating profit* €174m
Operating margin* 3.6%
ROCE* 22.2%K-Group 32.7%S-Group 45.9%Lidl 8.3%Suomen Lähikauppa 6.4%Others 6.7%
Total market €16.6 billion in 2015
Source: Nielsen
* comparable
Q3/2015-Q2/2016

CONSUMER PRICE INDEX – FOOD AND NON-ALCOHOLIC BEVERAGESANNUAL CHANGE, %
-4
-2
0
2
4
6
8
10
Source: Statistics Finland

11
GROCERY TRADE STRATEGY PROGRESSING AS PLANNED
• Renewal of neighbourhood store network and conversion of Siwa and Valintatalo stores into K-Markets
• Renewal of K-citymarket chain
• 70 renewed Neste K service station stores by 2017
• Best digital services in the tradingsector

CONVERSION OF SIWA AND VALINTATALO STORES INTO K-MARKETS
• K-neighbourhood store selection and Pirkka products introduced
• Prices as much as 20% lower
• Some 100 stores already converted, over 200 by the end of 2016
• Synergy benefits are estimated at approximately €25–30 million at EBITDA level as of 2018• The costs of store and network conversion, to be
treated as non-recurring restructuring cost, will total approximately €30 million in 2016–2018
12

13
BUILDING AND TECHNICAL TRADE

BUILDING AND TECHNICAL TRADE
14
Net sales €3,335m
Operating profit* €82m
Operatingmargin* 2.4%
ROCE* 10.1%
Sports trade€186m
Furniture trade€179m
Agricultural and machinery trade Finland €500m
Others€37m
Building and home improvement trade Belarus €116m
Building and home improvement trade
Russia €192m
Building and homeimprovement tradeFinland €794m
Building and homeimprovement tradeScandinavia €627m
Building and home improvement trade Baltics €461m
Agricultural and machinery trade Baltics €115m
* comparable
2015
Q3/2015-Q2/2016

GRANTED BUILDING PERMITS AND BUILDING STARTS, MIL. M3, MOVING ANNUAL TOTAL
15
Source: Statistics Finland

GOOD PROFIT PERFORMANCE IN THE BUILDINGAND TECHNICAL TRADE DIVISION
• Good sales performance• Strong growth in B2B trade
• Profitability improved especially in the Baltics, Sweden and Norway
• Kesko Senukai’s profitability good• Market still has significant growth
potential
16
0
10
20
30
40
50
60
70
80
90
Comparable rolling 12 mo operating profit
M€

STRENGTHENING OF PROFITABILITY AND GROWTH
17
• Combination of Onninen and Kesko to become the strongest B2B entity in themarket
• Widest selection in the market
• Most comprehensive store network and largest sales organisation of northern Europe
• Most customer oriented logistics and digitalservices for B2B customers
• Realisation of synergies has started• Full synergies at EBITDA level around
€30 million per year as of 2020

GROWTH FROM EUROPE AND B2B SALES
• Growth from both B2C and B2B sales
• Strengthening of market position in Finland
• Accelerating of growth and furtherstrengthening of positions in Scandinavia
• Boosting Kesko Senukai’s growth
18
Current operating country Poland with acquisition of Onninen as of 1 June

19
CAR TRADE
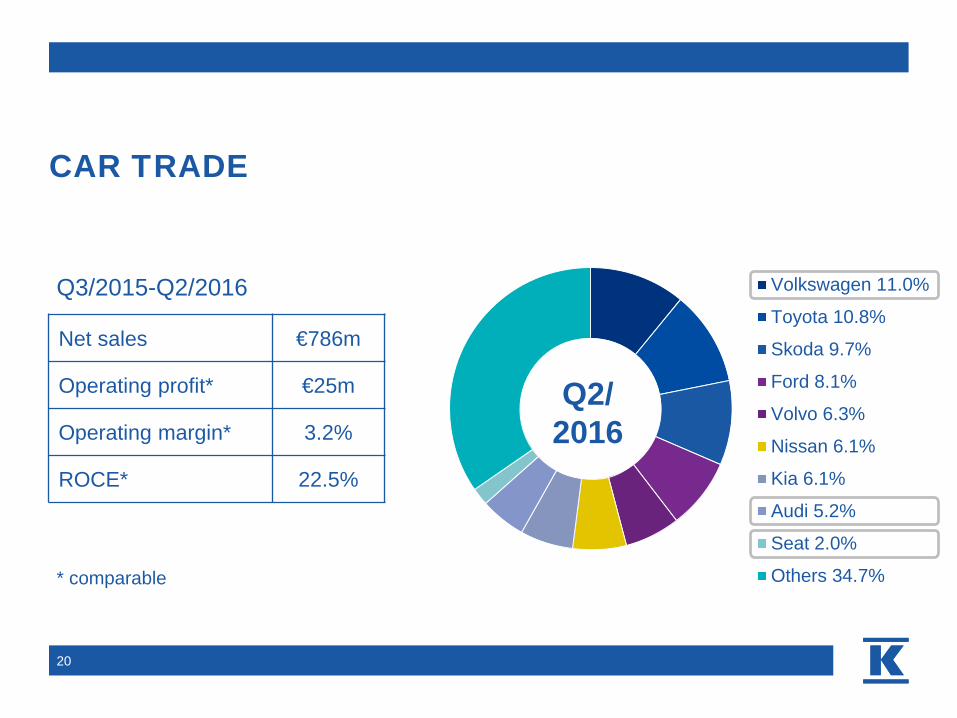
CAR TRADE
20
Net sales €786m
Operating profit* €25m
Operating margin* 3.2%
ROCE* 22.5%
Volkswagen 11.0%
Toyota 10.8%
Skoda 9.7%
Ford 8.1%
Volvo 6.3%
Nissan 6.1%
Kia 6.1%
Audi 5.2%
Seat 2.0%
Others 34.7%* comparable
Q2/2016
Q3/2015-Q2/2016

FIRST REGISTRATIONS OF PASSENGER CARS IN FINLAND
21
Source: Statistics Finland