analyst briefing 3 quarter 2014 - engrofoods.com highlights of 3q 2014 won second position “est...
TRANSCRIPT

Analyst Briefing3rd Quarter 2014
October 21st, 2014

Key Highlights of 3Q 2014
OLPER’S ECOLEAN CAMPAIGN

Key Highlights of 3Q 2014
TARANG – Functional Campaign

Key Highlights of 3Q 2014
ICE CREAM & FROZEN DESSERTS
• New Product: Mango Max
• New Flavors: Mango & Vanilla
Fruit & Nut
Mango Peach
• New Offerings: Tutti Fruitti Pack
Tutti Fruitti Cup
Funties Cup
Key Highlights of 3Q 2014
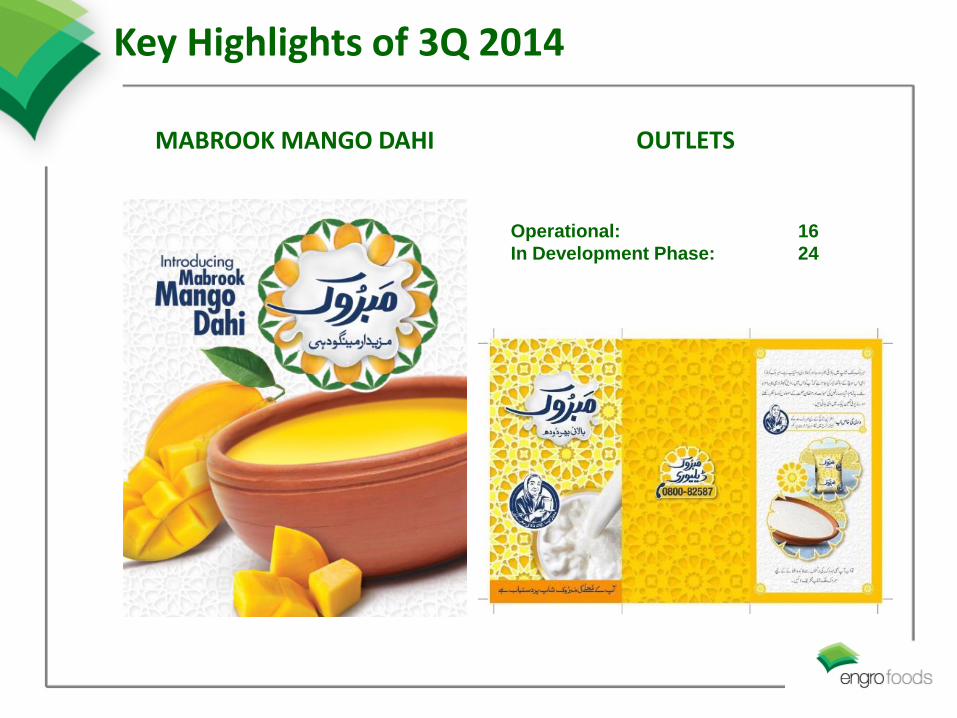
MABROOK MANGO DAHI OUTLETS
Operational: 16
In Development Phase: 24
Key Highlights of 3Q 2014
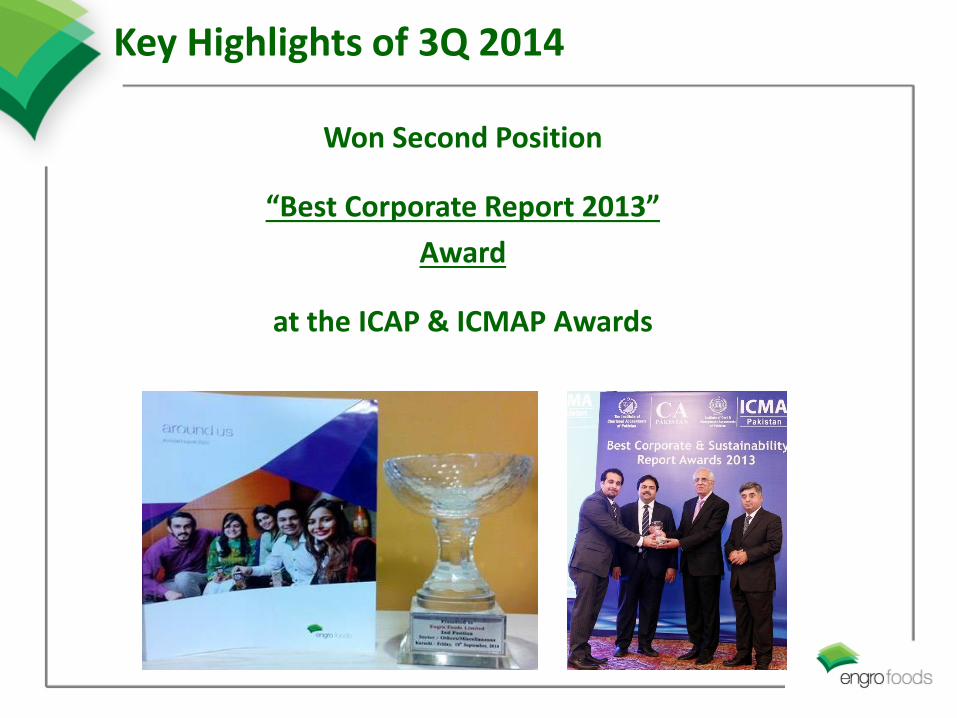
Won Second Position
“Best Corporate Report 2013”
Award
at the ICAP & ICMAP Awards

7
15%13%
20%
18%
13%
2.0%0.4%
4.7%2.1%
3.2%
0%
5%
10%
15%
20%
25%
30%
3Q'13 4Q'13 1Q'14 2Q'14 3Q'14
GP as a % of revenue
PAT as a % of revenue
Business Update – Dairy & Beverages
• Volume increase vs.
3Q‘13 14%• Volume increase vs.
YTD Sept’13 7%
• UHT Market Share
as per Nielsen data
53% (Aug 2014)6,000
7,000
8,000
9,000
10,000
3Q'13 4Q'13 1Q'14 2Q'14 3Q'14
Revenue (Rs. M)
Ambient UHT & Dairy Powder Juices
8,265
9,4819,517
8,629
9,835
QoQ Decrease in GP %
High milk price due to lean -4.0%
Price increase in Olpers 1.5%
Price decrease in Tarang -2.0%

8
825
377512
1,169
953
0
200
400
600
800
1,000
1,200
3Q'13 4Q'13 1Q'14 2Q'14 3Q'14
Revenue (Rs. M)
(12)
(184)(169)
38 8
49%
9%
34%43% 40%
-60%
-45%
-30%
-15%
0%
15%
30%
45%
60%
(200)
(150)
(100)
(50)
0
50
100
150
200
3Q'13 4Q'13 1Q'14 2Q'14 3Q'14
GP as % of revenue
PAT (Rs. M)
Business Update – Ice cream & Frozen Desserts
• Volume increase
vs. 3Q‘13 23%• Volume increase
vs. YTD Sept’13 21%
• Market Share
28%(Internal Estimate)

9
3,498 3,787 3,979 3,783 4,286
15
34 43
33
18
5
15
25
35
45
2,500
3,000
3,500
4,000
3Q'13 4Q'13 1Q'14 2Q'14 3Q'14
Herd Size
Production (thousand litres per day)
(14)(8)
(20)
10
(24)
(105)
(85)
(65)
(45)
(25)
(5)
15
3Q'13 4Q'13 1Q'14 2Q'14 3Q'14
PAT (Rs. M)
Business Update – Farm
• 21% higher production compared to 3Q’13
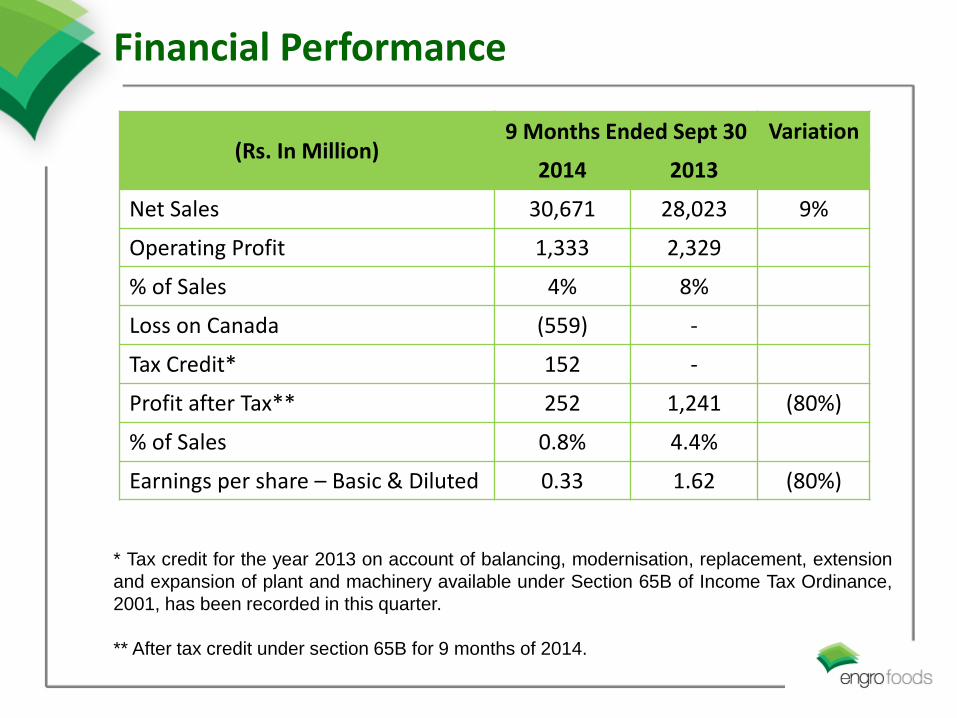
(Rs. In Million)9 Months Ended Sept 30 Variation
2014 2013
Net Sales 30,671 28,023 9%
Operating Profit 1,333 2,329
% of Sales 4% 8%
Loss on Canada (559) -
Tax Credit* 152 -
Profit after Tax** 252 1,241 (80%)
% of Sales 0.8% 4.4%
Earnings per share – Basic & Diluted 0.33 1.62 (80%)
Financial Performance
* Tax credit for the year 2013 on account of balancing, modernisation, replacement, extension
and expansion of plant and machinery available under Section 65B of Income Tax Ordinance,
2001, has been recorded in this quarter.
** After tax credit under section 65B for 9 months of 2014.

11