analysis of vibrational modes of chemically modified tone wood
TRANSCRIPT

University of Northern Iowa University of Northern Iowa
UNI ScholarWorks UNI ScholarWorks
Honors Program Theses Honors Program
2018
Analysis of vibrational modes of chemically modified tone wood Analysis of vibrational modes of chemically modified tone wood
Madison Flesch University of Northern Iowa
Let us know how access to this document benefits you
Copyright ©2018 Madison Flesch
Follow this and additional works at: https://scholarworks.uni.edu/hpt
Part of the Biology and Biomimetic Materials Commons, Chemistry Commons, and the Other Music
Commons
Recommended Citation Recommended Citation Flesch, Madison, "Analysis of vibrational modes of chemically modified tone wood" (2018). Honors Program Theses. 315. https://scholarworks.uni.edu/hpt/315
This Open Access Honors Program Thesis is brought to you for free and open access by the Honors Program at UNI ScholarWorks. It has been accepted for inclusion in Honors Program Theses by an authorized administrator of UNI ScholarWorks. For more information, please contact [email protected].

ANALYSIS OF VIBRATIONAL MODES OF CHEMICALLY MODIFIED TONE WOOD
A Thesis Submitted
In Partial Fulfillment
Of the Requirements for the Designation
University Honors
Madison Flesch
University of Northern Iowa
May 2018

This Study by: Madison Flesch Entitled: Analysis of Vibrational Modes of Chemically Modified Tone Wood
Has been approved as meeting the thesis or project requirement for the Designation University Honors
__________ _______________________________________________________________ Date Dr. Curtiss Hanson, Honors Thesis Advisor
__________ _______________________________________________________________ Date Dr. Jessica Moon, Director, University Honors Program

Acknowledgements
I would like to thank Dr. Curtiss Hanson profusely for all of his guidance, contributions,
and time for the duration of this project. I would also like to acknowledge Dr. Joshua Sebree for
his time and contribution to this project in the form of graphing many of the data collections
taken during this time. I also would like to thank the entire faculty and staff of the Department of
Chemistry and Biochemistry for their willingness to listen and offer guidance to me in both
professional and personal areas of my life. Lastly, I would like to thank my family and friends
for their unwavering support throughout my undergraduate career, as without them it would have
been much less of an enjoyable time and I likely would not have chosen to continue my studies
in graduate school after completing my time here at UNI.

Table of Contents
Introduction………………………………………………………………………………………..1
Literature Review………………………………………………………………………………….2
Methodology………………………………………………………………………………………4
Results……………………………………………………………………………………………11
Discussion………………………………………………………………………………………..20
Conclusions………………………………………………………………………………………23
Future Work……………………………………………………………………………………...25

ANALYSIS OF VIBRATIONAL MODES OF CHEMICALLY MODIFIED TONE WOOD 1
Introduction
It is generally accepted that every violin has different tone quality in terms of intonation
and the depth of the harmonics produced. The best violins are made by experienced luthiers that
craft each with precision to produce the best possible tonal quality. The quality of the finished
violin is dependent upon both the specific shape and the vibrational response of the wood used in
its construction. Because the hard wood used in violin construction is inhomogeneous, the
composition and structure of material used is critical to the final product.1 Luthiers would
initially rely on their experience to feel the vibrations and intuition as to the quality of wood
used, which is an extremely subjective method of analysis. Then, as they progressed in their
skills, it became much easier to make violins of similar sound and sound quality when they were
made from the same kind of wood. Today, most violins are made from spruce, maple, and
artificial materials.2
Luthiers craft each violin by hand, carving the wood so that the assembled violin
generates a pleasing sound. In the construction process of many wooden instruments such as
guitars or violins, tone wood is used. The selection criteria for tone wood is broad and can vary
depending on the type of instrument being constructed, along with personal preference of the
crafter. Several common criteria include the species of the tree, lack of structural defects in the
wood, stiffness, and properly dried wood.2 No matter how many selection criteria are kept
constant when selecting tone wood, the innate structural makeup of wood prevents the
construction of two identical violins. While there is a variety of tone wood available,
pernambuco has remained a popular yet elusive choice of wood for string instrument bows.
Pernambuco is so heavily sought after due to its reputation as the only material in the world,
natural or synthetic, that provides the highest quality of performance bows.3 However, due to the

ANALYSIS OF VIBRATIONAL MODES OF CHEMICALLY MODIFIED TONE WOOD 2
excessive use of pernambuco in past centuries coupled with its slow growth rate and sometimes-
poor quality, this decline in the wood has forced a search for alternative wood materials such as
spruce and maple.3 Today violins and other string instruments are most often made with the
hardwoods spruce and maple due to their abundance and general consistency in quality.4 With
the inability to produce identical violins and the introduction of new tone wood materials, the
importance of analytical methods to analyze the quality of violins from an objective standpoint
continues to grow. The creation of a method to perform this objective analysis with reliable
accuracy using two-dimensional vibrational modal analysis is explored further here.
Literature Review
Many modern luthiers today still rely on their ability to tap the body of a violin, listen and
judge the quality of the violin. For centuries this was the only way to evaluate the quality of a
violin.5 Modern technology has made it possible to accurately determine the quality of a violin
through a variety of methods. Carleen Hutchins has conducted experiments using laser hologram
interferometry.6 This method highlights areas on violin plates where there is little vibration or
nodes. The evaluation of violin plates was done over a range of frequencies and was able to
illustrate how in tune a plate was, as well as help judge the quality of violin plates. This method
is limited to just evaluating plates, preventing the evaluation of a fully constructed violin.
Throughout the construction process, the violin’s response frequencies can change drastically. In
addition, it is unknown if this method would work well in analyzing different materials used for
violin plates, such as plastic or carbon fiber. Because this method focuses on areas of the violin
plates with little vibration, any differences in resonance frequencies based on different materials
may not be seen or properly analyzed using laser interferometry. Hutchins’ method is a starting
point for analyzing full violins for their quality.

ANALYSIS OF VIBRATIONAL MODES OF CHEMICALLY MODIFIED TONE WOOD 3
There is also a need to determine how varnishes and other wood treatments affect the
quality of violins. Skrodzka et al. discusses the differences in tonal quality of violins based upon
whether or not the varnish used on the violin was oil or spirit based.7 They determined that there
were few differences in vibrational frequencies, but the oil-varnished violin subjectively
performed better than the spirit-varnished violin. The relevance of this study comes in with the
fact that varnishing the violin only creates a very thin surface layer on the wood of the
instrument rather than impregnating the entire thickness of the wood. It raises the question of
how chemical modification and surface layer treatment affects the physical qualities of tone
wood, and whether or not a thin surface layer is enough to change the major vibrational
frequencies of the tone wood.
With today’s technology, violins and other string instruments are made out of many kinds
of materials other than wood such as carbon fiber and plastic.8 One group of scientists at Pacific
Northwest National Laboratory is studying the process of wood petrification.9 Their method to
create this “petrified” wood has it soak in strong acid for several days, with a rinse and then
subsequent soaking in silica solution, air dry, and then is put into an argon-filled oven at 1400°C
to bake for a few hours, leaving behind something very similar to true petrified wood.9 In this
method, the acid soak removes all material within the wood, leaving behind the cellulose base, of
which the silicon fills in the gaps and binds with that carbo-based backbone structure. After
baking, this forms a ceramic of sorts, leading to the similarity between it and petrified wood. If
this method could be easily reproducible in other laboratory settings, further research could be
completed on its potential use in violins and other string instruments. The advent of these new
materials for instrument use introduces a new element to the analysis of violin quality because
they are not wood; therefore, the method of analysis must be able to encompass these materials.

ANALYSIS OF VIBRATIONAL MODES OF CHEMICALLY MODIFIED TONE WOOD 4
Varnishing the wood also changes the surface structure of the wood, but the comparison of
varnished, silicated, and other forms of treated tone wood regarding the physical characteristics
and major vibrational frequencies has yet to be completed within the same study or with the
same method of analysis.
The vibrational characteristics of the violin components are unique and therefore
optimized for each individual violin, necessitating a quantitative and objective study of violin
quality. Although measuring how the material affects the resonance frequencies of the
unattached front and back plates of violins has been done for many years, the results have been
difficult to quantify. These previous studies are stepping stones to determining the overall quality
of violins and other string instruments based upon their tone wood and the chemical treatment or
modification of that wood. Hutchins’s laser interferometry study provides a good basis for
quantitative analysis of plate quality focused on resonating frequencies in one dimension.
Adapting this type of analysis for two dimensions may allow for a more quantitative and method
of analysis that can be applied to more materials than just wood that are used in violin
construction. Luthiers and others continue their search for the best wood and methods to recreate
the beautiful-sounding violins of old, so creating a two-dimensional method for analyzing violin
quality may assist them on that journey.
Methodology
Vibrational spectroscopy is the study of electromagnetic radiation and its application,
with analysis tools available for both absorption and emission spectroscopy. The relevant
analogous technique for this study is the absorption spectroscopy of Infrared (IR) spectroscopy.10
IR spectroscopy provides information on molecular symmetry, bond vibrations, bond distances,
and bond angles of a chemical compound. This is done through the analysis of an IR spectrum,

ANALYSIS OF VIBRATIONAL MODES OF CHEMICALLY MODIFIED TONE WOOD 5
which is the graphical output of the aforementioned information. IR can be sensitive enough to
also recognize overtone bands or couple frequencies, which show up as peaks in various places
along the spectrum that hold specific meaning for each compound. This type of two-dimensional
analysis can be applied to string instrument resonance frequencies. The vibrational analysis in
this situation looks at the resonance frequencies of the wood rather than bond vibrations and can
also determine coupled and harmonic frequencies.
This study looked at those vibrations within an unattached violin front plate and tone
wood strips. The vibrational analysis was performed in the soundproof chamber depicted in the
block diagram below in Figure 1. This soundproof chamber and analysis method were devised
previously in Dr. Hanson’s laboratory using unattached violin plates.11 The chamber consisted of
a large speaker on the back wall to send frequencies from an oscilloscope at the violin plate at a
loud volume, with soundproofing in place to minimize outside noise interference.
Figure 1. Block diagram of the soundproof chamber and computer setup for vibrational analysis.
The program Measurement and Automation Explorer was used to manage the analysis
through three different computer parts. National Instrument 5102 is the PCI digital oscilloscope
card, which is depicted as the digital to analog converter in the diagram and sends signals to the
speaker so that it sends out frequencies in 10 Hz intervals in the range of 10 Hz to 5000 Hz.
ANALYSIS OF VIBRATIONAL MODES OF CHEMICALLY MODIFIED TONE WOOD 6
National Instrument 5411 is the PCI arbitrary waveform generator, shown as the analog to digital
converter, which transforms the raw data output collected from the piezoelectric micro-
accelerometer into a one-dimensional waveform graph. Lastly, PCI 6711 is the analog digital
output card that controls the pulse generator sequences. LabView was the program used to
control the system and interpret the data collected from the oscilloscope and the piezoelectric
micro-accelerometer directly affixed to the unattached front violin plates and tone wood strips.
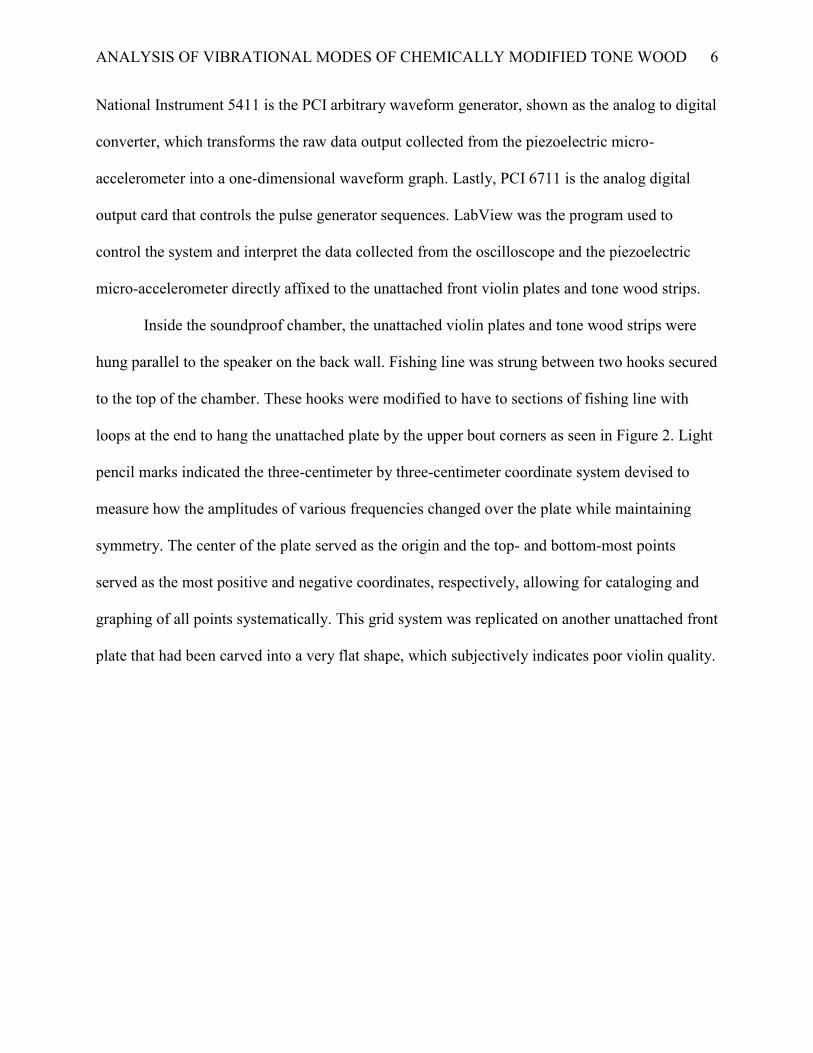
Inside the soundproof chamber, the unattached violin plates and tone wood strips were
hung parallel to the speaker on the back wall. Fishing line was strung between two hooks secured
to the top of the chamber. These hooks were modified to have to sections of fishing line with
loops at the end to hang the unattached plate by the upper bout corners as seen in Figure 2. Light
pencil marks indicated the three-centimeter by three-centimeter coordinate system devised to
measure how the amplitudes of various frequencies changed over the plate while maintaining
symmetry. The center of the plate served as the origin and the top- and bottom-most points
served as the most positive and negative coordinates, respectively, allowing for cataloging and
graphing of all points systematically. This grid system was replicated on another unattached front
plate that had been carved into a very flat shape, which subjectively indicates poor violin quality.

ANALYSIS OF VIBRATIONAL MODES OF CHEMICALLY MODIFIED TONE WOOD 7
Figure 2. Spruce wood unattached violin front plate hung in the soundproof chamber with the micro-accelerometer attached for vibrational analysis.
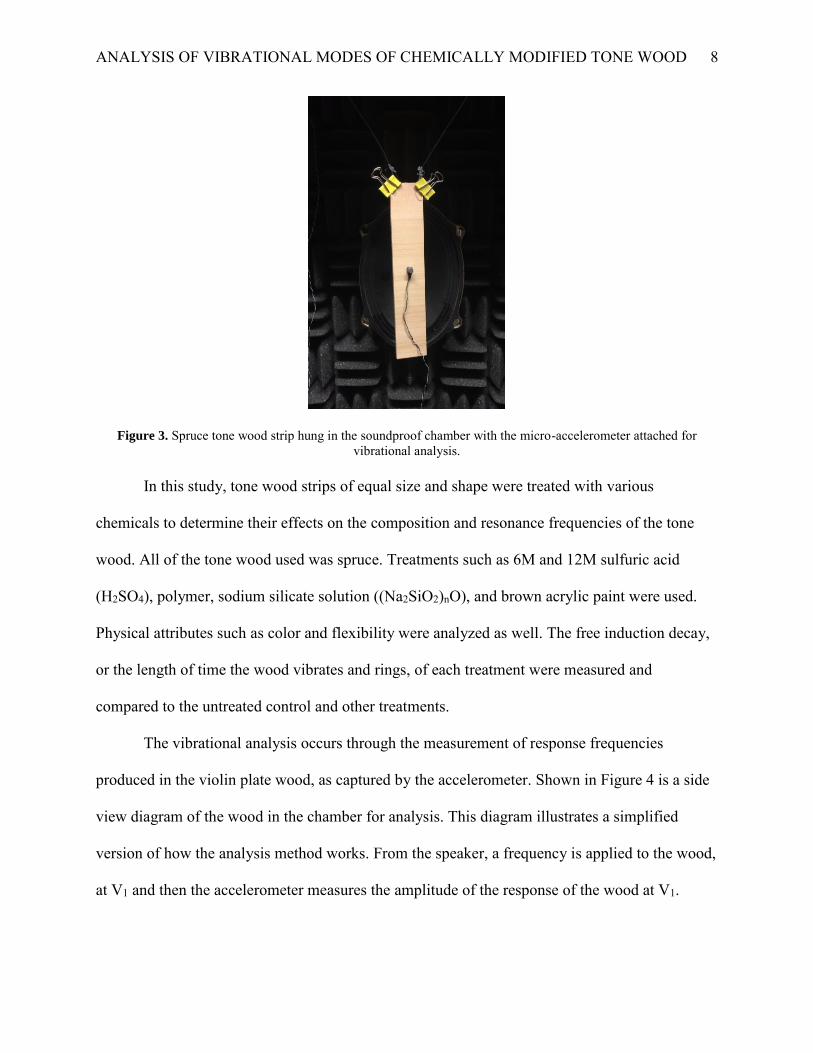
The same loops the plate hung by were used to hang the pieces of tone wood from two
clips on the top corners of the strip, shown in Figure 3. Notches originally were going to be
carved near the top of the tone wood strips, but after completing the first acid treatment for one,
it was determined the wood weakened significantly and therefore the notches would not last
through additional treatments. For analysis of the tone wood strips, two points located at the
bottom and the middle of the strip were used to measure the major vibrational frequencies. Only
two points were selected for analysis because the wood pieces were all simple, flat rectangular
shapes, so symmetrical responses were expected between the top and bottom halves of the pieces
of wood, even after treatment. The wood pieces were fully submerged or evenly coated during
the treatment process, so variation was determined to be unlikely and therefore not looked at.
ANALYSIS OF VIBRATIONAL MODES OF CHEMICALLY MODIFIED TONE WOOD 8
Figure 3. Spruce tone wood strip hung in the soundproof chamber with the micro-accelerometer attached for vibrational analysis.
In this study, tone wood strips of equal size and shape were treated with various
chemicals to determine their effects on the composition and resonance frequencies of the tone
wood. All of the tone wood used was spruce. Treatments such as 6M and 12M sulfuric acid
(H2SO4), polymer, sodium silicate solution ((Na2SiO2)nO), and brown acrylic paint were used.
Physical attributes such as color and flexibility were analyzed as well. The free induction decay,
or the length of time the wood vibrates and rings, of each treatment were measured and
compared to the untreated control and other treatments.
The vibrational analysis occurs through the measurement of response frequencies
produced in the violin plate wood, as captured by the accelerometer. Shown in Figure 4 is a side
view diagram of the wood in the chamber for analysis. This diagram illustrates a simplified
version of how the analysis method works. From the speaker, a frequency is applied to the wood,
at V1 and then the accelerometer measures the amplitude of the response of the wood at V1.

ANALYSIS OF VIBRATIONAL MODES OF CHEMICALLY MODIFIED TONE WOOD 9
Figure 4. Side view diagram of the soundproof chamber setup for vibrational analysis.
This application of a frequency and the subsequent response is illustrated graphically in
Figure 5. The graph in Figure 5(a) is the intensity of the frequency being applied, while (b) is the
waveform graph showing the progression of the frequencies being applied. Figure 5(c) is a one-
dimensional plot of the response frequencies and their amplitudes of the wood at a given
coordinate. This one-dimensional analysis is important, but the method in this study takes this
one step further, into two-dimensional analysis.

ANALYSIS OF VIBRATIONAL MODES OF CHEMICALLY MODIFIED TONE WOOD 10
Figure 5. (a) Intensity of frequency being applied. (b) Waveform graph showing progression of applied frequencies
and amplitudes. (c) One-dimensional plot of the response frequencies and their amplitudes.
Two-dimensional vibrational analysis is important because it allows for data analysis of
more than just the major response frequencies of the unattached violin plates and tone wood
strips. This type of analysis looks at frequencies that are coupled with the major response
frequency. The best way to visualize it is with four circles attached in a line with springs in
between each one, as depicted in the cartoon of Figure 6. The three vibrational modes are
represented by V1, V2, and V3, respectively. When a specific frequency is applied at, for
example, V1, the goal is to analyze all frequencies produced. In this situation when V1 is applied,
the response frequencies would be V1 and V2 because the frequency put in is always put back
out, but V1 is coupled only to V2, so it has a lower amplitude but is seen by the detector. When
V2 is applied, all three frequencies are detected, because V2 is coupled to both V1 and V3, so all

ANALYSIS OF VIBRATIONAL MODES OF CHEMICALLY MODIFIED TONE WOOD 11
three have amplitude and respond to the applied frequency. Lastly, if V3 is applied, then V3 and
V2 will be detected due to their coupling.
Figure 6. Cartoon depiction of vibrational modes in a system.
This shows how modes are coupled and how big the harmonics and depth of the
frequencies created are. Using this method of analysis, a more complete picture of the major
response frequencies and their coupled, harmonic counterparts could be drawn, and conclusions
made about the effects of chemical modification on tone wood and its quality within violins.
Results
The unattached violin front plates had similar major response frequencies, but they
differed in their amplitudes and contour plot shapes. The two-dimensional plots revealed
multiple coupled frequencies with the major response frequencies, along with some frequencies
that appeared to be present as background all of the time. These plots are illustrated in Figure 7,
where the darker the color, the higher the amplitude. The graph on the left is the one-dimensional
plot with all of the response frequencies at that coordinate without showing any coupling. These
are the major response frequencies over the range of applied frequencies, with the highest
amplitudes occurring at approximately 250 and 430 Hz at this coordinate. Figure 7(b) shows the
principal response frequencies as the large diagonal line down the center with amplitude shown
in the negative direction. The fainter diagonal lines are the coupled frequencies, or harmonics,
that were detected along with the major response frequencies. These have significantly lower
amplitudes, which is expected from a coupled frequency, but their presence indicates coupling is
occurring within the wood. The vertical lines represent background noise, frequencies that were

ANALYSIS OF VIBRATIONAL MODES OF CHEMICALLY MODIFIED TONE WOOD 12
present in all of the samples taken and do not play a role in determination of the major response
frequencies.
Figure 7. (a) One-dimensional plot of response frequency versus applied frequency on the normally carved unattached violin front plate at coordinate (3, -6). (b) Two-dimensional plot illustrating the secondary harmonics
with frequency for the normally carved unattached violin front plate at coordinate (3, -6).
Once this was completed for the normally carved plate and the flat-carved violin plate,
analysis was done to determine the most common response frequencies throughout both plates;
these would be considered the major response frequencies. For the normally carved plate, the
four major response frequencies were 110, 250, 330, and 420 Hertz (Hz). Surface contour plots
of the violin plate at these four frequencies were created to provide a visual of the response
pattern over the entire plate. Figure 8 shows these plots for the normally carved unattached front
plate, where the color blue indicates higher amplitude and red indicates lower amplitude. Violins
tend to resonate best at lower frequencies, which matches the values gathered from this analysis.
There also appears to be some slight symmetry between the top half and bottom half of the plate
for most of the frequencies, which shows that the wood was carved well in a symmetric manner.
The bass bar and f-holes also show higher amplitudes, as the bass bar is on the right-hand side of

ANALYSIS OF VIBRATIONAL MODES OF CHEMICALLY MODIFIED TONE WOOD 13
the plate in the plots, and the f-holes are just inside the lower bout corners towards the center of
the plate in the surface contour plots.
Figure 8. Surface contour plots of the normally carved unattached violin front plate from left to right at 110, 250, 330, and 420 Hz.
These major response frequencies were tested with another method of analysis for
determining the vibrational modes of a violin plate called Chladni lines. This was done to
confirm that the values determined from the accelerometer were similar to the true modes of the
violin plate and were accurately determined. Chladni lines form when sand, or a similar grainy
material, moves from an even, scattered distribution across the plate and forms into a distinct line
pattern at the node of the plate for that specific frequency being applied. This process is shown in
Figure 9. The first image shows the initial scattered sand, with images two and three representing
the Chladni lines at 230 Hz and 340 Hz, respectively. These two nodes are similar to the two
major response frequencies of 250 Hz and 330 Hz found electronically on the plate.

ANALYSIS OF VIBRATIONAL MODES OF CHEMICALLY MODIFIED TONE WOOD 14
Figure 9. Images of the normally-carved unattached violin front plate with Chladni lines. From left to right, the initial sand scattering, 230 Hz Chladni line, and 340 Hz Chladni line.
This experiment was important to perform as it indicates that the two-dimensional
method devised in this study recognizes the major response frequencies in the same locations as
the traditional method of acoustic analysis. Ernst Chladni developed this method in the late 18th
century to reveal the complex patterns of vibration in a rigid surface.6 This method moves the
sand to areas of little to no vibrational motion when a frequency is applied to the plate, which are
called the nodal lines. These lines, when looked for in the accelerometer data, show up as low
amplitudes in the surface contour plots. While the grid system used may be too large to clearly
see the line pattern, there are similarities in the absence of sand in the center of the plate where
the plots show high vibrational motion. Performing the Chladni experiment supports the method
created here and acts as proof of concept that technology can do the same thing that sand and a
speaker can in terms of determining vibrational motion.
After analysis of the normally-carved front plate was completed, the second, flat-carved
plate was analyzed using the same accelerometer-based method. The four major response
frequencies for the flat plate were at 120, 250, 320, and 420 Hz, which are very similar to the

ANALYSIS OF VIBRATIONAL MODES OF CHEMICALLY MODIFIED TONE WOOD 15
normally-carved front plate. The surface contour plots at these frequencies are illustrated in
Figure 10, where blue color indicates higher amplitude and red indicates lower amplitude at that
coordinate on the plate. Across the entire plate, amplitudes were significantly lower than the
normally-carved front plate.
Figure 10. Surface contour plots of the flat-carved unattached violin front plate at the major resonance frequencies from left to right at 120, 250, 320, and 420 Hz.
The flat plate showed significantly lower amplitudes and lower symmetry across the
entire surface. This indicates a poor carving as the resonant frequencies do not appear much in
the top half of the plate, like they do in the normally-carved plate. The lack of symmetry is
expected as the plate was intentionally carved in a flat manner on the lower half to determine if
there were differences in the vibrational response patterns. Around the f-holes the amplitudes did
increase slightly, as expected from the normal plate, but the amplitudes are still much lower than
any seen on the normal plate. The resonance pattern of the flat plate appears to be primarily in
the lower half of the plate with only the f-holes giving a clear reason for increases in amplitudes.
With the preliminary study of the unattached violin front plates completed, chemical
modification of tone wood was performed. Strips of spruce tone wood of similar size, shape, and
mass were treated with various chemicals, as pictured in Figure 11. The treatments included a

ANALYSIS OF VIBRATIONAL MODES OF CHEMICALLY MODIFIED TONE WOOD 16
polymer solution, 12 Molar (M) and 6M sulfuric acid, sodium silicate solution, and brown
acrylic paint. For all treatments except the untreated control, acrylic paint, and 12M sulfuric acid,
the wood was first soaked in 6M sulfuric acid for three days, water for three days, acetone for
two days, and finally baked in an oven at 50°C overnight to drive out any remaining acetone
within the wood matrix. This soaking was done to leave as much of the cellulose base behind
while getting rid of the other organic matter within the wood matrix to allow for easier
penetration of the polymer and sodium silicate treatment solutions. The 6M sulfuric acid is a
moderately strong concentration of the strong acid, rendering it more useful for this process over
other strong acid options for acid treatment.
Figure 11. From left to right, the various treated tone wood strips: polymer solution, 12M H2SO4, untreated, sodium silicate solution, 6M H2SO4, brown acrylic paint.
The flexibility of the treated tone wood strips varied. The 12M sulfuric acid soak
disintegrated the outer half of the wood strip, leaving behind a very thin, brittle strip with dark
marks from the acid all over it, which is shown in the second from the left position in the figure.
Even though the strip lost a large portion of its mass and became extremely fragile, it was still
viable for vibrational analysis. The least flexible of the treated woods was the sodium silicate-
treated strip, as once the silicate hardened, it was essentially glass-coated wood. The polymer-

ANALYSIS OF VIBRATIONAL MODES OF CHEMICALLY MODIFIED TONE WOOD 17
treated wood was less flexible than the untreated wood, but still had some bend to it. The 6M
sulfuric acid and acrylic paint wood strips were similar in flexibility to the untreated wood.
The sodium silicate treatment was explored further in an attempt to replicate the work
done at Pacific Northwest National Laboratory with their quick petrification method mentioned
previously. Figure 12 is an image of the result of a piece of tone wood that had been soaked in
the sodium silicate solution under vacuum for approximately a week after baking in an oven at
700°C for several hours and cooling gradually. The image shows that the sodium silicate was
unable to fully penetrate the full thickness of the wood, resulting in the disintegration of the
interior of the strip from the high temperature. This showed an inefficiency with the soaking
method for the sodium silicate solution, and this path was taken no further.
Figure 12. Image of the sodium silicate treated tone wood strip after baking, exhibiting the absence of the interior of the wood strip.
A purely silicate-carbon strip was also tested in the oven, to determine if the organic
matter from the wood was the issue in the first attempt, or if it was something else. The strip was
made using a mold and filling it with a mixture of one part carbon to five parts sodium silicate
solution and allowing it to dry completely before heating. Once dried, the strip was analyzed in
the chamber to look at its vibrational response before and after heating. However, after baking in
the oven, the strip deformed and curled significantly, rendering it useless for vibrational analysis

ANALYSIS OF VIBRATIONAL MODES OF CHEMICALLY MODIFIED TONE WOOD 18
post-heating, but the data collected before was still applicable. This strip provides insights into
how non-wood materials compare to untreated and chemically modified tone wood. The major
response frequencies for the tone wood strips were similar to the unattached violin front plates,
as seen in Figure 13.
Figure 13. (a) One-dimensional plot of response frequency versus applied frequency at the midpoint on the untreated tone wood strip. (b) Two-dimensional plot illustrating the secondary harmonics with frequency at the
midpoint on the untreated tone wood strip.
The two-dimensional analysis plot on the right shows frequencies coupled with the major
response frequencies distinctly, along with some new background frequencies. In this instance,
the one-dimensional plot shows the major response frequencies to be at 250, 360, and 400 Hz,
which are close to the unattached violin plate major response frequencies detailed earlier in this
study. The resonance pattern over the strip appears to be similar to that of the unattached violin
plates, with the center vibrating and resonating the most, and the endpoints resonating the least.
This is illustrated in the surface contour plot in Figure 14, which shows the pattern at 290 Hz.
The axis on the left indicates the height of the strip, and the right axis indicates the width of the
strip. The strip was approximately eight millimeters thick. The purple color means higher
amplitude while red means lower amplitude at that location. All points were measured at the
center of the strip.

ANALYSIS OF VIBRATIONAL MODES OF CHEMICALLY MODIFIED TONE WOOD 19
Figure 14. Surface contour plot of the carbon-sodium silicate tone wood strip at a major resonance frequency of 290 Hz, with the untreated tone wood strip as reference.
This is indicative of the tone wood strips acting as a pseudo-miniature version of the
violin plates with the middle providing the most response and the outer ends providing a minimal
response. The significantly low response at six and twelve centimeters on the strip may indicate a
more complicated resonance pattern within the strip, but it is unclear at this time what it may
mean. The symmetry within the strip is reflective of the unattached violin plates between the top
and bottom halves, further strengthening the argument for the wood strips modeling the plates. A
diagram of this resonance pattern is illustrated below in Figure 15. The wood is moving such that
the most movement occurs directly in the center, with less movement occurring just outside the
center, and moderate outer edge movement. This movement of the tone wood strip mimics that
of the violin plate, supporting the wood strips acting as models for the plates.

ANALYSIS OF VIBRATIONAL MODES OF CHEMICALLY MODIFIED TONE WOOD 20
Figure 15. Diagram of tone wood strip vibrational movement pattern.
The major response frequencies and amplitudes at both the midpoint and endpoint for all
of the tone wood treatments are shown in Table 1. The untreated frequencies and amplitudes are
underlined for clarity purposes in determining how the treatments deviated from these responses.
The middle and end were selected based on a hypothesis that they would be similar in response
amplitudes and frequency to the full violin plates, so a full nodal analysis was not completed on
all of the treatments because of that. The untreated response frequencies were very similar to the
unattached violin front plate.
Table 1. Major response frequencies and their corresponding amplitudes for all tone wood treatments at the midpoint and endpoint of the wood strip.
Major Response Frequencies
Treatment Middle Point: Frequency/Amplitude Bottom Point: Frequency/Amplitude
Untreated 240/10 360/75 400/25 10/13 240/4 360/13
Polymer 250/65 385/68 400/90 20/12 300/11.5 390/18
6M H2SO4 320/30 350/40 400/26 10/25 260/7.5 380/24
12M H2SO4 280/140 340/100 420/60 5/93 290/18 370/38
Acrylic Paint 270/125 360/50 420/30 15/5 290/16 370/7.5
Sodium Silicate 310/12 360/10.5 410/19 20/4 160/1 330/2 Clear differences in response frequencies and amplitudes appeared between the midpoint
and endpoint for all of the treatments. The midpoint consistently had much higher amplitudes
than the endpoint for each strip. All of the treated woods aside from the acrylic paint showed

ANALYSIS OF VIBRATIONAL MODES OF CHEMICALLY MODIFIED TONE WOOD 21
shifts in the response frequencies in comparison to the untreated tone wood. Overall, the
differences in response frequencies on the plates and strips illustrate that the two-dimensional
analysis is effective in comparing different materials and shapes to each other that can be applied
to determining the quality of material or plate being studied.
Discussion
The two-dimensional vibrational analysis of both the unattached violin front plates and
the chemically modified tone wood provides great insights into how violin modes change with
applied frequency. Between the two unattached front plates, the four major response frequencies
were analogous. The normally-carved plate resonated most at 110, 250, 330, and 420 Hz, while
the flat-carved plate resonated most at 120, 250, 320, and 420 Hz. This indicates that the shape
of the violin likely does not play a major role in which frequencies resonate most throughout the
entire plate. However, the symmetry of the plate is considerably changed, and this was reflected
in the surface contour plots; the flat plate primarily resonated in the lower half, while the normal
plate had good top and bottom symmetry for frequency and amplitudes. Furthermore, the
amplitudes of the flat plate were consistently much lower than the normal plate, meaning the
coupled frequencies were also present in a much smaller capacity, and the sound produced would
be lesser in quality than a normal violin. The method used here detected these differences, and it
can be applied in determining violin quality based on the front plate curvature; the flatter the
plate, the lower the volume and quality of sound and resonance the violin will have in
comparison to a nicely curved violin plate.
Performing the Chladni lines experiment was important because it supports this method
as a proof of concept that the computer program can find the same vibrational nodes that the
sand does for the Chladni lines. While the nodal lines in the sand form based on sending a single

ANALYSIS OF VIBRATIONAL MODES OF CHEMICALLY MODIFIED TONE WOOD 22
specific frequency at the violin plate, the method using the accelerometer at various locations
over a range of frequencies maps out these nodal areas at each coordinate. This experiment also
shows why amplitudes at a given coordinate changes with the frequency applied because
different parts of the plate resonate more in different locations than others at any given
frequency. It allows for the violin nodes to be mapped and then analyzed for the quality of sound
the violin will produce based on those nodes.
The chemical modification of the tone wood strips illustrates the need for quality
materials when constructing a violin in order to produce the desired sound. The response
frequencies shifted in one direction or the other for all of the treatments aside from the acrylic
paint when compared to the untreated wood. The paint did not shift due to the paint being an
extremely thin surface layer on top of the wood, rather than a full soak in the paint that
penetrated the wood fully. The polymer treated wood had an approximate mass of one-and a half
that of the untreated control, and it shifted frequencies about 10 Hz with comparable amplitudes
at both points. The sodium silicate treatment weighed twice that of the untreated control and
shifted frequencies lower by approximately 20 Hz with amplitudes lower by over a factor of two,
indicating that the silicate affects the amount of vibration that occurs the in the wood due to its
glass-like nature after hardening. Using this type of material would likely pose issues for violins
as it would require much more effort to get sound out of the violin because it would resonate
less. For the two sulfuric acid treatments, the 12M treated wood had half the mass of the
untreated wood and shifted at least 20 Hz to higher frequencies with approximately one-and-a-
half times the amplitude. The amplitudes were likely due to the thinness of the wood allowing
for the vibrational response to be more amplified. The 6M acid treatment had similar mass to the
untreated control, with slightly higher peak shifts of roughly 20 Hz but amplitudes close to the

ANALYSIS OF VIBRATIONAL MODES OF CHEMICALLY MODIFIED TONE WOOD 23
untreated wood’s amplitudes. These results from the two acid treatments indicates that mass may
play a larger role than previously expected in violin resonance and sound quality. Lastly, the one
to five ratio of carbon to sodium silicate solution strip produced major response frequencies and
amplitudes to the untreated control wood with one-and-a-half times more mass. However,
because it did not contain wood, the relationship between mass and frequency response cannot
be applied. This “synthetic” strip shows that fully non-wood materials can be analyzed with this
method and the response directly compared to other materials and treatments.
Through this study, the tone wood showed a relationship between mass and amplitude of
the major response frequencies. The larger the mass, the lower the vibrational amplitude, which
is caused by a greater absorbance of the sound by the wood. For the lighter masses, the
amplitudes were higher, and a higher response frequency was achieved due to less sound
absorption by the wood. As was discovered with one test of the sodium silicate treatment, the
inability for this treatment, and potentially others, to fully penetrate the wood may have impacted
the results as the interior of the wood strip was untouched. This instead makes the treatment
more of a surface layer over top of the wood strip, with a minimal amount actually settling into
the tone wood. This two-dimensional vibrational analysis method can also be applied to synthetic
materials with reasonable accuracy as seen with the carbon and sodium silicate mixture strip.
Overall, the treatments affected the vibrational response of the tone wood strips in both
directions for amplitude and response frequencies produced, indicating the method works and the
treatments did alter the structural makeup of the wood for those differences to be detectable.
Conclusions
Chemical treatment and the impact of coating such as varnish on instrument quality have
been a topic of study for centuries. Firstly, the quality of the carving and curvature of the

ANALYSIS OF VIBRATIONAL MODES OF CHEMICALLY MODIFIED TONE WOOD 24
unattached violin front plates changed which part of the plate had the highest amplitudes for the
major response frequencies. The normally-carved front plate showed a clearer pattern of
vibrational nodes at two of the major response frequencies, 250 and 330 Hz. The bass bar and f-
holes also showed larger amplitudes on this plate due to less sound absorbance occurring near
those locations. This plate also showed good symmetry between the top and bottom halves, with
similar amplitudes occurring at opposing coordinates. On the other hand, the flat plate had low
amplitudes across the whole plate, indicating high sound absorbance, with most of the response
occurring in the lower half of the plate. These two plates illustrate the effectiveness of this two-
dimensional analysis method for detecting differences in sound quality based on the curvature
and carving of an unattached front plate.
Using strips of tone wood as a model for violin plates, these studies show the relative
impact of surface treatment of tone wood to the vibrational response from applied frequencies.
Although greatly simplified, a single strip of tone wood mimics the nodal characteristics of a full
violin plate. This is shown by the large differences in amplitudes from the end to the center of
the strip, with the middle of the strip resonating with the highest amplitudes and a significant
drop in amplitudes at the ends of the strip. This suggests that the ends of the tone wood strip act
as nodal points with the center of the strip acting as the active mode, or the part where sound
resonates and is produced.
These studies suggest that surface treatment of the tone wood is largely negligible in
terms of vibrational response compared to the mass of the material used. In the experiments
detailed previously, the larger mass of the sodium silicate treated tone wood resulted in a
significant drop in amplitude and shifting of major resonance frequencies to lower values; the
smaller mass of the 12M sulfuric increased in response amplitude and resonated at slightly

ANALYSIS OF VIBRATIONAL MODES OF CHEMICALLY MODIFIED TONE WOOD 25
higher response frequencies compared to the untreated tone wood strip. Therefore, it is
reasonable to predict that the lighter and thinner the material used in construction, the higher the
vibrational response and greater the sound produced from the violin.
The data gathered in this study provides the starting point to having a fully quantitative
method of analysis for judging the quality of violins and other string instruments. Two-
dimensional analysis of the vibrational modes of both unattached violin plates and chemically
modified tone wood strips revealed important information about both things. Firstly, that this
method allows for mapping out of violin plates based on major response frequencies and
amplitudes to find the nodal patterns that each violin plate has, which can be corroborated with
the Chladni lines experiment. Secondly, differences in the carving and shape of the plates were
detected by the accelerometer and were seen to be significant based on amplitudes and regions of
resonance in both plates. The chemical modification revealed that thin surface layers do not play
a large role in determining response frequencies, but if the applied material penetrates the
interior and leaves an outer coating, then the response frequencies and amplitudes may change. It
did show a relationship between mass and response frequency amplitudes, though, leading to the
conclusion that thinner, less massive materials will produce more sound than thick, heavy
materials will in instruments. All of this information is helpful in creating a solid method of
analysis for instrument quality that is objective and quantitative, which has been lacking in the
field for a long time because subjective judging has been the only realistic method until recently.
Future Work
Future work will concentrate on multiple avenues with synthetic materials using the two-
dimensional vibrational modal analysis method to quantitatively determine violin and other
string instrument quality. The reason for this is to expand the reaches of this method and reduce

ANALYSIS OF VIBRATIONAL MODES OF CHEMICALLY MODIFIED TONE WOOD 26
the current limitations of the study. This study was limited by only looking at unattached violin
front plates and chemically modifying only tone wood strips. Analysis of a complete violin and
chemically treated unattached plates and full violins also should be done to fully determine how
response frequencies can change throughout the construction process. More work will be
completed on studying the effects on vibrational response of a very thinly-carved violin front
plate to compare it to the previously studied unattached front plates. For chemical modification,
studying synthetic materials to replace wood, such as a combination of carbon, bismuth, and
sodium silicate, will also be done to see how various mixtures of non-wood materials compares
to wood and to each other in terms of vibrational response.
A violin front plate, full violin, and strip of “tone wood” will be 3-D printed to determine
if plastic can be analyzed with this method. All three of these would then be comparable to the
wood analyzed in this study. Analysis of carbon fiber in some manner would also be a good idea,
as it is becoming more prevalent for those who can afford an instrument made of that material,
because they have comparable sound quality to classic violins. Luthiers and musicians could then
directly compare carbon fiber, plastic, and classic wooden violins quantitatively with results
from this analysis method in conjunction with their subjective feelings towards the different
materials and sound production of each violin. Overall, more study on the effects of various
materials, varnishes, and other applicable treatments used on violins and other string instruments
needs to be done in order to generate enough applicable, reliable data to have a fully objective,
quantitative view on the quality of an instrument.

ANALYSIS OF VIBRATIONAL MODES OF CHEMICALLY MODIFIED TONE WOOD 27
References
1. Nagyvary, J. J. of the Violin Soc. Of Am. 1981, 2: 57.
2. Wegst, U. G. K. Am. J. of Botany, 2006, 93(10): 1439-1448.
3. Rymer, Russ. “Saving the Music Tree.” Smithsonian Magazine, 2004.
4. Dunlop, J. I. Australian Acoustical Society. 1989, 17: 36.
5. Nagyvary, J. Chem. Eng. News. 1988, 24.
6. Hutchins, C. M. Scientific American, 1981, 245(4): 170-186.
7. Skrodzka, E. B., et al. Archives of Acoustics, 2013, 38(1): 75-81.
8. Ono, T., and Isomura, D. Acoust. Sci. & Tech. 2004, 25(6): 475-477.
9. Pacific Northwest National Laboratory. Want to petrify wood without waiting a few
million years? Try this. 2005. http://www.pnnl.gov/news/release.aspx?id=76
10. Noda, I. Appl. Spectrosc. 1993, 47: 1329.
11. Martin, C. J. Vibrational Analysis of Chemically Modified Wood. Masters’ Thesis.
University of Northern Iowa, Cedar Falls, IA, 2005.