analysis of uncertainties in infrared camera measurements of a turbofan engine in an altitude test...
TRANSCRIPT

Infrared Physics & Technology 48 (2006) 130–153
www.elsevier.com/locate/infrared
Analysis of uncertainties in infrared camera measurementsof a turbofan engine in an altitude test cell
T.A. Morris a,b, M.A. Marciniak a,*, G.C. Wollenweber c, J.A. Turk b
a Air Force Institute of Technology, Department of Engineering Physics, Wright-Patterson AFB, OH 45433, USAb Air Force Research Laboratory, Sensors Directorate, Wright-Patterson AFB, OH 45433, USA
c GE Aircraft Engines, Military Inlet and Exhaust Systems, Cincinnati, OH 45215, USA
Received 5 April 2005Available online 12 September 2005
Abstract
The infrared (IR) signature of a jet aircraft engine in altitude operation is a key component for the design of effectiveIR countermeasures and low-emission engines. Predicting the signature with radiometric models is widely accom-plished, but measurements in situ are crucial for model verification. The altitude test cell provides a venue for measuringthe IR signature in a simulated altitude environment, but the facility is designed for testing engines, not IR imaging. Asa result, the imaging in the test cell is laden with measurement uncertainty due to stray radiation from the facility struc-ture, hot exhaust gases, and the measurement equipment itself. Post-processing using correction factors is necessary toextract the engine signal from the stray radiation. This research investigated the uncertainties in measuring the IR sig-nature of a turbofan engine inside an altitude test cell. The engine is measured by an IR camera immersed in the hotexhaust gases 35 feet downstream from the on-engine axis view. A protective enclosure and zinc selenide (ZnSe) windowshield the camera from the heat and vibrations of the plume. The requirements for the IR measurement system includethe apparent intensity and radiance of the visible engine surfaces in three bands of operation, two Medium Wave IR(MWIR) bands and one Long Wave IR (LWIR), with a spatial resolution of 1 in. To explore the extent of the mea-surement uncertainties, a radiometric model of the altitude test cell is formulated to quantify the engine and stray flux.To increase the fidelity of the model, the ZnSe window, a source of stray radiation, is characterized through measure-ments and experimentation. The resulting data is employed in the radiometric model. Specific measurement conditionsat which the stray radiation is 5% or less of the total radiation are then derived, thereby decreasing the necessity forpost-processing correction factors. These conditions are derived for the 3–4-, 4.5–5-, 8–9- and 8–12-lm bands usinga parametric analysis. Two LWIR bands are considered to provide insight into specific previous measurements madewith a quantum-well IR photo-detector (QWIP, roughly 8–9 lm), as well as potential future measurements made usingbroader band imagers (e.g., HgCdTe at 8–12 lm). A sensitivity analysis in the style of a Monte Carlo simulation is alsoperformed to gauge the uncertainty in the radiometric model calculations.Published by Elsevier B.V.
1350-4495/$ - see front matter Published by Elsevier B.V.doi:10.1016/j.infrared.2005.07.001
* Corresponding author.E-mail address: [email protected] (M.A. Marciniak).

T.A. Morris et al. / Infrared Physics & Technology 48 (2006) 130–153 131
Keywords: Infrared radiation; Infrared optical systems; Infrared windows; Spectral emittance; Reflectance; Transmittance; Parametricanalysis; Turbofan engines; Altitude test cell
1. Introduction
Since the early 1950�s, infrared (IR)-guided mis-siles have been the most effective anti-aircraftweapon ever developed. From Vietnam throughDesert Storm, the missile lays claim to more air-craft shoot-downs than any other anti-aircraftsystem. Shoulder-fired IR-guided missiles, in par-ticular, are a vexing problem facing the UnitedStates (US) and other countries, today [1].
The accurate IR signature measurement of air-craft engines is paramount for designing effectivecountermeasures against IR-guided missiles.Radiometric software modeling is widely used topredict the IR signature of an engine, but IR mea-surements of a real engine at altitude are crucialfor verifying the computer models. One way toachieve this is to obtain the engine signature inan altitude test cell, where the engine can be mea-sured in simulated altitude operation. Since alti-tude test cells are typically employed to testengine performance, it a convenient to obtain theIR signature at the same venue. Efforts to do thishave been made. The National Aeronautics andSpace Administration (NASA) Glenn ResearchCenter measured the IR signature of a jet aircraftengine at the Propulsion Systems Laboratory(PSL) altitude test cell in the summer of 2002.The surface temperatures of the nozzle were thenderived from the signature data, but the tempera-tures did not generally agree with data fromthermocouples adhered to the nozzle. NASA ques-tioned the accuracy of the measurement systemand recommended improvements to reducemeasurement uncertainty. If these measurementuncertainties are analyzed, quantified, and con-trolled, however, the altitude test cell may be a via-ble measurement facility for IR signatures of jetengines.
The following objective, imaging configuration,and imaging requirements were supplied by Gen-eral Electric Aircraft Engines, and are as agreedupon by other contractors and government: (1)
The broad objective is to measure the IR signatureof an augmented turbofan engine in simulated alti-tude operation from within an altitude test cell.The signature data will be used to verify IR signa-ture predictions and engine surface temperaturesduring altitude operation. (2) The engine nozzleand directly visible surfaces are measured by anIR camera(s) immersed in the hot exhaust gasesapproximately 35 feet downstream of the nozzleaperture plane from the on-engine-axis view. Aprotective enclosure with an IR-transparent win-dow shields the camera(s) from the hot exhaustgases. (3) The objective described in (1) abovemust be achieved while in compliance with the fol-lowing requirements: the IR signature of the en-gine nozzle and directly visible surfaces must beobtained spectrally in three distinct atmospherictransmission windows—two Medium Wave IR(MWIR) bands and one Long Wave IR (LWIR)band; the IR data must be processed to reportboth in-band radiance (watts/cm2—steradian) ofthe engine surfaces with a spatial resolution of1 in., and apparent in-band radiant intensity(watts/steradian) of the engine cavity (both datasets must be reported for each of the three bands);the IR data will be obtained with a measurementuncertainty threshold of 10% or less with an objec-tive of 5% or less.
Ideally, the radiation incident on the infraredcamera is solely from the engine. In this scenario,the infrared signature can be determined directlyand the primary measurement uncertainty is fromthe camera response itself. In the altitude test cell,however, stray radiation from the facility struc-ture, camera enclosure, and IR-transparent win-dow are produced in addition to the engineradiation. The engine and stray radiation are alsoattenuated by the atmosphere and window, furtheraltering the signature data. As a result, post-pro-cessing is required to extract the engine radiationusing correction factors, not to mention the in-crease in detector noise. The correction factors,however, can contribute additional measurement
132 T.A. Morris et al. / Infrared Physics & Technology 48 (2006) 130–153
uncertainty because their application assumes anaccurate and complete knowledge of the measure-ment environment—spatially, spectrally, and tem-porally. In the altitude test cell, this assumption isnot easily achieved. Our approach is to decreasethe need for correction factors by determiningthe conditions in which the IR signature can bemeasured with minimal stray radiation. Thepotentially complicated post-processing to removethe stray radiation can then be decreased. The cor-rections for window and atmosphere attenuationwill not be eliminated, but the stray radiation, ifminimized to desired levels, can be consideredthe opportunity cost of using the altitude test cellas an IR measurement facility. With an emphasison pre-test planning rather than post-test analysis,the cost of obtaining accurate IR signature datacan be reduced.
2. IR imaging test at NASA Glenn
The NASA Glenn Research Center in Cleve-land, Ohio measured the IR signature of a turbo-fan engine in the summer of 2002 in the PSLaltitude test cell. The IR camera was sealed insidea water-cooled protective enclosure located 35 feetdownstream of the engine nozzle within the ex-haust collector. The enclosure was aligned withthe centerline of the nozzle. To capture the radia-tion from the nozzle, a window was placed onthe front side of the enclosure facing the engine.The output data from the camera was relayed toa dedicated computer via fiber optic cables.
NASA used the FLIR model SC-3000 infraredfocal plane array (FPA) for this test. It containsa 320 · 240 array of Sterling-cooled gallium arse-nide (GaAs) quantum-well IR photo-detectors(QWIP) with a 20� by 15� FOV [2]. The IFOV is1.1 milli-radians which projects to an area ofapproximately 34.4 mm2 on the engine plane.The spectral range of the camera is reported as8.0–9.0 lm, corresponding to the wavelengthswhere the camera response was down 50% fromthe measured peak value. The SC-3000 is pre-cali-brated to temperature for a range of �4 �F to2732 �F. For NASA�s test, the aperture was setto measure in a range from 32 to 930 �F.
A zinc-selenide (ZnSe) window with an anti-reflection (AR) coating served as the opticalview-port for the protective enclosure. To coolthe window and prevent temperature gradients,air was blown over the exterior surface of the win-dow. Without the air stream, soot was also ex-pected to collect on the window, clouding theview of the engine. The AR-coated ZnSe windowwas selected because it is highly transmissive inthe LWIR. The transmittance of the window wasreported as 0.80 without spectral variation. A nar-cissistic reflection was observed during the initialinstallation of the camera in the periscope enclo-sure at ambient temperature conditions. Theengine was not running at the time. The effect ofthe narcissistic reflection was amplified becausethe camera was set in auto-scale mode.
A flat-field correction (i.e., non-uniformity cor-rection) was performed prior to engine-start toremove the constant contribution from the narcis-sistic reflection. Unfortunately, the flat-field cor-rection also flattened the pixels imaging twoblackbodies which were planned to be used asin situ calibration sources.
Prior to the test, the SC-3000 temperature cali-bration was verified using a CI Systems model SR-20 cavity blackbody. The blackbody was placed 10feet in front of the camera and cycled through tem-peratures from 100 to 500 �F in 50 �F increments.At each temperature set-point, the temperaturereading from the camera was recorded. Once thecamera was mounted inside the periscope, the cal-ibration was re-verified using Omega Engineeringmodel BB-703 micro-blackbodies. Following thetest, the temperature calibration was verified afinal time using the CI Systems SR-20 blackbody.An accuracy of approximately ±2% was reportedfor each case. Forty thermocouples were mountedon the exhaust collector walls and nozzle to obtainphysical temperatures that could be compared tothe radiometrically-derived temperatures. Temper-atures ranged from 60 to 107 �F.
After engine start-up, five images of the enginewere recorded. To determine the temperature dis-tribution across the visible portions of the engine,a FLIR software package called ThermaCAM wasused. To extract the target signal, it compensatesfor the measurement environment by allowing

T.A. Morris et al. / Infrared Physics & Technology 48 (2006) 130–153 133
the user to specify window transmittance (0.8),window temperature (110 �F), image distance (35feet), atmospheric temperature and humidity(20%), ambient temperature (200 �F), and targetemittance. All of these software inputs are single-valued and do not allow for spectral quantities.ThermaCAM uses the window temperature andtransmittance to compensate for the emissionand attenuation of the window. The image dis-tance, atmosphere temperature, and atmosphererelative humidity are used by ThermaCAM tocompute the effective atmosphere transmittance.
With the window, atmosphere, and ambientreflections accounted for, ThermaCAM then com-puted the nozzle temperature for each pixel. Inpost-processing, the per-pixel radiance was calcu-lated by integrating the Planck function for eachof the computed temperatures; the integrationwas performed for both the 3–5- and 8–12-lmbands. Since the 20� · 15� FOV translates to a9.2 · 12.3 foot2 area in the nozzle plane, many ofthe pixels were outside of the nozzle boundary.These pixels were removed in software by perform-ing a threshold test. The total intensity of the en-gine was computed by multiplying the projectedpixel area in the engine plane by the sum of theradiances for each pixel.
3. Measurement and experimentation of the
ZnSe window
The AR-coated ZnSe window plays a pivotalrole in the altitude test cell. Its transmittance,reflectance, and emittance are important factorsin the level of the radiation that reaches the cam-era. The transmittance determines the amount ofradiation exterior to the camera enclosure thatreaches the camera. A high transmittance maxi-mizes the strength of the engine and stray radia-tion, whereas a low emittance minimizes theradiation from the window itself. The reflectanceof the window is important because it dictatesthe amount of radiation that is reflected off thewindow and into the camera from the protectivecamera enclosure. These characteristics may alsobe a function of temperature, possibly necessi-tating an in situ temperature measurement if
post-processing of the imaging data is to beperformed.
To test the window�s ability to transmit IR radi-ation in the MWIR and LWIR, the spectral trans-mittance was measured at normal incidence, aswell as a series of off-normal angles of incidence.For comparison, an additional AR-coated ZnSewindow was measured at normal incidence. Final-ly, the transmittance of an uncoated ZnSe windowwas measured to highlight the effect of the ARcoating.
The transmittance at normal incidence wasmeasured using a Bomem DA3.02 FTIR spec-trometer with a silicon carbide glow-bar, mercurycadmium telluride (MCT) detector, and Lab-Sphere custom gold integrating sphere. The NASAwindow is 5 in. in diameter and 0.5 in. thick. It istoo large to fit inside the integrating sphere, so itwas placed directly in front of the sphere inputport. The additional window measured was smallenough to fit inside the integrating sphere, as it isonly 2 in. in diameter. Prior to the measurementof both windows, the instrument was purged. Tomeasure the transmittance of the large NASA win-dow at off-normal angles, a Bomem MB-157 FTIRspectrometer was employed. This instrument wasalso used to measure the transmittance of the un-coated ZnSe window. The instrument was notpurged prior to the measurement. Spatial averag-ing was not performed with either of the mea-surements with the large window due to thedegradation of the AR coating.
The NASA window has a higher transmittancein the MWIR and LWIR than the smaller window.The smaller window sacrifices a slight drop intransmittance for a wider operational bandwidthin the SWIR below 3 lm. The transmittance ofboth windows peaks between 9 and 10 lm, andthen rolls off to approximately 0.7 at 15 lm. (Mea-surement uncertainty in this data is 2%.) An oscil-lating pattern of both transmittance curves isindicative of the spectral dependence on the tuningof the AR coating. A dip in transmittance centeredat 6 l m is primarily the result of increased reflec-tion as opposed to increased absorption, i.e., emit-tance. The falloff in the LWIR is the result of bothan increased reflectance and emittance. The ARcoating is tuned for maximum transmittance in
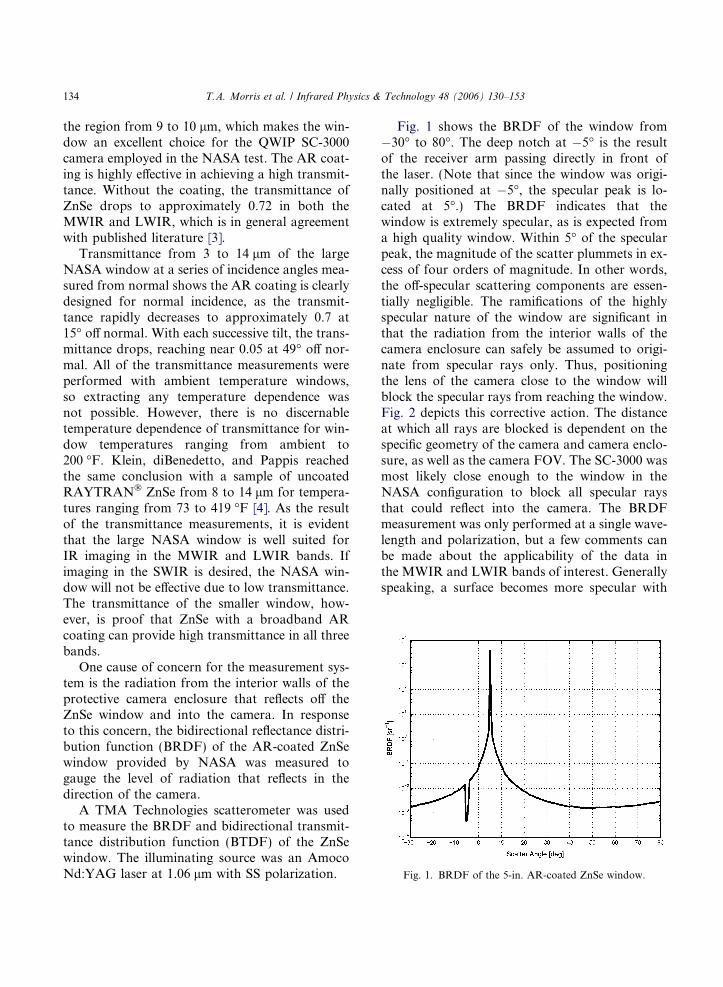
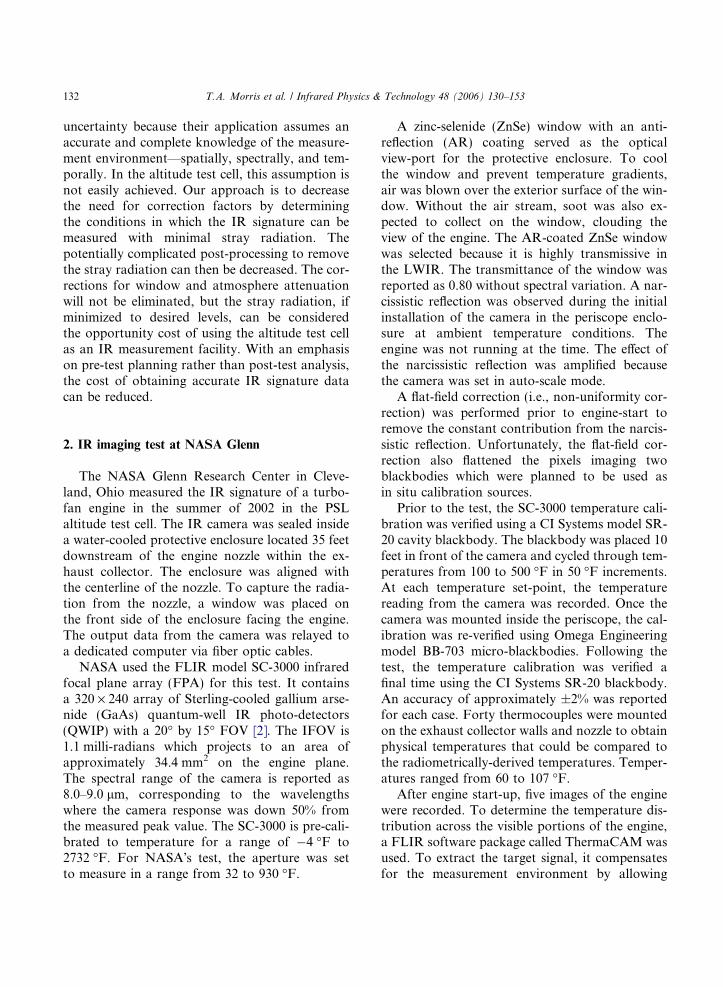
Fig. 1. BRDF of the 5-in. AR-coated ZnSe window.
134 T.A. Morris et al. / Infrared Physics & Technology 48 (2006) 130–153
the region from 9 to 10 lm, which makes the win-dow an excellent choice for the QWIP SC-3000camera employed in the NASA test. The AR coat-ing is highly effective in achieving a high transmit-tance. Without the coating, the transmittance ofZnSe drops to approximately 0.72 in both theMWIR and LWIR, which is in general agreementwith published literature [3].
Transmittance from 3 to 14 lm of the largeNASA window at a series of incidence angles mea-sured from normal shows the AR coating is clearlydesigned for normal incidence, as the transmit-tance rapidly decreases to approximately 0.7 at15� off normal. With each successive tilt, the trans-mittance drops, reaching near 0.05 at 49� off nor-mal. All of the transmittance measurements wereperformed with ambient temperature windows,so extracting any temperature dependence wasnot possible. However, there is no discernabletemperature dependence of transmittance for win-dow temperatures ranging from ambient to200 �F. Klein, diBenedetto, and Pappis reachedthe same conclusion with a sample of uncoatedRAYTRAN� ZnSe from 8 to 14 lm for tempera-tures ranging from 73 to 419 �F [4]. As the resultof the transmittance measurements, it is evidentthat the large NASA window is well suited forIR imaging in the MWIR and LWIR bands. Ifimaging in the SWIR is desired, the NASA win-dow will not be effective due to low transmittance.The transmittance of the smaller window, how-ever, is proof that ZnSe with a broadband ARcoating can provide high transmittance in all threebands.
One cause of concern for the measurement sys-tem is the radiation from the interior walls of theprotective camera enclosure that reflects off theZnSe window and into the camera. In responseto this concern, the bidirectional reflectance distri-bution function (BRDF) of the AR-coated ZnSewindow provided by NASA was measured togauge the level of radiation that reflects in thedirection of the camera.
A TMA Technologies scatterometer was usedto measure the BRDF and bidirectional transmit-tance distribution function (BTDF) of the ZnSewindow. The illuminating source was an AmocoNd:YAG laser at 1.06 lm with SS polarization.
Fig. 1 shows the BRDF of the window from�30� to 80�. The deep notch at �5� is the resultof the receiver arm passing directly in front ofthe laser. (Note that since the window was origi-nally positioned at �5�, the specular peak is lo-cated at 5�.) The BRDF indicates that thewindow is extremely specular, as is expected froma high quality window. Within 5� of the specularpeak, the magnitude of the scatter plummets in ex-cess of four orders of magnitude. In other words,the off-specular scattering components are essen-tially negligible. The ramifications of the highlyspecular nature of the window are significant inthat the radiation from the interior walls of thecamera enclosure can safely be assumed to origi-nate from specular rays only. Thus, positioningthe lens of the camera close to the window willblock the specular rays from reaching the window.Fig. 2 depicts this corrective action. The distanceat which all rays are blocked is dependent on thespecific geometry of the camera and camera enclo-sure, as well as the camera FOV. The SC-3000 wasmost likely close enough to the window in theNASA configuration to block all specular raysthat could reflect into the camera. The BRDFmeasurement was only performed at a single wave-length and polarization, but a few comments canbe made about the applicability of the data inthe MWIR and LWIR bands of interest. Generallyspeaking, a surface becomes more specular with
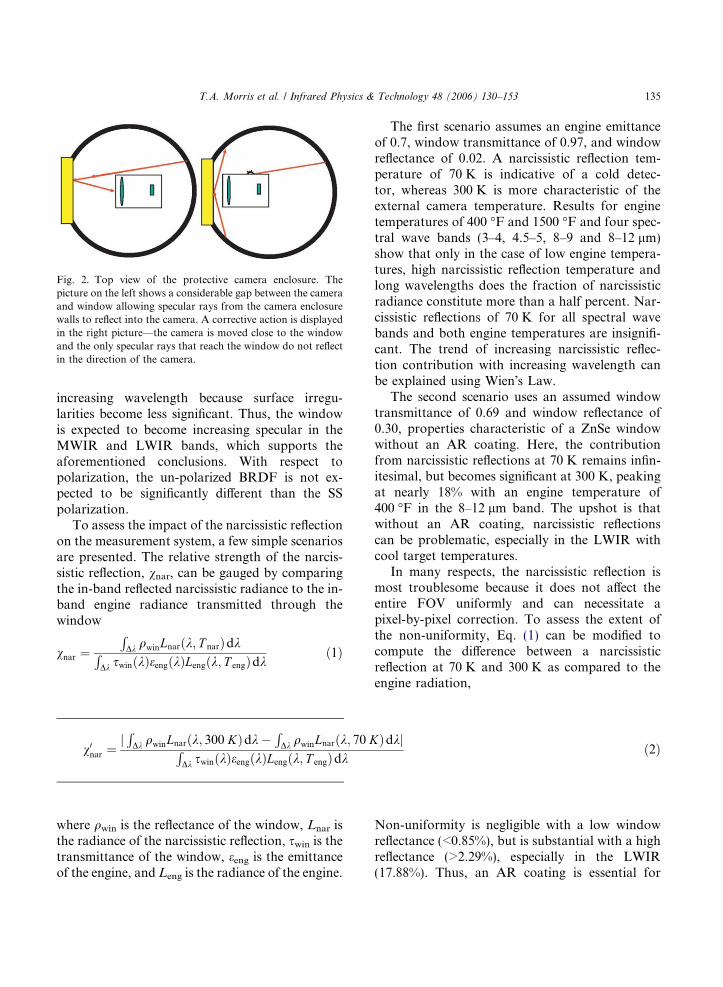
Fig. 2. Top view of the protective camera enclosure. Thepicture on the left shows a considerable gap between the cameraand window allowing specular rays from the camera enclosurewalls to reflect into the camera. A corrective action is displayedin the right picture—the camera is moved close to the windowand the only specular rays that reach the window do not reflectin the direction of the camera.
T.A. Morris et al. / Infrared Physics & Technology 48 (2006) 130–153 135
increasing wavelength because surface irregu-larities become less significant. Thus, the windowis expected to become increasing specular in theMWIR and LWIR bands, which supports theaforementioned conclusions. With respect topolarization, the un-polarized BRDF is not ex-pected to be significantly different than the SSpolarization.
To assess the impact of the narcissistic reflectionon the measurement system, a few simple scenariosare presented. The relative strength of the narcis-sistic reflection, vnar, can be gauged by comparingthe in-band reflected narcissistic radiance to the in-band engine radiance transmitted through thewindow
vnar ¼R
Dk qwinLnarðk; T narÞdkRDk swinðkÞeengðkÞLengðk; T engÞdk
ð1Þ
v0nar ¼jR
Dk qwinLnarðk; 300 KÞdk�R
Dk qwinLnarðk; 70 KÞdkjRDk swinðkÞeengðkÞLengðk; T engÞdk
ð2Þ
where qwin is the reflectance of the window, Lnar isthe radiance of the narcissistic reflection, swin is thetransmittance of the window, eeng is the emittanceof the engine, and Leng is the radiance of the engine.
The first scenario assumes an engine emittanceof 0.7, window transmittance of 0.97, and windowreflectance of 0.02. A narcissistic reflection tem-perature of 70 K is indicative of a cold detec-tor, whereas 300 K is more characteristic of theexternal camera temperature. Results for enginetemperatures of 400 �F and 1500 �F and four spec-tral wave bands (3–4, 4.5–5, 8–9 and 8–12 lm)show that only in the case of low engine tempera-tures, high narcissistic reflection temperature andlong wavelengths does the fraction of narcissisticradiance constitute more than a half percent. Nar-cissistic reflections of 70 K for all spectral wavebands and both engine temperatures are insignifi-cant. The trend of increasing narcissistic reflec-tion contribution with increasing wavelength canbe explained using Wien�s Law.
The second scenario uses an assumed windowtransmittance of 0.69 and window reflectance of0.30, properties characteristic of a ZnSe windowwithout an AR coating. Here, the contributionfrom narcissistic reflections at 70 K remains infin-itesimal, but becomes significant at 300 K, peakingat nearly 18% with an engine temperature of400 �F in the 8–12 lm band. The upshot is thatwithout an AR coating, narcissistic reflectionscan be problematic, especially in the LWIR withcool target temperatures.
In many respects, the narcissistic reflection ismost troublesome because it does not affect theentire FOV uniformly and can necessitate apixel-by-pixel correction. To assess the extent ofthe non-uniformity, Eq. (1) can be modified tocompute the difference between a narcissisticreflection at 70 K and 300 K as compared to theengine radiation,
Non-uniformity is negligible with a low windowreflectance (<0.85%), but is substantial with a highreflectance (>2.29%), especially in the LWIR(17.88%). Thus, an AR coating is essential for
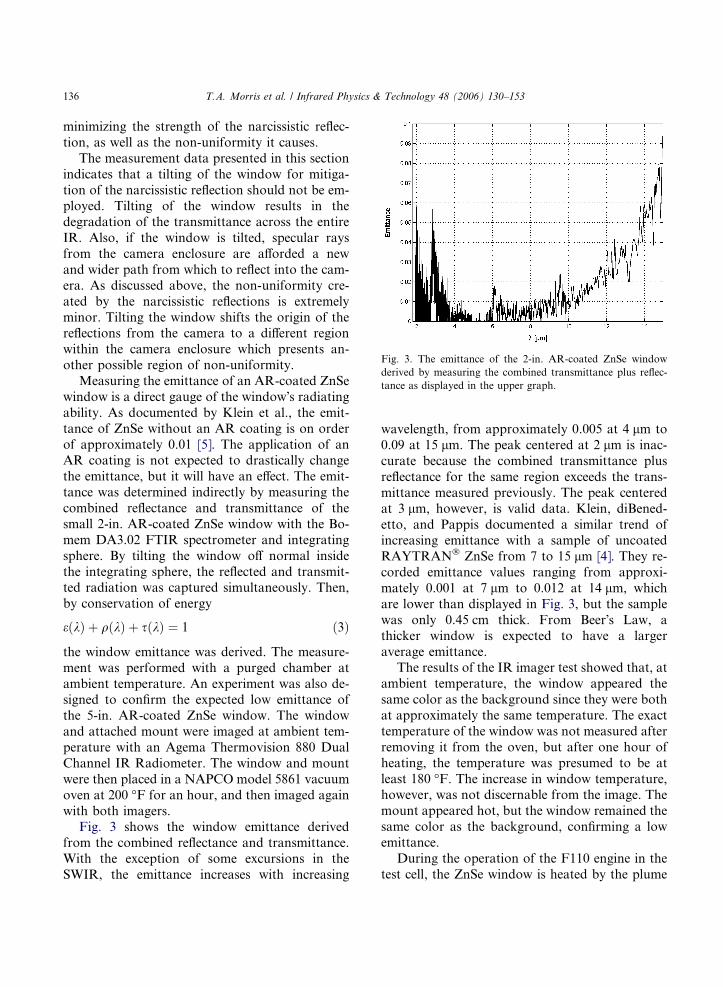
Fig. 3. The emittance of the 2-in. AR-coated ZnSe windowderived by measuring the combined transmittance plus reflec-tance as displayed in the upper graph.
136 T.A. Morris et al. / Infrared Physics & Technology 48 (2006) 130–153
minimizing the strength of the narcissistic reflec-tion, as well as the non-uniformity it causes.
The measurement data presented in this sectionindicates that a tilting of the window for mitiga-tion of the narcissistic reflection should not be em-ployed. Tilting of the window results in thedegradation of the transmittance across the entireIR. Also, if the window is tilted, specular raysfrom the camera enclosure are afforded a newand wider path from which to reflect into the cam-era. As discussed above, the non-uniformity cre-ated by the narcissistic reflections is extremelyminor. Tilting the window shifts the origin of thereflections from the camera to a different regionwithin the camera enclosure which presents an-other possible region of non-uniformity.
Measuring the emittance of an AR-coated ZnSewindow is a direct gauge of the window�s radiatingability. As documented by Klein et al., the emit-tance of ZnSe without an AR coating is on orderof approximately 0.01 [5]. The application of anAR coating is not expected to drastically changethe emittance, but it will have an effect. The emit-tance was determined indirectly by measuring thecombined reflectance and transmittance of thesmall 2-in. AR-coated ZnSe window with the Bo-mem DA3.02 FTIR spectrometer and integratingsphere. By tilting the window off normal insidethe integrating sphere, the reflected and transmit-ted radiation was captured simultaneously. Then,by conservation of energy
eðkÞ þ qðkÞ þ sðkÞ ¼ 1 ð3Þ
the window emittance was derived. The measure-ment was performed with a purged chamber atambient temperature. An experiment was also de-signed to confirm the expected low emittance ofthe 5-in. AR-coated ZnSe window. The windowand attached mount were imaged at ambient tem-perature with an Agema Thermovision 880 DualChannel IR Radiometer. The window and mountwere then placed in a NAPCO model 5861 vacuumoven at 200 �F for an hour, and then imaged againwith both imagers.
Fig. 3 shows the window emittance derivedfrom the combined reflectance and transmittance.With the exception of some excursions in theSWIR, the emittance increases with increasing
wavelength, from approximately 0.005 at 4 lm to0.09 at 15 lm. The peak centered at 2 lm is inac-curate because the combined transmittance plusreflectance for the same region exceeds the trans-mittance measured previously. The peak centeredat 3 lm, however, is valid data. Klein, diBened-etto, and Pappis documented a similar trend ofincreasing emittance with a sample of uncoatedRAYTRAN� ZnSe from 7 to 15 lm [4]. They re-corded emittance values ranging from approxi-mately 0.001 at 7 lm to 0.012 at 14 lm, whichare lower than displayed in Fig. 3, but the samplewas only 0.45 cm thick. From Beer�s Law, athicker window is expected to have a largeraverage emittance.
The results of the IR imager test showed that, atambient temperature, the window appeared thesame color as the background since they were bothat approximately the same temperature. The exacttemperature of the window was not measured afterremoving it from the oven, but after one hour ofheating, the temperature was presumed to be atleast 180 �F. The increase in window temperature,however, was not discernable from the image. Themount appeared hot, but the window remained thesame color as the background, confirming a lowemittance.
During the operation of the F110 engine in thetest cell, the ZnSe window is heated by the plume

Fig. 4. (a) Measured radiance reveals a slight increase withwindow temperature, indicating a small window emittance; (b)a zoomed-in view in the LWIR.
T.A. Morris et al. / Infrared Physics & Technology 48 (2006) 130–153 137
to temperatures ranging from ambient to 200 �F.The goal of the experimentation is to characterizethe radiation from the window at a series of ele-vated temperatures by measuring the spectral radi-ance at each temperature. Spectral radiance curvesfrom theoretical models are then compared to themeasured data. In order to assess the fit of the the-oretical curves to the measured curves, a figure ofmerit (FOM) is used. The FOM is a normalizedroot-mean-square (rms) difference between the the-oretical and measured spectral radiance curves.The measured and theoretical radiances, Lmeasured
and Ltheoretical, are spectral quantities and as suchare treated as matrix quantities. The FOM is nor-malized to the maximum value of the measuredradiance in each band so that different bands canbe compared without bias. The FOM is computedfor the following five bands to gauge the curve fitin each band: 3–4, 4.5–5, 8–9, 8–12 and 3–12 lm.They are chosen to explore the requirements ofselective response with two MWIR bands andone LWIR bands, as stated above. The 3–12-lmband is used to assess the curve fits from a broad-band perspective.
The 5-in. AR-coated ZnSe window was posi-tioned on a table at 4.64 meters from a CI SystemsSR-5000 spectroradiometer and 0.8 meters in frontof a wall. A personal computer was used to config-ure the spectroradiometer, initiate imaging, andrecord data. The SR-5000 settings were: a 2-scircular-variable-filter scan time, 800-Hz chopperfrequency, 20 scans, amplification of 100, and 4-mrad field of view. The window was secured to amount and placed on a rotation stage allowingfor alignment of the window with respect to thespectroradiometer. To heat the window, heat tapewas wrapped around the perimeter of the windowwith temperature control provided by a Staco var-iable autotransformer. The temperature of thewindow was measured with an Omega Engineeringmodel CYD208 thermometer. It was uncertain ifthe window reached a steady state isothermal con-dition during the test, so the window was imagedas close as possible to the thermocouple. The tem-perature of the wall was measured with an Oak-tron thermometer. The spectral radiance of thewindow was determined by the following proce-dure: (1) calibrate SR-5000 to a reference black-
body; (2) image wall without window as abaseline measurement; (3) image window placedin front of the wall; (4) heat window to 100 �Fand repeat (3); (5) repeat (4) for window tempera-tures of 125, 150, 175 and 200 �F; (6) fit theoreticalcurves to the measured spectral radiance; and (7)extract the window radiance from the SR-5000radiance data.
Fig. 4 shows the measured radiance at windowtemperatures ranging from 68–202 �F with a stea-dy wall temperature of 68 �F. With each successiveincrease in window temperature, the radiance in-creases only by a small amount, thus indicating asmall window emittance, as predicted. In order

138 T.A. Morris et al. / Infrared Physics & Technology 48 (2006) 130–153
to fully characterize the window radiation, themeasured radiance is predicted using theoreticalcurves. Assuming the walls and atmosphere ofthe laboratory room are in thermal equilibrium,the measured radiance is a linear combination offour components: (1) the self-emission from thewindow; (2) reflected emission off the windowfrom the background; (3) the self-emission of thewall transmitted through the window; and (4) re-flected emission off the wall from the backgroundtransmitted through the window.
Theoretical curves are generated for each mea-sured window temperature and are plotted againstthe measured data from the SR-5000. The gray-body approximation is derived by minimizing theaverage FOM�s using a range of gray-body emit-tances for the 3–5-, 8–12- and 3–12-lm bands asfollows:
FOMavgðDk; ewinÞ ¼P6
i¼1FOMðDk; T iÞ6
ð4Þ
for window temperatures, Ti = 68, 101, 125, 150,175 and 202 �F. Thus, the gray-body emittance de-rived from the average FOM is a temperature-averaged, band-averaged quantity; it is sought tosimplify the radiometric model developed below.
Fig. 5 shows the average FOM computed forthe 3–5-, 8–12- and 3–12-lm bands. As expected,the minimum FOM�s increase with wavelength,suggesting an increase in emittance with wave-length as displayed in Fig. 3. The gray-body emit-
Fig. 5. Merit (FOM) minimization for window emittance.
tance of 0.0155 is chosen for the theoretical curvesbecause it characterizes the entire band from 3 to12 lm. The gray-body emittance of 0.0155 yieldstighter curve fits (i.e., small FOM�s) in nearly allcases of window temperature and spectral waveband. The gray-body emittance is least effectivefrom 3 to 4 lm, but still produces a lower FOMthan the spectral emittance. Recall that thespectral emittance was obtained using the 2-in.window, so it is not expected to perfectly charac-terize the 5-in. window.
The results from the other window tempera-tures reveal several trends regarding the curve fitof the theoretical plots to the measured data. Ineither case of spectral or gray-body emittance,the regions of largest discrepancy are from 2.5 to4.5, 5 to 8 and 12 to 14 lm. The discrepancy inthe 5–8-lm band can be attributed to gaseouswater absorption not accounted for in the theoret-ical analysis. This spectral region is not a band ofinterest, however, so the discrepancy is acceptable.From 2.5–4.5 lm, the discrepancy is explained bythe low signal-to-noise ratio of the measured data,and from 12 to 14 l m, a temperature-dependentemittance is apparent. With an increase in windowtemperature, the gray-body curves exhibit increas-ing divergence from the measured data in 12–14-lm range, indicating an increase in emittance withtemperature. When the window reaches 202 �F,the gray-body curve starts to diverge even lowerin the spectrum near 11 lm. Overall, however,the window emittance can be regarded as temper-ature invariant from 3 to 12 lm for temperaturesranging from 68 to 200 �F. This approach is shownto be an accurate theoretical model of the mea-sured radiance using a gray-body assumption,and consequently, it can be solved for ewin
Lwin(k, Twin) to determine the effective radianceof the window:
Lwin�eff ¼: ewinLwinðk; T winÞ
¼ Lmeasured � ð1� ewinÞLbackðk; T backÞ ð5Þ
Since Eq. (5) is a transcendental equation with ewin
on both sides, the gray-body value of 0.0155 is as-sumed for the right side.
The window radiance is an extremely small frac-tion of the total measured radiance. As expected, a
T.A. Morris et al. / Infrared Physics & Technology 48 (2006) 130–153 139
slight increase in window radiance is observed withwavelength. A localized increase in the region from5.5 to 7.5 lm can be attributed to the atmosphericabsorption in the measured data. The fractions (%)of window radiance to engine radiance, vwin, for anengine emittance of 0.7 and window emittance of0.0155 were computed using
vwin ¼R
Dk Lwin�eff dkRDk eengðkÞLengðk; T engÞdk
ð6Þ
for all six measured window temperatures and fourwavebands, each at a cool (400 �F) and a hot(1500 �F) engine temperature. The window radia-tion contribution was less than 1% in all catego-ries, indicating that the window contribution issmall compared to the engine. With the enginetemperature at 1500 �F, the window contributionis virtually negligible in the MWIR.
To simulate the engine nozzle, an Electro-Optical Industries model CES100-02 extendedblackbody was positioned approximately 0.25 mbehind the 5-in. AR-coated ZnSe window (replac-ing the wall). Although the blackbody does notproduce a plume nor resemble a cavity structure,it has a stable, temperature-controlled surface withknown spectral properties. The temperature of theblackbody is reported via digital readout on a tem-perature controller, but for verification, an Infra-metrics model 760 IR imager sensitive from 8 to12 lm was focused on the blackbody during theexperiment. According to the imager, the black-body temperature was approximately 200.3 �Fwhen the ambient window was imaged and200.7 �F when the heated window was imaged.The temperature control of the window and thesettings for the SR-5000 spectroradiometer werethe same as previously noted. The spectral radi-ance of the window was determined by the follow-ing procedure: (1) calibrate SR-5000 to a referenceblackbody; (2) image blackbody at 200 �F withoutwindow as a baseline measurement; (3) image win-dow at ambient temperature in front of 200 �Fblackbody; (4) heat window to 200 �F and repeat(3); (5) fit theoretical curves to the measured spec-tral radiance; and (6) extract the window radiancefrom the SR-5000 radiance data.
Since the wall is replaced with a blackbody at200 �F, an earlier simplification that the wall and
background radiances were approximately equalis no longer valid. However, the measured radi-ance remains a linear combination of four compo-nents: (1) the self-emission from the window; (2)reflected emission off the window from the back-ground; (3) the self-emission of the blackbodytransmitted through the window; and (4) reflectedemission off the blackbody from the backgroundtransmitted through the window.
Using an assumed blackbody emittance of 0.99and the window transmittance measured above,theoretical curves were plotted against the mea-sured data from the SR-5000 for window temper-atures of 65 and 203 �F. In all cases, thetheoretical curve is an excellent fit to the measureddata. The FOM for the 3–4-lm band (0.61% at65 �F and 0.79% at 203 �F) is much smaller thanthe FOM in the experiment with ambient back-ground. The reduction in FOM may be attributedto the use of the window transmittance in the the-oretical curve that was absent in the previousexperiment. Overall, the low FOM�s here give fur-ther justification for the characterization of thewindow using the gray-body emittance. Further-more, the window transmittance is employed toproduce theoretical curves for both the ambientand hot window, and both curves are excellent fitsto the measured data. From a purely empiricalstandpoint, the window transmittance is not astrong function of temperature in the range from65 to 200 �F.
4. Radiometric model
A radiometric model of the altitude test cell atthe PSL is formulated to determine the amountof stray radiation incident on the camera fromboth the engine and the stray radiation sources.The model is coded in Matlab�. The camera is lo-cated 35 feet downstream of the engine inside theexhaust collector and is positioned to view the en-gine from the on-engine axis, i.e., aligned with thecenterline of the engine nozzle. Although the en-gine is the target source of radiation within the testcell, the exhaust collector, atmosphere, plume,ZnSe window, and camera enclosure also radiate.These sources of radiation are captured by the
140 T.A. Morris et al. / Infrared Physics & Technology 48 (2006) 130–153
IR camera, and thus constitute the stray radiationwithin the test cell. A simplified geometry of thePSL test cell is incorporated into the model to re-flect the spatial dependencies of the radiometry.Intricate details of the geometry, however, areavoided to keep the model generic enough so thatit can be applied to other test cells.
The purpose of the model is to ascertain the con-ditions in which the stray radiation (i.e., the sum ofthe flux from the exhaust collector, plume, atmo-sphere, window, protective camera enclosure andnarcissistic reflection) constitutes five percent orless of the total flux (i.e., the sum of the engine fluxand the stray flux sources) incident on the camera.(The five percent threshold is simply a benchmarkand does not imply a hard requirement. A newthreshold, if desired, could be applied to the para-metric analysis that follows.) Equivalently, the goalis to maintain the target flux at a level of at least95% of the total flux. The stray radiation producedinside the camera is ignored, as it is assumed to benegligible. The internal optics are assumed to becooled and have small emittances, which is typicalof high quality cameras. Once the engine and strayfluxes are determined, the per-pixel output voltagecorresponding to any flux component can be deter-mined using the voltage responsivity over the bandDk, which is a function of the modulation fre-quency. The voltage responsivity, in units of voltsper watt, is dependent on the detector type [6].With the output voltage of each pixel, the raw dataoutput can be analyzed, if required.
The radiation is computed for the four spectralwave bands, 3–4, 4.5–5, 8–9 and 8–12 lm. The twoMWIR bands, 3–4 and 4.5–5 lm, can be achievedwith a detector such as indium antimonide (InSb)with appropriate cold filtering. Although therequirements as listed above only include oneLWIR band, two bands (one narrow and onewide) are analyzed to allow flexibility in the designof the imaging system. The LWIR bands are indic-ative of a QWIP for the 8.0–9.0-lm band and anMCT photo-detector for the broader 8.0–12.0 lmband. The band from 4.0 to 4.5 lm is purposelyavoided to minimize radiation from the plume.
As noted above, a 1-in. spatial resolution is de-sired for the IR signature data. An FPA with astaring scan provides spatial resolution and allows
mapping between pixel and source area even in avibrational environment. As such, the total fluxsignifies the per-pixel flux collected from withinthe IFOV. To achieve a 1-in. spatial resolution at35 feet using an FPA, the IFOV must be no largerthan 4.76 mrad.
To facilitate upcoming flux equations, it is nec-essary to make additional assumptions regardingthe imaging system. Foremost, a non-uniformitycorrection is assumed to have been performed.Also, the camera is assumed to operate within itsdynamic range by using neutral density filters, ifrequired. Specific characteristics about the cameraare also assumed. In particular, the IFOV andaperture diameter are given values of 1.1 mradand 1 in., respectively, and were chosen for the fol-lowing reasons. The FLIR SC-3000 used in theprior NASA test has an IFOV of 1.1 mrad andthe aperture diameter is indicative of camera datareported in a published article regarding IR cali-bration [7]. A normalized system spectral response,R*(k), is employed to model the transmittance ofthe internal camera filters, as well as the detectorspectral response. To maintain generic characteris-tics that could apply to any FPA and detectorcombination, R*(k) is approximated by a top-hatfunction of 0.80 over each of the four spectralwave bands. The value of 0.80 is a rough estimateof several cameras reported in [7]. (If a particularIR camera is chosen for future testing, the radio-metric model can be easily modified to includethe camera�s unique characteristics, replacing theassumed values mentioned here.)
During operation of the F110, the flow of hotexhaust gas heats the engine hot parts. The enginehot parts include the flaps, exhaust duct, aug-menter mixer, flame-holder, low-pressure turbine,and center-body as viewed by the camera fromthe on-engine axis. The F110 engine (i.e., enginehot parts and any other engine components thatcontribute to the engine flux as viewed from theon-engine aspect; some of these components maybe hidden from view of the camera, but still con-tribute to the radiation) is modeled as a Lamber-tian, 30-in. flat metal plate, positioned in thenozzle aperture plane, and perpendicular to lineof sight between the engine and camera. The inte-rior geometry of the nozzle cavity structure is not
T.A. Morris et al. / Infrared Physics & Technology 48 (2006) 130–153 141
considered. It is also assumed that the engine is indry operation during the test. The separation be-tween the nozzle aperture plane and the camera ismodeled as 35 feet, commensurate with the previ-ous NASA test. Since each source area (i.e., thearea of the detector as projected in the engineplane) is presumably small for an individual pixelof a modern FPA, the temperature, emittance,and surface normal are assumed to be spatiallyconstant. (The FLIR SC-3000 camera used byNASA had a 1.1-mrad IFOV which projects to a1.37 square centimeter area at a distance of 35 feet.)Therefore, the radiance is assumed to be spatiallyconstant across each pixel area, i.e., within theIFOV. Since the cavity structure of the nozzle isnot modeled, the radiance from each pixel is trea-ted as a combination of direct contributions fromthe engine surface in the IFOV and reflected contri-butions from interior hot parts within the cavity.
The engine flux incident on the camera is di-rectly proportional to the radiance from the enginewhich is a function of engine temperature andemittance. The flux is also attenuated by the atmo-sphere and the window. The engine flux equationcan be simplified with a few engineering approxi-mations. First, the detector array is assumed tobe normal to the engine plate. In addition, as pre-viously mentioned, the radiance is assumed to beconstant over the source area, so Leng 5 Leng(As).The engine radiance is also independent of anydetector spatial coordinates, thus Leng 5 Leng(Ao).Since the detector and source areas are so small,the separation distance, r, is virtually independentof the spatial position of either the source or detec-tor. For the sake of simplifying the model for theupcoming parametric analysis, the engine emit-tance is assumed to be spectrally constant withineach of the four spectral wave bands. To avoidconfusion with the gray-body assumption, how-ever, the emittance maintains its spectral depen-dence outside the integral with the notationeeng(Dk). R*(Dk) is treated in the same manner.After incorporating these modeling assumptions,the engine flux incident on a pixel is
Ueng ¼ AosatmR�ðDkÞeengðDkÞh2IFOV
�Z
DkLengðk; T engÞswinðkÞdk ð7Þ
where s(k) = satm(k)swin(k), Ao is the area of theoptic, and where the source area is
As ¼ ðrhIFOVÞ2 ð8Þusing the small area approximation. The rangedependence has been eliminated due to Eq. (8)and the atmospheric transmittance, satm, is mod-eled using Beer�s Law where the extinction coeffi-cient is set equal to 8.22e�6 for all wavelengthsto achieve a transmittance of 0.98 at 35 feet. It isassumed the average transmittance from 3 to12 lm is on the order of 0.98 or higher due tothe short path length. It is also assumed that allrays exiting the engine travel the same distanceto reach the camera. The window transmittanceis modeled using a polynomial fit to the measuredtransmittance as reported above.
Stray radiation is produced from the PSL ex-haust collector walls as they heat from theimpingement of the plume. A portion of the strayradiation from the walls strikes the engine and re-flects in the direction of the camera. The directcontribution from the exhaust collector to thecamera is not considered stray radiation becausethe FPA can spatially discriminate between theengine and exhaust collector. The amount of radi-ation incident on the engine is a function of wave-length, exhaust collector temperature, and exhaustcollector geometry. The amount reflected in thedirection of the camera is dictated by the spectralBRDF of the engine, but, as mentioned above,the engine is modeled as a Lambertian surface tosimplify the mathematics. As shown in Fig. 6(a),the exhaust collector is modeled as a 25 foot longcylinder with an eight foot diameter, separated bytwo feet from the nozzle aperture plane and eightfeet from the camera enclosure. This geometry isconsistent with the PSL altitude test cell. The inte-rior walls of the exhaust collector are assumed tobe Lambertian blackbodies, a realistic assumptionsince the PSL walls are carbon steel covered insoot. To reduce the complexity of the model, onlydirect rays from the exhaust collector to the engineare modeled; an interior ray bouncing inside theexhaust collector is ignored. All exiting rays, how-ever, can be assumed to be have undergone severalbounces prior to their final departure from the ex-haust collector.
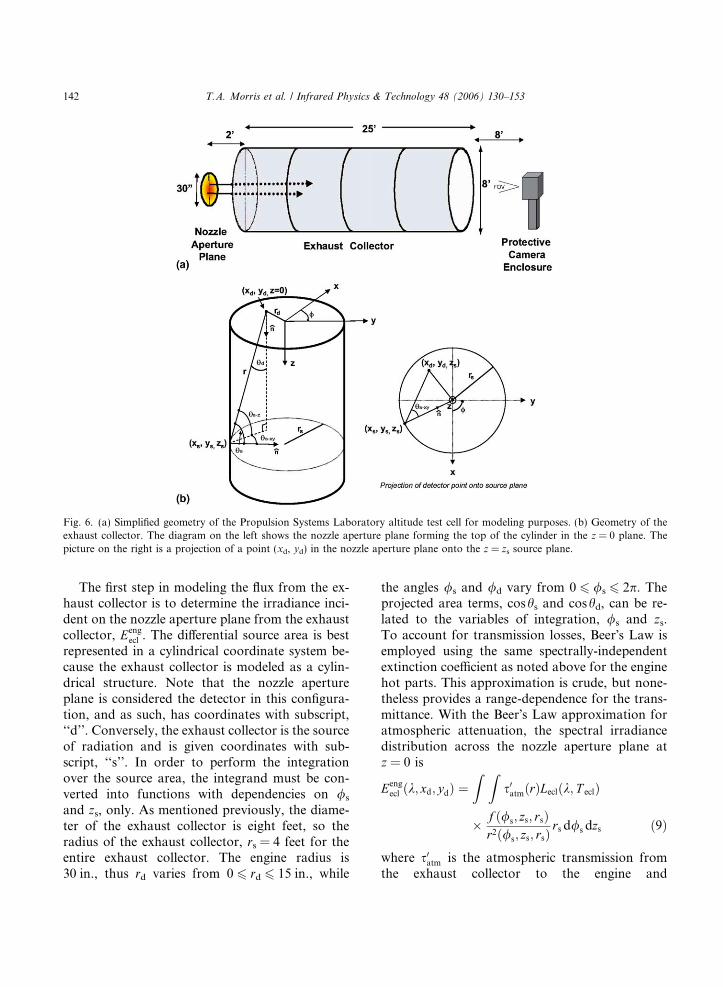
Fig. 6. (a) Simplified geometry of the Propulsion Systems Laboratory altitude test cell for modeling purposes. (b) Geometry of theexhaust collector. The diagram on the left shows the nozzle aperture plane forming the top of the cylinder in the z = 0 plane. Thepicture on the right is a projection of a point (xd, yd) in the nozzle aperture plane onto the z = zs source plane.
142 T.A. Morris et al. / Infrared Physics & Technology 48 (2006) 130–153
The first step in modeling the flux from the ex-haust collector is to determine the irradiance inci-dent on the nozzle aperture plane from the exhaustcollector, Eeng
ecl . The differential source area is bestrepresented in a cylindrical coordinate system be-cause the exhaust collector is modeled as a cylin-drical structure. Note that the nozzle apertureplane is considered the detector in this configura-tion, and as such, has coordinates with subscript,‘‘d’’. Conversely, the exhaust collector is the sourceof radiation and is given coordinates with sub-script, ‘‘s’’. In order to perform the integrationover the source area, the integrand must be con-verted into functions with dependencies on /s
and zs, only. As mentioned previously, the diame-ter of the exhaust collector is eight feet, so theradius of the exhaust collector, rs = 4 feet for theentire exhaust collector. The engine radius is30 in., thus rd varies from 0 6 rd 6 15 in., while
the angles /s and /d vary from 0 6 /s 6 2p. Theprojected area terms, coshs and coshd, can be re-lated to the variables of integration, /s and zs.To account for transmission losses, Beer�s Law isemployed using the same spectrally-independentextinction coefficient as noted above for the enginehot parts. This approximation is crude, but none-theless provides a range-dependence for the trans-mittance. With the Beer�s Law approximation foratmospheric attenuation, the spectral irradiancedistribution across the nozzle aperture plane atz = 0 is
Eengecl ðk; xd; ydÞ ¼
Z Zs0atmðrÞLeclðk; T eclÞ
� f ð/s; zs; rsÞr2ð/s; zs; rsÞ
rs d/s dzs ð9Þ
where s0atm is the atmospheric transmission fromthe exhaust collector to the engine and
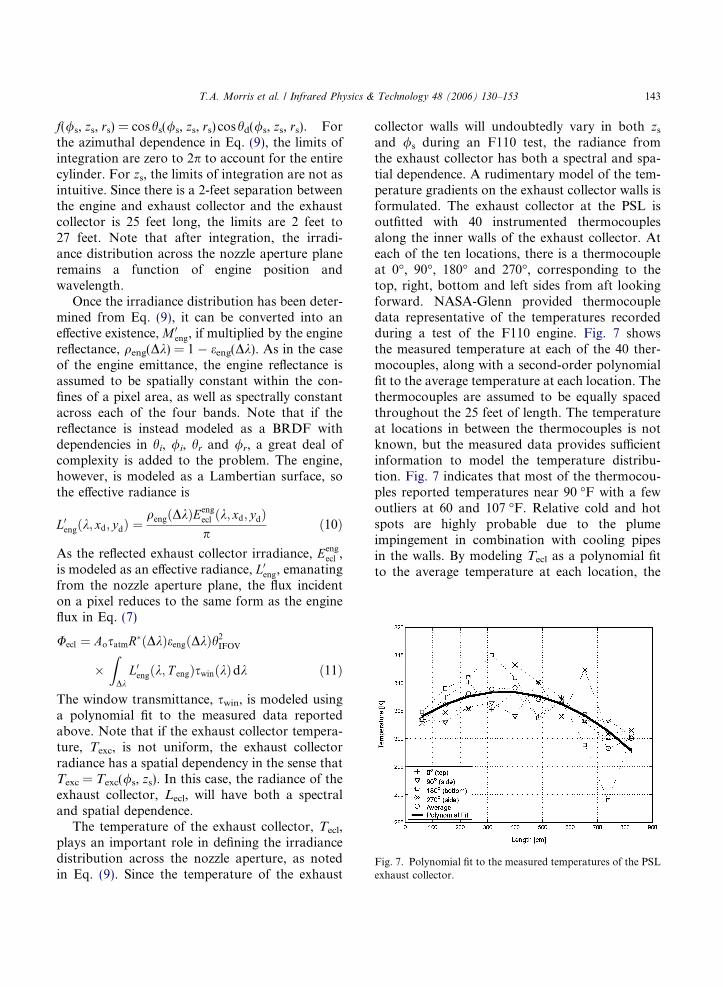
Fig. 7. Polynomial fit to the measured temperatures of the PSLexhaust collector.
T.A. Morris et al. / Infrared Physics & Technology 48 (2006) 130–153 143
f(/s, zs, rs) = coshs(/s, zs, rs) coshd(/s, zs, rs). Forthe azimuthal dependence in Eq. (9), the limits ofintegration are zero to 2p to account for the entirecylinder. For zs, the limits of integration are not asintuitive. Since there is a 2-feet separation betweenthe engine and exhaust collector and the exhaustcollector is 25 feet long, the limits are 2 feet to27 feet. Note that after integration, the irradi-ance distribution across the nozzle aperture planeremains a function of engine position andwavelength.
Once the irradiance distribution has been deter-mined from Eq. (9), it can be converted into aneffective existence, M 0
eng, if multiplied by the enginereflectance, qeng(Dk) = 1 � eeng(Dk). As in the caseof the engine emittance, the engine reflectance isassumed to be spatially constant within the con-fines of a pixel area, as well as spectrally constantacross each of the four bands. Note that if thereflectance is instead modeled as a BRDF withdependencies in hi, /i, hr and /r, a great deal ofcomplexity is added to the problem. The engine,however, is modeled as a Lambertian surface, sothe effective radiance is
L0engðk; xd; ydÞ ¼qengðDkÞEeng
ecl ðk; xd; ydÞp
ð10Þ
As the reflected exhaust collector irradiance, Eengecl ,
is modeled as an effective radiance, L0eng, emanatingfrom the nozzle aperture plane, the flux incidenton a pixel reduces to the same form as the engineflux in Eq. (7)
Uecl ¼ AosatmR�ðDkÞeengðDkÞh2IFOV
�Z
DkL0engðk; T engÞswinðkÞdk ð11Þ
The window transmittance, swin, is modeled usinga polynomial fit to the measured data reportedabove. Note that if the exhaust collector tempera-ture, Texc, is not uniform, the exhaust collectorradiance has a spatial dependency in the sense thatTexc = Texc(/s, zs). In this case, the radiance of theexhaust collector, Lecl, will have both a spectraland spatial dependence.
The temperature of the exhaust collector, Tecl,plays an important role in defining the irradiancedistribution across the nozzle aperture, as notedin Eq. (9). Since the temperature of the exhaust
collector walls will undoubtedly vary in both zs
and /s during an F110 test, the radiance fromthe exhaust collector has both a spectral and spa-tial dependence. A rudimentary model of the tem-perature gradients on the exhaust collector walls isformulated. The exhaust collector at the PSL isoutfitted with 40 instrumented thermocouplesalong the inner walls of the exhaust collector. Ateach of the ten locations, there is a thermocoupleat 0�, 90�, 180� and 270�, corresponding to thetop, right, bottom and left sides from aft lookingforward. NASA-Glenn provided thermocoupledata representative of the temperatures recordedduring a test of the F110 engine. Fig. 7 showsthe measured temperature at each of the 40 ther-mocouples, along with a second-order polynomialfit to the average temperature at each location. Thethermocouples are assumed to be equally spacedthroughout the 25 feet of length. The temperatureat locations in between the thermocouples is notknown, but the measured data provides sufficientinformation to model the temperature distribu-tion. Fig. 7 indicates that most of the thermocou-ples reported temperatures near 90 �F with a fewoutliers at 60 and 107 �F. Relative cold and hotspots are highly probable due to the plumeimpingement in combination with cooling pipesin the walls. By modeling Tecl as a polynomial fitto the average temperature at each location, the

144 T.A. Morris et al. / Infrared Physics & Technology 48 (2006) 130–153
dependence on /s is removed. The model is thensimplified without a severe degradation in fidelity.
Performing a parametric analysis using a poly-nomial fit is cumbersome, however. A single-val-ued temperature is much easier to manipulate.For this reason, finding a constant temperaturealong the entire length of the exhaust collector thatproduces an equivalent irradiance on the nozzleaperture plane is determined. The irradiance differ-ence between the polynomial fit of the average PSLtemperatures and a constant temperature, com-puted at the point, (xd, yd) = 0, for all four spectralwave bands was computed. For every wave band,the irradiance is minimized at a temperature of91.4 �F. The largest difference is 0.021% in the 8–12-lm band. In order for the constant temperatureof 91.4 �F to accurately represent the measuredPSL temperature distribution, however, it mustbe able to track a corresponding change in temper-ature. Unless a linear relationship exists between achange in PSL temperatures and a change in theconstant temperature, it is difficult to substitute asingle constant temperature for the PSL tempera-ture distribution. This desired linear relationshipwas confirmed; when the PSL average tempera-tures at each location are increased by 20%, theconstant temperature increases by approximately20%, as well. For each of the percent changes rang-ing from one to 100% in the average PSL temper-atures, the constant temperature increases by thesame corresponding amount.
Since the constant temperature of 91.4 �F is de-rived from a single point only, the remainder of theirradiance distribution across the nozzle apertureplane must be examined to ensure it accuratelyapproximates the PSL temperature distribution.The mean, maximum, and standard deviation ofthe irradiance distributions within the confinesof the nozzle aperture is computed for all fourbands, as well as the 3–12-lm band. Flatness is de-fined as the standard deviation of the irradiancedistribution divided by the mean; it is a measureof the variability of the irradiance across the noz-zle aperture. Low values of roughly 1% indicatethat the distributions are essentially flat. In addi-tion, the distributions are extremely similar whencomparing mean, maximum, and standard devia-tion. The constant temperature produces a slighter
flatter irradiance distribution, e.g., the irradiancedistributions from 8 to 12 lm are virtually indistin-guishable. As evidence of this observation, the rmsdifference between the irradiance distributions is5.27e�5 W/cm2, which is two orders of magnitudesmaller than the largest irradiance. Similar resultsare observed with the other bands. The signifi-cance of the high degree of flatness is that theamount of reflected exhaust collector flux is inde-pendent of projected pixel location on the nozzleaperture plane. The model can then simply com-pute the reflected flux from the point, (xd, yd) = 0,on the nozzle aperture plane without significantloss of accuracy. Therefore, the irradiance distri-bution across the nozzle aperture is assumed tobe flat and can be accurately approximated froma constant exhaust collector temperature. Thisconstant temperature, although single-valued, be-comes the effective temperature of the exhaust col-lector and represents both the longitudinal andazimuthal temperature dependence as measuredin the PSL.
The plume radiates and produces a red and bluespike centered around 4.3 lm. The model assumesthat the plume radiation is filtered out using eithera notch or band-pass filter. With appropriate filter-ing in the MWIR, the flux incident on a pixel dueto the plume is assumed to be negligible.
The atmosphere is a source of stray radiation inthe test cell because it absorbs and emits radiationin the direct path of the camera imaging the en-gine. The spectral emittance of the atmosphere,eatm(k), is approximately equal to 1 � satm(k), sothe effective radiance of the atmosphere can beapproximated by (1 � satm(k))Latm(k, Tatm). Toassess the accuracy of this approximation, a simu-lation was performed with the atmospheric model-ing codes, MODTRAN, FASCODE, HITRAN,SAG, and SAMM1. The spectral transmittanceand radiance of the atmosphere were computedover a 35-foot path at 10,000 feet mean sea level(MSL) over Ohio with clear atmosphere with nor-mal visibility. Using the atmospheric transmit-tance generated, the spectral emittance of theatmosphere, eatm(k), was approximated fromeatm(k) = 1 � satm(k). The spectral radiance of theatmosphere was then approximated by eatm(k)L(k, Tatm), allowing a direct comparison to the
T.A. Morris et al. / Infrared Physics & Technology 48 (2006) 130–153 145
spectral radiance generated. An atmospheric tem-perature of 162 K was determined heuristicallyby minimizing the difference between the two forthe in-band radiance from 3 to 12 lm. Even afterminimization, the plots do not completely align,indicating an inherent discrepancy between themagnitudes. It is evident, however, that theapproximation produces a spectral radiance thatclosely resembles the shape of the modeled radi-ance, but it is inconclusive on how accurately themagnitude is matched because the atmospherictemperature employed by the atmospheric codesis unknown. For the model, however, the approx-imation is assumed to be sufficient because the in-band radiance from 3 to 12 lm differed by only0.78%.
As noted above, the atmospheric transmittanceis modeled using Beer�s Law with the extinctioncoefficient equal to 8.22e�6 for all wavelengths.At a distance of 35 feet, the atmospheric transmit-tance from Beer�s Law yields 0.98, resulting in anatmospheric emittance of 0.02. The atmosphericflux incident on a pixel is nearly identical to theengine flux in Eq. (7) with the exception thatthe engine emittance eeng(Dk) is replaced with theatmospheric emittance, 1 � satm,
Uatm ¼ AoR�ðDkÞð1� satmÞh2IFOV
�Z
DkLatmðk; T engÞswinðkÞdk ð12Þ
The atmospheric emittance is removed from theintegral because it is modeled as a spectrally inde-pendent term. As in the case of the engine and ex-haust collector, the atmospheric radiation mustpenetrate the window, so swin is included. The win-dow transmittance is modeled using a polynomialfit to the measured data reported above. The mod-el also assumes that the atmospheric temperatureis equal to the engine nozzle temperature.
The AR-coated ZnSe window is mounted onthe front side of the protective enclosure and pro-vides a viewing path for the camera to image theengine. Since the window is located approximately35 feet from the nozzle aperture, the window tem-perature increases from the impingement of theplume, and as a result, it is another source of strayradiation within the altitude test cell. (The window
produces stray radiation even at cool tempera-tures, but with an increase in temperature fromthe plume, its contribution of stray radiation ismore substantial.) The amount of radiation pro-duced by the window is dependent on the windowtemperature and emittance. The previous NASAtest set-up included a cooling scheme to reducethe window temperature, prevent soot build-up,and reduce temperature gradients. Accordingly,the model assumes that soot does not collect onthe window and that the window is isothermal.As for the window emittance, the window is as-sumed to act as a gray-body from 3 to 12 lm as de-tailed above. The model also assumes that theirradiance on the detector array from the windowis constant for each pixel, allowing the flux to becomputed without regard to pixel location. Theassumption of a constant irradiance distributionacross the detector array is realistic because thewindow radiation is completely out of focus. TheFPA camera is focused on the engine at a distanceof approximately 35 feet, whereas the window isonly a few inches from the lens. With theseassumptions, the flux on a pixel from the windowradiation is in the same form as engine flux inEq. (12)
Uwin ¼ AoR�ðDkÞewinh2IFOV
ZDk
Lwinðk; T engÞdk ð13Þ
Note that the atmospheric attenuation from thewindow to the camera is assumed to be negligible.
To protect the camera from the heat, vibration,and pressure created by the F110 engine andplume, the camera is placed inside a protectiveenclosure. Although the walls of the enclosureare water-cooled to prevent the camera from over-heating, the interior walls produce stray radia-tion. As presented above, however, the window isextremely specular and thus any off-specular con-tributions are insignificant. From a ray-opticsstandpoint, any specular reflections off the windowwill not reach the detector if the camera is posi-tioned close to the window. On account of thisanalysis, the flux on a pixel from the protectivecamera enclosure is assumed to be negligible.
The narcissistic reflection is the reflection of thecamera radiation off the ZnSe window and backinto the camera. The amount of stray radiation

146 T.A. Morris et al. / Infrared Physics & Technology 48 (2006) 130–153
reflected is dependent on the reflectance of the win-dow. Since AR coatings are typically designed toexhibit peak performance (i.e., highest transmit-tance) at normal incidence, the reflectance is ex-pected to be extremely low. As examined above,the narcissistic reflection is a minor contributionof stray radiation, but it is included in the modelfor completeness. The flux on a pixel from the nar-cissistic reflection follows from the window flux inEq. (13)
Unar ¼ AoR�ðDkÞewinh2IFOV
ZDk
qwinLnarðk; T narÞdk
ð14ÞFrom Eq. (12), the spectral reflectance of the win-dow, qwin(k), is
qwinðkÞ ¼ 1� ½ewin þ swinðkÞ� ð15Þwhere the spectral dependence of the window emit-tance is dropped due to the gray-body assumption.In regions with high transmittance, Eq. (15) yieldsnegative values for the reflectance. In these cases,the reflectance is set equal to zero. The windowtransmittance is modeled using a polynomial fitto the measured data as reported above. Thenon-uniformity of the narcissistic reflection is neg-ligible, so the model assumes that the entire cam-era temperature is 300 K with an emittance ofone. The reflection of the cold detector, which typ-ically defines a true narcissistic reflection, is omit-ted in this case.
Using the equations for the engine and strayradiation, a parametric analysis is performed tofind the conditions in which the stray radiationconstitutes no more than 5% of the total flux.Examining the entire trade space results in dataoverload, but an alternative is to examine severalplausible cases. Parameters known to be generallystatic are held constant whereas the parameterswith expected fluctuation are varied in preset incre-ments. For each of the cases, the fraction of stray tototal radiation is computed to determine if the 5%threshold is maintained. Nine scenarios for theparametric analysis in three groups of three are:(1) a cool engine (400 �F) with low (0.5), medium(0.7) and high (0.9) emittance; (2) a warm engine(1000 �F) with low, medium and high emittance;and (3) a hot engine (1500 �F) with low, medium
and high emittance. Each of the nine scenarios iscomputed for all four spectral bands. In each case,however, some of the parameters are held constantand others varied. The parameters that vary duringthe scenarios are the exhaust collector temperatureand the window temperature. The first run is per-formed with the exhaust collector temperaturevarying from 80 to 200 �F while the window tem-perature is set to 115 �F, an approximate tempera-ture observed during the past test at the PSL. Thesecond run is performed with the window tempera-ture varying from 80 to 200 �F while the exhaustcollector temperature is set to 90 �F, the averagetemperature from all thermocouple measurementsdepicted in Fig. 7. Thus, there are a total of ninescenarios and 72 unique cases.
Each of the parameters in the engine and strayflux has measurement error. To determine the ef-fect of individual measurement errors on each fluxcontribution, a sensitivity analysis is performed inthe style of a Monte Carlo analysis. Each parame-ter is assigned a random distribution to simulatethe error. For this analysis, the Gaussian (normal)distribution is assumed for all parameters. There isno direct evidence to indicate that the errors arenormally distributed, but the Gaussian distribu-tion is sufficient for a first-cut sensitivity analysis.Nonetheless, the Central Limit Theorem providesleverage for employing the Gaussian distributionas each parameter is randomly selected 1000 times[8]. Perhaps a more accurate approach for a sensi-tivity analysis would be to use a propagation-of-error analysis, but due to the complexity of the fluxequations, the method described is a more tracta-ble solution.
Table 1 is a list of the errors for each parameter.If the parameter is not listed, it is assumed to haveno error. For each parameter, the expected value isassigned to the mean of the Gaussian distributionand the error is assigned to the standard deviation.The exhaust collector temperature error of ±10 �Fis a conservative engineering estimation usingthe standard deviation of the PSL thermocouplemeasurements. Through experimentation andcurve fitting above, the window emittance erroris assumed to be on the order of ±0.001. The win-dow temperature error of ±2% is based on typicalthermocouple precision. Each non-zero flux con-
Table 1Input parameter errors for sensitivity analysis
Parameter Mean Standard deviation Normalized error (%)
Engine temperature (�F) 400, 1000, 1500 50 12.5, 5, 3.3Engine emittance 0.5, 0.7, 0.9 0.05 10, 7.1, 5.6Exhaust collector temperature (�F) 90 10 11.1Window emittance 0.0155 0.001 6.5Window temperature (�F) 115 2.3 2
T.A. Morris et al. / Infrared Physics & Technology 48 (2006) 130–153 147
tribution is computed 1000 times. In each of the1000 runs, the value of the parameters listed inTable 1 is chosen randomly according to its speci-fied mean and standard deviation. After the flux iscomputed 1000 times, the mean and standard devi-ation of the 1000 results are calculated in order tocompute the normalized flux error. The normal-ized flux error is the standard deviation of the fluxdivided by the mean flux
n ¼
ffiffiffiffiffiffiffiffiffiffiffiffiffiffiffiffiffiffiffiffiffiffiffiffiffiffiffiffiffiffiffi1N
PNi¼1ðxi � �xÞ2
qPN
i¼1xi
ð16Þ
where N = 1000, xi is an individual flux calcula-tion, and �x is the mean of the N = 1000 flux calcu-lations. It is a measure of the error in the flux dueto errors in the input parameters. Normalizing theerror by the mean allows for meaningful compari-son between the errors in each flux contribution.For consistency, the sensitivity analysis is per-formed for all combinations of the nine casesand the four spectral wave bands.
5. Parametric analysis
Figs. 8–11 are the results of the parametric anal-ysis computed for the nine scenarios. In Figs. 8–10,stray radiation is plotted as a function of increas-ing exhaust collector temperature from 80 to200 �F. Fig. 11 is an example of the stray radiationas a function of increasing ZnSe window tempera-ture from 80 to 200 �F. In each graph, a solid lineis drawn at the 5% stray radiation threshold; theultimate goal is therefore to stay below the thresh-old. For each of the scenarios, the underliningassumption is that there is no coupling betweenthe parameters. For instance, in Figs. 8–10, the
exhaust collector temperature is varied while thewindow temperature is held constant at 115 �F.Likewise, the exhaust collector temperature is heldconstant at 90 �F (as in Fig. 11) while the windowtemperature is varied. In reality, the temperaturesof the exhaust collector and window are undoubt-edly coupled to the engine and exhaust tempera-tures, but these thermodynamic relationships arenot considered in this analysis. Nonetheless, theparametric analysis as presented provides valuableinsight into the conditions required for achievingminimal stray radiation.
Fig. 8 shows that for an engine temperature of400 �F and engine emittance of 0.5, only the 3–4-lm band can achieve 65% stray radiation for ex-haust collector temperatures of 6115 �F. Whenthe engine emittance jumps to 0.9, however, allfour bands can achieve 65% for exhaust collectortemperatures of 6170 �F. The situation changeswhen the engine temperature is 1000 �F as shownin Fig. 9. With an engine emittance of 0.5, onlythe MWIR bands can achieve 65% stray radia-tion, but all four bands succeed for exhaust collec-tor temperatures of roughly 6155 �F with anengine emittance of 0.7. When the engine emit-tance rises to 0.9, the stray radiation for all fourbands is below the threshold at 63% for the entiresuite of exhaust collector temperatures. At anengine temperature of 1500 �F, it would seem thatthe engine radiation would completely swamp outany stray radiation inside the test cell (Fig. 10).With an engine emittance of 0.5, however, bothLWIR bands exceed the threshold, with the excep-tion of the 8–9-lm band for exhaust collector tem-peratures of approximately 90 �F or below. Asexpected, the engine radiation swamps out thestray radiation for all four bands with engine emit-tances of 0.7 and 0.9.
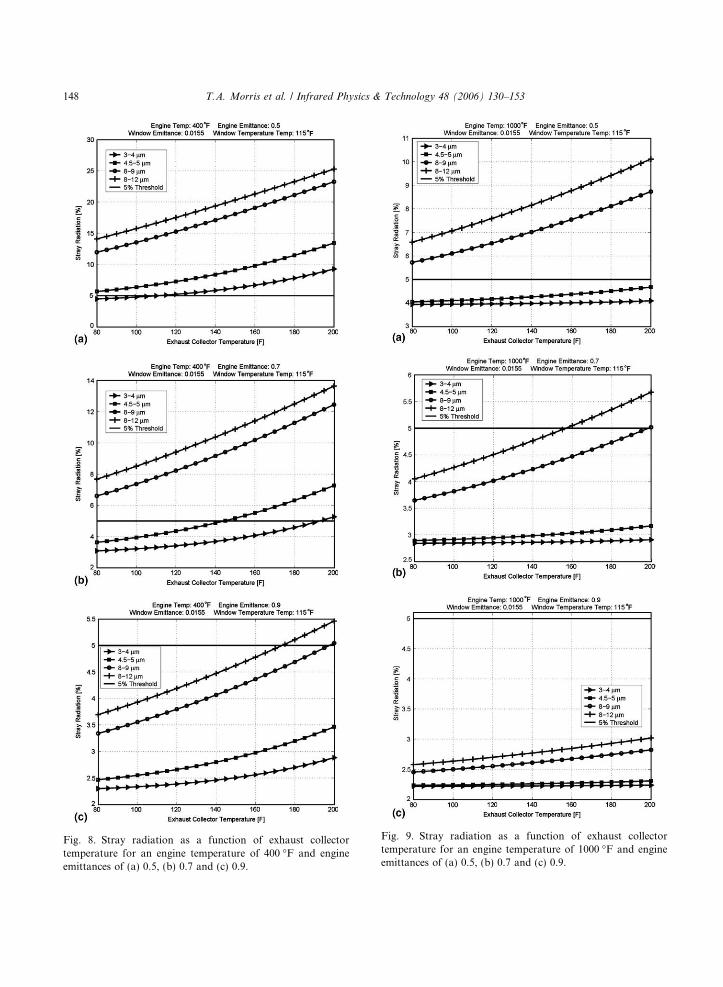
Fig. 8. Stray radiation as a function of exhaust collectortemperature for an engine temperature of 400 �F and engineemittances of (a) 0.5, (b) 0.7 and (c) 0.9.
Fig. 9. Stray radiation as a function of exhaust collectortemperature for an engine temperature of 1000 �F and engineemittances of (a) 0.5, (b) 0.7 and (c) 0.9.
148 T.A. Morris et al. / Infrared Physics & Technology 48 (2006) 130–153
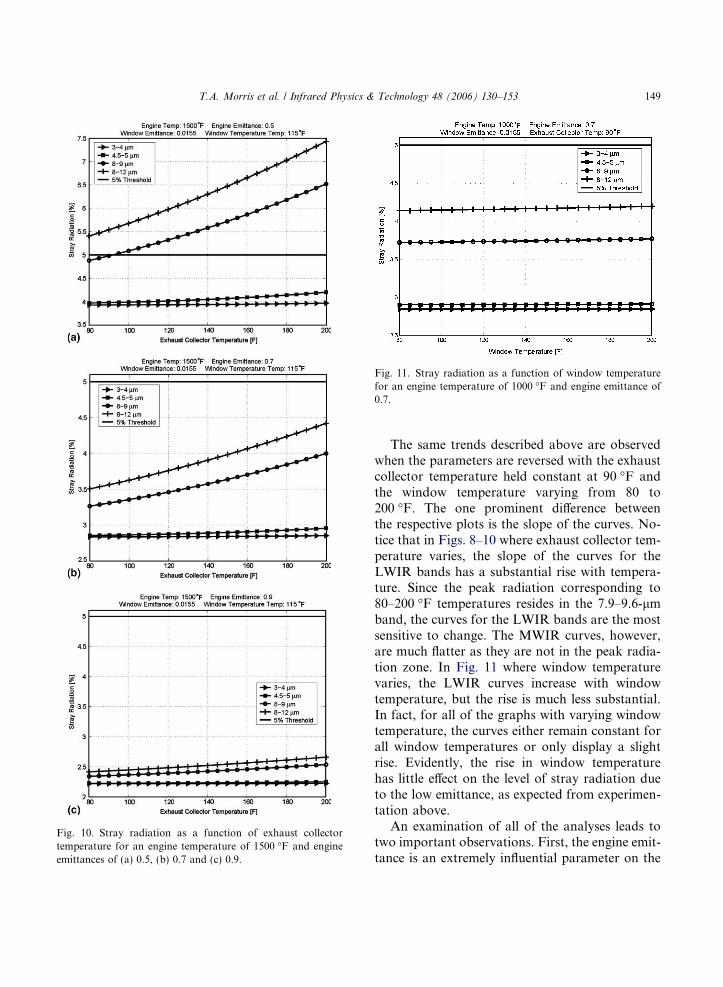
Fig. 10. Stray radiation as a function of exhaust collectortemperature for an engine temperature of 1500 �F and engineemittances of (a) 0.5, (b) 0.7 and (c) 0.9.
Fig. 11. Stray radiation as a function of window temperaturefor an engine temperature of 1000 �F and engine emittance of0.7.
T.A. Morris et al. / Infrared Physics & Technology 48 (2006) 130–153 149
The same trends described above are observedwhen the parameters are reversed with the exhaustcollector temperature held constant at 90 �F andthe window temperature varying from 80 to200 �F. The one prominent difference betweenthe respective plots is the slope of the curves. No-tice that in Figs. 8–10 where exhaust collector tem-perature varies, the slope of the curves for theLWIR bands has a substantial rise with tempera-ture. Since the peak radiation corresponding to80–200 �F temperatures resides in the 7.9–9.6-lmband, the curves for the LWIR bands are the mostsensitive to change. The MWIR curves, however,are much flatter as they are not in the peak radia-tion zone. In Fig. 11 where window temperaturevaries, the LWIR curves increase with windowtemperature, but the rise is much less substantial.In fact, for all of the graphs with varying windowtemperature, the curves either remain constant forall window temperatures or only display a slightrise. Evidently, the rise in window temperaturehas little effect on the level of stray radiation dueto the low emittance, as expected from experimen-tation above.
An examination of all of the analyses leads totwo important observations. First, the engine emit-tance is an extremely influential parameter on the

150 T.A. Morris et al. / Infrared Physics & Technology 48 (2006) 130–153
level of stray radiation produced. For a cool engineat 400 �F, for example, the level of stray radiationis subject to both extremes, with virtually no bandsachieving 65% at 0.5 and all the bands at 0.9. Thisresult is due to an 80% increase in in-band radiancefor any band for a change in gray-body emittancefrom 0.5 to 0.9. The engine temperature is also aninfluential parameter, but not as strong as the emit-tance. At a high temperature of 1000 �F, for exam-ple, only the MWIR bands are able to achieve65%stray radiation with an engine emittance of 0.5,even though all four bands succeeded with an en-gine temperature of 400 �F and emittance of 0.7.Generally, however, the stray radiation is reducedwith an increase in engine temperature.
The second observation is related to the spec-tral dependence of the stray radiations levels.Although it appears from Figs. 8–11 that boostingthe in-band engine signal by increasing engine tem-perature or emittance is the key to reducing strayradiation, it is not the only contributing factor.Recall that from Wien�s Law that the peak of theradiation curve slides to shorter wavelengths withan increase in temperature. Since the strength ofthe stray radiation peaks in the LWIR with tem-peratures ranging from 80 to 200 �F, using aLWIR camera to image an engine at 1000 �F orhotter may result in stray radiation levels exceed-ing 5%. Choosing a SWIR or MWIR camera isthe better option because the peak strength ofthe stray radiation is avoided. Thus, the spectralbehavior of both the stray radiation and engineradiation, as well as the spectral response of theIR camera, plays an integral role in achieving min-imal stray radiation.
6. Sensitivity analysis
Fig. 12 shows the results of the sensitivity anal-ysis with the normalized error for the engine flux,atmosphere flux, exhaust collector flux, and win-dow flux depicted in bar charts. Each bar chart ac-counts for a single engine temperature, either 400,1000 or 1500 �F, and is subdivided into engineemittances of 0.5, 0.7, and 0.9. The normalized er-ror for each flux contribution is charted against thefour bands. Recall from Eq. (16) that each bar
represents the standard deviation divided by themean, i.e., the normalized error, of 1000 computa-tions of a flux contribution for a specified wave-band, engine temperature, and engine emittance.The result is a measure of the uncertainty of theflux contribution by an indication of the spreadof the data about the mean. The engine flux, as de-rived in Eq. (7), is dependent on engine tempera-ture and emittance. With errors in both variablesas displayed in Table 1, the normalized error forthe engine flux shows a substantial reduction withan increase in engine temperature. There is also aslight decrease in error with increasing emittance,implying that the standard deviation of the flux re-mains fairly constant with increased signal (i.e., themean). Due to the trend of lower errors withincreasing engine radiation, the lowest engine fluxerrors are produced with an engine temperatureand emittance of 1500 �F and 0.9, respectively.
The atmospheric flux from Eq. (12) follows thesame trends as the engine flux, partially becausethe atmospheric temperature is assumed to be equalto the engine temperature. Thus, with an increase inengine temperature, the atmospheric flux errorsdiminish. Since the atmospheric flux is not depen-dent on engine emittance, however, the normalizederror for atmospheric flux is less than the normal-ized error for engine flux in every category. In somecases, the atmospheric error is as much as five per-centage points less than the engine error. The atmo-spheric flux is also dependent on the atmospherictransmittance, but since the transmittance is trea-ted as an error-free quantity, the normalized errorfor the atmospheric flux is not affected.
With a dependence on exhaust collector temper-ature and engine emittance, the exhaust collectorflux error displays a trend unlike the other threecontributing flux errors. It is generally invariantto engine temperature, as expected from its deriva-tion in Eq. (11), but shows a drastic increase withengine emittance. In all cases, the exhaust collectorflux error exceeds a two-fold increase as the engineemittance increases from 0.5 to 0.9. This trend isplausible because the exhaust collector radiationreflected off the engine decreases with increasingengine emittance and thus the mean flux is re-duced. Evidently, the drop in mean flux dominatesover any relative change in the standard deviation.
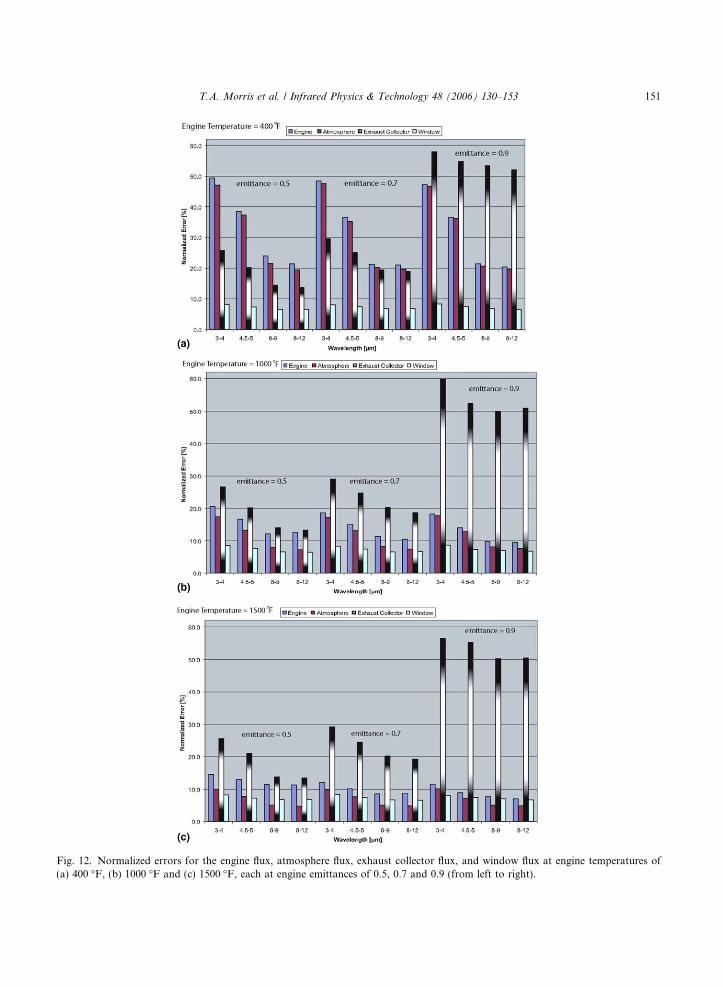
Fig. 12. Normalized errors for the engine flux, atmosphere flux, exhaust collector flux, and window flux at engine temperatures of(a) 400 �F, (b) 1000 �F and (c) 1500 �F, each at engine emittances of 0.5, 0.7 and 0.9 (from left to right).
T.A. Morris et al. / Infrared Physics & Technology 48 (2006) 130–153 151
152 T.A. Morris et al. / Infrared Physics & Technology 48 (2006) 130–153
The window flux as derived in Eq. (13) is depen-dent on window temperature and emittance, bothof which are given errors as listed in Table 1.Ranging from approximately 6–9% in all catego-ries, the window flux error is the lowest of all fluxcontributions. The trend observed for all normal-ized flux errors is one of decreasing magnitudewith increasing wavelength for every combinationof engine temperature and emittance. Accordingly,the sensitivity analysis indicates the engine andstray radiation are most accurately quantified atlonger wavelengths. For the engine flux, however,this guidance is questionable. In order to calculateengine flux, it is required to know engine tempera-ture, but the uncertainty in calculating engine tem-perature given an error in engine emittanceincreases with increasing wavelength [9–11]. Theengine temperature error due to a ±0.05 error inemittance for a true engine temperature of1000 �F and emittances of e = 0.3, 0.5, 0.7 and0.9 were calculated. The errors assume a single-wavelength temperature measurement and arecomputed using propagation of errors. Specifi-cally, the Planck equation for radiance is invertedfor temperature, Teng. The error in the engine tem-perature due to a ±0.05 error in engine emittanceis then determined by computing the standarddeviation of the engine temperature, ST eng , forwavelengths from 3 to 12 lm
ST engðkÞ ¼2 h2c3
ffiffiffiffiffiffiffiffiffiffiffiffiffiffiffiffiffiffiffiffiffiffiffiffiffiffiffiffiffiffiffiffiffiffiffiS2
e þ eLðk;T engÞ
� �2
S2L
r
kLðk; T engÞk6 ln 2ehc2
Lðk;T engÞk5 þ 1� �h i2
2ehc2
Lðk;T engÞk5 þ 1� � ð17Þ
where the error in engine emittance, S2e , is equal to
0.05 and the error in the measured spectral radi-ance, S2
L, is assumed to be zero for all wavelengthsand engine temperatures.
The results show that the temperature error(i.e., uncertainty) increases with increasing wave-length and decreases with increasing emittance.From physical intuition, the decreasing error withemittance is realistic because the measured radi-
ance is less contaminated by background reflec-tions as the emittance increases, and thus thetrue temperature of the engine can be more accu-rately determined. From a spectral point of view,this error analysis suggests that accurate tempera-ture measurements should be obtained using theshortest wavelengths possible assuming adequatesignal strength [11]. Unfortunately, this rule-of-thumb is in stark disagreement with the aforemen-tioned guidance, and the question of choosing theappropriate spectral wave band for accurate calcu-lation of the flux becomes nebulous.
7. Conclusion
The measurement and experimentation of theAR-coated ZnSe window yields conclusions aboutits emittance, transmittance, and BRDF. The win-dow emittance shows an increase with wavelength,but from 3 to 12 lm, the gray-body emittance of0.0155 is an excellent approximation. An increaseof emittance with temperature is also present, butmostly beyond 12 lm. Thus, from 3 to 12 lm,the window emittance can be characterized asspectrally flat with little or no dependence on tem-perature. The transmittance of the 5-in. AR-coated window is highly suited for the MWIRand LWIR, but SWIR performance is poor. A
window with a broader AR-coat is recommendedif operation in the SWIR is required. Also, fromempirical evidence, the transmittance of the win-dow is temperature invariant between 3 and12 lm for temperatures ranging from 65 �F to202 �F. The BRDF reveals that the window ishighly specular and, thus, the radiation from thecamera enclosure reflected off the window can benearly eliminated if the camera is moved close to
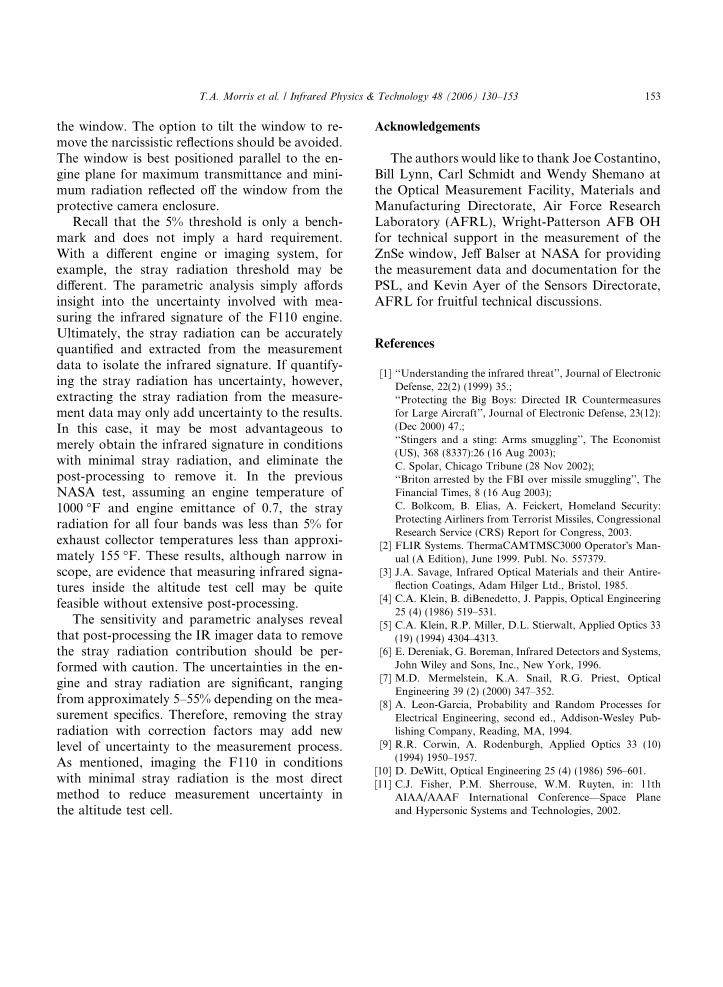
T.A. Morris et al. / Infrared Physics & Technology 48 (2006) 130–153 153
the window. The option to tilt the window to re-move the narcissistic reflections should be avoided.The window is best positioned parallel to the en-gine plane for maximum transmittance and mini-mum radiation reflected off the window from theprotective camera enclosure.
Recall that the 5% threshold is only a bench-mark and does not imply a hard requirement.With a different engine or imaging system, forexample, the stray radiation threshold may bedifferent. The parametric analysis simply affordsinsight into the uncertainty involved with mea-suring the infrared signature of the F110 engine.Ultimately, the stray radiation can be accuratelyquantified and extracted from the measurementdata to isolate the infrared signature. If quantify-ing the stray radiation has uncertainty, however,extracting the stray radiation from the measure-ment data may only add uncertainty to the results.In this case, it may be most advantageous tomerely obtain the infrared signature in conditionswith minimal stray radiation, and eliminate thepost-processing to remove it. In the previousNASA test, assuming an engine temperature of1000 �F and engine emittance of 0.7, the strayradiation for all four bands was less than 5% forexhaust collector temperatures less than approxi-mately 155 �F. These results, although narrow inscope, are evidence that measuring infrared signa-tures inside the altitude test cell may be quitefeasible without extensive post-processing.
The sensitivity and parametric analyses revealthat post-processing the IR imager data to removethe stray radiation contribution should be per-formed with caution. The uncertainties in the en-gine and stray radiation are significant, rangingfrom approximately 5–55% depending on the mea-surement specifics. Therefore, removing the strayradiation with correction factors may add newlevel of uncertainty to the measurement process.As mentioned, imaging the F110 in conditionswith minimal stray radiation is the most directmethod to reduce measurement uncertainty inthe altitude test cell.
Acknowledgements
The authors would like to thank Joe Costantino,Bill Lynn, Carl Schmidt and Wendy Shemano atthe Optical Measurement Facility, Materials andManufacturing Directorate, Air Force ResearchLaboratory (AFRL), Wright-Patterson AFB OHfor technical support in the measurement of theZnSe window, Jeff Balser at NASA for providingthe measurement data and documentation for thePSL, and Kevin Ayer of the Sensors Directorate,AFRL for fruitful technical discussions.
References
[1] ‘‘Understanding the infrared threat’’, Journal of ElectronicDefense, 22(2) (1999) 35.;‘‘Protecting the Big Boys: Directed IR Countermeasuresfor Large Aircraft’’, Journal of Electronic Defense, 23(12):(Dec 2000) 47.;‘‘Stingers and a sting: Arms smuggling’’, The Economist(US), 368 (8337):26 (16 Aug 2003);C. Spolar, Chicago Tribune (28 Nov 2002);‘‘Briton arrested by the FBI over missile smuggling’’, TheFinancial Times, 8 (16 Aug 2003);C. Bolkcom, B. Elias, A. Feickert, Homeland Security:Protecting Airliners from Terrorist Missiles, CongressionalResearch Service (CRS) Report for Congress, 2003.
[2] FLIR Systems. ThermaCAMTMSC3000 Operator�s Man-ual (A Edition), June 1999. Publ. No. 557379.
[3] J.A. Savage, Infrared Optical Materials and their Antire-flection Coatings, Adam Hilger Ltd., Bristol, 1985.
[4] C.A. Klein, B. diBenedetto, J. Pappis, Optical Engineering25 (4) (1986) 519–531.
[5] C.A. Klein, R.P. Miller, D.L. Stierwalt, Applied Optics 33(19) (1994) 4304–4313.
[6] E. Dereniak, G. Boreman, Infrared Detectors and Systems,John Wiley and Sons, Inc., New York, 1996.
[7] M.D. Mermelstein, K.A. Snail, R.G. Priest, OpticalEngineering 39 (2) (2000) 347–352.
[8] A. Leon-Garcia, Probability and Random Processes forElectrical Engineering, second ed., Addison-Wesley Pub-lishing Company, Reading, MA, 1994.
[9] R.R. Corwin, A. Rodenburgh, Applied Optics 33 (10)(1994) 1950–1957.
[10] D. DeWitt, Optical Engineering 25 (4) (1986) 596–601.[11] C.J. Fisher, P.M. Sherrouse, W.M. Ruyten, in: 11th
AIAA/AAAF International Conference—Space Planeand Hypersonic Systems and Technologies, 2002.