analysis of the operational performance of european …€¦ · lobo, antónio; couto, antónio...
TRANSCRIPT

Analysis of the operational performance of European urban rail transport networks – production efficiency and effectiveness
LOBO, António; COUTO, António
12th WCTR, July 11-15, 2010 – Lisbon, Portugal
1
ANALYSIS OF THE OPERATIONAL PERFORMANCE OF EUROPEAN URBAN
RAIL TRANSPORT NETWORKS – PRODUCTION EFFICIENCY AND
EFFECTIVENESS
LOBO, António, University of Porto, Faculty of Engineering, Porto, Portugal
COUTO, António. University of Porto, Faculty of Engineering, Porto, Portugal
ABSTRACT
This paper focuses on the analysis of the operational performance of a number of European metro systems by adopting a production function approach. To begin with, this study analyses the estimate of the inputs elasticities of the optimal production function. Next, it studies the efficiency and effectiveness levels of each company, by analysing service supplied and demand characterizing indicators, respectively. For these two purposes, stochastic production frontier models have been applied. Due to the fact that production effectiveness is influenced by the social-economic environment of the urban areas on which the metro systems operate, the influence of these external effects on effectiveness is estimated by regressing the effectiveness results on external variables. In addition, internal effects on effectiveness are evaluated. Keywords: metro systems, production, stochastic model, efficiency, effectiveness.
INTRODUCTION
Seeing that public services are usually explored by public entities (city councils, regional or central governments, etc.), metro systems do not regard financial profit as being their principal operational goal. Thus, providing each urban area with social and environmental benefits is considered to be their priority, which is achieved by providing adequate levels of mobility and accessibility in urban areas, in a rapid, safe and reliable manner. However, metro systems should optimize their resources and improve their operational performance in order to become less of a burden on public finances (Dodgson, 1985; Nash, 2000). This paper is concerned with the evaluation of the production of European metro systems rather than carrying out its cost analysis. Good reviews regarding studies about operational performance of transportation networks can be found in Dodgson (1985), Oum et al (1992), De Borger et al (2002) and Brons et al (2005).

Analysis of the operational performance of European urban rail transport networks – production efficiency and effectiveness
LOBO, António; COUTO, António
12th WCTR, July 11-15, 2010 – Lisbon, Portugal
2
In many other recent studies, a non-parametric methodology (data envelopment analysis – DEA) was performed to estimate the efficiency of bus networks (Pina, 2001; Boame, 2004; Odeck, 2008, Sampaio, 2008 and von Hirschhausen, 2010). The studies on urban rail performance are not so numerous. Graham et al (2003) performed a parametric model based on the Cobb-Douglas production function. The annual cross-sectional data provided by the Union Internationale des Transports Publics (UITP) was used to estimate input elasticities (99 observations). Then, these estimates were applied to the 17 systems’ time-series data, collected by the Railway Technology Strategy Centre (RTSC – Imperial College London) from 1994 to 1998, to decompose output and productivity growth, regarding the study of scale economies. Jain et al (2008) have built a 165 observation panel data sample based on the results of a questionnaire sent to metro companies. A non-parametric DEA model was performed to estimate systems’ technical and scale efficiencies and the results were compared between public, corporatized and private ownership systems. In a recent study, Graham (2008) provides a comparison between the use of parametric and non-parametric models in the estimation of productivity and efficiency of urban railways. Our study includes a parametric analysis of both heavy and light metros’ operational results and takes data obtained in the period of 1990 to 2006 into account. For each system, the data is composed of internal variables (characterizing capital and labour), external variables (characterizing the urban area where the system operates), a service supplied characterizing indicator (place kilometres) in addition to a demand characterizing indicator (passengers)1. Two distinct analyses have been performed on the database in question2. Firstly, in the section entitled Estimation of production efficiency and effectiveness, a random coefficient stochastic frontier model has been used to process internal indicators and outputs in order to establish an optimal production function. This process has led to the following results:
1. Inputs elasticities of the optimal production function – represent the changing rate of the output caused by a 1% improvement of a given input, while the other inputs are maintained constant. This rate refers to an overview of all the systems.
2. Technical efficiency – represents the rate between the production achieved by each system and the optimal production for the available resources. In the case of the output being an service supplied characterizing indicator, technical efficiency has simply been referred to as efficiency. However, when the output was considered to be a demand characterizing indicator, it has been called effectiveness.
In the following section, the influence of external indicators on production effectiveness has been analysed by taking the effectiveness results obtained in first regressed step on external variables into consideration. In addition, the effects on effectiveness of underlying
1 Inputs and outputs data were collected either in the annual reports or in the available information in the web pages of the metro companies. External indicators were collected in the Eurostat (2008) web page, based on the European Large Urban Zones (LUZ) classification. The concept of LUZ has been created by the Eurostat and the National Statistics Offices of the different countries of the European Union at the occasion of the European Commission's Urban Audit of 2004, in an effort to harmonize definitions of urbanization in the European Union. 2 Modelling estimation was made with the help of the econometric software Limdep (Greene, 2007).

Analysis of the operational performance of European urban rail transport networks – production efficiency and effectiveness
LOBO, António; COUTO, António
12th WCTR, July 11-15, 2010 – Lisbon, Portugal
3
characteristics of each system have been evaluated. Some conclusions may thus be drawn in relation to the following topics:
1. A global overview on the influence (either positive or negative) of each external variable in the effectiveness of European metro systems.
2. The size/scope of each system and its capacity to adequately serve the urban area on which it operates.
ESTIMATION OF PRODUCTION EFFICIENCY AND EFFECTIVENESS
Model description
Production function and technical efficiency
Production is, by definition, a process in which the available production resources (inputs) are used to obtain new products or services (outputs). This transformation is represented by the production function, which shows the range of input/output combinations that lead to a technically efficient production process (Varian, 1992). In other words, the production function describes the minimum input quantities required to obtain each quantity of output. In Figure 1, the production function y=f(x) represents the use of x units of a single input needed to produce y units of a single output.
Figure 1 – Production function
Thus, any point (x, y) contained in the curve or in the shaded area beneath represents the possibility of transforming a quantity of input x into a quantity of output y. However, only the points contained in curve represent 100% technical efficient production processes. A company operating in point A could become more efficient by approaching its production process with that optimal frontier, by either increasing its output using the same amount of input (point B) or by producing the same amount of output using less input (point C). The

Analysis of the operational performance of European urban rail transport networks – production efficiency and effectiveness
LOBO, António; COUTO, António
12th WCTR, July 11-15, 2010 – Lisbon, Portugal
4
points above the curve represent production options which are technologically impossible to achieve. The distance between points A and B represents optimization flaws in the use of the available resources. Seeing that point B is 100% efficient, technical efficiency (TE) in point A or in another generic point is obtained by Equation 1.
( )xfyTE = (1)
where y is the output produced by a company using x amount of input and f(x) is the maximum output that can be obtained with the same amount of input. f(x) is always greater than y and TE varies between 0 and 1, when the company achieves an optimal production process.
Cobb-Douglas production function
Equation 2 represents the general equation form of the single output production function.
( )n1 x,...,xfy = (2) where x and y are the amounts of inputs and output, respectively. In this paper, the Cobb-Douglas function3 has been used to establish the optimal frontier of the metro systems' operation. In the case of the single output, Cobb-Douglas takes the form of Equation 3 (Dodgson, 1985; Hooper, 1987).
n321n3210 x...xxxy βββββ ⋅⋅⋅⋅⋅= (3)
Linear form of Equation 3 is shown in Equation 4
nn xxxxy ln...lnlnlnln 3322110 ⋅++⋅+⋅+⋅+= βββββ (4) In the case, inputs elasticities (βk for 1≤k≤n) are assumed to be constants.
Stochastic frontier model
The database collected in this study is a panel data sample, in which several producers (metro companies) provide the same type of public service (urban rail transportation), during a set of time of observations (annual). Subsequently, the panel data sample combines two classes of categories:
1. Cross section – Several producers acting in the same segment during a simultaneous observation.
3 The use of a more flexible production function such as the translog function was taken into consideration but it was subsequently rejected due to multicollinearity issues.

Analysis of the operational performance of European urban rail transport networks – production efficiency and effectiveness
LOBO, António; COUTO, António
12th WCTR, July 11-15, 2010 – Lisbon, Portugal
5
2. Time Series – One producer acting in one segment for a particular set of time observations.
Due to the lack of information relating to production function, it is not possible to directly evaluate the efficiency of each company, thereby making it necessary to apply an econometric model, which may be deterministic or stochastic. Whilst in deterministic models, any deviation to the optimal frontier is attributed to the producer inefficiency, in stochastic models, that error is the sum of two components:
1. One side distribution error (ui) – Encompasses the effects of technical inefficiency, hence it is always positive. ui takes the form of an asymmetrical distribution.
2. Noise term (vi) – Represents the portion of the error that is random from any one observation to the next, capturing the productivity effects which are not caused by the producer. These effects may, for example, be related to the environment in which are not related to the production process (errors in data collection or in model specification). A noise term may either increase or decrease the output and therefore may assume positive or negative values. As far as a random error is concerned, the probability of being favourable is assumed to be equal to the probability of being unfavourable to the production, so vi takes the form of a normal and symmetrical distribution which is independent from ui.
In this paper, a stochastic frontier model has been used due to the fact that it is most adequate for the analysis of the operational performance of transport networks, which largely depends on social and economical environment in which those systems operate (Greene, 2000). Stochastic models are dated to 1977 and were introduced by Aigner, Lovell and Schmidt and by Meeusen and Van den Broeck. According to the deterministic models, the output yi of the ith producer is provided by the production function multiplied by a coefficient of technical efficiency TEi. Using the Cobb-Douglas function f(x, β) (Equation 3) as a deterministic production frontier, it is possible to rewrite Equation 1 as it follows in Equation 5.
( )β,iii xfTEy ⋅= (5) where xi is the vector of the inputs quantities strictly required to produce yi amount of output and β is the vector of the function coefficients (β0 is the constant and βk for 1≤k≤n are inputs elasticities). The logarithmical transformation of Equation 5 is the result of Equation 6.
( ) ( ) iiiiii uxfyTExfy −=⇔+= ββ ,lnlnln,lnln (6) where 0ln ≥−= ii ETu .
ui is a measure of technical inefficiency, since ii ET1u −≈ . Therefore, technical efficiency of the ith producer is obtained by Equation 7.
iui eTE −= (7)

Analysis of the operational performance of European urban rail transport networks – production efficiency and effectiveness
LOBO, António; COUTO, António
12th WCTR, July 11-15, 2010 – Lisbon, Portugal
6
As previously described, in stochastic models, a portion of inefficiency is attributed to a random error. Considering Equation 5 and Equation 7, the output of the ith producer estimated by stochastic modelling is provided by Equation 8.
( ) ( ) ( ) iiiii uvii
vuii
viii exfyeexfyexfTEy −− ⋅=⇔⋅⋅=⇔⋅⋅= βββ ,,, (8)
where evi represents the noise term. The technical efficiency of the ith producer, estimated by stochastic models, is then derived from Equation 9, in which the production deterministic frontier included in Equation 5 (f(xi,β)) is replaced by the stochastic frontier (f(xi,β). evi).
( ) ivi
ii exf
yTE⋅
=β,
(9)
Using the Cobb-Douglas function in addition to a logarithmical transformation in Equation 8 leads one to the stochastic model represented by Equation 10, in which the difference ε between the produced output yi and the frontier f(xi,β) aggregates both errors terms (ui and vi).
inni
iinni
xxxxyuvxxxxyεβββββ
βββββ+⋅++⋅+⋅+⋅+=⇔
⇔−+⋅++⋅+⋅+⋅+=
ln...lnlnlnlnln...lnlnlnln
3322110
3322110 (10)
where ii uv −=ε . The total error ε takes the form of an asymmetric distribution. In this paper, a half-normal distribution for the error ui has been adopted. These considerations are required to estimate technical efficiency, which is the efficiency fraction that directly depends on ability of producers to manage their resources, by stochastic models. For each observation, the application of Equation 7 to estimate technical efficiency requires the previous evaluation of the error ui. To estimate the value of E(ui|εi), which corresponds to the mean of its conditional distribution f(ui|εi), the approach proposed by Jondrow et al (1982) has been used. Therefore, it is possible to rewrite Equation 7 as:
( )iiuEi eTE ε|−= (11)
As has been previously referred, technical efficiency may simple be called to as efficiency when it is related to service supplied characterizing indicators and as effectiveness when relating to demand characterizing indicators. Thus, being efficient does not necessarily means being effective and vice versa. So, it is possible to have a company that uses its resources effectively but which is not effective in attracting the public or, alternatively, a system that wastes resources and which is always overcrowded.
Data processing
In the estimation of the efficiency and effectiveness of European metro systems, the variables which have been considered are:

Analysis of the operational performance of European urban rail transport networks – production efficiency and effectiveness
LOBO, António; COUTO, António
12th WCTR, July 11-15, 2010 – Lisbon, Portugal
7
Inputs: o Operational year (YR); o Network length in km (NL); o Number of stations (NS); o Number of carriages (NC); o Number of employees (NE); o The existence of fare gates (FG); o Dummy for number of employees (DE); o Dummy for output (DO).
Outputs: o Number of place kilometres; o Number of passengers.
The systems’ capital has been characterized by used network length (NL), number of stations (NS) and number of carriages (NC). Despite the simultaneous inclusion in the model of NL and NS could have introduced collinearity issues between these two variables, due to the fact that observed average distance between stations varies over a wide range, from 0.60 km to 1.45 km, both variables have been considered. Materials and energy consumption are variables provided in annual reports or web pages only by a small number of metro companies, not being considered in the model. However, it is expected that a system's consumption is proportional to its capital, being the effect of the former captured by the latter. The companies’ labour has been represented by the number of employees (NE). In a number of observations, in particular when a company operates more than one transport system in the same urban area (metro, tram, bus, etc.), the number of employees (NE) as well as both output variables are only available for all of the systems as a whole. In order to obtain the influence of these over measured values in the output of the metro systems, two dummies (DE and DO) were created. Thus, in the case of the number of employees or the output including other systems besides metro, the value 1 was considered, respectively. Should this not be the case, these values were considered to be null. The operational year (variable time trend YR) has been considered as input in the model, in order to capture the effect of productive experience throughout time. In addition to the variables already defined, FG is a dummy variable which was considered to be 1 when fare gate devices are used to control station entrances and 0 if this is not the case. It is expected that the inclusion of this effect will provide some control for the degree of automation of the system. Unobserved firm-specific database heterogeneity is a direct consequence of the possible use of different variables measurement methods by each company, which may in turn influence productivity results. This is the case of the output and employees statistics which, as previously mentioned, in certain cases include the figures of more than one transport system. Thus, a random parameter stochastic frontier model (Alvarez et al, 2004) that considers productivity floats which are not completely observable has been applied. The individual random coefficients are based on a single standard normal distribution and are only applied to DE and to the constant β0, in order to attenuate the main problem in data heterogeneity, namely, the over measurement of employees and outputs of some metro systems.

Analysis of the operational performance of European urban rail transport networks – production efficiency and effectiveness
LOBO, António; COUTO, António
12th WCTR, July 11-15, 2010 – Lisbon, Portugal
8
The model has been applied twice, once for each output. The collection of data provided less available data for output place kilometres than for output passengers. Whilst in the latter case, 154 observations were available, in the former, only 121 observations were obtained. In Table I are presented the analysed metro systems.
Table I – Features of the analysed metro systems4
Metro System YR
LUZ area (km2)
NL / 1.000.000
inhab.
NL / 1.000 EUR GDP per capita
NL / 100 km2
area
NS / 1.000.000
inhab.
NL / NS
Amsterdam 2005 830 31.42 1.30 5.12 38.44 0.82Barcelona 2006 7,755 17.38 5.36 1.11 21.04 0.83
Berlin 2006 17,405 29.19 7.34 0.83 34.25 0.85Bielefeld 2006 2,921 28.34 1.47 1.26 47.62 0.60Bochum 2006 145 40.08 0.53 10.55 55.02 0.73Brussels 2006 1,614 24.51 0.84 2.71 33.04 0.74Budapest 2006 2,538 13.06 2.20 1.24 16.64 0.79Cologne 2006 1,626 152.68 8.93 17.53 118.93 1.28
Düsseldorf 2006 1,201 40.09 1.56 5.10 64.85 0.62Essen 2006 210 53.85 1.03 14.67 75.18 0.72
Frankfurt 2006 4,305 23.22 1.55 1.36 33.28 0.70Glasgow 1998 3,346 5.88 0.38 0.31 8.48 0.69Hamburg 2006 7,304 32.10 3.17 1.38 28.37 1.13Hannover 2006 2,966 92.67 4.25 4.04 150.98 0.61Helsinki 2006 2,698 16.15 0.60 0.78 12.24 1.32Lisbon 2006 1,475 14.76 2.41 2.41 18.24 0.81London 2006 8,920 36.44 14.83 4.90 25.26 1.44Madrid 1998 8,023 26.13 7.25 1.70 26.13 1.00Milan 2005 2,767 18.92 3.14 2.68 21.44 0.88
Munich 2006 5,504 36.51 2.16 1.65 37.32 0.98Nuremberg 2006 2,935 24.23 0.99 1.06 31.26 0.78
Paris 2006 12,080 18.87 5.57 1.75 26.53 0.71Porto 2006 563 52.24 5.63 10.46 61.22 0.85
Prague 2006 6,977 28.52 4.64 0.79 26.49 1.08Rome 2004 5,352 9.95 1.96 0.68 13.06 0.76Turin 2006 6,830 3.52 0.39 0.11 5.16 0.68
Results and discussion
Input elasticities
In Table II and in Table III, respectively, input elasticities on the production of the output place kilometres and passengers are presented.
4 Area, population and GDP per capita of the different LUZ were collected in the Eurostat (2008) web page.

Analysis of the operational performance of European urban rail transport networks – production efficiency and effectiveness
LOBO, António; COUTO, António
12th WCTR, July 11-15, 2010 – Lisbon, Portugal
9
Table II – Input elasticities on the production of place kilometres Input β P[|Z|>z]
CONST 17.50 0.0%YR 0.02 6.9%NL 0.68 0.1%NS -1.31 0.0%NC 1.00 0.0%NE 0.18 0.7%FG 0.61 0.0%
Table III – Input elasticities on the production of passengers
Input β P[|Z|>z]CONST 12.68 0.0%
YR 0.02 0.2%NL 0.24 2.9%NS -0.69 0.0%NC 0.61 0.0%NE 0.60 0.0%FG 0.11 8.7%
P[|Z|>z] or P-value is associated with the confidence interval of the coefficients, which is the measure generally used to represent the statistical significance level of the influence of inputs on the output produced. Most coefficients are statistically significant at a 5% level and none of them is above 10%. It is now possible to drawn some conclusions about each input influences on final outputs.
YR – Time increases the production of both outputs, reflecting positive technological changes. By maintaining all production resources constant, firms tend to produce more, because this allows them to gain experience in the production process. The influence of YR on outputs is very low, although it has been considered as being positive.
NL and NS – Infrastructural variables have a strong influence on the outputs produced. However, they do so in opposite directions. Whilst increasing network length tends to increase outputs, more stations means less production. The influence of NL on place kilometres is about three times greater than on passengers. In fact, hypothetical network expansion, with the number of stations and trains remaining fixed, implies metro systems to lower frequencies of passing trains. Consequently, in the output passengers, this influence is less marked. Although new network extensions could serve more population, the higher distances between stations persuade these users to resist altering their transportation habits. The increase in the number of stations implies strong breaks in the production of place kilometres and passengers. More stopping times mean less fluidity in the system and a greater difficulty in adjusting train schedules. Besides, the increase of travel times could make metro systems less competitive in comparison to other transportation facilities, particularly as far as longer journeys are concerned.
NC – The increase of the rolling stock increases to a large extent the production, with elasticities of 1.00 and 0.61 for output service supplied level and passenger, respectively. Being favourable to place kilometres, this means that, from a global perspective,

Analysis of the operational performance of European urban rail transport networks – production efficiency and effectiveness
LOBO, António; COUTO, António
12th WCTR, July 11-15, 2010 – Lisbon, Portugal
10
European metro companies could put more trains on tracks without major congestion risks. In addition, with more rolling stock available, each firm would be capable of reducing frequencies and using more carriages per train. By reducing waiting times and offering the general public more space and comfort on board, companies become more appealing to the public thereby increasing passenger output.
NE – The increase of the number of employees raises the outputs produced. The elasticities are around of 0.18 and 0.60 respectively for output service supplied and passenger. This means that companies may be operating with some lack of labour force due to financial constraints. It seems as well that users may feel more attracted by more humanized systems, which generally achieve superior results in areas such as security or user support.
FG – The existence of fare gates benefits the production, but at a low impact levels. Although, this may cause some congestion at the station entrances, barriers tend to reduce unpaid travels thus increasing passenger numbers. However, the direction of causality is not clear: it may well be that it is the busiest and most heavily used systems that most require fare gates. The data did not allow us to explore this issue in greater detail.
Scale economies5 express the cumulative effect on the output which is originated by a simultaneous 1% increase in the inputs6 (capital and labour). In the following paragraphs, the results obtained in this paper are compared with the results obtained by Graham et al (2003):
Returns to scale (RTS) – RTS reflect the cumulative effect on the output which have the increase in 1% of all capital and labour characterizing inputs (NL, NS, NC and NE). In this paper, it was found decreasing RTS in both outputs (0.54 for place kilometres and 0.76 for passengers), which means that increasing all inputs makes firms less productive. In a study of urban rail transport, Graham et al (2003) obtained constant RTS (1 for the output passengers).
Returns to network (RTN) – RTN represent the cumulative effect on the output which have the increase in 1% of the infrastructural inputs (NL and NS), maintaining constant the other inputs. Obtained results in the current analysis revealed negative RTN (-0.63 for place kilometres and -0.45 for passengers), which are consistent with Graham et al (2003) results (-0.342 for the output passengers). Thus, larger urban rail networks, holding staff and fleet constant, are associated with fewer passenger journeys per annum, because they have a lower frequency of service.
Returns to density (RTD) – RTD reflect the cumulative effect on the output originate by an increase of 1% of the rolling stock and labour inputs (NC and NE), maintaining constant the other inputs. Thus, we find on average, that if the use of factors associated with density increases by 10%, the average output of urban rail operations increases by
5 For an overview about transport economies of scale, see Savignat et al (1999). 6 Increasing scale economies occur when the increase of the output is greater than 1%. Constant scale economies take place when the improvement on the output is exactly 1%. Decreasing scale economies happen when the gain on the output is placed between 0% and 1%. Negative scale economies occur when the effect on the output takes a negative value.
Analysis of the operational performance of European urban rail transport networks – production efficiency and effectiveness
LOBO, António; COUTO, António
12th WCTR, July 11-15, 2010 – Lisbon, Portugal
11
about 12%, which is, once again, consistent with Graham et al (2003) results of 13.4%. Therefore, firms may be more productive by operating more intensively their networks.
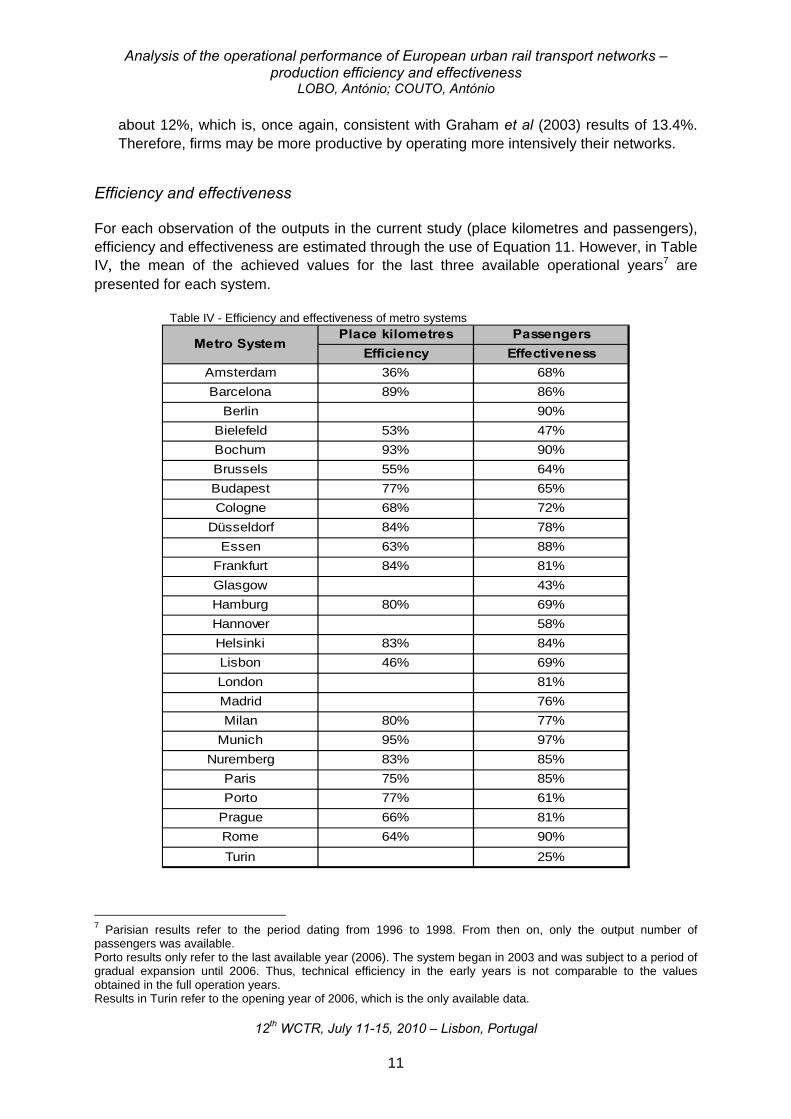
Efficiency and effectiveness
For each observation of the outputs in the current study (place kilometres and passengers), efficiency and effectiveness are estimated through the use of Equation 11. However, in Table IV, the mean of the achieved values for the last three available operational years7 are presented for each system.
Table IV - Efficiency and effectiveness of metro systems Place kilometres Passengers
Efficiency EffectivenessAmsterdam 36% 68%Barcelona 89% 86%
Berlin 90%Bielefeld 53% 47%Bochum 93% 90%Brussels 55% 64%Budapest 77% 65%Cologne 68% 72%
Düsseldorf 84% 78%Essen 63% 88%
Frankfurt 84% 81%Glasgow 43%Hamburg 80% 69%Hannover 58%Helsinki 83% 84%Lisbon 46% 69%London 81%Madrid 76%Milan 80% 77%
Munich 95% 97%Nuremberg 83% 85%
Paris 75% 85%Porto 77% 61%
Prague 66% 81%Rome 64% 90%Turin 25%
Metro System
7 Parisian results refer to the period dating from 1996 to 1998. From then on, only the output number of passengers was available. Porto results only refer to the last available year (2006). The system began in 2003 and was subject to a period of gradual expansion until 2006. Thus, technical efficiency in the early years is not comparable to the values obtained in the full operation years. Results in Turin refer to the opening year of 2006, which is the only available data.

Analysis of the operational performance of European urban rail transport networks – production efficiency and effectiveness
LOBO, António; COUTO, António
12th WCTR, July 11-15, 2010 – Lisbon, Portugal
12
Efficiency and effectiveness values obtained by metro companies are consequence of two main factors:
1. Management policies.
2. Influence of external variables.
Management policies mainly influence the efficiency of the service supplied characterizing output (place kilometres). These practices are carried out by the administrators who determine input types and quantities, as well as the technological level of the production process. In most metro systems, management policies are determined by financial constraints imposed by other public or private organisms. The effectiveness of the demand characterizing output (passengers) is largely influenced by external variables, such as the demographic, economic and social features of the urban area served by the system in question, in addition to the competition presented by other transportation systems operating in the same area (other railway systems, bus, etc.). In fact, building a new metro network or expanding an already existing one is only justified in the case of the current transportation systems being overcrowded, or alternatively, if there is a lack of public transportation in the urban areas. Besides these factors, it is necessary to assure that a sufficient number of people served by the new tracks are receptive to using the system. Should these requirements be met, a non explored market share will have been created, which represents a possibility of achieving satisfactory effectiveness results. However, there are a number of examples in which management policies have influence on effectiveness or external variables affect efficacy. In the former case, good advertising campaigns and clean and secure stations are some of the many possible administration strategies oriented towards capturing more users for the systems in question. On the contrary, management practices that lead to inefficiency and poor providing services can bring about an indirect reduction of passengers and, consequently, effectiveness. In the latter case, one may consider the example of the social-economic changes that lead to less demand. After a certain period, firms can try to adjust their business to the new circumstances by reducing the service they provide. Due to the fact that in the short term and from a technical viewpoint, it is very complex to reduce the inputs on infrastructure, rolling stock and labour, the cuts in the output service supplied will lead to an increase of inefficiency. Decisions regarding input cuts may be a sensitive issue that may raise some opposition amongst workers, who are afraid of losing their jobs, and amongst the actual community, who is concerned with reductions in the quantity or quality of the service provided by the metro company. Contrary to these examples, the main effects of management policies are felt on efficiency, whilst effectiveness is affected by external dynamics. As a result, it is easier for the companies to improve their efficiency, seeing that they only need to rely on themselves to adopt the most effective management strategies possible. The chart in Figure 2 provides an overview on the efficiency and effectiveness of the metro systems which have been studied by presenting the available data in relation to both of the above mentioned outputs.

Analysis of the operational performance of European urban rail transport networks – production efficiency and effectiveness
LOBO, António; COUTO, António
12th WCTR, July 11-15, 2010 – Lisbon, Portugal
13
Figure 2 – Efficiency and effectiveness of metro systems
Results are displayed in quadrants, in order to facilitate comparisons amongst systems.
1st quadrant (efficiency and effectiveness above 65%) – The firms in this quadrant have achieved the best compromise between efficiency and effectiveness. They have managed their resources well and are simultaneously attractive to the general public.
2nd quadrant (efficiency from 30% to 65% and effectiveness above 65%) – The companies in this quadrant are those who depend more on themselves to achieve better results. As they have obtained good effectiveness scores, they only have to improve their management strategies to move up into the first quadrant.
3rd quadrant (efficiency and effectiveness from 30% to 65%) – The firms in this quadrant presented the worse results of the group. Therefore, they need to simultaneously improve their management practices and policies, as well as to await more favourable changes in the socio-economic dynamics of the urban areas, so as to be capable of moving into the first quadrant.
4th quadrant (efficiency above 65% and effectiveness from 30% to 65%) – Metro systems in this quadrant are efficient. However, they need to attract a larger number of users. Consequently, companies are dependent on external dynamics to improve their effectiveness. Despite this, they should put in practice more aggressive market
Ams
Bar
Bie
Boc
BruBud
Col
Dus
Ess
Fra
Ham
Hel
Lis
Mil
Mun
Nur
Por
Pra
Rom
Par
30%
65%
100%
30% 65% 100%
Effe
ctiv
enes
s (P
asse
nger
s)
Efficiency (Place kilometres)

Analysis of the operational performance of European urban rail transport networks – production efficiency and effectiveness
LOBO, António; COUTO, António
12th WCTR, July 11-15, 2010 – Lisbon, Portugal
14
competitiveness policies, make more advertising campaigns, as well as improve security conditions and cleanliness in order to attract more passengers.
In terms of firms comparative analysis, Munich shows to be the best performing system, with the highest efficiency and effectiveness levels. On the contrary, Amsterdam has the least efficient system and Bielefeld has the least effective network. It is thus possible to conclude that most systems follow good management policies and are simultaneously attractive to the public. Consequently, they are placed in the first quadrant. In this paper, obtained average efficiencies vary from 36% to 95% and effectiveness is placed between 19% and 97%. Technical efficiency of urban transportation systems varies over a very wide range. This is patent in the overview performed by De Borger et al (2002), where diverse authors’ results vary from 24% to 100%8. From that study, it is highlighted the results obtained by Gathon (1989), who have performed a parametric frontier model (translog production function) and found technical efficiencies between 58% and 100%. The results obtained in the current paper are also consistent with the results of the non-parametric frontier models. In studies for urban bus and rail transportation systems, Wunsch (1994 and 1996) found average technical efficiency between 43% and 100%, using a free disposal hull (FDH) model, and between 26% and 100%, using a DEA model. Jain et al (2008) estimated technical efficiency ranging from 35% to 100%, also using a DEA methodology.
ANALYSIS OF EFFECTIVENESS RESULTS
Methodology
External variables have been considered to have a significant influence on the effectiveness of metro systems. In order to estimate the influence of each external indicator on effectiveness, a linear regression expressed by the following equation has been carried out:
( ) εααααα +⋅++⋅+⋅+⋅+= nnt xxxxEE ln...lnlnlnln 3322110 (12) where EEt is the total effectiveness estimated in the previous part of the current analysis. Coefficients βk were replaced by αk, in order to distinguish between external influences (αk for 1≤k≤n) and input elasticities (βk for 1≤k≤n). The concept of elasticity does not make sense in this context, due to the fact that a production analysis has not been performed in the current part of this study. Besides the coefficients αk, for each observation, the logarithm of the external effectiveness (EEext) has been predicted by using the linear regression in Equation 12. Seeing that the independent variables xi correspond to the external indicators, the predicted effectiveness is thus the sum of the influence of these indicators and the constant α0. Therefore, it is possible to write Equation 13.
8 Studies included in De Borger et al (2002) have adopted distinct methodologies. Moreover, in some of those references, authors have considered other types of transportation systems in addition to metro networks. Despite this fact, the results obtained in the present study are consistent with the other authors’ analysis.

Analysis of the operational performance of European urban rail transport networks – production efficiency and effectiveness
LOBO, António; COUTO, António
12th WCTR, July 11-15, 2010 – Lisbon, Portugal
15
( ) ( ) ( )exttsys EEEEEE lnlnln 0 −−= α (13)
where EEext is the effectiveness caused by external variables and EEsys is the portion of effectiveness related to the underlying characteristics of the system in question. Following the estimation of EEsys by Equation 13, the results are then adjusted by the transformation presented in Equation 14.
( )maxsys
syssys EE
EEAEE = (14)
where AEEsys is the adjusted effectiveness caused by the underlying characteristics of the system and (EEsys)max is the maximum observed value for EEsys. Therefore, AEEsys is always equal to or less than 1 and all of the observations are compared to the one which is considered to be the most efficient.
Data processing
In the estimation of the influence of external indicators on the effectiveness of the European metro systems, the variables that have been used are:
Independent variables9: o Population density of the urban area in nr/m2 (PD); o Percentage of single person households (SPH); o Gross Domestic Product per capita in EUR10 (GDP); o Percentage of the population with secondary education (SE); o Number of registered cars per 1000 inhabitants (RC); o Dummy for output (DO); o The existence of other metro systems (OM); o The existence of tramway systems (TR).
Dependent variable: o Total effectiveness (EEt).
DO reflects the influence on effectiveness due to the fact of reported output include figures of other transportation systems run by the same company. Being this the case, DO assumed the value 1. Should this not be the case, the value in question was considered to be null. OM and TR were considered to be the value 1 when there are other metros or trams operating in the same urban area and the value 0 if this was not the case11.
9 PD, SPH, GDP, SE and RC were the variables collected from the Eurostat (2008) which have been considered to be the most relevant to the demographic, social and economic characterization of the analysed LUZ. 10 GDP was converted at 2000 constant prices. 11 The competition represented by the bus sector has not been considered, the existence of bus networks was a constant in all of the cities under analysis.

Analysis of the operational performance of European urban rail transport networks – production efficiency and effectiveness
LOBO, António; COUTO, António
12th WCTR, July 11-15, 2010 – Lisbon, Portugal
16
Results and discussion
Influence of external variables on effectiveness
Table V presents the influence of each external variable on effectiveness.
Table V – Influence of external variables on effectiveness Indicator α P[|Z|>z]CONST -1.19 8.9%
OM 0.13 2.3%TR 0.28 0.0%PD -0.09 1.1%
SPH -0.45 0.1%GDP 0.22 0.1%SE 0.19 0.3%RC -0.22 3.9%
DO 0.14 1.1% Effectiveness is related to the distance from the operational point to the stochastic production frontier and expresses the optimization level of the available resources in the production of output passengers. In fact, effectiveness depends not only on the number of people transported, but also on the adaptation of the use of inputs to the amount of output produced. Thus, a system could transport more passengers and be considered to be less effective than another which uses quantities of inputs which are more suitable for the output produced. In this case, the latter company would be considered as being closer to the optimal production frontier, even if it transported an inferior amount of passengers. Statistical significance levels for the results in Table V are situated below the maximum value of 5%, with the exception of the constant. However, the statistical significance level remains under 10%. Therefore, a number of conclusions relating to results may be drawn:
OM and TR – Despite the risk of losing passengers to other transportation systems, the existence of internal competitors encourage firms to become more effective, through the management of their resources so as to approach the optimal production frontier.
PD – The increase of population density seems to reduce effectiveness. In fact, in a city that is growing rapidly in terms of population, there is always the risk of overcrowding transportation systems if the expansion of the already existing networks or the creation of new ones has not been duly anticipated.
SPH – The increase of single person households reduces effectiveness. In the case of the European population, which is considered to be old and on the increase, many single person households are formed by elderly people, which generally have fewer mobility needs and more difficult in doing so.
GDP – The GDP per capita growth has positive effects on effectiveness. This is a natural result since GDP measures the wealth of urban areas. A prosperous economic

Analysis of the operational performance of European urban rail transport networks – production efficiency and effectiveness
LOBO, António; COUTO, António
12th WCTR, July 11-15, 2010 – Lisbon, Portugal
17
environment intensifies mobility needs. In such cases, firms have more money to invest in upgrading their productive process.
SE – The increase of the population with secondary education benefits effectiveness. In developed countries, higher instructed people are more sensitive to cultural pleasing and consequently have more mobility needs, as well as they have, generally speaking, more conscience about ecology and sustainable development, tending to use more public transportation.
RC – As expected, increasing the use of private transportation has the opposite effect on public transports thereby decreasing their effectiveness.
DO – The operation of other transportation systems by the same company is favourable to the output. In such cases, it is easier to implement efficiently intermodality management measures. Also companies could adopt better practices to manage greater quantities of resources.
Adjusted internal effectiveness
The chart in Figure 3 compares total effectiveness to the portion of effectiveness that is caused by underlying characteristics of European metro systems. These characteristics may represent capital, labour or any unobserved distinctive feature. The comparison between EEt and AEEsys permits one to judge the adequacy of the system in terms of the surrounding environment, namely if the system’s dimension is appropriate for the size and characteristics of the urban area which is being served. Once again, in Figure 3, the data presented for each system represents the mean of the achieved results in the last three available operational years, for the reasons previously referred to.

Analysis of the operational performance of European urban rail transport networks – production efficiency and effectiveness
LOBO, António; COUTO, António
12th WCTR, July 11-15, 2010 – Lisbon, Portugal
18
Figure 3 – Total effectiveness versus adjusted internal effectiveness
Once again, the results have been displayed in quadrants and, consequently, a number of conclusions may be drawn:
1st quadrant – Networks in this quadrant achieve good EEt results by depending more on internal factors and less on external indicators. Due to the fact that they attract the general public, they also have high AEEsys scores. Their dimension is appropriate for operating effectively in the urban areas being served.
2nd quadrant – Companies in this quadrant have obtained high EEt scores due to external effects. In reality, they should respond to the favourable environment in which they find themselves in and improve AEEsys, by a better managing their resources or by planning new expansions. The respective urban areas probably have a lack of public transportation.
3rd quadrant – Firms in this quadrant have the worst scores both in terms of EEt and AEEsys. Lower values of EEt are typical in smaller urban areas where it is common to build networks which are much bigger than required to achieve good effectiveness results. This being the case, these companies should aim to improve the optimization of their resources and thus AEEsys, so as to attract more users to their systems. On the other hand, planning new expansions could cause the systems to become even more oversized.
Ams
Bar
Ber
Bie
Boc
BruBud
Col
Dus
Ess
Fra
Gla
Ham
Han
Hel
Lis
Lon
MadMil
Mun
Nur Par
Por
Pra
Rom
Tur
20%
60%
100%
20% 60% 100%
Tota
l Effe
ctiv
enes
s
Adjusted Internal Effectiveness

Analysis of the operational performance of European urban rail transport networks – production efficiency and effectiveness
LOBO, António; COUTO, António
12th WCTR, July 11-15, 2010 – Lisbon, Portugal
19
4th quadrant – Systems in this quadrant are also oversized in relation to the respective urban area. Due to the fact that good results in AEEsys have already been achieved and since it is difficult to reduce both the infrastructure and the amount of workers on a short term basis, firms are not capable of taking significant measures to improve EEt. The alternative is for them to invest in competitive policies and good advertising campaigns where the main advantages of the metro systems are pointed out, namely the fact that they are fast, reliable and eco-friendly.
Most of European metro systems are of an appropriate dimension and manage their resources well in order to respond to high volumes of passengers. Munich, Berlin, and Rome are considered to be the best in this field. These systems have achieved elevated levels of effectiveness by depending more on their good management policies and less on external factors. On the other hand, Turin has been considered to have lower values of effectiveness. One should take into consideration the fact that this network opened in 2006 (the only data available) and would subsequently be expanded. As such, the panorama presented for Turin is not the same as it will be when the system is in full operation. Glasgow and Bielefeld present low effectiveness results and a large margin to improve their management resources. The first is formed by a single circular line in the city centre. Hence its area of influence is reduced. The second is oversized when compared to the small city that it serves. The Porto system has also been classified as being oversized. However, it is the best capable of managing its resources.
CONCLUSIONS
In this paper, an analysis of the operational performance of European metro systems has been carried out. A stochastic frontier model, based in the Cobb-Douglas function, to evaluate inputs elasticities and systems technical efficiency of the production process of two outputs (place kilometres and passengers) has been used in the first section of this study. Consequently, the variables which have positive elasticities on both outputs are: operational year, network length, number of carriages, number of employees and the existence of fare gates. On the other hand, increasing the number of stations, i.e. decreasing average distance between stations, has been found to reduce outputs. Cumulative effects of capital and labour elasticities revealed that globally European metro systems have decreasing RTS. Thus, the simultaneous increase of those inputs in 1% has a smaller effect than proportional on the produced output, which could mean that network expansion increases the output, but brings lower productivity of the European metro systems panorama. With regards to the registered levels of efficiency and effectiveness, one may assume that most of the systems have a good operational performance as far as these parameters are concerned. Three systems have been found to stand out:
o Munich due to the fact that it is the most efficient and effective; o Amsterdam as a result of being the least efficient; o Bielefeld for the reason that it is the least effective.
In the second part of this study, the effectiveness has been regressed on external variables.

Analysis of the operational performance of European urban rail transport networks – production efficiency and effectiveness
LOBO, António; COUTO, António
12th WCTR, July 11-15, 2010 – Lisbon, Portugal
20
As such, the external indicators most favourable to effectiveness results are: the existence of other metro systems, the existence of tramway systems, Gross Domestic Product per capita, percentage of the population with secondary education and number of registered cars per 1000 inhabitants. The companies which operate simultaneously other transportation systems than metro in the same urban area tend to be more effective. The external variables whose expansion has negative effects on effectiveness are: population density of the urban area and the percentage of single person households. The total effectiveness and the adjusted internal effectiveness have also been compared. Therefore, it is possible determine which systems are capable of raising their effectiveness scores by improving their management strategies, in addition to those systems whose dimension and/or type of service are not adequate for the size and characteristics of the urban areas they serve. As such, seven systems are highlighted:
o Munich, Berlin and Rome which have the best effectiveness results and are the least dependent on external factors;
o Turin, Glasgow and Bielefeld which have been classified as having the lowest effectiveness scores, as well as weak management policies;
o Porto which has been found to be oversized and to have a poor effectiveness level but which is the most efficient as far as the management of resources is concerned.
REFERENCES
Aigner, D., Lovell, C. A. and Schmidt, P. (1977). Formulation and estimation of stochastic frontier production functions. In: Journal of Econometrics, Vol. 6, pp. 21-37, North-Holland Publishing Company / Elsevier, Amsterdam.
Alvarez, A., Arias, C. and Greene, W (2004). Accounting for unobservable in production models: management and inefficiency. Working Paper E2004/72, Centro de Estudios Andaluces, Fundación Pública Andaluza, Seville.
Boame, A. K. (2004). The technical efficiency of Canadian urban transit systems. In: Transportation Research Part E, Vol. 40, pp. 401-416, Elsevier, Amsterdam.
Brons, M., Nijkamp, P., Pels, E. and Rietveld, P. (2005). Efficiency of urban public transit: A meta analysis. In: Transportation, Vol. 32, pp. 1-21, Springer Netherlands, Doetinchem.
De Borger, B., Kerstens, K. and Costa, A. (2002). Public transit performance: what does one learn from frontier studies?. In: Transport Reviews, Vol. 22, No. 1, pp. 1-38. Routledge / Taylor & Francis, Abingdon, Oxfordshire.
Dodgson, J. S. (1985). A survey of recent developments in the measurement of rail total factor productivity. In: International Railway Economics (K. J. Button and D. E. Pitfield, eds.), pp. 13-48, Gower, Aldershot, Hampshire.
Eurostat (2008). http://ec.europa.eu/eurostat. Graham, D. J., Couto, A., Adeney, W. E. and Glaister, S. (2003). Economies of scale and
density in urban rail transport: effects on productivity. In: Transportation Research Part E, Vol. 39, pp. 443-458, Pergamon Press / Elsevier, Amsterdam.
Graham, D. J. (2008). Productivity and efficiency in urban railways: Parametric and non-parametric estimates. In: Transportation Research Part E, Vol. 44, pp. 84-99, Elsevier, Amsterdam.

Analysis of the operational performance of European urban rail transport networks – production efficiency and effectiveness
LOBO, António; COUTO, António
12th WCTR, July 11-15, 2010 – Lisbon, Portugal
21
Greene, W. H. (2000). Econometric Analysis – Fourth Edition. Prentice Hall International Editions, Upper Saddle River, New Jersey.
Greene, W. H. (2007). Limdep Version 9.0 – Econometric Modeling Guide. Econometric Software, Inc., Plainview, New York.
Hooper, P. G. (1987). Productivity change in transport: a survey. In: Transport Reviews, Vol. 7, No. 4, pp. 341-367, Routledge, New York.
Jain, P, Cullinane, S. and Cullinane, K. (2008). The impact of governance development models on urban rail efficiency. In: Transportation Research Part A, Vol. 42, pp. 1238-1250, Elsevier, Amsterdam.
Jondrow, J., Lovell, C. A., Materov, I. S. and Schmidt, P. (1982). On the estimation of technical inefficiency in the stochastic frontier production function model. In: Journal of Econometrics, Vol. 19, pp. 233-238, North-Holland Publishing Company / Elsevier, Amsterdam.
Meeusen, W. and Van den Broeck, J. (1977). Efficiency Estimation from Cobb-Douglas Production Function with Composed Error. International Economic Review, Vol. 18, No.2, pp. 435-444, Department of Economics of the University of Pennsylvania and Osaka University Institute of Social and Economic Research Association, Philadelphia, Pennsylvania.
Nash, C. (2000). Modelling performance: rail. In: Handbook of Transport Modelling (D. A. Hensher and K. J. Button, eds.), pp. 565-575, Pergamon Press / Elsevier, Amsterdam.
Odeck, J. (2008). The effect of mergers on efficiency and productivity of public transport services. In: Transportation Research Part A, Vol. 42, pp. 696-708, Elsevier, Amsterdam.
Oum, T. H., Tretheway, M. W. and Walters, W. G. (1992). Concepts, methods and purposes of productivity measurement in transportation. In: Transportation Research Part A, Vol. 26A, No. 6, pp. 493-505, Pergamon Press / Elsevier, Amsterdam.
Pina, V. and Torres, L. (2001). Analysis of the efficiency of local government services delivery. An application to urban public transport. In: Transportation Research Part A, Vol. 35, pp. 929-944, Pergamon Press / Elsevier, Amsterdam.
Sampaio, B. R., Neto, O. L. and Sampaio, Y. (2008). Efficiency analysis of public transport systems: Lessons for institutional planning. In: Transportation Research Part A, Vol. 42, pp. 445-454, Elsevier, Amsterdam.
Savignat, M. G. and Nash, C. (1999). The case for rail reform in Europe – evidence from studies of production characteristics of the rail industry. In: International Journal of Transport Economics, Vol. XXVI, No. 2, pp. 201-217, Fabrizio Serra Editore, Rome.
Varian, H. R. (1992). Microeconomic Analysis – Third Edition. W. W. Norton & Company, Inc., New York.
Von Hirschhausen, C and Cullmann, A. (2010). A nonparametric efficiency analysis of German public transport companies. In: Transportation Research Part E, Vol. 46, pp. 436-445, Elsevier, Amsterdam.
Wunsch, P. (1994). Costing Busses: Back to the Basics. FUSL (SMASH Cahier 9405), Brussels.

Analysis of the operational performance of European urban rail transport networks – production efficiency and effectiveness
LOBO, António; COUTO, António
12th WCTR, July 11-15, 2010 – Lisbon, Portugal
22
Wunsch, P. (1996). Cost and productivity of major urban transit systems in Europe: an exploratory analysis. In: Journal of Transport Economics and Policy, Vol. 30, No. 2, pp. 171-186, University of Bath, Claverton Down, Bath.