analysis of the impact of interest rates on automobile...
TRANSCRIPT
10 TRANSPOKI'ATION RESEARCH RECORD 1116
Analysis of the Impact of Interest Rates on Automobile Demand
FRED L. MANNERING
The popularity of Interest rate Incentive programs as a means of boosting new car sales has been puzzling to many industry analysts. In this paper, an econometric analysis is undertaken to determine how consumers value interest rates in their new car choice decisions. The findings suggest that consumers tend to overvalue interest rates relative to their true worth, thus explaining the surprising success of Interest rate incentive programs. Moreover, estimation results indicate that domestic manufacturers can reap greater benefits from Interest rate overvaluatlon than can their Japanese competitors.
Since the early 1980s, American automobile manufacturers have increasingly relied on rebate and interest rate incentives to boost sales of new automobiles. These sales incentives have been offered with the primary objective of reducing inventory, and their success in achieving this objective has been undeniable ( 1 ). However, the ever-increasing reliance of manufacturers on new car sales incentives has given rise to an inadvertent market impact. This impact stems from recent sales figures that appear to suggest that consumers may have become so accustomed to sales incentives that they are willing to forego vehicle purchases until sufficiently attractive incentives are offered. Such behavior represents an important alteration of consumer expectations and makes it extremely important, from an industry perspective, that the relative impact of various incentive programs on new car demand be well understood.
In recent years, a variety of interest rate programs have virtually replaced the cash rebate programs that enjoyed widespread popularity at the beginning of the decade. Automobile manufacturers have apparently found interest rate incentives to be more attractive to consumers than other previously implemented programs. However, the precise impact of interest rates on new car sales remains somewhat of a mystery.
The purpose of this paper is to empirically analyze the impact of interest rate incentives on new car sales. In particular, the following questions will be addressed: How much are consumers willing to pay (in terms of increased vehicle capital costs) for a reduction in interest rates? How sensitive are consumers to changes in automobile interest rates? In terms of 1986 model offerings, which automobile manufacturer is likely to benefit the most from interest rate incentives? Answers to these questions will provide valuable insight into the interest rate/automobile demand relationship and the potential impacts of future incentive programs.
University of Washington, 121 More Hall FX-10, Seattle, Wash. 98195.
Although research on automobile demand has made significant progress in the past few years (2-6), previous efforts have not explicitly addressed the effects of buyer incentive programs. This situation is due largely to the lack of data on such programs and the reliance of most previous work on the actual revealed preferences of the automobile consumer. In this paper, carefully constructed hypothetical choices are presented to a sample of potential automobile consumers, thus enabling a careful and explicit examination of interest rate incentive programs. The use of such hypothetical choices follows the efforts of Calfee (7), which address the potential market penetration of electric vehicles, and Mannering and Chu Te (8), who consider the effects of manufacturer sourcing.
The paper begins with a discussion of the econometric approach and a description of the survey and resulting data sample. Next, estimation results are presented and their significance is assessed, followed by a discussion of policy implications and, finally, conclusions and directions for future work.
ECONOMETRIC APPROACH
To arrive at an estimable econometric model, it will be assumed that individuals exhibit utility maximizing behavior. The utility provided by each vehicle alternative is defined to be a linear function,
where
U; xlri
pld
= = =
indirect utility provided by vehicle i, value of attribute k on vehicle i, and estimable parameters.
(1)
If a disturbance term is added to Equation 1 such that V; = U; + E; and these terms are distributed with a generalized extreme vague (GEV) distribution, it can be shown (9) that the vehicle choice probabilities are given by the standard multinomial logit model,
eU· P(i I s) = --' .
L eU; (2)
where P(i I s) equals the probability of selecting vehicle i from the set of vehicles s, and U; equals the utility provided by vehicle i as specified in Equation 1.
Manne ring
Multinomial logit models are typically estimated on the basis of revealed preferences with a single choice made by each respondent in the sample. Under these conditions, the disturbance term,£, accounts for the taste variation from one decision maker to the next. In contrast to the revealed preference approach, recent studies (7-8) have presented decisionmakers with repeated hypothetical choice sets from which individuals select a utility maximizing alternative. Under these conditions, a logit model can be estimated for each individual as opposed to the single model estimated in the traditional revealed preference approach. With repeated hypothetical choices the disturbance term, £, accounts for a single individual's taste variation from one choice to another, as opposed to taste variations between individuals (7, 10).
To evaluate the impact of interest rate incentives on new car demand, sets of repeated hypothetical choice situations are presented to each survey participant. The use of such hypothetical choices permits a wide range of choice set variation particularly with respect to interest rates. Such variation is simply not available in known revealed preference data [Information on typical automobile-related revealed preference data is described by Mannering and Train (11) and Hensher (12).]. These repeated choice observations will be used to estimate individual logit models (one for each individual) as well as a single overall logit model that will treat choice observations as if they were all made by different respondents.
The estimation of a single overall logit model with repeated observations for each respondent gives rise to an obvious correlation of disturbances because the unobserved influences affecting a specific individual's choice are likely to be correlated from one of his selections to the next. Explicitly accounting for such individual effects in the context of discrete choice models in general, and the multinomial logit model in particular, can be an extremely difficult task (13). In this paper, the possible correlation of error terms is not explicitly accounted for in the overall logit model and hence the results must be viewed with some caution (14-16).
One correctable outgrowth of repeated observations on individual respondents is the estimated standard errors of model coefficients, which will be understated by standard estimation packages. A valid conservative correction for package-reported standard errors is to multiply them by the square root of the number of repeated observations used from each respondent. This correction procedure has been successfully applied in studies of this type (17). All of the overall logit model standard errors presented in this paper are corrected by this procedure.
SURVEY DESIGN AND SAMPLE DESCRIPTION
The survey form consisted of four distinct parts. The first part provided extensive information for participants, including the choice environment they were to imagine themselves to be in (i.e., considering the purchase of a new car) and the vehicle attributes that they were to consider in their choices. The second part collected general information relating to the participant's household income, age, current vehicle ownership, artd so on. The third part consisted of the hypothetical vehicle choice sets. The survey form concluded with a detailed de-
11
briefer in which the comments and suggestions of participants were collected.
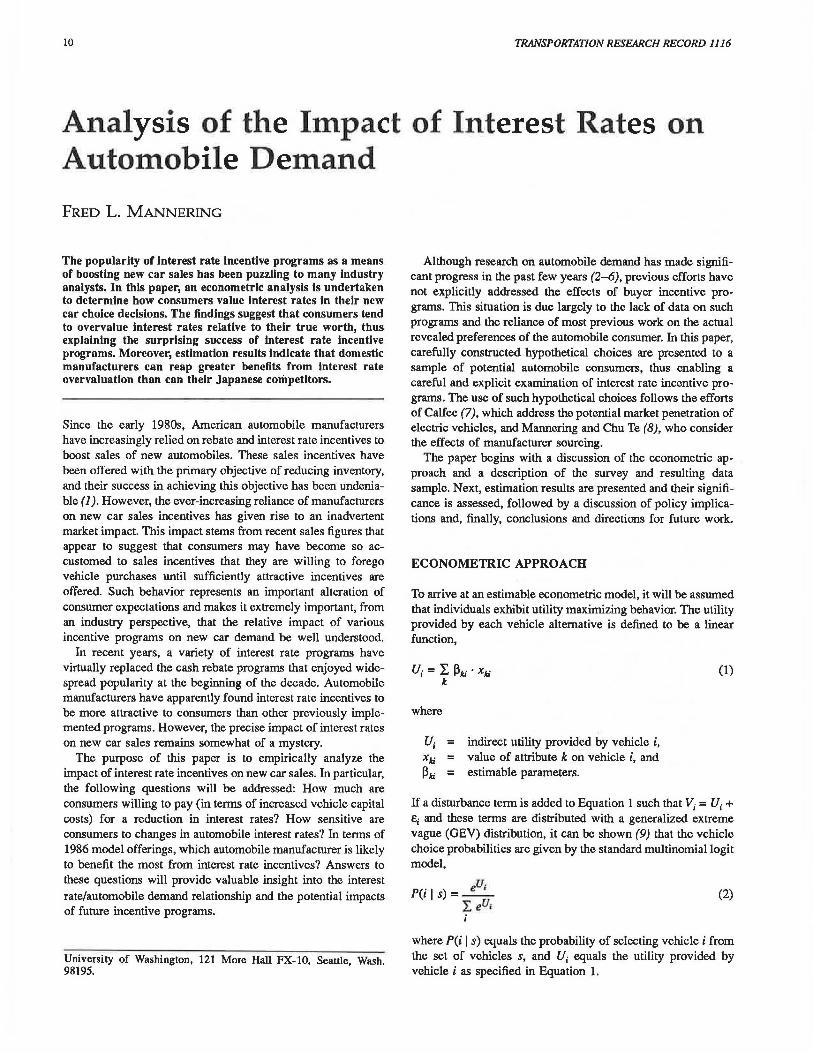
The information included in the hypothetical choice sets consisted of vehicle make (Chevrolet, Chrysler, Ford, Honda, Mazda, Nissan, Toyota, Subaru), purchase price, fuel efficiency (in miles per gallon), reliability index (scaled from 1 to 5), and the annual loan interest rate. A typical choice set is given in Table 1. Each participant was given 30 such new vehicle choice
TABLE 1 SAMPLE VEHICLE CHOICE SET
Attribute Choice A Choice B Choice C
Vehicle make Chevrolet Ford Nissan Price ($) 6,000 8,400 10,700 Miles per gallon 27 17 31 Reliability index (1 = poor, 3
= average, 5 = excellent) 1 2 3 Annual loan interest rate (%) 7.6 9.5 10.0
sets, all of which contained 3 vehicles. The participant was then asked to select one of the 3 vehicles for each of the 30 choice sets. Amortization tables were provided to permit participants to make monthly payment calculations. The survey's objective was to ensure that all participants carefully and meticulously consider their vehicle choices. Because survey completion times generally ranged from 25 to 45 minutes, it can be assumed that the survey instrument achieved this objective.
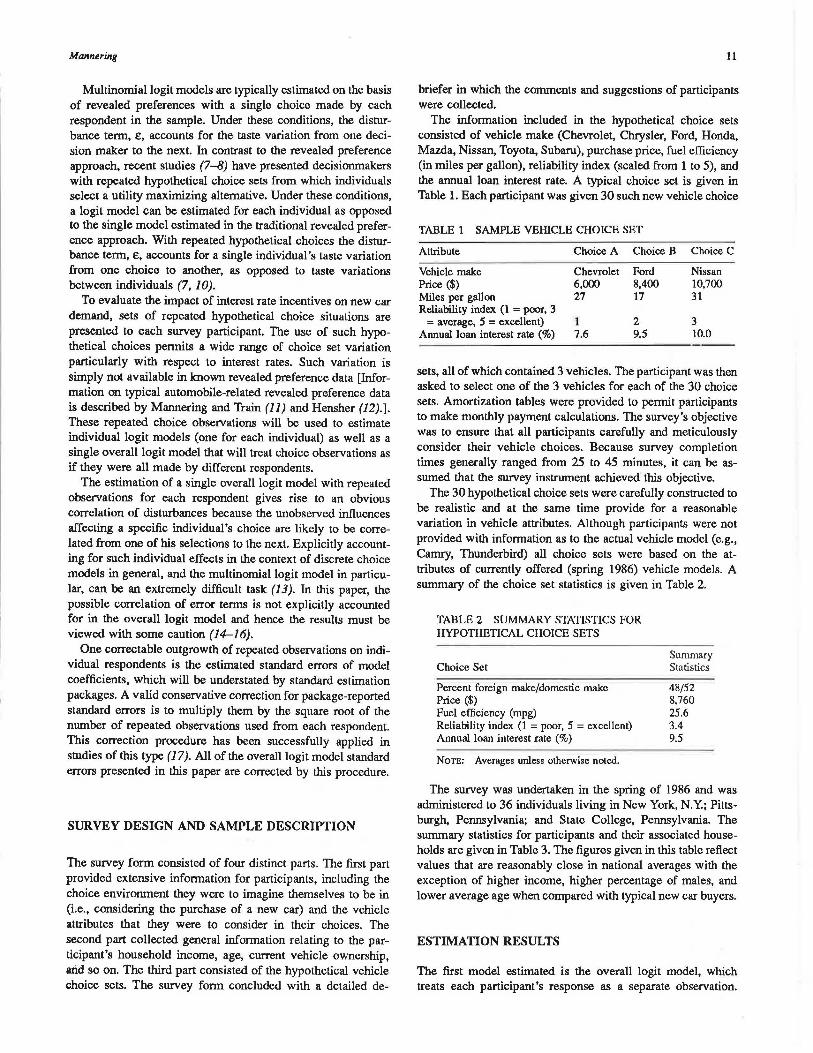
The 30 hypothetical choice sets were carefully constructed to be realistic and at the same time provide for a reasonable variation in vehicle attributes. Although participants were not provided with information as to the actual vehicle model (e.g., Camry, Thunderbird) all choice sets were based on the attributes of currently offered (spring 1986) vehicle models. A summary of the choice set statistics is given in Table 2.
TABLE 2 SUMMARY STATISTICS FOR HYPOTHETICAL CHOICE SETS
Choice Set
Percent foreign make/domestic make Price ($) Fuel efficiency (mpg) Reliability index (1 = poor, 5 = excellent) Annual loan interest rate (%)
NOTE: Averages unless otherwise noted.
Summary Statistics
48/52 8,760 25.6 3.4 9.5
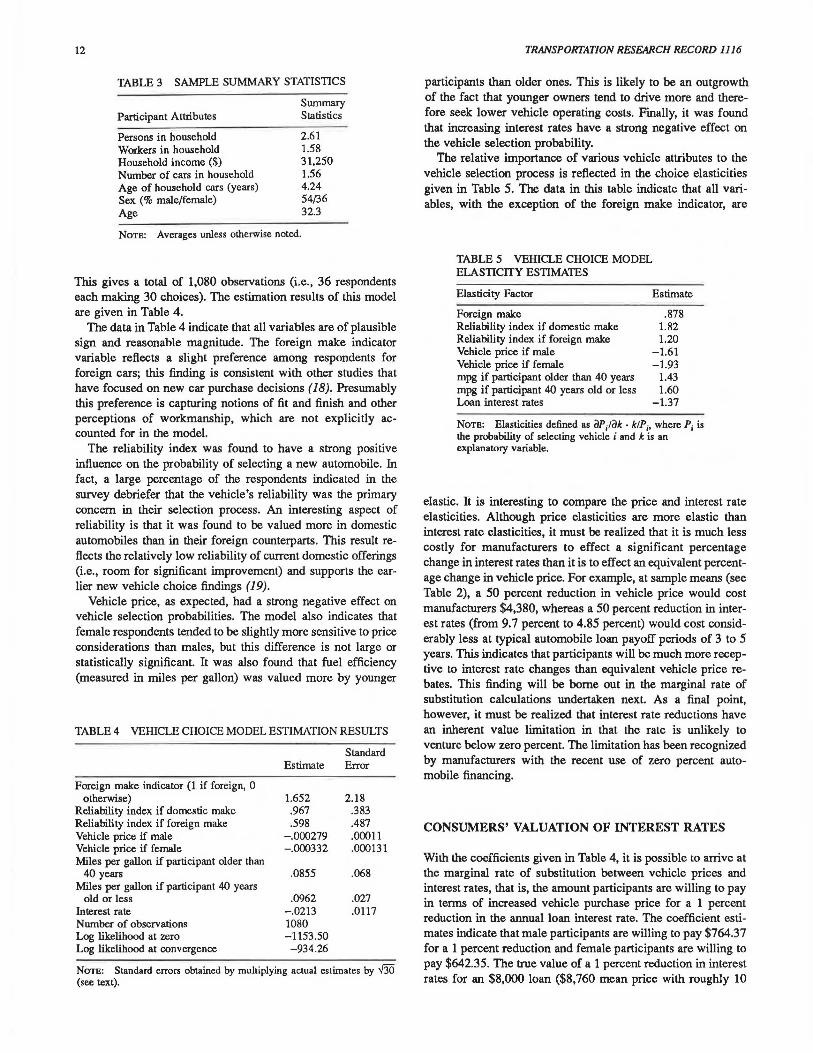
The survey was undertaken in the spring of 1986 and was administered to 36 individuals living in New York, N.Y.; Pittsburgh, Pennsylvania; and State College, Pennsylvania. The summary statistics for participants and their associated households are given in Table 3. The figures given in this table reflect values that are reasonably close in national averages with the exception of higher income, higher percentage of males, and lower average age when compared with typical new car buyers.
ESTIMATION RESULTS
The first model estimated is the overall logit model, which treats each participant's response as a separate observation.
12
TABLE 3 SAMPLE SUMMARY STATISTICS
Participant Attributes
Persons in household Workers in household Household income ($) Number of cars in household Age of household cars (years) Sex (% male/female) Age
Summary Statistics
2.61 1.58 31,250 1.56 4.24 54/36 32.3
Non!: Averages unless otherwise noted.
This gives a total of 1,080 observations (i.e., 36 respondents each making 30 choices). The estimation results of this model are given in Table 4.
The data in Table 4 indicate that all variables are of plausible sign and reasonable magnitude. The foreign make indicator variable reflects a slight preference among respondents for foreign cars; this finding is consistent with other studies that have focused on new car purchase decisions (18). Presumably this preference is capturing notions of fit and finish and other perceptions of workmanship, which are not explicitly accounted for in the model.
The reliability index was found to have a strong positive influence on the probability of selecting a new automobile. In fact, a large percentage of the respondents indicated in the survey debriefer that the vehicle's reliability was the primary concern in their selection process. An interesting aspect of reliability is that it was found to be valued more in domestic automobiles than in their foreign counterparts. This result reflects the relatively low reliability of current domestic offerings (i.e., room for significant improvement) and supports the earlier new vehicle choice findings (19).
Vehicle price, as expected, had a strong negative effect on vehicle selection probabilities. The model also indicates that female respondents tended to be slightly more sensitive to price considerations than males, but this difference is not large or statistically significant. It was also found that fuel efficiency (measured in miles per gallon) was valued more by younger
TABLE 4 VEHICLE CHOICE MODEL ESTIMATION RESULTS
Foreign make indicator (1 if foreign, 0 otherwise)
Reliability index if domestic make Reliability index if foreign make Vehicle price if male Vehicle price if female Miles per gallon if participant older than
40 years Miles per gallon if participant 40 years
old or less Interest rate Number of observations Log likelihood at zero Log likelihood at convergence
Standard Estimate Error
1.652 .967 .598
-.000279 -.000332
.0855
.0962 -.0213 1080 -1153.50 -934.26
2.18 .383 .487 .00011 .000131
.068
.027
.0117
NoTB: Standard errors obtained by multiplying actual estimates by f30 (see text).
TRANSPORTATION RESEARCH RECORD 1116
participants than older ones. This is likely to be an outgrowth of the fact that younger owners tend to drive more and therefore seek lower vehicle operating costs. Finally, it was found that increasing interest rates have a strong negative effect on the vehicle selection probability.
The relative importance of various vehicle attributes to the vehicle selection process is reflected in the choice elasticities given in Table 5. The data in this table indicate that all variables, with the exception of the foreign make indicator, are
TABLE 5 VEHICLE CHOICE MODEL ELASTICITY ESTIMATES
Elasticity Factor Estimate
Foreign make Reliability index if domestic make Reliability index if foreign make Vehicle price if male Vehicle price if female mpg if participant older than 40 years mpg if participant 40 years old or less Loan interest rates
.878 1.82 1.20
-1.61 -1.93
1.43 1.60
-1.37
NoTB: Elasticities defined as 'iJP/'iJk · k/Pi, where Pi is the probability of selecting vehicle i and k is an explanatory variable.
elastic. It is interesting to compare the price and interest rate elasticities. Although price elasticities are more elastic than interest rate elasticities, it must be realized that it is much less costly for manufacturers to effect a significant percentage change in interest rates than it is to effect an equivalent percentage change in vehicle price. For example, at sample means (see Table 2), a 50 percent reduction in vehicle price would cost manufacturers $4,380, whereas a 50 percent reduction in interest rates (from 9.7 percent to 4.85 percent) would cost considerably less at typical automobile loan payoff periods of 3 to 5 years. This indicates that participants will be much more receptive to interest rate changes than equivalent vehicle price rebates. This finding will be borne out in the marginal rate of substitution calculations undertaken next. As a final point, however, it must be realized that interest rate reductions have an inherent value limitation in that the rate is unlikely to venture below zero percent. The limitation has been recognized by manufacturers with the recent use of zero percent automobile financing.
CONSUMERS' VALUATION OF INTEREST RATES
With the coefficients given in Table 4, it is possible to arrive at the marginal rate of substitution between vehicle prices and interest rates, that is, the amount participants are willing to pay in terms of increased vehicle purchase price for a 1 percent reduction in the annual loan interest rate. The coefficient estimates indicate that male participants are willing to pay $764.37 for a 1 percent reduction and female participants are willing to pay $642.35. The true value of a 1 percent reduction in interest rates for an $8,000 loan ($8,760 mean price with roughly 10
Manne ring
TABLE 6 ACfUAL SAVINGS RESULTING FROM INTEREST RATE REDUCTIONS FOR AN $8,000 LOAN (in current dollars)
Reduction in Interest Rate(%)
Length of Loan in Years
10.5 to 9.5 9.5 to 8.5
3
135.36 133.92
4
184.32 182.4
5
236.4 232.8
percent down payment; see Table 2) around the mean interest rate of 9.5 percent is given in Table 6 for various lengths of loan. Note that the values in this table are not discounted for the time value of money. Hence the present worth of a 1 percent reduction is significantly less than these values at any reasonable discount level.
The data in the table suggest that participants are indeed overvaluing interest rates. However, the extent of this overvaluation must be assessed in light of the confidence intervals of the marginal rates of substitution. The standard errors of these estimates are $566.20 for males and $458.80 for females. These relatively wide confidence intervals make it difficult to develop definitive statements on interest rate overvaluation. Therefore, the results of individual logit models (one model for each respondent) are also considered.
Of the 36 models estimated, 12 respondents' models indicated highly significant marginal rates of substitution (t statistics exceeding 2.0). The respondent number, marginal rate of substitution, and sex is given in Table 7. The marginal rates of substitution calculated from these individual logit models range from $359.23 to $1,743.44 with an average of $798.96, which is well in excess of the true value indicated in Table 6. For the 24 participants with less significant marginal rates of substitution (t statistics less than 2.0), values ranged from $44.21 to
TABLE 7 INDIVIDUAL LOGIT MODEL RESULTS FOR PARTICIPANTS WITH HIGHLY SIGNIFICANT MARGINAL RATES OF SUBSTITUTION (I values exceeding 2.0)
Respondent No.
4 6 9
10 16 18 19 23 28 29 31 34
Marginal Rate of Substitution°
877.77 746.61 436.68
1,743.44 821.25 811.13 811.89 820.78 763.78 677.79 717.16 359.23
Sex
Male Male Female Male Male Male Male Male Female Female Male Female
Norn: Models include the following variables: make indicator (1 if foreign, 0 otherwise), price, miles per gallon, reliability index, and interest rate. 0 Price (in dollars) willing to pay in increased
purchase price for a 1 percent reduction in loan interest rate.
13
$928.17 with an average of $456.28. In terms of demographics, in comparing the 12 participants with highly significant marginal rates of substitution with the 24 participants who did not have significant rates, no particular distinction between the two groups was noticeable. It is speculated that these groups differ as a result of past vehicle ownership and loan payment experiences (information that was not collected in the survey).
The results of both the overall logit model and the individual logit models indicate that consumers in general are overvaluing interest rates and some by a very large margin. This finding goes a long way to explain the success of interest rate incentive programs and the near demise of cash rebate programs. It appears as though low interest rates are just another sales ploy available to automobile dealers.
MANUFACTURER IMPLICATIONS
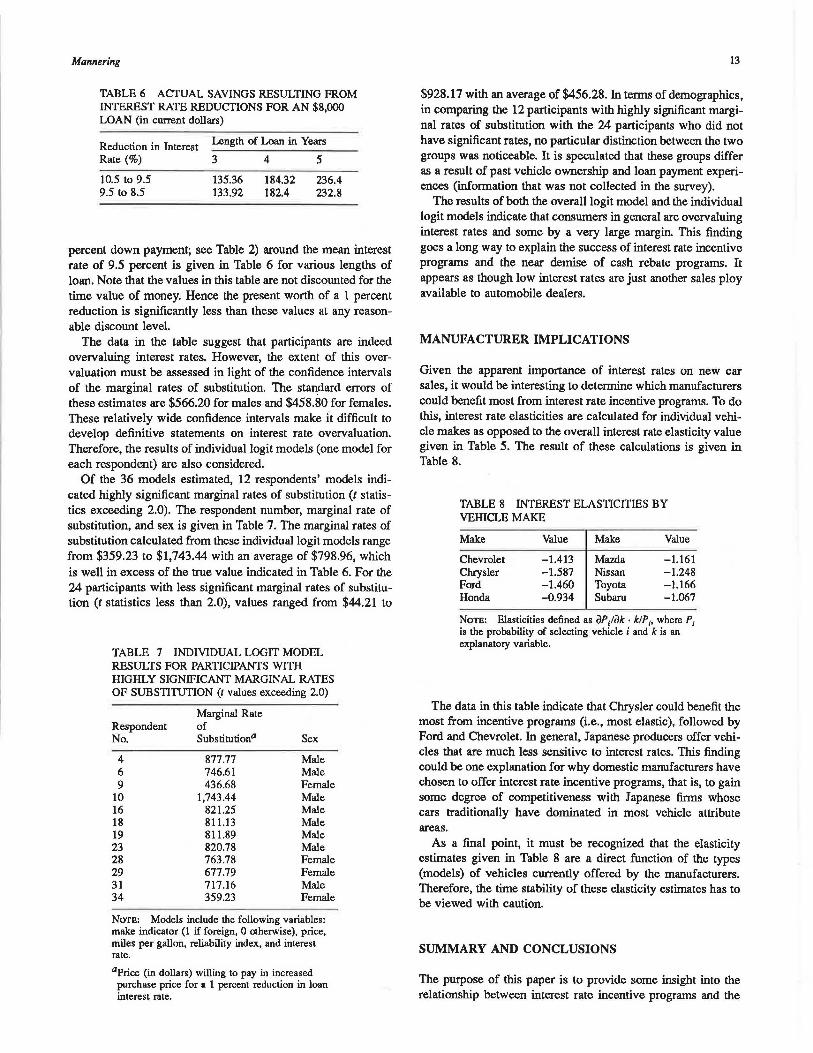
Given the apparent importance of interest rates on new car sales, it would be interesting to determine which manufacturers could benefit most from interest rate incentive programs. To do this, interest rate elasticities are calculated for individual vehicle makes as opposed to the overall interest rate elasticity value given in Table 5. The result of these calculations is given in Table 8.
TABLE 8 INTEREST ELASTICITIES BY VEHICLE MAKE
Make Value Make Value
Chevrolet -1.413 Mazda -1.161 Chrysler -1.587 Nissan -1.248 Ford -1.460 Toyota -1.166 Honda -0.934 Subaru -1.067
Norn: Elasticities defined as aP/ak · klP;, where P; is the probability of selecting vehicle i and k is an explanatory variable.
The data in this table indicate that Chrysler could benefit the most from incentive programs (i.e., most elastic), followed by Ford and Chevrolet. In general, Japanese producers offer vehicles that are much less sensitive to interest rates. This finding could be one explanation for why domestic manufacturers have chosen to offer interest rate incentive programs, that is, to gain some degree of competitiveness with Japanese firms whose cars traditionally have dominated in most vehicle attribute areas.
As a final point, it must be recognized that the elasticity estimates given in Table 8 are a direct function of the types (models) of vehicles currently offered by the manufacturers. Therefore, the time stability of these elasticity estimates has to be viewed with caution.
SUMMARY AND CONCLUSIONS
The purpose of this paper is to provide some insight into the relationship between interest rate incentive programs and the
14
demand for automobiles. Econometric choice models were developed and estimated with a sample of 36 respondents, each of whom made selections from 30 different new vehicle choice sets.
The findings from the overall logit model (i.e., treating each choice as a unique observation) and individual logit models suggest that participants overvalue interest rates relative to their actual worth. Although the extent of this overvaluation varies across the sample population (as reflected in the individual logit model estimates), it is clear that automobile manufacturers could easily exploit this overvaluation to boost new car sales. Based on the extensive interest rate incentive campaigns undertaken by the industry in recent years, it is apparent that manufacturers and dealers have long recognized consumer overvaluation of interest rates.
In terms of individual manufacturers' ability to exploit interest rate overvaluation, the findings indicate that domestic firms have a greater potential benefit than their Japanese counterparts. This disparity is an outgrowth of current automobile model offerings and their associated attributes. Barring a shift in consumer preferences, the domestic industry is in a position to benefit from interest rate incentive programs and use such programs as a legitimate weapon in their battle against Japanese imports.
As a final word of caution relating to the findings of this research, it is important to note that the issue of the change in interest rate valuation over time is not addressed. Presumably continued exposure to interest rate incentive programs will result in a more knowledgeable consumer who is less likely to overvalue interest rate deductions. This "exposure" notion may explain in part the demise of the cash rebate programs that enjoyed widespread popularity before the introduction of interest rate incentives. An important direction for future research would be to examine the time stability of interest rate valuation.
ACKNOWLEDGMENTS
The author gratefully acknowledges Carolyn Gonot and Bradley Harris, who assisted in data collection and processing.
REFERENCES
1. Aulomotive News, 1986 Market Dala Book lssue. Crain Communications, Inc., Detroit, Mich., 1986.
2. C. Manski and L. Sherman. An Empirical Analysis of Household Choice Among Motor Vehicles. Transportation Research, Vol. 14A, No. 5/6, 1980, pp. 349-366.
3. I. Hocherman, J. Prashker, and M. Ben-Akiva Estimation and Use of Dynamic Transaction Models of Automobile Ownership. In
TRANSPORTATION RESEARCH RECORD 1116
Transportation Research Record 944, 1RB, National Research Council, Washington, D.C., 1983, pp. 134-141.
4. D. Hensher and V. LePlastrier. Towards a Dynamic DiscreteChoice Model of Household Automobile Aeet Size and Composition. Transportation Research, Vol. 19B, No. 6, 1985, pp. 481-496.
5. F. Mannering and C. Winslon. A Dynamic Empirical Analysis uf Household Vehicle Ownership and Utilization. Rand Journal of Economics, Vol. 16, No. 2, 1985, pp. 215-236.
6. K. Train. Qualitative Choice Analysis: Theory, Econometrics, and an Application to Automobile Demand, M.I.T. Press, Cambridge, Mass., 1986.
7. J. Calfee. Estimating the Demand for Electric Automobiles Using Fully Disaggregated Probabilistic Choice Analysis. Transportation Research, Vol. 19B, No. 4, 1985, pp. 287-302.
8. F. Mannering and G. Chu Te. Evidence of the Impacts of Manufacturer Sourcing on Vehicle Demand. In Transportation Research Record 1085, TRB, National Research Council, Washington, D.C., 1986, pp. 1-7.
9. D. McFadden. Econometric Models of Probabilistic Choice. In Structural Analysis of Discrete Dala with Econometric Applications, (C. Manski and D. McFadden, eds.), M.l.T. Press, Cambridge, Mass., 1981.
10. A. Tversky. Intransitivity of Preferences. Psychological Review, Vol. 76, 1969, pp. 31-48.
11. F. Mannering and K. Train. Recent Directions in Automobile Demand Modeling. Transportation Research, Vol. 19B, No. 4, 1985, pp. 265-274.
12. D. Hensher. Empirical Vehicle Choice and Usage Models in the Household Sector: A Review. lnternational Journal of Transport Economics, Vol. 12, No. 3, 1985, pp. 231-259.
13. G. Chamberlain. Analysis of Covariance with Qualitative Data Review of Economic Studies, Vol. 47, Jan. 1980.
14. J. Grizzle, C. Strarmer, C. Koch. Analysis of Categorical Data by Linear Models. Biometrics, Vol. 25, 1969, pp. 489-504.
15. S. Lerman and J. Louviere. Using Functional Measurement to Identify the Form of Utility Functions in Travel Demand Models. In Transportation Research Record 673, TRB, National Research Council, Washington, D.C., 1978, pp. 78-86.
16. J. Louviere and D. Hensher. Design and Analysis of Simulated Choice or Allocation Experiments in Travel Choice Modeling. In Transportation Research Record 890, 1RB, National Research Council, Washington, D.C., 1982, pp. 11-17.
17. J. Louviere and G. Woodworth. Design and Analysis of Simulated Choice or Allocation Experiments: An Approach Based on Aggregate Data Journal of Marketing Research, Vol. 20, 1983, pp. 350-367.
18. C. Winston and F. Mannering. Consumer Demand for Automobile Safety. American Economic Review, Vol. 74, No. 2, 1984, pp. 316-319.
19. F. Mannering and H. Mahmassani. Consumer Valuation of Foreign and Domestic Vehicle Attributes: Econometric Analysis and implications for Auto Demand. Transportation Research, Vol. 19A, No. 3, 1985, pp. 243-251.
Publication of this paper sponsored by Committee on Application of Economic Analysis to Transportation Problems.