analysis of the distribution influence of the density …
TRANSCRIPT

ANALYSIS OF THE DISTRIBUTION INFLUENCE OF
THE DENSITY OF COST-FORMING FACTORS ON
RESULTS OF THE LCCA CALCULATIONS
M. ROGALSKA1, J. ŻELAZNA - PAWLICKA2
The paper evaluates the relationship between the selection of the probability density function and the
construction price, and the price of the building's life cycle, in relation to the deterministic cost estimate in terms
of the minimum, mean, and maximum. The deterministic cost estimates were made based on the minimum,
mean, and maximum prices: labor rates, indirect costs, profit, and the cost of equipment and materials. The net
construction prices received were given different probability density distributions based on the minimum, mean,
and maximum values. Twelve kinds of probability distributions were used: triangular, normal, lognormal, beta
pert, gamma, beta, exponential, Laplace, Cauchy, Gumbel, Rayleigh, and uniform. The results of calculations
with the event probability from 5 to 95% were subjected to the statistical comparative analysis. The
dependencies between the results of calculations were determined, for which different probability density
distributions of price factors were assumed. A certain price level was assigned to specific distributions in 6
groups based on the t-test. It was shown that each of the distributions analyzed is suitable for use, however, it has
consequences in the form of a final result. The lowest final price is obtained using the gamma distribution, the
highest is obtained by the beta distribution, beta pert, normal, and uniform.
Keywords: LCCA, statistical calculations, probability density function
1 PhD., Eng., Lublin University of Technology , Faculty of Civil Engineering and Architecture, Ul. Nadbystrzycka 40 20-618 Lublin , Poland, e-mail: [email protected] 2 MSc. Eng., Jan Kochanowski University in Kielce, ul. Żeromskiego 5 25-369 Kielce, Poland, e-mail: joanna.zelazna-

1. INTRODUCTION
The life cycle cost analysis (LCCA) is an analytical tool for assessing the value of alternative
investments. It covers the total cost of ownership, operation, and maintenance for a given building
during a specific life span. The papers [6, 9, 10,11, 12, 13] presents LCCA analyses that account for
risk and apply fuzzy logic. The calculation requirements are defined in the ISO 15686-5 standard
“Buildings and constructed assets – Service life planning – Part 5: Life-cycle costing” [7]. The
standard recommends the LCCA calculations for several alternatives to the same construction
activity. The analysis should be carried out in accordance with the 5.2 point of the ISO 15686-5 for
the period in which the building will maintain the function planned, in accordance with the
investor's requirements. If the planned operation time of the facility is longer than 100 years, the
calculation should be carried out for a period of 100 years. The shorter the period for which
calculations are made, the less accurate and representative the result are, e.g., the future repairs or
the recycling of building materials at the end of the building's life cycle are omitted. These costs can
be a very heavy financial burden. According to the authors, the LCCA calculations for the period of
durability of building’s structural elements seem to be advisable. The 8.3 section of the ISO 15686-
5 obliges to perform calculations taking into account statistical methods such as the Monte Carlo
analysis. The results of the calculations should be given with a probability of 10%, 50%, and 90%.
The statistical calculations are possible to perform when the probability density distributions of cost
estimates prices are established. The probability density functions of prices in scientific papers are
adopted in various ways. The discount rate has a normal distribution in all studies, while the
distributions of other costs are different. The prices for the implementation and maintenance of
pedestrian routes in [3] were determined by the triangular distribution, the prices of components,
energy, and maintenance in [4] were determined by the normal and Uni distribution. In the LCCA
[1], loglogistic, lognormal, and Weibull distributions were adopted – distributions were selected
using the χ2 test according to [2]. In [5, 8], the lognormal distributions were adopted to select the
correct distribution using a one-way regression analysis. In [14], to calculate the LCCA of a
highway, the beta distribution of the probability density of price-forming factors was used. In the
paper, 12 probability density distributions were adopted for calculations: triangular, normal,
lognormal, beta pert, gamma, beta, exponential, Laplace, Cauchy, Gumbel, Rayleigh, and uniform.
With regard to cost estimates for investment construction activities, it was assumed to create 3 cost
estimates based on minimum, mean, and maximum values of price-forming factors. For 3 values it
102 M. ROGALSKA, J. �ELAZNA-PAWLICKA

is not possible to analyze the correctness of probability density distributions with the χ2 test. The
probabilistic approach provides more realistic information on the uncertainty of results and enables
a more useful analysis of the potential benefits of design options. The probabilistic method
described in this paper is based on the analysis of uncertainty and sensitivity using the Monte Carlo
(MC) method. The aim of the paper is to determine what consequences cause the assumed to the
calculations, the probability density distribution of the cost of building construction. The performed
analysis of the results obtained may facilitate the selection of the probability density distribution in
specific conditions by people, who conduct the LCCA analyzes.
2. CALCULATION METHOD
The proposed method of calculation consists of the following stages:
Stage 1 – preparation of three cost estimates (minimum, mean, and maximum) of the same
construction project; as a result of the calculations, the minimum, mean, and maximum prices were
obtained.
Stage 2 – selection of types of the probability density distributions for three cost estimates; all
available distributions in the Risky Project Professional software were selected for calculation:
triangular, normal, lognormal, beta pert, gamma, beta, exponential, Laplace, Cauchy, Gumbel,
Rayleigh, and uniform.
Stage 3 – calculating the prices of construction works for various probability values of completing
the activities in the price given by the probability distributions; probabilities 5, 10, 15, 20, 25, 30,
35, 40, 45, 50, 55, 60, 65, 70, 75, 80, 85, 90, 95% were used for calculations.
Stage 4 – graphical evaluation of the results obtained using the STATISTICA software, statistical
calculations of the correlation coefficients and values of the t-test differences coefficients.
Stage 5 – analysis of the calculation results.
3. CALCULATION OF VALUE OF CONSTRUCTION COST
The calculations were carried out in a deterministic and probabilistic approach.
ANALYSIS OF THE DISTRIBUTION INFLUENCE OF THE DENSITY OF COST-FORMING... 103

3.1. DETERMINISTIC CALCULATIONS
The cost estimate was based on the superstructure project of a multi-family building. The
construction project was divided into 30 processes. The Norma Pro software was used for the cost
estimation. The differentiation of cost estimates consisted of the subsequent adoption of minimum,
mean, and maximum cost estimate and material, equipment, and labor prices. Indirect costs were
equal to 40, 66, and 80%, materials purchase costs were equal to 1, 6, and 13%, profit – 5, 11, and
20%, respectively. The results of net calculations are presented in Table 1.
Table 1. List of construction costs divided into processes; minimum, mean, and maximum values.
No Costing items Minimum price [$]
Meanprice [$]
Maximum price [$]
1 Demolition of cover 16 484.95 23 268.88 31 794.022 Removal of the structure 63 233.77 92 342.89 131 142.303 Demolition of masonry structures 68 069.07 96 039.84 131 283.394 Exports and disposal of rubble 93 482.72 101 688.60 164 064.055 Masonry work 45 382.11 95 837.50 124 246.776 Assembly of steel structures 467 846.87 567 578.99 681 453.897 Demolition of ceilings 110 399.43 154 333.77 210 177.288 Densely ribbed ceilings 24 cm thick 329 157.93 381 181.80 546 230.629 Densely ribbed ceilings 29 cm thick 16 927.26 19 602.63 28 090.4210 Thick ribbed ceilings 26 cm thick 11 272.22 13 053.81 18 706.0011 Preparation of reinforcement 7 975.24 10 273.82 11 972.4712 Replenishment of walls and bricklaying of chimneys 24 731.31 52 227.34 67 709.1713 Lightweight roof cladding 50 733.28 75 123.44 112 981.7214 Roof slope formwork 37 945.08 47 680.89 60 903.0815 Ventilation mat 10 907.58 17 808.00 23 073.7316 Roof covering with galvanized sheet metal for rabbet 94 320.21 120 605.46 153 979.19
17 Roof deflectors 5 782.01 7 993.60 10 933.8018 Roof gutters 9 993.84 13 547.15 19 232.8919 Drain pipes 5 729.14 7 951.78 10 870.5120 Roof accessories - snow fencing 39 857.76 48 320.07 71 465.93
21 Thermal insulation and plasterboard linings 193 356.43 256 024.40 368 080.2822 Underfloor thermal insulation 429 266.00 461 022.26 872 148.9723 Underfloor moisture insulation 59 536.25 78 306.10 112 776.5324 Cement screeds 170 620.73 228 189.49 309 879.6825 Sealing slurry insulation 2 567.49 14 991.55 16 395.4826 Gres tiles cladding 145 436.72 226 150.17 366 780.5927 Wall sockets 66 732.48 89 428.57 123 025.2928 Ceiling linings with plasterboards 60 731.50 82 655.90 111 287.1229 Painting 6 102.69 8 769.24 12 899.1230 Acoustic ceilings 56 029.13 69 935.34 123 867.1731 SUM 2 700 611.20 3 461 933.28 5 027 451.46
104 M. ROGALSKA, J. �ELAZNA-PAWLICKA

As a result of the calculations carried out, the deterministic net price of the superstructure was obtained: a
minimum equal to 2 700 611.20 USD, a mean – 3 461 933.28 USD, and a maximum – 5 027 451.46 USD.
3.2. PROBABILISTIC CALCULATIONS
The data obtained (minimum, mean, and maximum prices) from the deterministic calculations were used for
the probabilistic calculations in the Risky Project Professional software. The different distributions of
probability density were given to the same data. The following distributions were used: triangular, normal,
lognormal, beta pert, gamma, beta, exponential, Laplace, Cauchy, Gumbel, Rayleigh, and uniform. Table 2
presents the results of calculations: histograms and cumulative distributions for each of the distributions
analyzed. The construction costs were then calculated for different probability density distributions with
respect to the percent probability of the construction completion. For the calculations, probabilities from 5 to
95% with gradation at 5% were assumed. The calculation results are summarized in Table 3.
Table 2. Histograms and cumulative distributions for the same output data using different probability density
functions.
Triangular distribution Normal distribution Lognormal distribution BetaPert distribution
Gamma distribution Beta distribution Exponential distribution Laplace distribution
Cauchy distribution Gumbel distribution Rayleigh distribution Uniform distribution
ANALYSIS OF THE DISTRIBUTION INFLUENCE OF THE DENSITY OF COST-FORMING... 105
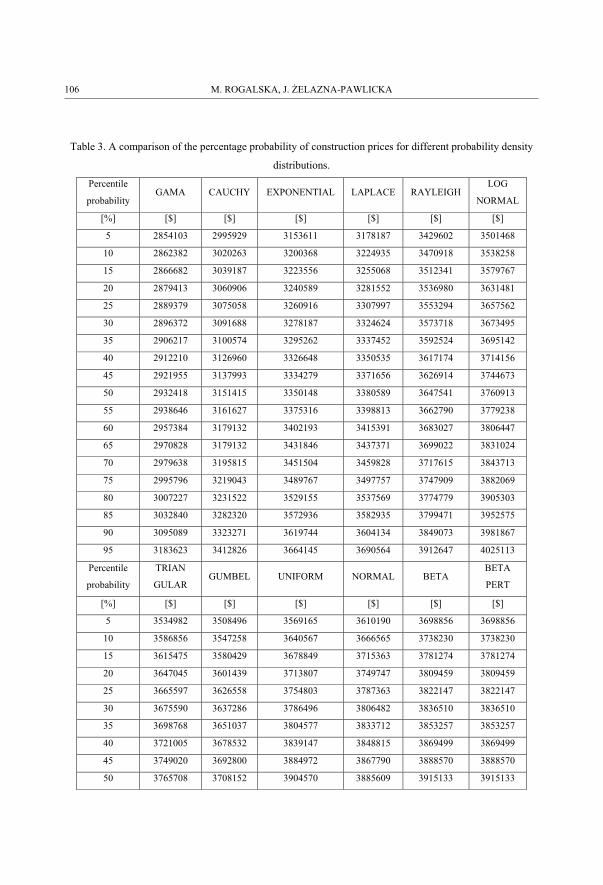
Table 3. A comparison of the percentage probability of construction prices for different probability density
distributions.
Percentile
probabilityGAMA CAUCHY EXPONENTIAL LAPLACE RAYLEIGH
LOG
NORMAL
[%] [$] [$] [$] [$] [$] [$]
5 2854103 2995929 3153611 3178187 3429602 3501468
10 2862382 3020263 3200368 3224935 3470918 3538258
15 2866682 3039187 3223556 3255068 3512341 3579767
20 2879413 3060906 3240589 3281552 3536980 3631481
25 2889379 3075058 3260916 3307997 3553294 3657562
30 2896372 3091688 3278187 3324624 3573718 3673495
35 2906217 3100574 3295262 3337452 3592524 3695142
40 2912210 3126960 3326648 3350535 3617174 3714156
45 2921955 3137993 3334279 3371656 3626914 3744673
50 2932418 3151415 3350148 3380589 3647541 3760913
55 2938646 3161627 3375316 3398813 3662790 3779238
60 2957384 3179132 3402193 3415391 3683027 3806447
65 2970828 3179132 3431846 3437371 3699022 3831024
70 2979638 3195815 3451504 3459828 3717615 3843713
75 2995796 3219043 3489767 3497757 3747909 3882069
80 3007227 3231522 3529155 3537569 3774779 3905303
85 3032840 3282320 3572936 3582935 3799471 3952575
90 3095089 3323271 3619744 3604134 3849073 3981867
95 3183623 3412826 3664145 3690564 3912647 4025113
Percentile
probability
TRIAN
GULARGUMBEL UNIFORM NORMAL BETA
BETA
PERT
[%] [$] [$] [$] [$] [$] [$]
5 3534982 3508496 3569165 3610190 3698856 3698856
10 3586856 3547258 3640567 3666565 3738230 3738230
15 3615475 3580429 3678849 3715363 3781274 3781274
20 3647045 3601439 3713807 3749747 3809459 3809459
25 3665597 3626558 3754803 3787363 3822147 3822147
30 3675590 3637286 3786496 3806482 3836510 3836510
35 3698768 3651037 3804577 3833712 3853257 3853257
40 3721005 3678532 3839147 3848815 3869499 3869499
45 3749020 3692800 3884972 3867790 3888570 3888570
50 3765708 3708152 3904570 3885609 3915133 3915133
106 M. ROGALSKA, J. �ELAZNA-PAWLICKA

55 3781792 3727865 3928117 3906938 3928407 3928407
60 3800116 3748543 3946034 3926531 3944705 3944705
65 3819844 3770867 3973992 3947990 3958621 3958621
70 3833286 3786552 3995871 3975788 3976382 3976382
75 3853020 3805833 4028809 4004764 4002059 4002059
80 3884134 3835825 4066877 4031533 4016619 4016619
85 3938508 3880868 4106559 4078172 4044698 4044698
90 3986283 3938317 4173023 4098998 4085114 4085114
95 4026906 4002965 4228044 4117310 4123311 4123311
4. ANALYSIS OF THE CALCULATION RESULTS
The results of the probabilistic calculations, summarized in Table 3, and the minimum, mean, and
maximum prices from the deterministic cost estimates are presented in graphical form in Figure 1.
Fig. 1. Graphical presentation of probabilistic and deterministic calculations.
By analyzing the graph in Figure 1, it can be seen that all lines of the probabilistic values
(probability density distributions) are strongly linearly correlated with each other. The calculated
Poisson correlation coefficients reach values from 0.94 to 1.00. Tab. 4.
ANALYSIS OF THE DISTRIBUTION INFLUENCE OF THE DENSITY OF COST-FORMING... 107

Table 4. A summary of the calculations results of the Poisson correlation coefficients for all probability
density functions analyzed.
Correlations
Norm
al
Beta
Betapert
Gam
a
Cauchy
Exponential
Laplace
Rayleigh
Triangular
Lognormal
Gum
bel
Uniform
Gama 0.92 0.94 0.94 1.00 0.99 0.97 0.97 0.96 0.96 0.94 0.97 0.94
Cauchy 0.97 0.98 0.98 0.99 1.00 0.99 0.99 0.99 0.99 0.98 1.00 0.98
Exponential 0.98 0.99 0.99 0.97 0.99 1.00 1.00 0.99 0.99 0.99 1.00 0.99
Laplace 0.98 0.99 0.99 0.97 0.99 1.00 1.00 1.00 0.99 0.99 1.00 0.99
Rayleigh 0.99 1.00 1.00 0.96 0.99 0.99 1.00 1.00 1.00 1.00 1.00 1.00
Triangular 0.99 1.00 1.00 0.96 0.99 0.99 0.99 1.00 1.00 1.00 1.00 1.00
Lognormal 1.00 1.00 1.00 0.94 0.98 0.99 0.99 1.00 1.00 1.00 0.99 1.00
Gumbel 0.98 0.99 0.99 0.97 1.00 1.00 1.00 1.00 1.00 0.99 1.00 0.99
Uniform 1.00 1.00 1.00 0.94 0.98 0.99 0.99 1.00 1.00 1.00 0.99 1.00
Beta 1.00 1.00 1.00 0.94 0.98 0.99 0.99 1.00 1.00 1.00 0.99 1.00
Betapert 1.00 1.00 1.00 0.94 0.98 0.99 0.99 1.00 1.00 1.00 0.99 1.00
This means that none of the probability density functions is an invalid function. The decision to
accept a specific function will result in a selection of the solution with a specific price range: extra
low, very low, low, medium, high, and very high. Giving probabilistic values causes relaxation of
the deterministic extreme values. In order to determine the statistical significance of differences
between groups, the t-test was made assuming a 5% chance of making a mistake at evaluation (p =
0.05) and the number of freedom equal to 9. The number of degrees of freedom is the number of
independent observation results minus the number of relations that combine these results with each
other. In the case analyzed, the number of relations combining the results is 3 and they are the
minimum, mean, and maximum prices from the deterministic cost estimates. The number of
independent results equals 12 – the number of the probability density functions. The critical value
of the t-test for the probability of 0.05 and 9 degrees of freedom is equal to 0.7027. If the absolute
value of the t-test will have a value above 0.7027, it will mean that the hypothesis of equality of
variables can not be accepted – the variables will be different. Table 5 presents the results of the
significance test of the t-test.
108 M. ROGALSKA, J. �ELAZNA-PAWLICKA

Table 5. The values of the t coefficient of the t-test for the probability density functions.
Correlations
Gam
a
Cauchy
Exponential
Laplace
Rayleigh
Triangular
Lognormal
Gum
bel
Uniform
Norm
al
Beta
Betapert
Gama 0.00 -6.58 -11.04 -12.29 -19.88 -22.41 -20.71 -21.44 -20.54 -24.31 -24.31 -29.11Cauchy 6.58 0.00 -5.36 -6.20 -12.96 -15.54 -14.47 -14.54 -15.30 -17.71 -17.71 -20.86Exponential 11.04 5.36 0.00 -0.50 -6.15 -8.55 -8.05 -7.62 -9.67 -10.78 -10.78 -12.43Laplace 12.29 6.20 0.50 0.00 -5.87 -8.36 -7.84 -7.40 -9.51 -10.67 -10.67 -12.43Rayleigh 19.88 12.96 6.15 5.87 0.00 -2.69 -2.45 -1.65 -4.76 -5.28 -5.28 -6.48Triangular 22.41 15.54 8.55 8.36 2.69 0.00 0.09 1.04 -2.48 -2.64 -2.64 -3.51Lognormal 20.71 14.47 8.05 7.84 2.45 -0.09 0.00 0.90 -2.46 -2.61 -2.61 -3.40Gumbel 21.44 14.54 7.62 7.40 1.65 -1.04 -0.90 0.00 -3.37 -3.67 -3.67 -4.66Uniform 20.54 15.30 9.67 9.51 4.76 2.48 2.46 3.37 0.00 0.16 0.16 -0.29Normal 24.31 17.71 10.78 10.67 5.28 2.64 2.61 3.67 -0.16 0.00 0.00 -0.54Beta 29.11 20.86 12.43 12.43 6.48 3.51 3.40 4.66 0.29 0.54 0.54 0.00Betapert 29.11 20.86 12.43 12.43 6.48 3.51 3.40 4.66 0.29 0.54 0.54 0.00
The calculations show that the probability density functions analyzed form 6 groups. No statistically
significant differences in the following groups can be specified:
Group 1 – extramely low price – the gamma function,
Group 2 – low price – the Cauchy function,
Group 3 – medium price – the exponential and Laplace functions,
Group 4 – medium high price – the Rayleigh function,
Group 5 – high price – the triangular, lognormal, and Gumbel functions,
Group 6 – very high price – uniform, normal, beta, and beta pert functions.
The sequential chart of the raw data in Figure 2 illustrates the separation of 6 groups of the
probability density functions (based on the t-test).
ANALYSIS OF THE DISTRIBUTION INFLUENCE OF THE DENSITY OF COST-FORMING... 109
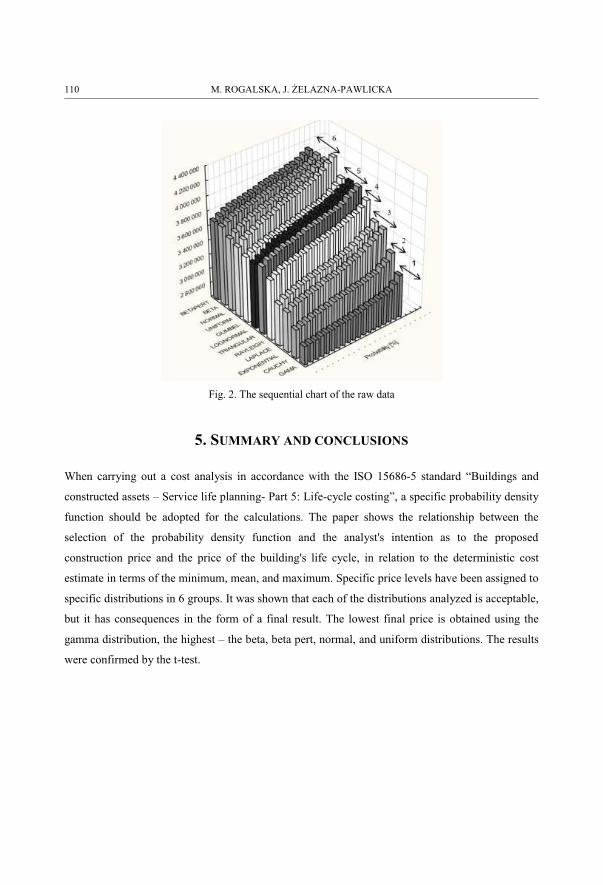
Fig. 2. The sequential chart of the raw data
5. SUMMARY AND CONCLUSIONS
When carrying out a cost analysis in accordance with the ISO 15686-5 standard “Buildings and
constructed assets – Service life planning- Part 5: Life-cycle costing”, a specific probability density
function should be adopted for the calculations. The paper shows the relationship between the
selection of the probability density function and the analyst's intention as to the proposed
construction price and the price of the building's life cycle, in relation to the deterministic cost
estimate in terms of the minimum, mean, and maximum. Specific price levels have been assigned to
specific distributions in 6 groups. It was shown that each of the distributions analyzed is acceptable,
but it has consequences in the form of a final result. The lowest final price is obtained using the
gamma distribution, the highest – the beta, beta pert, normal, and uniform distributions. The results
were confirmed by the t-test.
110 M. ROGALSKA, J. �ELAZNA-PAWLICKA

REFERENCES
1. A. Abdelaty, D.J. Hyungseok, B. Dannen, F. Todey, “ Enhancing life cycle cost analysis with a novel cost classification framework for pavement rehabilitation projects”. Construction Management & Economics. 2016, Vol. 34 Issue 10, p724-736.
2. D. S. Moore, “Tests of Chi-Squared Type Goodness of Fit Techniques,” 1986.3. D. Wu, H. Liu, C. Yuan, “A risk-based optimisation for pavement preventative maintenance with probabilistic
LCCA: a Chinese case”. International Journal of Pavement Engineering, 2 January 2017, 18(1):11-254. E. Di Giuseppe, A. Massi, M. D’Orazio, “Probabilistic Life Cycle Cost analysis of building energy efficiency
measures: selection and characterization of the stochastic inputs through a case study”. International High-Performance Built Environment Conference - A Sustainable Built Environment Conference 2016 Series (SBE16), iHBE 2016, Procedia Engineering. 2017 180:491-501
5. E. Fregonara, D. G. Ferrando, “ How to Model Uncertain Service Life and Durability of Components in Life Cycle Cost Analysis Applications? The Stochastic Approach to the Factor Method”. Sustainability 2018, 10(10), 3642
6. Ilg.P.,Scope,C.,Muench, s.and Guenther, E.2017. Uncertainty in life cycle costing for long-range infrastructure. Part I: leveling the playing field to address uncertainties. International Journal of life cycle Assessment. 22, 2, 277-292.
7. ISO 15686-5 Buildings and constructed assets- Service life planning- Part 5: Life-cycle costing 8. O.Swei, J. Gregory, R. Kirchain, “Probabilistic Characterization of Uncertain Inputs in the Life-Cycle Cost
Analysis of Pavements Transportation Research Record”. Journal of the Transportation Research Board, No. 2366, Transportation Research Board of the National Academies, Washington, D.C., 2013, pp. 71–77.
9. Oduyemi, O., Okorch, M. and Fajana, O.S. 2016. Risk assestment mathods for life cycle costing in buildings., Sustainable buildings. 1.
10. Plebankiewicz, E., Zima, K. and Wieczorek, D. 2016. Life cycle cost modelling of buildings with consideration of the risk. Archives of Civil Engineering. 62, 2, 149-166.
11. Plebankiewicz, E., Zima, K. and Wieczorek, D. 2016. Quantification of the risk addition in life cycle cost of a building object. Czasopismo Techniczne. 5, 35-45.
12. Scope,C., Ilg.P., Muench, s.and Guenther, E.2016. Uncertainty in life cycle costing for long-range infrastructure. Part II: guidance and suitability of applied methods to address uncertainty. International Journal of life cycle Assessment. 21, 8, 1170-1184.
13. Wieczorek, D., Plebankiewicz, E. and Zima, K. 2019. Model Estimation of the Whole Life Cost of a Building with respect to Risk Factors. Technological and Economic Development of Economy. 25, 1, 20-38.
14. Z. Li, S. Madanu,” Highway Project Level Life-Cycle Benefit/Cost Analysis under Certainty, Risk, and Uncertainty: Methodology with Case Study”. Journal of the Transportation Engineering © ASCE / August 2009,
LIST OF FIGURES AND TABLES:
Fig. 1. Graphical presentation of probabilistic and deterministic calculations.
Fig. 2. The sequence chart of the raw data
Rys. 1. Graficzne odwzorowanie obliczeń probabilistycznych i deterministycznych
Rys. 2. Wykres sekwencyjny danych surowych
Tab. 1. List of construction costs divided into processes; minimum, average, and maximum values
Tab. 2. Histograms and cumulative distributions for the same output data using different probability density
functions
Tab. 3. A comparison of the percentage probability of construction prices for different probability density
distributions
Tab. 4. A summary of the calculations results of the Poisson correlation coefficients for all probability
density functions analyzed
ANALYSIS OF THE DISTRIBUTION INFLUENCE OF THE DENSITY OF COST-FORMING... 111

Tab. 5. The values of the t coefficient of the t-test for the probability density functions.
Tab. 1. Zestawienie kosztów budowy z podziałem na procesy; wartości minimalne, średnie i maksymalne
Tab. 2. Histogramy i dystrybuanty funkcji gęstości prawdopodobieństwa.
Tab. 3. Zestawienie procentowego prawdopodobieństwa cen budowy dla różnych rozkładów gęstości
prawdopodobieństwa
Tab. 4. Zestawienie wyników obliczeń wartości współczynników korelacji Poissona
Tab. 5.Wartości współczynnika t testu t- Studenta dla funkcji gęstości prawdopodobieństwa
ANALIZA WPŁYWU ROZKŁADÓW GĘSTOŚCI PRAWDOPODOBIEŃSTWA CZYNNIKÓW
CENOTWÓRCZYCH NA WYNIKI OBLICZEŃ LCCA
Słowa kluczowe: LCCA, obliczenia statystyczne, funkcja gęstości prawdopodobieństwa
STRESZCZENIE
W artykule wykazano związek pomiędzy wyborem funkcji gęstości prawdopodobieństwa a ceną budowy i ceną
cyklu życia budynku, w odniesieniu do posiadanego deterministycznego kosztorysu w ujęciu minimalnym,
średnim i maksymalnym. Wykonano kosztorysy deterministyczne realizacji inwestycji bazując na cenach
minimalnych, średnich i maksymalnych : stawki robocizny, kosztów pośrednich, zysku oraz ceny pracy sprzętu i
materiałów. Otrzymanym cenom netto budowy nadawano różne rozkłady gęstości prawdopodobieństwa bazując
na wartości minimalnej, średniej i maksymalnej. Wykorzystano 12 rodzajów rozkładów prawdopodobieństwa:
trójkątny, normalny, lognormalny, beta pert, gamma, beta, exponential, Laplaca, Cauchy, Gumbel, Rayleigh,
uniform. Wyniki obliczeń przy prawdopodobieństwach zdarzenia od 5 do 95 % poddano statystycznej analizie
porównawczej. Określono zależności pomiędzy wynikami obliczeń dla których przyjęto rożne rozkłady gęstości
prawdopodobieństwa czynników cenotwórczych. Przypisano określonym rozkładom poziom wysokości cen w 6
grupach na podstawie przeprowadzonego testu t-Studenta. Wykazano, że każdy z analizowanych rozkładów
nadaje się do stosowania, powoduje to jednak konsekwencje w postaci wyniku końcowego. Najniższą cenę
końcową uzyskamy stosując rozkład Gama, najwyższą rozkład Beta, Betapert, Normalny i Uniform.
Received 15.04.2019
Revised 26.08.2019
112 M. ROGALSKA, J. �ELAZNA-PAWLICKA