analysis of spatial distributions of pink shrimp ... · arcview geographic information ......
TRANSCRIPT

GIS/Spatial Analyses in Fishery and Aquatic Sciences (Vol.6)
Houssa et al- Analysis of spatial distributions of pink shrimp in relation to environmental conditions on the Atlantic coast of northern Morocco (003-022)
ⒸInternational Fishery GIS Society, 2016
3
Analysis of spatial distributions of
pink shrimp (Parapenaeus
longirostris, Lucas 1846) in
relation to environmental
conditions on the Atlantic coast
of northern Morocco
Rachida Houssa Institut National de Recherche Halieutique (INRH) Casablanca, Morocco Phone: 212 6 23 69 52 43 E-mail: [email protected]; [email protected]
Aissa Benazouz
INRH, Casablanca
Amina Oulmalem Université Hassan II, Mohammedia, Morocco
Abdelaziz Zoubai INRH, Casablanca
Said Benchoucha INRH, Casablanca
Abstract
The aim of this study was to determine spatial and seasonal distributions of pink shrimp in relation to its annual life cycle on the northern coast of Morocco between 35°N and 33°N, using the extension "Spatial animal movement" developed by Philip N. Hooge, integrated into the ESRI ArcView geographic information system. We used a dataset of 12 scientific trawl-surveys covering every season from 1998 to 2005, and multi-satellite measurements to analyze the correlation with derived sea-surface height, sea-surface temperature and Chlorophyll concentration. The results show

GIS/Spatial Analyses in Fishery and Aquatic Sciences (Vol.6)
4
that spatial distributions of pink shrimp were constant between 1998 and 2005. This stability can be explained by the oceanographic characteristics of the area, which are generally stable. When the season changes from spring to winter, the species moves towards shallower water. This migration from offshore to inshore waters can be explained by the shrimp’s feeding behaviour and/or its reproductive cycle.
Keywords GIS, pink shrimp, spatial animal movement, Chlorophyll-A.
1. Introduction The identification of habitats occupied by benthic invertebrate species and the understanding of the dynamics of their life cycles are of increasing interest for ecologists and fisheries managers. Several recent methods used for these studies include ultrasonic telemetry or tagging and recapture techniques (Gonzalez-Gurriaran and Freire, 1994; Wolcott and Hines, 1997; Comeau and Savoie, 2001; Hoyt et al., 2002). Unfortunately, these techniques are not readily accessible in Morocco. The use of the spatial indicators integrated within geographic information systems (GISs) constitutes an interesting alternative to study the species movement, besides being a simple and fast tool; it is also characterized by the ability to study the spatio–temporal dynamics of species to help identify the selective use of their habitats (Barber, 2004).
In Morocco, the importance of available fish stocks and the role that they will play in the coming decades—both for human nutrition and jobs—advocates for a marine fisheries policy with primary objectives that emphasize conservation of marine biological resources and their recovery and sustainable use. Despite these considerations, the marine-fisheries sector encounters a number of challenges, primarily related to the fragility of the resource, the variability of hydro-climatic conditions and excessive fishing effort.
The shrimp fishery, dominated by pink shrimp (Parapenaeus longirostris), is fully exploited. It has been in an overfished state since 1999. The situation is aggravated by the use of fishing practices that can further damage shrimp populations and their benthic habitats. The proposed development plan should provide a rational and prudent use of the fishery such that the modes of operation take into consideration the behaviour of the species in its environment.

Houssa et al - Analysis of spatial distributions of pink shrimp in relation to environmental conditions on
the Atlantic coast of northern Morocco (003-022)
5
The pink shrimp is a demersal species, living on muddy or sandy grounds. Its bathymetric distribution is between 20 m and 700 m, with strong concentrations between 100 m and 400 m (Heldt, 1938, 1954; Holthuis, 1980; Froglia, 1982; Ardizzone et al., 1990; Chaouachi and Ben Hassein, 1998; Benchoucha, 2005).
Like other species in the family Penaeidae, the pink shrimp has a protracted spawning period that spans almost the entire year. There are two distinct spawning peaks, the most important during winter (February–March) and the second in autumn (October–November) (Benchoucha, 2005a).
The area where the species is distributed is characterized by coastal upwelling; by a wide continental shelf; and by proximity to major outflows of the Sebou and Bou-regrag rivers and land-based runoff. All three characteristics are associated with processes for nutrient enrichment (Caddy and Bakun, 1994).
2. Objectives The aim of this work was to characterize the spatial and seasonal distributions of pink shrimp in relation to its annual life cycle, using animal-movement-analysis tools to process data from scientific trawl surveys. This animal-movement software incorporates a large collection of statistical tools developed by Hooge et al. (2001) to integrate with one of the most commonly used GIS programs (ArcView of ESRI).
The study zone is located on the Atlantic coast of northern Morocco, ranging between Larache harbour (35° N) and El Jadida harbour (33° N) (Map 1). In this area, the coastline is nearly linear and orientated SW–NE. The continental shelf undergoes a very important deformation between 34°30′ N and 34° N. The 200 m isobath, which is located 23 miles off latitude 35° N, is only 15 miles from the coast in the region of 34° N; further south it forms an accentuated concavity (Collignon, 1965).
The grounds shallower than 50 m are generally sandy, with rocks
becoming important southwards. Between 50 m and 200 m the grounds are composed of sand and mud, with rocks present particularly between 33° N and 34° N. Usually the hard-bottom zone ranges between 130 m and 170 m; beyond 220 m the grounds are uniformly muddy (Collignon, 1965).

GIS/Spatial Analyses in Fishery and Aquatic Sciences (Vol.6)
6
Map 1. Location of the study area and type of fishing ground.
3. Material and methods
3.1 Database In this study, we used a data set obtained from 12 trawl surveys, covering every season during the period 1998–2005 (Table 1). The database was created from data collected during surveys carried out by R.V. Charif Al Idrissi of the National Institute of Fisheries Research (INRH) using a stratified random-sampling design within a 1-square-nautical-mile grid. The spatial coverage satisfies the acceptable limits imposed for geostatistical analyses, namely a minimum of 30 points per sample (Legendre, 1993). On the other hand, the temporal coverage is not evenly distributed for every season. There were several surveys performed in autumn and spring but only one or two surveys in winter and summer because of unavailability of the research vessel. This unbalanced sampling in time constitutes a limiting factor.

Houssa et al - Analysis of spatial distributions of pink shrimp in relation to environmental conditions on
the Atlantic coast of northern Morocco (003-022)
7
Table 1. Description of the trawling-surveys database.
In order to assess the movement of pink shrimp, we used multi-satellite measurements to analyze different local relationships between Chlorophyll concentration (CHL-a), derived sea-surface height (SSH) and sea-surface temperature (SST).
Practically, we used remote-sensing data coming from moderate-resolution-imaging spectro-radiometer (MODIS) satellite sensor and from several altimeter missions including Jason-1 and 2, Topex/Poseidon, Envisat, Geosat Follow-On (GFO) and European Remote Sensing satellite (ERS) 1 and 2. These data were merged and processed to provide 7-day snapshots of the sea-level anomalies and their derived products. All data was provided through the AVISO live-access server, available at http://las.aviso.oceanobs.com.
3.2 Studied variables Four variables aimed at the characterization of the distribution and life cycle of the shrimp population were used in this study. These were: the presence or absence of the species in the trawling area; the catch per unit of effort (CPUE) in kg per hour or the number of individuals per hour; the size class; and the stage of maturity. In the present case, we identified
Survey Code Survey starting day Survey end day SeasonMedian day
within the year *
C9807 7/7/1998 27/7/1998 Summer 198
C9812 13/12/1998 20/12/1998 Autumn 351
C9903 9/3/1999 17/3/1999 Winter 72
C9911 04/11/1999 17/11/1999 Autumn 315
C0011 09/11/2000 20/11/2000 Autumn 320
C0104 26/04/2001 12/05/2001 Spring 126
C0111 15/11/2001 23/11/2001 Autumn 323
C0205 16/05/2002 21/05/2002 Spring 139
C0306 10/06/2003 19/06/2003 Spring 167
C0406 05/06/2004 13/06/2004 Spring 161
C0504 29/03/2005 08/04/2005 Spring 93
C0512 14/12/2005 24/12/2005 Winter 353
* For every survey, the median day within the survey was computed as the nth day of
the year corresponding to the quantity: (year’s day survey started + year’s day survey
ended) / 2.

GIS/Spatial Analyses in Fishery and Aquatic Sciences (Vol.6)
8
three groups of shrimps according to their developmental stage: juveniles; adult males; and mature females. The juvenile group includes individuals of size (i.e., length of the carapace; Lc) < 22 mm and with a stage of maturity < 3. Adult males include those with Lc ≥ 22 mm, while mature females correspond to individuals of Lc ≥ 22 mm and a stage of maturity ≥ 3. We excluded the rare mature but small individuals of a size between 15 mm and 21 mm.
3.3 Spatial animal-movement tool The spatial animal-movement extension (SAME) integrated into the ArcView GIS software is available on Unix, PC or Macintosh platforms. This tool includes more than 50 functions facilitating the use of parametric and non-parametric analysis, the tests of density distributions, tests of correlation, linear statistics of position, circular statistics and tools to follow-up the movement of studied phenomena (Hooge et al., 2001). The functions used in this work are described below: 3.3.1. Location statistics This tool calculates a series of descriptive statistics of the animal-location-point pattern and can output graphical representations of some statistics. The parameters discussed here are:
R2: a measure of dispersion of the data that is the mean-squared distance (MSD) from the centre of gravity;
Primary axis angle: the departure of the primary axis from the X-axis (90° to -90°). This parameter describes the direction of the distribution of the population compared to geographical North;
Eccentricity (e): a characteristic parameter of a conical curve. According to the value of (e), the form of distribution of the population is determined as: e = 0, circle; e < 1, ellipse; e=1, a parabola; and e > 1, an hyperbola;
Anisotropy: the ratio of the secondary axis on the primary axis. We refer to anisotropy when the ratio tends towards 0 which means that the distribution varies according to the direction; and
Nearest-neighbour test (R): an indication on the mode of distribution of the population. A value of R < 1 indicates a tendency towards an aggregated distribution; a value of R = 1 corresponds to a random distribution; and a value of R > 1 means a regular distribution.

Houssa et al - Analysis of spatial distributions of pink shrimp in relation to environmental conditions on
the Atlantic coast of northern Morocco (003-022)
9
3.3.2. Weighted mean The concept of the weighted mean in the spatial analysis is from the famous gravitation theory of Newton. In gravity spatial analysis, a weighted mean (or gravity centre) of a distribution is the position where the maximum accessibility can be reached (Liu and Coleman, 1996). This position, which is not inevitably among all the individual points, informs about the tendency of the swinging of the distribution in space (Ebdon, 2004). The calculation of this parameter is as follows (Jenness, 2004):
(1)
f
xfX
i
ii
wc
(2)
f
yfy
i
ii
wc
where, wc is the weighted mean and f the frequency (or weighting
factor). 3.3.3. Circular statistics This module is useful for determining changes in the travel directions of animals and the significance of the direction of travel. The angular concentration (annotated r) defines the concentration of the individual directions around the average vector. When r decreases, it means a dispersion of the points around the average vector (Mello, 2005). The angular variance compares individual directions to the average vector. 3.3.4. Movement path This tool allows plotting of the trajectory of the movement of the studied phenomena.

GIS/Spatial Analyses in Fishery and Aquatic Sciences (Vol.6)
10
4. Results
4.1 Distribution in time and space of the species The analysis of the location statistics calculated for the points of presence of pink shrimp in the studied area does not show any apparent variation in distribution during 1998–2005 (Table 2). Table 2. Statistical results for pink shrimp distribution during the studied
surveys.
R2 varies between 0.64 and 1.02 with an inter-annual coefficient of variation of 13%. This weak displacement in space (Map 2) is probably connected to the slight shift of transect of the sampling grid from one survey to another.
Map 2. Position of the gravity centers, primary and secondary axes, and minimal
convex polygons during the period 1998 – 2005.
Survey Code R2 Primary axis angle Eccentricity Anisotropy Nearest Neighbor test
( R)
C9807 0.73 32.51 2.15 0.22 1.19
C9812 0.76 33.84 2.24 0.2 1.35
C9903 0.64 32.65 2.08 0.23 1.15
C9911 0.85 29.84 2.22 0.2 1.23
C0011 0.85 30.74 2.29 0.19 1.45
C0104 0.86 31.64 2.23 0.2 1.1
C0111 0.67 30.18 2.18 0.21 1.24
C0205 1.02 30.56 2.39 0.18 1.45
C0306 0.91 30.17 2.28 0.19 1.11
C0406 0.79 33.27 2.02 0.24 1.29
C0504 0.85 32.09 2.24 0.2 1.22
C0512 0.89 30.19 2.25 0.2 1.29

Houssa et al - Analysis of spatial distributions of pink shrimp in relation to environmental conditions on
the Atlantic coast of northern Morocco (003-022)
11
The primary axis angle lies between +29.84° and +33.84° compared to geographical North. The inter-annual coefficient of variation is 4%. This orientation is quasi parallel to the coastline of the zone, which presents a deviation ranging between 26° in the area north of 34° N and 40° in the area to the south.
The eccentricity, calculated for all the surveys, is higher than 1, ranging between 2.02 and 2.39, indicating that the distribution of pink shrimp follows a hyperbolic form. The factor of anisotropy shows values close to zero, ranging between 0.18 and 0.24, indicating that the distribution of pink shrimp in space does not favour a specific direction. The test of nearest neighbour shows values higher than 1 (between 1.10 and 1.45) for all the surveys, which is explained by a regular distribution of pink shrimp in space.
The weak temporal variations of these various parameters show that the geographical distribution of pink shrimp was relatively constant during the period of observation (1998–2005). Several studies, combining the upwelling index and its seasonal amplitude in the Eastern Central Atlantic region showed that the Moroccan area in the north (33–36° N) is characterized by a low seasonality and upwelling index (Orbi and Nemmaoui, 1992; Makaoui et al., 2001, Benazzouz et al., 2014) that might explain the observed stationarity.
4.2 Temporal change of pink shrimp weighted mean In terms of abundance, we can distinguish between two zones with high concentrations (Map 3a). The first zone ranges between 35° N and 34° N (area of the Rabat trench), characterized by grounds made up of sand an mud between 50 m and 200 m depth, and mud beyond 200 m. The rocky areas are not very abundant and are dispersed in this region. The second zone is limited on the one hand by latitudes 34° N and 33°30' N and on the other by the 50 m and 100 m isobaths. The bottom types are sand and mud.
The weighted mean (or gravity centre) calculated for CPUE (kg/h) shows that the strong concentrations of pink shrimp tend to be in zone 1 (Map 3b). When we plot the movement path of this variable according to the increase of the median day of the year, we note that moving from the ‘end of winter/starting time of spring’ until the ‘end of autumn/starting time of winter’ the high concentrations move in space, in the direction of decreasing depth, except for surveys C0111 and C1205 (Map 3c). This migration from offshore towards the coast can be explained by trophic and/or reproductive reasons. It is what will be checked when we analyze the distribution of the species according to the age.

GIS/Spatial Analyses in Fishery and Aquatic Sciences (Vol.6)
12
Map 3a. Areas Concentration of pink shrimp.
Map 3b. Location of the gravity centers according to the season.

Houssa et al - Analysis of spatial distributions of pink shrimp in relation to environmental conditions on
the Atlantic coast of northern Morocco (003-022)
13
Map 3c. Displacement of the gravity centres according to the median day of the survey.
4.3 Distribution area of juveniles and adults The weighted means for the groups of males and mature females tend to concentrate at the level of the muddy zones, in particular where depths exceed 200 m (Map 4). From the end of winter until the end of spring (March–June), we note a shift of the high concentrations of the males and females towards deep areas, up to 500 m; and it is also during this period that the abundance of the individuals ≥ 40 mm was increased, of which the majority were females. During the other seasons, we note a decrease in the average size and the maximum size, (Figure 1; Table 3). Strong concentrations were observed in more shallow depths ranging between 200 m and 500 m. Given that the pink shrimp is a benthic predator (Lagardère, 1971; Benchoucha, 2005) and that spawning takes place in depths greater than 200 m (Heldt, 1938), this shift of adult males and spawning females towards deeper areas can be explained by the diet and the life cycle of this species.

GIS/Spatial Analyses in Fishery and Aquatic Sciences (Vol.6)
14
Map 4a. Spatial distribution of the gravity centres of the mature adult shrimp.
Figure 1. Shrimp size distribution according to the seasons (Sp: spring; Su: Summer;
A: Autumn; W: Winter).

Houssa et al - Analysis of spatial distributions of pink shrimp in relation to environmental conditions on
the Atlantic coast of northern Morocco (003-022)
15
Table 3. Descriptive statistics for shrimp size (length of the carapace in mm) according to the season.
On the whole distribution area and regardless of the season, we
notice that juveniles are distributed preferentially in the bathymetric zone ranging between 50 m and 100 m, located between Larache harbour (35° N) and El Jadida harbour (33° N). Low CPUE of juveniles appears in depths neighbouring 200 m, primarily during spring. These individuals frequently have a size ranging between 15 mm and 21 mm Lc. These results are confirmed by the weighted mean calculated for the juveniles, which are distributed near the 100 m isobath, except for the surveys carried out between March and May. During this period, juvenile depths can exceed the 200 m isobath (Map 4b). This is the period of recruitment where the juveniles start to integrate with the adult population.
Map4b. Spatial distribution of the gravity centres of juvenile shrimp.
Season Average Maximum Minimum P1 P99 Standard
(mm) (mm) (mm) error
Spring 27.3 46 10 15 40 5.34
Summer 25.65 42 11 15 37 4.54
Autumn 25.78 44 11 14 36 4.92
Winter 25 37 10 17 34 3.99

GIS/Spatial Analyses in Fishery and Aquatic Sciences (Vol.6)
16
The comparison between the shape of the spatial distribution of juveniles, adult males and the mature females by the use of the location statistics and circular statistics applied to the weighted mean shows that although the three distributions are regular, that of juvenile is more dispersed and anisotropic (Table 4; Map 4c). Table 4. Location statistics and circulars statistics applied to the weighted
mean of juveniles and mature females.
Map 4c. Graphical representation of circular statistics computed for the gravity centres
of shrimps according to the developmental stages and sex.
The spatial structure of the distribution of the species can vary
according to age (Fernandes and Rivoirard, 1999).
Juveniles Mature females Adult males
R2 0.119 0.035 0.028
The primary axis angle 35.69 31.52 23.0822
Eccentricity 1.943 1.687 1.648
Anisotropy 0.264 0.34 0.37
Nearest Neighbor test( R) 1.59 1.24 1.32
Angular density 0.111 0.227 0.111
Angular variance 120.127 98.651 120.015

Houssa et al - Analysis of spatial distributions of pink shrimp in relation to environmental conditions on
the Atlantic coast of northern Morocco (003-022)
17
5. Discussion In the Moroccan Atlantic, the distribution of pink shrimp Parapenaeus longirostris is reported between 20 m and 700 m, though the species is more abundant between 70 m and 400 m (Holthuis, 1987), with adults mainly observed between 150 m and 350 m and juveniles between 100 m and 180 m (Ardizzone et al., 1990). Geographic areas characterized by high level of abundance are mainly located between Moulay Bousselham and Rabat. Such distribution of the abundance of the species is probably due to the presence of extended muddy seabed and the increased productivity in this area—and consequently, the abundance of food. Benthic bio-sedimentary characterization of the north Atlantic Moroccan shelf between Tangier and El Jaida revealed an extended central region of mud, bounded on the coastal side by medium or fine sands and offshore by biogenic muddy or coral formations (Benchoucha et al., 2008). An increased gradient in terms of biomass was highlighted with pure mud or sandy mud being highly productive (Bayed and Glemarec, 1987 cited by Benchoucha et al. 2008). Others studies showed that the global abundance of shrimps is proportional to the species annual thermal balance sheet (Berry and Baxter, 1969; Barrett and Gillespie, 1973, 1975; Benchoucha et al., 2008).
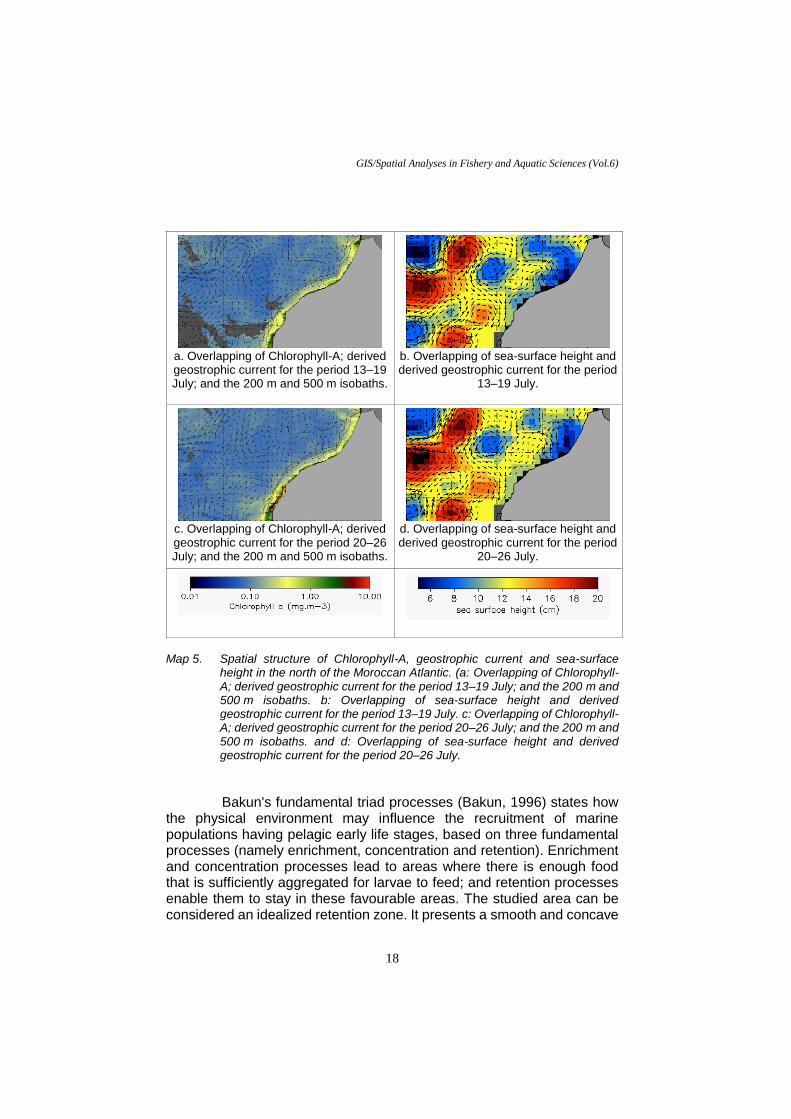
The studied area is characterized by some hydrological particularities in term of seasonal upwelling activity that occur mostly during summer months (July–August). This upwelling activity is spatially reduced to a small location in front of Larache (35° N) and thermally high with temperature ranges between 19 °C and 20 °C (Benazzouz, Pelegri, et al., 2014a). This phenomenon plays an important role in inducing both horizontal and vertical transport of water masses, heat, momentum, and bio-geochemical properties in this area (Map 5). In a vertical sense, a cyclonic eddy has the potential to induce local upwelling, sustain nutrients near the sea surface, stimulate phytoplankton growth and enhance primary productivity (McGillicuddy et al., 1998).
In fact, merged figures of seven-days-averaged satellite altimetry
and their derived surface-geostrophic circulation-anomaly reveal a coincidence of cyclonic eddy development, upwelling and a high surface CHL-a area (Map 5). This suggests that upwelling, obviously observed in the northern area (north of 34° N), be induced by such a surface circulation resulting in relatively high surface CHL-a (>1 mg m-3). This active dynamic leads to an interaction between a cyclonic eddy in the core of the upwelling process at 35° N and the anti-cyclonic eddy. This interaction drives the biological material transport in both the horizontal offshore direction in response to the Ekman transport (Ekman, 1905) and southward by the advection process (Pelegrí et al., 2005; Benazzouz, et al., 2014b).
GIS/Spatial Analyses in Fishery and Aquatic Sciences (Vol.6)
18
a. Overlapping of Chlorophyll-A; derived geostrophic current for the period 13–19 July; and the 200 m and 500 m isobaths.
b. Overlapping of sea-surface height and derived geostrophic current for the period
13–19 July.
c. Overlapping of Chlorophyll-A; derived geostrophic current for the period 20–26 July; and the 200 m and 500 m isobaths.
d. Overlapping of sea-surface height and derived geostrophic current for the period
20–26 July.
Map 5. Spatial structure of Chlorophyll-A, geostrophic current and sea-surface
height in the north of the Moroccan Atlantic. (a: Overlapping of Chlorophyll-A; derived geostrophic current for the period 13–19 July; and the 200 m and 500 m isobaths. b: Overlapping of sea-surface height and derived geostrophic current for the period 13–19 July. c: Overlapping of Chlorophyll-A; derived geostrophic current for the period 20–26 July; and the 200 m and 500 m isobaths. and d: Overlapping of sea-surface height and derived geostrophic current for the period 20–26 July.
Bakun's fundamental triad processes (Bakun, 1996) states how the physical environment may influence the recruitment of marine populations having pelagic early life stages, based on three fundamental processes (namely enrichment, concentration and retention). Enrichment and concentration processes lead to areas where there is enough food that is sufficiently aggregated for larvae to feed; and retention processes enable them to stay in these favourable areas. The studied area can be considered an idealized retention zone. It presents a smooth and concave

Houssa et al - Analysis of spatial distributions of pink shrimp in relation to environmental conditions on
the Atlantic coast of northern Morocco (003-022)
19
coastline with a very wide continental shelf. This physical condition associated with the enrichment and concentration processes make this area a potential zone for the Bakun triad process.
6. Conclusions In this study, the use of a GIS tool and the extension ‘Spatial animal movement’ made it possible to identify the movement of pink shrimp in relation to its life cycle and its habitat. The species was found in trawls throughout the area between 35° N and 33° N, with a high concentration in the region of concavity near 34° N. In this area, adult individuals including mature females tend to occur at depths between 200 m and 500 m, whereas juveniles are concentrated towards the 100 m contour, aligned along the coast.
These results are consistent with the biological studies performed on this species within the same area. Hence, the GIS tool and the extension ‘Spatial animal movement’ could be considered useful for fisheries-management advice, both by insuring better understanding of the biology of fisheries resources and by improving their stock assessment indicators.
References Ardizzone, G.D., Gravina, M.F., Belluscio, A. and Schintu, P. 1990. Depth size
distribution pattern of Parapenaeus longirostris (Lucas, 1846) in the central
Mediterranean Sea. Journal of Crustacean Biology, 10: 139–147. Bakun, A. 1996. Patterns in the ocean: ocean processes and marine population
dynamics. Publisher: California Sea Grant College System, National Oceanic and Atmospheric Administration, in cooperation with Centro de Investigaciones Biológicas del Noroeste. 323 pages.
Barber J. 2004. The Use of GIS in Studying Benthic Marine Animal Movement and
Habitat Use. Overview Paper (2004). http://www.edc.uri.edu/nrs/classes/NRS409/509_2003/jbarb.pdf. [2014]
Barrett, B.B. and Gillespie, M.C. 1973. Primary factors which influence commercial
shrimp production in coastal Louisiana. Wildlife and Fisheries Communication Technical Bulletin, 9: 1–28.
Barrett, B.B. and Gillespie, M.C. 1975. Environmental conditions relative to shrimp
production in coastal Louisiana. Wildlife and Fisheries Communication Technical Bulletin, 15: 1–22.

GIS/Spatial Analyses in Fishery and Aquatic Sciences (Vol.6)
20
Bayed, A. and Glemarec M., 1987. La plate-forme continentale Atlantique nord-Marocaine: Bionomie et Zoogeographie. Oceanologica Acta 10: 111–121.
Benazzouz, A., Pelegrí, J.L., Demarcq, H., Machín, F., Mason, E., Orbi, A., Peña-
Izquierdo, J. and Soumia, M. 2014. On the temporal memory of coastal upwelling off NW Africa. Journal of Geophysical Research: Oceans, 119: 6356-6380. doi:10.1002/2013JC009559.
Benazzouz, A., Soumia, M., Orbi A., Mohamed, C., Karim, H., Abderrahman, A., Josep,
L.P. and Demarcq, H. 2014. An improved coastal upwelling index from sea surface temperature using satellite-based approach – The case of the Canary Current upwelling system. Continental Shelf Research, 81: 38-54. doi:10.1016/j.csr.2014.03.012.
Benchoucha, S., 2005. Etude de la biologie de la crevette rose du large (Parapenaeus
longirostris, Lucas, 1846) de la côte Atlantique marocaine. Mémoire DESA. Université Hassan II, Aïn Chock, Casablanca.
Benchoucha S., Berraho A., Bazairi H., Katara I., Benchrifi S. and Valavani V. D.,
2008. Salinity and temperature as factors controlling the spawning and catch of Parapenaeus longirostris along the Moroccan Atlantic Ocean. Hydrobiologia, 612, pp.109–123.
Berry, R.J. and Baxter, K.N. 1969. Predicting brown shrimp abundance in the
northwestern Gulf of Mexico. FOA Fisheries Report, 3: 776–798. Caddy, J.F. et Bakun, A. 1994. A tentative classification of coastal marine ecosystems
based on dominant processes of nutrient supply. Ocean and Coastal Management, 23, pp.201-211.
Chaouachi, B. and Ben Hassine, O.K. 1998. Données sur la pêche des crevettes
profondes Parapenaeus longirostris (Lucas, 1846) en Tunisie. International Centre for Advanced Mediterranean Agronomic Studies (CIHEAM), 13 pp.
Collignon, J. 1965. Les côtes et le plateau continental marocains. Bulletin de l’Institut
des Pêches Maritimes du Maroc, 13: 21–37. Comeau, M. and Savoie, F. 2001. Growth increment and moult frequency of American
lobster (Homarus americanus) in the southwestern Gulf of St. Lawrence.
Journal of Crustacean Biology, 21: 923–936. Ebdon, D. 2004. Statistics in Geography. A Practical Approach. Ed. United Kingdom;
International Ltd. Padstow, Cornwall. 176 pp. Ekman, V. 1905. On the influence of the earth’s rotation on ocean-currents. Arkiv Foer
Matematik, Astronomi och Fysik, 2: 1–53. Fernandes, P.G. and Rivoirard, J. 1999. A geostatistical analysis of the spatial
distribution and abundance of cod, haddock and whiting in North Scotland. In Proceedings of the Second European Conference on Geostatistics for Environmental Applications: GeoENV II. Valencia, Spain. J. Gomez-Hernandez, A Soares and R. Froidevaux (Editors). Quantative Geology and Geostatistics, 10: 201–212.

Houssa et al - Analysis of spatial distributions of pink shrimp in relation to environmental conditions on
the Atlantic coast of northern Morocco (003-022)
21
Froglia, C. 1982. Contribution to the knowledge of the biology of Parapenaeus longirostris (Lucas) (Decapoda, Penaeidea). Quaderni Laboratorio
Tecnologia Pesca, 3: 163–168. González-Gurriarán, E. and Freire, J. 1994. Movement patterns and habitat utilization
in the spider crab Maja squinado (Herbst) (Decapoda, Majidae) measured by
ultrasonic telemetry. Journal of Experimental Marine Biology and Ecology, 184: 269–291.
Heldt, J.H. 1938. La Reproduction Chez les Crustacés Décapodes de la Famille des
Péneides. Thèse Es-Sciences naturelles, Université de Paris, 206 pp. Heldt, J.H. 1954. Contribution à l’étude de la biologie des Pénéidés. II : Etage de
répartition des péneidés d’Afrique du Nord. Bulletin Station Océanographique Salammbô, 47. 27 pp + annexes.
Holthuis, L.B. 1980. FAO species catalogue. Vol.1 – Shrimps and prawns of the world.
An annotated catalogue of species of interest to fisheries. FAO Fisheries Synopsis No. 125, Volume 1. 260 pp.
Holthuis, L.B., 1987. Crevettes. In W. Fischer, M. Schneider and M.L. Bauchot (Editors).
Fiches FAO d’Identification des Espèces pour les Besoins de la Pêche. Méditerranée et Mer Noire. Zone de Pêche 37. Végétaux et Invertébrés: 271–272.
Hooge, P.H., Eichenlaub, W.E. and Solomon E.K. 2001. Using GIS to analyze animal
movements in the marine environment. In Spatial Processes and Management of Marine Populations. University of Alaska Sea Grant, AK-SG-01-02: 37–51.
Hoyt, Z.N., Shirley, T.C., Warrenchuk, J.J., O’Clair, C.E. and Stone, R.P. 2002.
Observations of movement and habitat utilization by golden king crabs (Lithodes aequispinus) in Frederick Sound, Alaska. In Crabs in Cold Water Regions: Biology, Management and Economics. University of Alaska Sea Grant, AK-SG-02-01: 595–608.
Jenness, J. 2004. Weighted mean extension for ArcView3.x,v. 1.2c. Jenness
Entreprises. Lagardère, J.P. 1971. Les crevettes des côtes du Maroc. Trav. Inst. Chérif et Fac. des
Sciences, Série Zool. 36, 140 pp. 325 fig. Legendre, P. 1993. Spatial autocorrelation: Trouble or new paradigm? Ecology, 74:
1659–1673. Liu, G. and Coleman, T.L. 1996. Gravity center analysis using ARCVIEW and Avenue.
10 pp. http://gis.esri.com/library/userconf/proc96/TO150/PAP129/P129.HTM Makaoui, A., Orbi, A., Larissi, J., Zizah, S. and Hilmi, K. 2001. Principales
caractéristiques océanographiques de la côte atlantique marocaine de 1994 à 1998. Bulletin de l’Institut Scientifique, 23: 43–54.

GIS/Spatial Analyses in Fishery and Aquatic Sciences (Vol.6)
22
McGillicuddy, D.J., Robinson, A.R., Siegel, D.A., Jannasch, H.W., Johnson, R., Dickey, T.D., McNeil, J., Michaels, A.F. and Knap, A.H. 1998. Influence of mesoscale eddies on new production in the Sargasso Sea. Nature 394: 263–266.
Mello, C. 2005. Statistiques circulaires et utilisation en psychologie. Tutorial in
Quantitative Methods in Psychology, 1: 11–17. Orbi, A. and Nemmaoui, M. 1992. Fluctuations des vents et variabilité de l’upwelling le
long de la côte atlantique marocaine. Inst. Scie. Pêc. Mart. Trav. and Doc. N° 75.
Pelegrí, J.L., Arístegui, J., Cana, L., González-Dávila, M., Hernández-Guerra, A.,
Hernández-León, S., Marrero-Díaz, A., Montero, M.F., Sangrà, P., and Santana-Casiano, M. 2005. Coupling between the open ocean and the coastal upwelling region off northwest Africa: water recirculation and offshore pumping oforganic matter. Journal of Marine Systems, 54: 3-37.
Wolcott, T.G. and Hines, A.H. 1997. Advances in ultrasonic biotelemetry for animal
movement and behaviour: the blue crab case study. Lang and Baldwin (Eds.): Methods and Techniques of Underwater Research: 229-236.