analysis of shoreline change in...
TRANSCRIPT

Center for Land Use Education and Research
Connecticut Department of Energy and Environmental Protection Photograph: Courtesy of Joel Stocker 2013
Joel Stocker – UConn Extension
Kevin O’Brien – CT DEEP OLISP
Juliana Barrett – Connecticut Sea Grant
Bruce Hyde – UConn Extension
Funding by NOAA/National Sea Grant
Analysis of Shoreline Change in Connecticut 100 Years of Erosion and Accretion

Center for Land Use Education and Research
Connecticut Department of Energy and Environmental Protection Photograph: Courtesy of Joel Stocker 2013
• Project Goal: Conduct a Geographic Information System (GIS) time series analysis using maps of the Connecticut shoreline from several different time periods between 1880 and 2006 (100+ years) to provide a high-level, quantifiable assessment on CT shoreline trends from both a statewide and a localized perspective. Statistics will be generated using the USGS Digital Shoreline Analysis System (DSAS) software.
• Education: Webinar R - Materials will also be used for future talks and presentations.
• Schedule: Completion April 2014.
Analysis of Shoreline Change in Connecticut 100 Years of Erosion and Accretion

Center for Land Use Education and Research
Connecticut Department of Energy and Environmental Protection Photograph: Courtesy of Joel Stocker 2013
• Presentation Outline:
– Guidelines for use (caveats, etc.)
– Background (USGS studies)
– Definitions (shoreline means…)
– Data sources and tools
– Process explained and preliminary results
– Selected samples around the State
– Repeat caveats
Analysis of Shoreline Change in Connecticut 100 Years of Erosion and Accretion

Center for Land Use Education and Research
Connecticut Department of Energy and Environmental Protection
Overall caveats:
Shorelines are continuously moving in response to natural processes and human activities.
Cyclic and non-cyclic processes change the shoreline position from daily and seasonal effects (wind/waves/storms), to changes in sea level over a century to thousands of years. Beaches can be nourished/graded and shorelines can be filled, developed, and armored.
The results reflect a cumulative summary of the natural and man-made processes affecting the shoreline for the time period analyzed. We have addressed areas of obvious or large-scale development on a limited basis when considering portions of the results (i.e., the pace of change.) Specifically areas in Bridgeport, New Haven, the Thames River, and selected portions of Fairfield County.

Center for Land Use Education and Research
Connecticut Department of Energy and Environmental Protection
Disclaimer*: Shoreline change data presented here may differ from that found in other sources, any differences do not necessarily indicate other data sources are inaccurate. When considering other sources of shoreline change, discrepancies are to be expected considering the many possible ways of determining shoreline positions and rates of change, and the inherent uncertainty in calculating these rates. The results from this analysis represent shoreline movement under past conditions and are not intended for use in predicting future shoreline positions or future rates of shoreline change.
* Adapted and amended from Hapke, C.J., Himmelstoss, E.A., Kratzmann, M., List, J.H., and Thieler, E.R., 2010, National Assessment of Shoreline Change; historical shoreline change along the New England and Mid-Atlantic coasts: U.S. Geological Survey Open-File Report 2010-1118, 57 p.

Center for Land Use Education and Research
Connecticut Department of Energy and Environmental Protection
Suggested Best Practice Guidelines (non-exhaustive:) The materials presented can be reasonably used to: • identify areas that have historically exhibited erosion or accretion trends; • identify areas that have shown a “trend reversal” from the long term to the short term (either changing from erosion to accretion or vice-versa); • generally assess the speed or magnitude of change; • support or direct research investigations or planning purposes
The materials presented should not be used to:
• solely differentiate/explain the cause of change; • state with absolute certainty the magnitude or speed of change at a given location; • predict future rates and/or amount of change; • develop engineering or design plans*
* Without a review of the underlying data

Center for Land Use Education and Research
Connecticut Department of Energy and Environmental Protection
USGS – 2010 Shoreline Change Study Project Background…

Center for Land Use Education and Research
Connecticut Department of Energy and Environmental Protection
USGS – 2010 Shoreline Change Study

Center for Land Use Education and Research
Connecticut Department of Energy and Environmental Protection
USGS – 2010 Shoreline Change Study
Why CT was not done and why we took it on: • Long Island Sound is a comparatively low-energy system vs. Atlantic seaboard so recent efforts by USGS to assess shoreline change have ignored it
* National Assessment of Shoreline Change – New England Mid-Atlantic Coasts 2010. OFR 2010-1118
• Existing information is either sparse, anecdotal (personal observations/institutional memory,) or dated (1980 CAM Planning Report 29) • Several recent stated or implied needs
• recommendations from CT Legislative Shoreline Taskforce; • assorted questions from various state & local regulatory/planning groups

Center for Land Use Education and Research
Connecticut Department of Energy and Environmental Protection
CT Study Area - 24 Coastal Towns

Center for Land Use Education and Research
Connecticut Department of Energy and Environmental Protection
Over 100 Miles of Shoreline

Center for Land Use Education and Research
Connecticut Department of Energy and Environmental Protection
High Water
Line
What defines a shoreline?

Center for Land Use Education and Research
Connecticut Department of Energy and Environmental Protection
Need “Standard” Shoreline Between the Years
Not using dune or storm line for this project
Dune Line
(hurricane)
Our Sources and Shoreline Definitions: 1) Office of Coast Survey/NOAA T-Sheets (Topographic Survey Sheets):
Mean High Water (MHW): By definition = average of two daily high water lines. On T-sheets from the Atlantic coast, it’s interpreted by trained topographers using the physical appearance of the beach (usually a line from the preceding high water limit). From “Shore & Sea Boundaries” Vol 2 by Aaron Shalowitz
2) USGS 1:24K Topographic Quad Sheets:
Wet/Dry Line: Per USGS recommendation, shorelines from standard USGS Topographic Maps were also used. These are best described as the “wet/dry line” or the intersection of land and water as interpreted from the source material - typically aerial photos. Since the wet/dry line and MHW may not be exactly the same, we have to adjust the uncertainty (“+/-“) in the analysis when using features derived from this source.

Center for Land Use Education and Research
Connecticut Department of Energy and Environmental Protection
With uncertainty…
“Standard” Shoreline Between the Years

Center for Land Use Education and Research
Connecticut Department of Energy and Environmental Protection
24 Shoreline Towns Shoreline Change: How Far Back Can
Measure it? 1685? Pre-Colonial?
http://magic.lib.uconn.edu/historical_maps.html

Center for Land Use Education and Research
Connecticut Department of Energy and Environmental Protection
1824?
http://magic.lib.uconn.edu/historical_maps.html
Getting closer...

Center for Land Use Education and Research
Connecticut Department of Energy and Environmental Protection
1880’s First Accurate
Surveys of National
Coastline – NOS/NOAA
(Now GIS Vector Files)

Center for Land Use Education and Research
Connecticut Department of Energy and Environmental Protection
1880 T-Sheet Surveys

Center for Land Use Education and Research
Connecticut Department of Energy and Environmental Protection
1880 T-Sheet Surveys

Center for Land Use Education and Research
Connecticut Department of Energy and Environmental Protection
1880 T-Sheet Surveys

Center for Land Use Education and Research
Connecticut Department of Energy and Environmental Protection
Source: T-Sheet User Guide SFEI Report No. 427 Sept. 2005
Surveyed from the ground – They
did not have aerial photographs
1880 T-Sheet Surveys

Center for Land Use Education and Research
Connecticut Department of Energy and Environmental Protection
1880 T-Sheet Surveys

Center for Land Use Education and Research
Connecticut Department of Energy and Environmental Protection
1880 Shoreline
(mean high water)
Vegetation Line
Waterline
1880 T-Sheet Surveys

Center for Land Use Education and Research
Connecticut Department of Energy and Environmental Protection
2006 Shoreline
300 ft ±
1880 Shoreline
(mean high water)
1880 T-Sheet Surveys Shorelines Digitized by CT DEEP and NOAA

Center for Land Use Education and Research
Connecticut Department of Energy and Environmental Protection
Interior coves, rivers, and bays were
omitted from this analysis, focusing
instead on the immediate shoreline.
Early decades grouped to create Statewide feature
Portions of the State have line sets for multiple years

Center for Land Use Education and Research
Connecticut Department of Energy and Environmental Protection
How Do We Process the Data?

Center for Land Use Education and Research
Connecticut Department of Energy and Environmental Protection
Step 1: Within ArcGIS - Create an
offshore baseline

Center for Land Use Education and Research
Connecticut Department of Energy and Environmental Protection
The software creates transects…
The transects intersect the shorelines…
Step 2: Run a GIS program called DSAS

Center for Land Use Education and Research
Connecticut Department of Energy and Environmental Protection
The software creates transects…
The transects intersect the shorelines…
Step 2: Run a GIS program called DSAS
Output: Shoreline change measurements
linked to and stored within each transect

Center for Land Use Education and Research
Connecticut Department of Energy and Environmental Protection
The analysis was run for all of the
Connecticut shoreline

Center for Land Use Education and Research
Connecticut Department of Energy and Environmental Protection
The Process 1. Meetings with USGS staff to learn their methodology & benefit from their
experiences 2. Acquired shoreline data from NOAA, USGS, CT DEEP

Center for Land Use Education and Research
Connecticut Department of Energy and Environmental Protection
3. Reviewed data against known sources of error and position on the landscape. Using known sources of error (e.g., quality of source material, interpretation, technique, vintage, etc.,) we can define a boundary of “+ / -” some distance for shorelines. Compare the shorelines & boundaries to relevant photos with areas of known stability (rocks, rocky outcrops, other “permanent” objects, etc.)
Blue line is the shoreline as defined, pink cross-hatching defines the boundary where the “true” shoreline could have been. Boundary and shoreline match well with shoreline from the photo.

Center for Land Use Education and Research
Connecticut Department of Energy and Environmental Protection
3. Reviewed data against known sources of error and position on the landscape.
Blue line is the shoreline as defined, pink cross-hatching defines the boundary where the “true” shoreline could have been. Portions of the boundary and shoreline do not match well with shoreline from the photo.

Center for Land Use Education and Research
Connecticut Department of Energy and Environmental Protection
4. Used freely available USGS software (Digital Shoreline Analysis System – DSAS) to assess and quantify change across CT using two primary categories:
“How much has the shoreline changed?” (How far has it moved?) “How fast has the shoreline changed?” (At what rate is it moving?) For each category we also consider: the long term change (i.e., using all the shoreline data from 1880s – 2006) the “short” term change (i.e., using just shoreline data from 1983 – 2006)
The results are presented (either spatially or via tables/charts:) for a series of individual points along the coast; for points grouped by coastal towns for points grouped by areas of the coast that are geologically similar.

Center for Land Use Education and Research
Connecticut Department of Energy and Environmental Protection
A
B
C D E
F G
CT coastal towns & geologically similar areas:
Source: Arthur Bloom (1967) via CAM Planning Report 29 – “Shoreline Erosion and Recommended Planning Process” 1979
Center for Land Use Education and Research
Connecticut Department of Energy and Environmental Protection
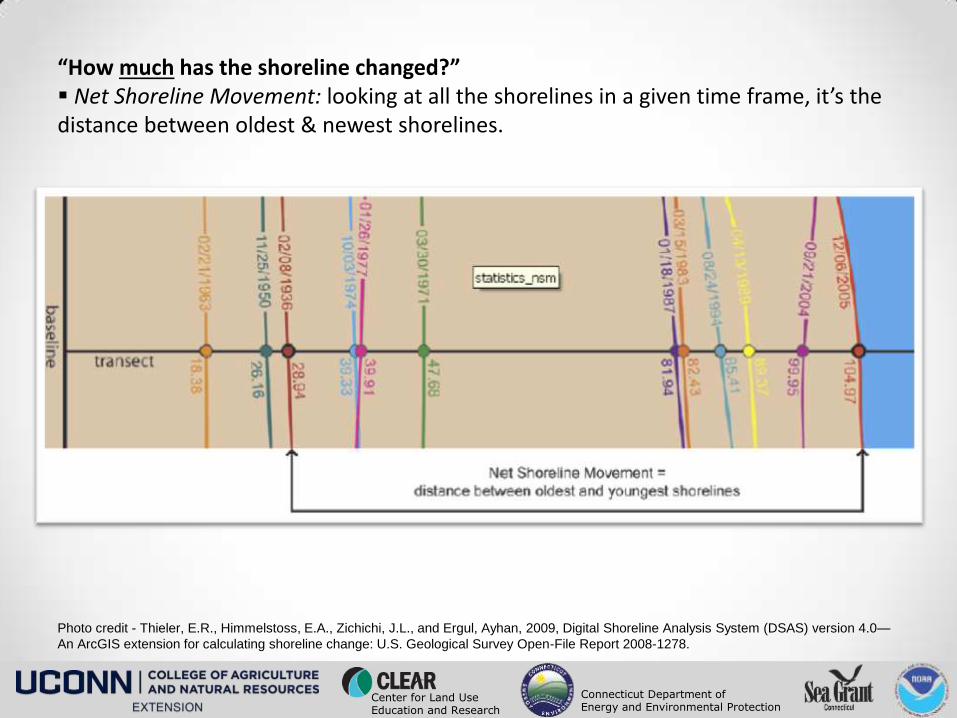
“How much has the shoreline changed?” Net Shoreline Movement: looking at all the shorelines in a given time frame, it’s the distance between oldest & newest shorelines.
Photo credit - Thieler, E.R., Himmelstoss, E.A., Zichichi, J.L., and Ergul, Ayhan, 2009, Digital Shoreline Analysis System (DSAS) version 4.0—
An ArcGIS extension for calculating shoreline change: U.S. Geological Survey Open-File Report 2008-1278.

Center for Land Use Education and Research
Connecticut Department of Energy and Environmental Protection
“How fast has the shoreline changed?” a. End Point Rate: Net Shoreline Movement divided by the time elapsed.
if the Net Shoreline Movement was 76 meter and the timespan was 69 years, the end point rate is 1.1 meters per year (76 meters/69 years)
Photo credit - Thieler, E.R., Himmelstoss, E.A., Zichichi, J.L., and Ergul, Ayhan, 2009, Digital Shoreline Analysis System (DSAS) version 4.0—
An ArcGIS extension for calculating shoreline change: U.S. Geological Survey Open-File Report 2008-1278.

Center for Land Use Education and Research
Connecticut Department of Energy and Environmental Protection
“How fast has the shoreline changed?” End Point Rate Pros:
Simple calculation that’s easily understandable; Can be used essentially anywhere you have data (all you need is 2 shorelines.) Easily applied to both Long Term and Shore Term analysis
End Point Rate Cons:
Ignores other shorelines, so the rate can be idealized; Assumes a linear fit; not always the case Rate can be highly influenced by the quality of either (or both) of the shorelines; Provides no measure of “how confident we are” the rate is

Center for Land Use Education and Research
Connecticut Department of Energy and Environmental Protection
“How fast has the shoreline changed?” b. Linear Regression Rate: uses shoreline locations to “fit” a line that approximates the
trend of the data. The line’s orientation and how well it fits is used calculate a rate and say how confident we are about it. (Confidence is user defined.)
Slope of dashed line = rate Offsets from the data points to the line are used to assess confidence
Photo credit - Thieler, E.R., Himmelstoss, E.A., Zichichi, J.L., and
Ergul, Ayhan, 2009,
Digital Shoreline Analysis System (DSAS) version 4.0 —
An ArcGIS extension for calculating shoreline change:
U.S. Geological Survey Open-File Report 2008-1278.

Center for Land Use Education and Research
Connecticut Department of Energy and Environmental Protection
“How fast has the shoreline changed?” Linear Regression Rate Pros:
Relatively easy to implement; Uses all shoreline data; Provides a rate and an estimate of confidence in it; Allows user to specify level of confidence (e.g., 95%, 90%, etc., )
Linear Regression Rate Cons:
Assumes a linear fit; not always the case Requires at least 3 data points (ideally more) Can return “inconclusive” results (e.g., where the measure of uncertainty is greater than the rate) – requires user to interpret results There may be areas where no output can be used.

Center for Land Use Education and Research
Connecticut Department of Energy and Environmental Protection
Example Output: Summary Tables

Center for Land Use Education and Research
Connecticut Department of Energy and Environmental Protection
Example Output: Charts How much has the shoreline changed over the long term (averaged by town)

Center for Land Use Education and Research
Connecticut Department of Energy and Environmental Protection
Example Output: Charts How much has the shoreline changed over the short term (averaged by town)

Center for Land Use Education and Research
Connecticut Department of Energy and Environmental Protection
Example Output: Charts How fast has the shoreline changed in the long and short term (averaged by town)

Center for Land Use Education and Research
Connecticut Department of Energy and Environmental Protection
Example Output: Charts How much has the shoreline changed (in a specific geological area)

Center for Land Use Education and Research
Connecticut Department of Energy and Environmental Protection
Example Output: Charts How fast has the shoreline changed (in a specific geological area)

Center for Land Use Education and Research
Connecticut Department of Energy and Environmental Protection
One More Term… Shoreline Change Envelope (SCE): Shoreline Change Envelope reports the distance between shorelines measured furthest and closest to the baseline for each transect. This represents the total change in movement and is not governed by the age of the shorelines.
Photo credit - Thieler, E.R., Himmelstoss, E.A., Zichichi, J.L., and Ergul, Ayhan, 2009, Digital Shoreline Analysis System (DSAS) version 4.0—
An ArcGIS extension for calculating shoreline change: U.S. Geological Survey Open-File Report 2008-1278.
For the visuals the Transects have been clipped to this length

Center for Land Use Education and Research
Connecticut Department of Energy and Environmental Protection
Example Output: Geospatial Data - Urban Area Fill Material (New Haven) Shoreline Change Envelope (SCE) and Net Shoreline Movement (NSM)
Image: March 2012 CT DEEP

Center for Land Use Education and Research
Connecticut Department of Energy and Environmental Protection
Example Output: Geospatial Data - Urban Area Fill Material (Bridgeport) Shoreline Change Envelope (SCE) and Net Shoreline Movement (NSM)
Image: March 2012 CT DEEP

Center for Land Use Education and Research
Connecticut Department of Energy and Environmental Protection
Image: March 2012 CT DEEP
Example Output: Geospatial Data - Urban Area Fill Material (Thames River) Shoreline Change Envelope (SCE) and Net Shoreline Movement (NSM)

Center for Land Use Education and Research
Connecticut Department of Energy and Environmental Protection
Example Output: Geospatial Data (Stratford) End Point Rates and Net Shoreline Movement
Image: March 2012 CT DEEP

Center for Land Use Education and Research
Connecticut Department of Energy and Environmental Protection
Example Output: Geospatial Data (Stratford/Bridgeport) End Point Rates and Net Shoreline Movement
Image: March 2012 CT DEEP

Center for Land Use Education and Research
Connecticut Department of Energy and Environmental Protection
Example Output: Geospatial Data (Stratford/Bridgeport) End Point Rates and Net Shoreline Movement
Image: T-Sheet 1880

Center for Land Use Education and Research
Connecticut Department of Energy and Environmental Protection
Example Output: Geospatial Data (Milford) End Point Rates and Net Shoreline Movement
Image: March 2012 CT DEEP

Center for Land Use Education and Research
Connecticut Department of Energy and Environmental Protection
Example Output: Geospatial Data (Milford) End Point Rates and Net Shoreline Movement
Image: T-Sheet 1880

Center for Land Use Education and Research
Connecticut Department of Energy and Environmental Protection
Example Output: Geospatial Data (Clinton/Hammonasset Beach) End Point Rates and Net Shoreline Movement
Image: March 2012 CT DEEP

Center for Land Use Education and Research
Connecticut Department of Energy and Environmental Protection
Example Output: Geospatial Data (Clinton/Hammonasset Beach) End Point Rates and Net Shoreline Movement
Image: March 1934 UConn Magic/CT State Lib

Center for Land Use Education and Research
Connecticut Department of Energy and Environmental Protection
Example Output: Geospatial Data (Gilford/Madison) End Point Rates and Net Shoreline Movement
Image: March 2012 CT DEEP

Center for Land Use Education and Research
Connecticut Department of Energy and Environmental Protection
Example Output: Geospatial Data (Old Lyme/Griswold Point) End Point Rates and Net Shoreline Movement
Image: March 2012 CT DEEP

Center for Land Use Education and Research
Connecticut Department of Energy and Environmental Protection
Image: T-Sheet 1880
Example Output: Geospatial Data (Old Lyme/Griswold Point) End Point Rates and Net Shoreline Movement

Center for Land Use Education and Research
Connecticut Department of Energy and Environmental Protection
Image: March 1934 UConn Magic/CT State Lib
Example Output: Geospatial Data (Old Lyme/Griswold Point) End Point Rates and Net Shoreline Movement

Center for Land Use Education and Research
Connecticut Department of Energy and Environmental Protection
Example Output: Geospatial Data (Old Lyme/Griswold Point) End Point Rates and Net Shoreline Movement
Image: November 6, 2012 NOAA

Center for Land Use Education and Research
Connecticut Department of Energy and Environmental Protection Photograph: Courtesy of Joel Stocker 2013
• Access to results?
Planned output includes spatial data,
reports, hard copy materials, and a web site
on a Sea Grant/CLEAR server. We should
be able to email webinar participants when
a link is available.
Temporary Site:
http://clear2.uconn.edu/coastalchange
Official Site - Late April??
Center for Land Use Education and Research
Connecticut Department of Energy and Environmental Protection
Disclaimer*: Shoreline change data presented here may differ from that found in other sources, any differences do not necessarily indicate other data sources are inaccurate. When considering other sources of shoreline change, discrepancies are to be expected considering the many possible ways of determining shoreline positions and rates of change, and the inherent uncertainty in calculating these rates. The results from this analysis represent shoreline movement under past conditions and are not intended for use in predicting future shoreline positions or future rates of shoreline change.
* Adapted and amended from Hapke, C.J., Himmelstoss, E.A., Kratzmann, M., List, J.H., and Thieler, E.R., 2010, National Assessment of Shoreline Change; historical shoreline change along the New England and Mid-Atlantic coasts: U.S. Geological Survey Open-File Report 2010-1118, 57 p.

Center for Land Use Education and Research
Connecticut Department of Energy and Environmental Protection Photograph: Courtesy of Joel Stocker 2013
Joel Stocker – [email protected]
Kevin O’Brien – [email protected]
Juliana Barrett – [email protected]
Analysis of Shoreline Change in Connecticut 100 Years of Erosion and Accretion
Thank You!