analysis of sba’s preferred lenders program s.usiness... _... analysis of sba’s preferred...
TRANSCRIPT

s m L s . u s INEss . . . _ . . .
A n a lysis o f S B A ’s P re fe rre d L e n d e rs P r o g r a m II
1 4 6 8 6 2 \-.
R E S T R ICTED- -No t to b e r e l eas i d o u ts ide th e G e n e r a l A c c o u n tin g O ff ice un l ess spec i f ica l ly a p p r o v e d by th e O ff ice o f Cong r e ss’ona l Re la t i ons , P L E A S E D
s 5 4 3 5 D ,._ .,” II . _ ... ._ . ._ _ -... - - . .._ .. .._ .- . ..^ .._ _ . _ . ._ .._ ._ _ _ _ _ ._ .._ .._ _ _ _ .. ~ -._ . _ _ .. - - _ _ ._ - I. G A W ltCE I)-9% 1 2 4

-^------.
United Stater General Accounting Offlce Wadbgton, D.C.20548
Resources, Community, and Economic Development Division
B-247462
May l&1992
The Honorable John J. LaFalce Chairman, Committee on Small
Business House of Representatives
Dear Mr. Chairman
This report responds to your request that we examine the Small Business Administration’s (SEA) Preferred Lenders Program. Under this program, SBA delegates to its best private lenders the authority to approve and service sEAguaranteed loans. For SBA’S other private lender programs, the Certifkd Lenders Program and the regular loan guarantee program, SBA ret&s the task of approving or denying the loan, and in the case of regular lenders, SEA also performs the credit analysis of the loan applicant. Because of the greater authority SEA provides to preferred lenders, preferred loans receive a lower guarantee percentage than those made in the certified and regular loan programs- a maximum of 80 percent of the total loan amount. However, regular and certified lenders are subject to certain SBA-imposed interest rate restrictions, while preferred lenders are not. From the inception of the Preferred Lenders Program in fucal year 1982 through fiscal year 1991, over 11,100 preferred loans, totaling $2.9 billion when approved, have been made to small businesses. The program represents an increasingly greater share of all SBA-guaranteed business loans.
The purpose of establishing the Preferred Lenders Program was to improve service to the small business community without increasing SBA’S involvement. In view of this purpose, you requested that we analyze the program in terms of the number of loans made, loan processing efficiency, and failure rate of these loans. Specifically, this report provides information on (1) the preliminary results of the Preferred Lenders Program, (2) the characteristics of preferred loans as compared with other SBA-guaranteed business loans, (3) the geographic distribution of preferred loans and (4) preferred lenders’ compliance with SBA’S regulations ss determined by independent audits.
A
Aspartofourexamina tion of preferred lenders, we compared certain aspects of their performance with that of certified and regular lenders. We did not, however, examine the performance of certified and regular lenders. In addition, we did not assess whether or not borrowers under the
Page 1 GAO/BCED-92-124 Small Budneu

4
B-247462
Preferred LRnders Program would have been deprived of credit in the absence of the program.
Results in Brief When SBA’S loan programs are measured by the number of loans made, loan processing efficiency, and loan failure rate, early indications are that the Preferred Lenders Program has achieved better results than either the certified or regular loan programs. However, most preferred loans have not reached the age when loans typically fail, which is about 3 years, and SBA’S Office of Inspector General (OIG) has found that preferred lenders have not always complied with SBA’S rules and regulations.
The number of preferred loans has increased nearly every year since the program’s inception in 1983. For example, while 83 preferred loans were made in 1983, over 280 loans were made in each of the following 2 years, and the number of preferred loans made over the next 6 years increased at an average annual rate of 64 percent. In lQQO,2,436 preferred loans were made. Regarding loan processing efficiency, a 1989 SBA study found that processing preferred loans takes one-third the time of processing loans under the certified loan program, and one-quarter the time of processing loans under the regular guaranteed loan program. This efficiency, in part, has helped SBA maintain a fairly stable volume of guaranteed lending despite agencywlde reductions in staff. Finally, the failure rate of preferred loans is only one-third that of loans made under SBA’S other guaranteed loan programs. Speciilcally, of the preferred loans made between fiscal years 1983 and 1990,362, or 4.6 percent, failed, while of the certified and regular loans made during this period, 2,911, or 10.2 percent, and 12,004,ol 16.8 percent, failed, respectively.
Compared with other SBA-guaranteed loans, preferred loans are larger in dollar amount but have similar interest rates. Preferred loans also more
.
often receive sBA’s maximum guarantee applicable to that program. Preferred loans and other SBA-guaranteed loans typically are made to businesses that are similar in terms of their organizational type and industxy.
Lending under the preferred loan program is concentrated geographically. For example, in fiscal year 1990, 10 of SBA’S 86 district and branch offices accounted for 61 percent of all of the preferred loans made. These 10 offices were 6 of the 7 district and branch offices located in California, and district offices in Newark, New Jersey; Philadelphia, Pennsylvania; Montpelier, Vermont; Seattle, Washington; and Milwaukee, Wisconsin.
Page 2 GMNRCED-92-124 Small Bushem
4

B-247422
Conversely, no preferred loans were made in 27 districts in fiscal year 1990, and three or fewer preferred loans were made in 11 districts. According to SBA, the geographic concentration of preferred loans is due to a number of factors, including competition among lenders and the regional economies’ effect on the demand for loans.
Recent audits of the program by SBA’S OIG have found problems with preferred lenders’ loan making, in particular, the unexplained or unclear use of loan proceeds and inadequate collateral to secure loans. Furthermore, SBA’S 1990 Federal Managers’ Financial Integrity Act report includes as a material weakness in internal controls the agency’s oversight of preferred lenders, citing a lack of accurate data to properly monitor the program . To improve the monitoring of lenders, in July 1990 SFSA revised its handbook for the program , adding a review checklist for district office stafp to use when sampling loan files during their periodic visits to preferred lenders. SBA offW rls also told us that the agency will include visits to preferred lenders and reviews of preferred loans in its reviews of district offIces’ internal controls.
Background In fiscal year 1983, SBA established the Preferred Lenders Program to improve the delivery of sw-guaranteed loans to the small business community. Under this program , SBA delegated to ita best lenders the authority to approve loans and to perform almost all actions involved in servicing and liquidating these loans without SBA’S approval. To be accepted into the program , a lender must, among other things, have successfully participated in the agency’s Certified Lenders Program; demonstrated the ability to process, close, service, and liquidate loans efficiently; and had loan failure rates that do not exceed the national or local rates. By relying on the expertise of its best lenders, SBA hoped to reduce its direct involvement in the lending process while continuing to provide service to the small business community.
By giving lenders unilateral authority for loan decisions, the program differs from the two other SBA-guaranteed business loan programs authorized under section 7(a) of the Smal l Business &$-the regular and certified loan programs. For regula&ans, the lender submits a complete loan application package to the local SBA office, which performs the credit analysis and makes the loan decision. Under the certified loan program , the lender performs the credit analysis; however, SBA makes the loan decision. For preferred loans, the lender both performs the credit analysis and makes the loan decision.
Page 3 GMMBCED-@2-124 Small Budneu

B-247422
In making preferred loans, lenders are not restricted by WA’S interest rate ceilings, which apply to the other types of guaranteed loans. Rather, preferred lenders may charge the max imum interest rates allowable under state law. As compensation for the greater authority granted preferred lenders, the agency sets the m&mum guarantee percentage for preferred loans at 30 percent. The maxhnum guarantee percentage is the percentage of the total loan amount for which SBA guarantees the repayment of principal to the lender, not to exceed $760,000. This percentage, which was increased from 76 percent in January 1990, is less than the maxmuun guarantee percentage provided for certified and regular loans, which can range from 86 to 90 percent depending on the loan amount.
Since preferred lenders have greater authority than other SBA lenders, the agency intends their loans to be made to borrowers who are better credit risks than borrowers of either certified or regular loans. Preferred lenders can process loans under all three guaranteed loan programs; however, SBA requires preferred lenders to process at least 40 percent of their SBA-guaranteed loan portfolio as preferred or certified loans.
Private lenders can be certified to participate in the Preferred Lenders Program if they have successfully participated in 8~~‘s certified loan program for at least 1 year. In addition, the lenders must have a low rate of loan faihrres relative to other lenders’ and must have processed at least 40 percent of their SBA-guaranteed loan portfolio as certified loans during the preceding year. Lenders initial certification to participate in the preferred loan program can be for 2 years; after this, certification can be renewed for up to 2 years. (App. I contains more detailed information on how the Preferred Lenders Program works.)
Early Results of the P referred Lenders P rogram
When SBA’S loan programs are measured by the number of loans made, processing efficiency, and loan faihrre rate, early indications are that the Preferred Lenders Program has achieved better results than either the certified or regular loan programs. However, most preferred loans have not reached the age when loans typically fail, which is about 3 years.
In nearly every year since the preferred loan program ’s inception, the number of preferred loans made has increased. In fiscal year 1933, the first year of the program , only 33 preferred loans were made. Since then, the number of loans made has generally increased each year and in fiscal year 1990,2,436 preferred loans, originally approved for $736 m illion, were made. These 1990 figures represent 16 percent of the number and 20
Page 4 GMYBCED-@2-124 Bmdl Budmu
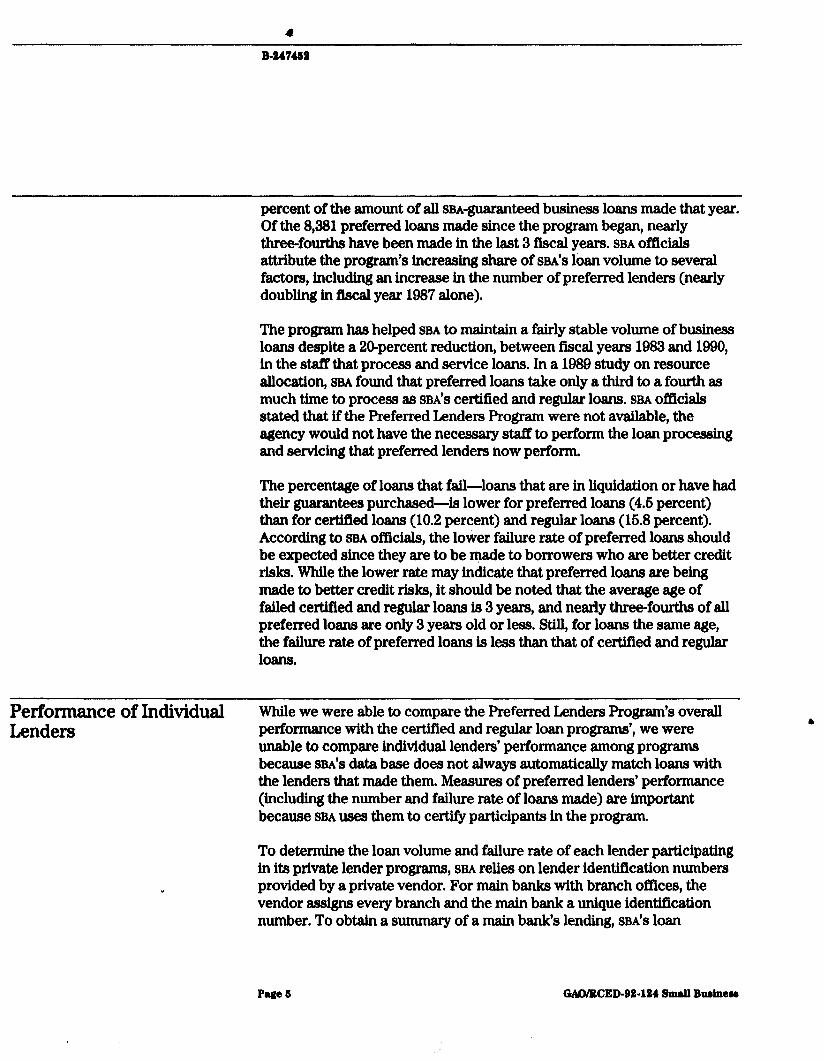
percent of the amount of all ~~~-g~aranteed business loans made that year. Of the 8,381 preferred loans made since the program began, nearly three-fourths have been made in the last 3 ffical years. SBA officials attribute the program’s increasing share of SBA’S loan volume to several factors, including an increase in the number of preferred lenders (nearly doubling in 5cal year 1987 alone).
The program has helped SEW to maintain a fairly stable volume of business loans despite a 20-percent reduction, between 5cal years 1933 and 1990, in the staff that process and service loans. In a 1939 study on resource allocation, SBA found that preferred loans take only a third to a fourth as much time to process as SBA’S certified and regular loans. SEW officials stated that if the Preferred Lenders Program were not available, the agency would not have the necessary staff to perform the loan processing and servicing that preferred lenders now perform.
The percentage of loans that fail-loans that are in liquidation or have had their guarantees purchased-is lower for preferred loans (4.6 percent) than for certified loans (10.2 percent) and regular loans (16.8 percent). According to SBA officials, the lower failure rate of preferred loans should be expected since they are to be made to borrowers who are better credit risks. While the lower rate may indicate that preferred loans are being made to better credit risks, it should be noted that the average age of failed certified and regular loans is 3 years, and nearly three-fourths of all preferred loans are only 3 years old or less. Still, for loans the same age, the failure rate of preferred loans is less than that of certified and regular loans.
Performance of Individual While we were able to compare the Preferred Lenders Program’s overall Lenders performance with the certified and regular loan programs’, we were 8
unable to compare individual lenders’ performance among programs because SBA’S data base does not always automatically match loans with the lenders that made them. Measures of preferred lenders’ performance (including the number and failure rate of loans made) are important because SBA uses them to certify participants in the program.
To determine the loan volume and failure rate of each lender participating in its private lender programs, SBA relies on lender identification numbers provided by a private vendor. For main banks with branch offices, the vendor assigns every branch and the main bank a unique identification number. To obtain a summary of a main bank’s lending, SBA’S loan
PM8 6 GACVECED-92.124 Smdl Bwiner

B-247462
accounting system combines information on all of the branches’ loans and adds it to the information on the main bank’s loans. However, SBA’S loan accounting system does not always automatically link loans made by branch banks with those made by the main bank. This problem is generally associated with the use of temporary identification numbers.
When the loan activity of a branch is not linked with that of its main bank, any lending that originates from the branch bank is not accounted for in the measures of the main bank’s performance. Thus, for regular loans, the main bank’s loan volume will be understated and the failure rate will be inaccurate. (See app. II for more details on the results of the Preferred Lenders Program.)
Characteristics of P referred Lmns
Preferred loans tend to be larger in dollar amount than certified or regular loans, but preferred loans have interest rates similar to those of the other SBA-guaranteed loans. Specifically, in our review, for all three programs, fured-rate loans carried an average interest rate of 12 percent, and the majority of variable-rate loans carried rates of 2.6 percent or less above the prime rate. (Though we would have liked to analyze the effect that the term of loans has had on the interest rates charged, we were unable to because of problems with SBA’S data) Preferred loans are more often made at the max imum guarantee percentage than are other SBA-guaranteed loans. Most borrowers of preferred loans are corporations, existing businesses, and are in the retail and service industries. Finally, in a judgmental sample of preferred loans, SBA'S OIG found that all or part of the proceeds of most of the loans were used by the borrower to repay debt.
Preferred Loans Are Larger Preferred loans are usually larger in dollar amount than certified and Than Other Loans regular loans. Between fLscal years 1933 and 1990, the average size of e
preferred loans was $273,000, compared with $192,000 for certified loans and $182,000 for regular loans. While 41 percent of all preferred loans were for $260,000 or more, only 26 and 24 percent of the certified and regular loans, respectively, were for that amount. Conversely, only 20 percent of the preferred loans were for less than $100,000, though 36 percent of the certified loans and 40 percent of the regular loans were for that amount. The average size of preferred loans has increased 24 percent in the last 2 fiscal years, after SBA raised the max imum guarantee amount from $600,000 to $760,000 for all three programs. During the same period, the average size of certified and regular loans increased by 3 percent and 16 percent, respectively.
Page6 GAO/WED-@2-124SmdlBudneu
B-247422
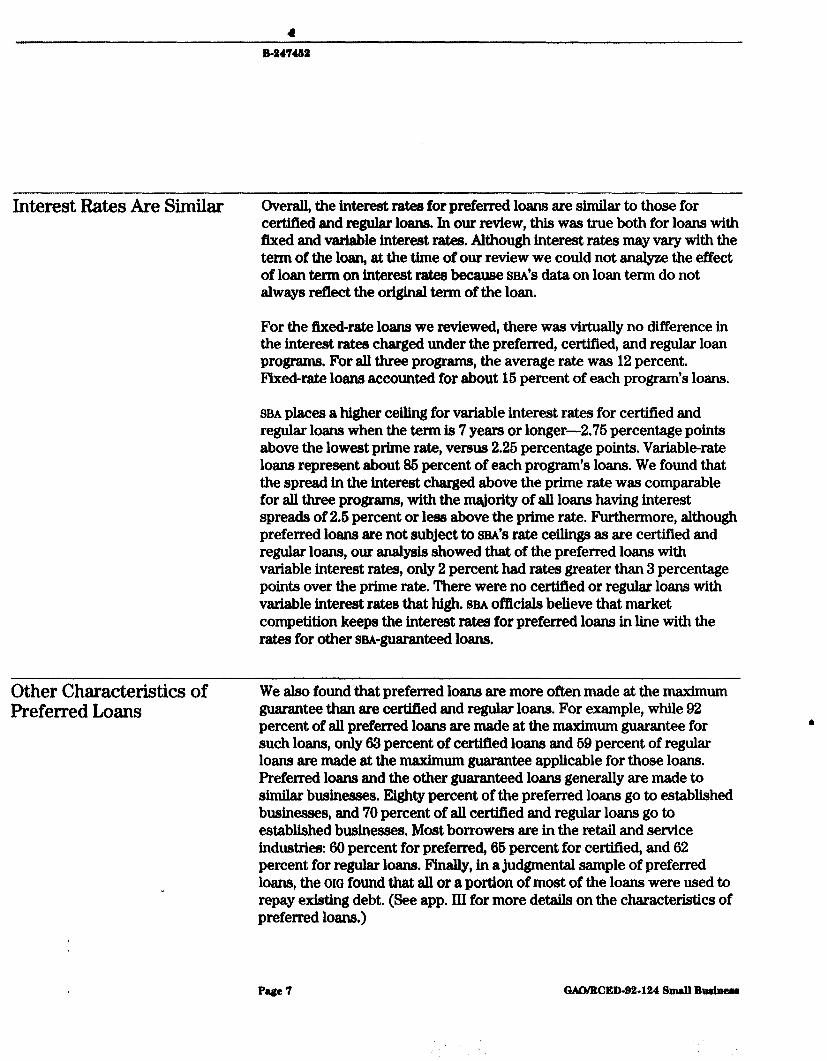
Interest Rates Are Similar Overall, the interest ratea for preferred loans are similar to those for certified and regular loans. In our review, this was true both for loans with fixed and variable interest rates. Although interest rates may vary with the term of the loan, at the time of our review we could not analyze the effect of loan term on interest rates because SBA’S data on loan term do not always reflect the original term of the loan.
For the fixed-rate loans we reviewed, there was virtually no difference in the interest ratea charged under the preferred, certified, and regular loan programs. For all three programs, the average rate was 12 percent. Fixed-rate loans accounted for about 16 percent of each program ’s loans.
SBA places a higher ceiling for variable interest rates for certified and regular loans when the term is 7 years or longer-2.76 percentage points above the lowest prime rate, versus 2.26 percentage points. Variable-rate loans represent about 36 percent of each program ’s loans. We found that the spread in the interest charged above the prime rate was comparable for all three programs, with the mqjority of all loans having interest spreads of 2.6 percent or less above the prime rate. Furthermore, although preferred loans are not subject to SBA’S rate ceilings as are certified and regular loans, our analysis showed that of the preferred loans with variable interest rates, only 2 percent had rates greater than 3 percentage points over the prime rate. There were no certified or regular loans with variable interest rates that high. SBA officials believe that market competition keeps the interest rates for preferred loans in line with the rates for other su-guaranteed loans.
Other Characteristics of Preferred Loans
We also found that preferred loans are more often made at the n&mum guarantee than are certified and regular loans. For example, while 92 percent of all preferred loans are made at the max imum guarantee for such loans, only 63 percent of certified loans and 69 percent of regular loans are made at the max imum guarantee applicable for those loans. Preferred loans and the other guaranteed loans generally are made to similar businesses. Eighty percent of the preferred loans go to established businesses, and 70 percent of ail certified and regular loans go to established businesses. Most borrowen are in the retail and service industries: 60 percent for preferred, 66 percent for certified, and 62 percent for regular loans. Finally, in a judgmental sample of preferred loans, the OIG found that all or a portion of most of the loans were used to repay existing debt. (See app. III for more details on the characteristics of preferred loans.)
Page 7 GAO/WED-92.124 Small Bualnem
,’

B-247452
Geographic D istribution of Preferred Loans
Lending under the preferred loan program is concentrated geographically. Preferred lenders are most active in three geographic areas, the states of California and Vermont and, together, the cities of Philadelphia and Newark. In contrast, many central and southeastern states had little or no lending under the program. For example, in fBcal year 1990, only eight preferred loans were made in the states of Alabama, Arkansas, Kansas, Louisiana, New Mexico, and Oklahoma.
Lending under the preferred loan program is also concentrated in relatively few SBA districts. For example, in fiscal year 1990,lO of SBA’S 85 district and branch ofYices accounted for 61 percent of all preferred loans made. Conversely, in fiscal year 1990,27 district offices had no preferred loans, and 11 district of&es had three or fewer.
SBA officials cited many reasons for the concentration of preferred lending. The number of preferred lenders in a given area, competition among these lenders, the proximity of preferred lenders to borrowers, the regional economies effect on the demand for loans, and the degree of support for the program by SBA regional and district offices were among the factors the officials cited. (See app. IV for more details on the geographic distribution of lending.)
Preferred Lenders’ Compliance W ith SBA’s Regulations
In fiscal years 1989 and 1990, SBA’S OIG audited the preferred loan program. Visiting five preferred lenders located in four SBA districts, the OIG found that these lenders did not always comply with program regulations and that SBA’S monitoring could be more effective. Most incidents of noncompliance involved loan making-m particular, the unexplained or unclear use of loan proceeds and inadequate collateral to secure the loan. SBA'S Office of Financial Assistance has reported similar f’mdings in its reviews of loan applications and field reviews of preferred lenders. Also, 4 SBA’S 1990 Federal Managers’ Financial Integrity Act report includes as a material weakness the agency’s oversight of preferred lenders. Specifically, the report states that oversight of preferred lenders should be increased to be commensurate with the increased loan volume and that incorrect computer data compound the problem.
SBA district office officials overseeing the lenders reviewed by the OIG did not always agree with the 016’s findings. While each office agreed to take corrective action where appropriate, several strongly took exception to certain findings. In particular, these offices disagreed most with the OIG’S findings that sBA had an inferior lien position, alternative sources of
PmgeB GAWRCED-@2-124sdB1uineu

B-247422
financing were, not considered, and a lack of assurance existed that lenders took corrective action. The OIG maintains that the problems it has identified are valid and issued a report in September 1991 in which it recommended that sag take several steps to improve controls over and procedures for the preferred loan program , including following up on the corrective actions of lenders. (See app. V for more details on evaluations of the program .)
Conclusion& The Preferred Lenders Program was created to improve service to small businesses without increasing SBA’S involvement. Early indicators show that this program has had favorable results in terms of the number of preferred loans made, the efficiency with which these loans are processed, and the rate at which these loans fail. The efficiency with which SBA may process preferred loans, in part, has allowed the agency to maintain the number of general business loans it guaranteed during a period of declining staff levels. At the same time, failure rates for preferred loans compare favorably with those for regular and certified loans. However, most preferred loans have not reached the age when loans typically fail, and the OIG has found that some preferred lenders are not complying with SBA’S rules and regulations for making preferred loans.
Because SBA has not identified all loans with temporary lender identification numbem and its loan accounting system data base cannot automatically link temporary and permanent identification numbers, SBA cannotautomatical lycompile data ontheamount oflendingbyandloan failures for individual lenders. SBA offickd~ said that while they can obtain accurate failure rates by manually compil ing each preferred and certified lender’s guaranteed loan portfolio, they cannot do so for regular loans because of the high volume of regular loans. W ith the increasing volume of preferred loans, manually compil ing data for preferred lenders will become increasingly burdensome.
Recommendat ion Because of the increasing volume of preferred loans and to ensure that SBA is aware of the performance of all lenders, we recommend that the SBA Administrator require the Assistant Administrator for Information Resources Management and for Financial Assistance to
. develop an automated process capable of compil ing loan data on individual lenders and ensure that monitoring staff use this information when reviewing lender’s performance and renewing lenders’ certification.
Pae 9 GAO/WED-@2-124Smdl Budneu

4 B-247422
Agency Comments We discussed the findings, conclusions, and recommendation presented in this report with officials of SBA’S Office of Financial Assistance and incorporated their comments where appropriate. These officials agreed with our recommendation to develop an automated method to link all loans with their respective lenders. As agreed with your office, we did not obtain written agency comments on this report.
Our review was conducted between September 1990 and October 1991 in accordance with generally accepted government auditing standards. To obtain information on the number, failure rates, and characteristics of preferred, certified, and regular loans, we used SBA'S loan accounting system data base of all guaranteed loans approved during fiscal years 1983 through 1990. To obtain information on preferred lenders’ compliance with program regulations, we relied on reports issued during 1999 and 1991 by SBA’S OIG, and we reviewed agency memorandums summarizing the results of field of&es monitoring visits to lenders.
We interviewed SBA headquarters and district office officials to learn about the operation of the preferred loan program and reviewed SBA’S policies and procedures for guaranteed loans. We also reviewed the results of SBA’S fmcal year 1989 and 1999 Federal Managers’ Financial Integrity Act reports on internal controls. To assess the reliability of data contained in the data base, we drew a random sample of loans made in two SBA district offices and an SBA service center and compared the information in the data base with that in the loan applications. (See app. VIII for a more detailed description of our scope and methodology.)
The fields in SBA’S loan data base that contain data on fixed and variable interest rates were not reliable for one of three offices tested. In addition, because of a high rate of error for data on loan term , we were unable to 1) assess the effect loan term has on the interest rates charged. Also, because 10 of SBA’S 86 district offices incorrectly input interest rate data into SBA’S data base on loans, our analysis excluded data from these districts (Wilmington, Delaware; Atlanta, Georgia; Boston, Massachusetts; Springfield, Massachuset@ St. Louis, M issouri; Las Vegas, Nevada; Concord, New Hampshire; Columbus, Ohio; Nashville, Tennessee; and Salt Lake City, Utah). Loans made in these districts represented 10,17, and 11 percent of all preferred, certified, and regular loans, respectively, made between fiscal years 1983 and 1990. However, because other data fields we tested showed few or no errors, we believe SBA’S data base is reliable
Pwe 10 GAO/WED-@2-124SmdlBudneas

1 B-247452
overall. (See app. IX for more information on our assessment of the reliability of SBA’S data.)
As agreed with your office, unless you publicly announce its contents earlier, we plan no further distribution of this report until 30 days after the date of this letter. At that time, we will provide copies to the Senate Smal l Business Committee, the Administrator of SBA, the Director of the Office of Management and Budget, and other interested parties. We will make copies available to others upon request.
This work was performed under the direction of Judy A EnglandJoseph, Director, Housing and Community Development Issues, who may be reached at (202) 276-6626. Major contributors to this report are listed in appendix X.
V J. Dexter Peach Assistant Comptroller General
Page 11 GAO/WED-@2-124 SmaB Budner
Contents
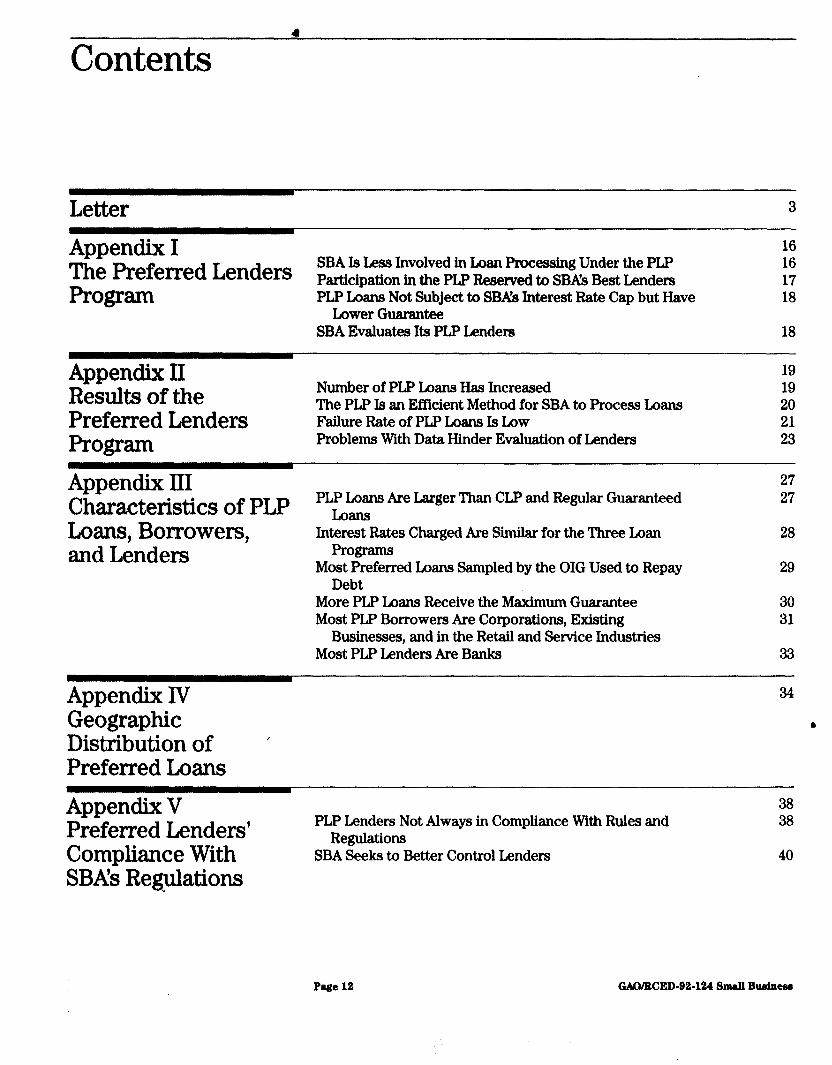
Letter 3
Appendix I 16
The Preferred Lenders SBA Is Less Involved in Loan Processing Under the PLP 16 17
Program Participation in the PLP Reserved to SBXs Best Lenders PLP Loans Not Subject to SBAls Interest Rate Cap but Have 18
Lower Guarantee SBA Evaluates Its PLP Lenders 18
Appendix II Results of the Preferred Lenders
Number of PLP Loans Has Increased The PLP Is an Efficient Method for SBA to Process Loans Failure Rate of PLP Loans Is Low
19 19 20 21
Program Appendix III
Problems With Data Hinder Evaluation of Lenders 23
27
Characteristics of PLP PLP Loans Are Larger Than CLP and Regular Guaranteed 27 Loans Loans, Borrowers, Interest Rates Charged Are Simihr for the Three Loan 28 and Lenders prOgl%llU3
Most Preferred Loans Sampled by the OIG Used to Repay 29 Debt
Appendix IV Geographic Distribution of ’ Preferred Loans
More PLP Loans Receive the Maximum Guarantee Most PLP Borrowers Are Corporations, Existing
Businesses, and in the Retail and Service Industries Most PLP Lenders Are Banks
30 31
33
34 6
Appendix V Preferred Lenders’ Compliance With
PLP Lenders Not Always in Compliance With Rules and Regulations
SBA Seeks to Better Control Lenders
38 38
40 SBA!; Regulations
Page 12 GMMRCED-92-124 Small Budnew
Appendix VI Data Supporting Figures in the Text A~$3ndix VII Summary of PLP Lenders, by State Appendix VIII Objectives, Scope, and Methodology Appendix IX The Reliability of SBKs Loan Data Base
49
AppendixX 63 Major Contributors to This Report Tables Table II. 1: Number and Dollar Amount of Approved 20
SBA-Gum-anteed Loans Table 11.2: Failure Rates of Disbursed PLP, CLP, and
Regular Loans, Fiscal Years 1988 Through 1990 Table II.3 Lending by Three Main Bank and Their
Branches
21
26 6
Table III.1: Distribution of PIP, CLP, and Regular Loans, by Amount, Fiscal Years 1988 Through 1990
Table III.2: Distribution of Variable Interest Rates for PLP, CLP, and Regular Loans, Fiscal Years 1988 Through 1990
Table III.8 Use of Loan Proceeds Table III.4 PIP, CLP, and Regular Loans Made at and
Below the Maximum Guarantee, Fiscal Years 1988 Through 1990
27
28
80 80
Table lV.1: Distribution of Approved PIP Loans, by SBA District Office, Fiscal Year 1990
84
Page 18 QADIILCED-92-124 Bmdl Buaiuemm

Table V.l: Summary of Findings by SBA’s OIQ Table VI.1: Failure Rates Calculated Using the Number of
Disbursed PLP, CLP, and Regular Loans, by Age of Loan Table VI.2: Failure Rates Calculated Using the Dollar
Amount of Disbursed PLP, CLP, and Regular Loans, by Age of Loan
Table VI.3: Organizational Types of PIP, CLP, and Regular Borrowers, Fiscal Years 1933 Through 1990
Table VI.4: Distribution of Loans Made to New and Existing Businesses, Fiscal Years 1933 Through 1990
Table VI.6: Distribution of PLP, CLP, and Regular Loans, by Industry of Borrower, Fiscal Years 1933 Through 1990
Table VI.& Geographic Distribution of PLP Loans, Fiscal Years 1933 Through 1990
Table VI.7: Geographic Distribution of PLP Loans by Dollar Amount Loaned, Fiscal Years 1933 Through 1990
Table 1X.1: Accuracy of SBA’s Data on Loan Applications Table 1X.2: Estimated Errors in Various SBA Loan
Application Fields and the OS-Percent Confidence Intervals
Figures Figure II.1: Failure Rates Calculated Using the Number of Disbursed PIP, CLP, and Regular Loans, by Age of Loan
Figure II.2: Failure Rates Calculated Using the Dollar Amount of Disbursed PLP, CLP, and Regular Loans, by Age of Loan
Figure III.1: Organizational ‘Ijpes of PLP, CLP, and Regular Borrowers, Fiscal Years 1933 Through 1990
Ngure III.2: Distribution of Loans Made to New and Existing Businesses, F’iscal Years 1983 Through 1990
Ngure III.3 Distribution of PIP, CLP, and Regular Loans, by Industry of Borrower, Fiscal Years 1933 Through 1990
Ngure IV.l: Geographic Distribution of PLP Loans, Fiscal Years 1933 Through 1990
Ngure lV.2: Geographic Distribution of PLP Loans, by Dollar Amount Loaned, Fiscal Years 1933 Through 1990
s 42
42
42
42
42
43
44
60 61
-
22
23
31
32
33 6
36
36
Ptgt 14 CMMBCED-92.124 Small Budntn

Abbreviations
BIDCO Business and Industrial Development Company CLFJ Certified Lenders Program GAO General Accounting Office OIG Office of Inspector General PLP Preferred Lenders Program SBA Small Business Administration SBLC Small Business Lending Company
Page16 GMVRCED-92-124Smal lBudneu

Appendix1 4
The Preferred Lenders Program
The Small Business Administration (SBA) created the Preferred Lenders Program (PLP) in 1933 in an effort to reduce processing time for loans made to the small business community. The PLP allows SEM to designate its private lenders as “preferred,” delegating to them most loan-making decisions and-by not involving itself with the application and servicing~treamlining the delivery of financial assistance.
The PLP did not replace SBA'S other two programs that guarantee business loans, the Certified Lenders Program (CIP) and the regular loan program, but instead utilizes more fully the expertise of SBA’S best lenders. Since the PLP’S inception, the number of preferred lenders has increased from 19 in 1933 to nearly 160 in 1990. In 1990, PLP loans accounted for about 16 percent of SBA'S general business loans.
SBA Is Less Involved Three programs for processing slEu-guaranteed general business loans are
in Loan Processing Under the PLP
available to lenders. The regular program, SBA'S original program for guaranteeing loans, has been utilized by over 12,000 private lenders. Many of these lenders, however, are relatively inactive participants in SBA'S loan programs. Under the regular program, the lender submits a complete loan application package to its local SBA office. SBA analyzes the application and aims to provide the lender with a loan approval decision in about 20 calendar days. Regular loans made up about 60 percent of SBA’S general business loans in 1990.
For the CLP, SBA relies more upon its 640 participating lenders, which have been screened for admission into the program. The CLP lender performs the credit analysis, but SBA retains the authority to approve loans. SBA endeavors to review and process the loan package within 3 days. In 1990, CIP loans accounted for about 26 percent of the general business loans SBA processed.
.
The PLP is composed of an even more select group of lenders. The nearly 160 institutions that participate in the program are SBA'S best lending partners, entrusted with full authority to analyze the loan application and borrower’s creditworthiness; to close and service the loan; and even, if necessary, to liquidate it. While no firm criteria have been established to define when PLP loans should be made, they are generally intended for the most creditworthy clients, who are considered very able and likely to repay the loans. To ensure that PLP loans are reserved for the strongest borrowers, if a loan’s circumstances appear ambiguous or unusual, SFM
PtgtM QACUBCED-92-124 SmdlButineu

encourages its preferred lenden to submit the loan under the CLP or the regular loan program rather than the PLp.
Participation in the Because of the responsibility entrusted to preferred lenders, participation ’ PLP Reserved to SBA’s in the PLP is reserved for SBA’S best lenders. To be accepted into the
program, a lender must have successfully participated in the agency’s CLP Best Lenders for at least 1 year and have processed at least 40 percent of its overall
portfolio of sru-guaranteed loans under the CLP in the preceding year. The lender must also have a history of submitting to SBA complete, accurate, and adequately analyxed loan-guarantee applications, and the lender must have demonstrated the ability to process, close, service, and liquidate loans efficiently.
In addition to having to meet these criteria, PLP lenders may not have a loan faihrre rate that exceeds the national or local rates. Intangibles such as having a good rapport with the local SBA office are also considered.
SBA’S Assistant Administrator for Financial Assistance is responsible for designating lenders ss “preferred,” on the basis of recommendations made by the SBA branch or district office and the responsible SBA regional office. This designation may be conferred initially for up to 2 years and thereafter renewed for 1 or 2 years at the discretion of the Regional Administrator. Once admitted to the program, a preferred lender is expected to process at least 40 percent of its srul-guaranteed business loans through the PLP and/or the CLP; lesser participation in the programs could be cause for nonrenewal.
Lenders that have unacceptably high failure rates or low loan volumes or that fail to comply with applicable statutes, regulations, or policies may be suspended or removed from the PLP. These lenders do, however, retain the right to appeal SBA’S decision. Since the program’s start, 61 preferred lenders have lost their certification. Most terminations (44) have been owing to lenders’ disinterest, as evidenced by low loan volumes or inactivity. Other causes have been noncompliance (l), high loan failure rates (2), takeovers by the Federal Deposit Insurance Corporation (6), mergers (3), or other ressons (6).
Page17 GMMWED-92-124SmaUBusinere
PLP Loans Not To compensate preferred lenders for their added responsibility, SBA allows
Subject to SBA’s them to charge borrowers the maximum interest rate allowable under the prevailing state law. For certifkd and regular loans, SBA limits the
Interest Rate Cap but maximum interest rates lenders may charge. To compensate SBA for the
Have Lower greater authority it granti preferred lenders, it sets the maximum
Guarantee guarsntee percentage for preferred loans at 80 percent. This percentage, which was increased from 76 percent in January 1090, is less than the maximum guarantee percentage provided for certified and regular loans, which can range from 86 to 00 percent depending on the loan amount. The lower maximum guarantee percentage helps SBA ensure that participating lenders use the PLP for borrowers with the strongest credits.
SBA Evaluates Its PLP PIP lenders are subject to a twopart Lender Evaluation Program. The first
Lenders part consists of regular evaluations called periodic lender field reviews. These reviews, which generally involve l-day visits to a preferred lender, are conducted by a team of local SBA staff on a quarterly basis for firstyear PU? lenders, and at least annually for all other PLP lenders. During these visits, SBA staff randomly sample loans that have been approved, serviced, and liquidated under the program’s procedures to verify the completeness of the loan files, As part of the reviews, SBA staff are responsible for documenting Andings, dkussing them with the lender, and developing plans for any needed corrections. According to S&A, these reviews are not intended to be adversarial proceedings; rather, they are to be fact-finding visits, designed to promote the lender’s understanding of the PLP and strengthen the partnership between SBA and the lender.
The second part of the Lender Evaluation Program is the PIP Early Warning Review, under which the local SBA office reviews all PLP loan applications. The lender forwards the loan application and its own credit analysis with any attachments to the local sr3A office. The purpose of this review is to identify any problems with the borrower’s eligibility so that SBA can address them before the loan is disbursed.
The Pw is jointly admi&teredby ~~~'~di~t~id,~gio~-d, and central offices. The Financial Institutions Branch of the Offlce of Financial Assistance is responsible for an@zing lenders that district offices nominate for particip&on, monitoring lenders’ performance, evaluating program results, and setting policy. This office also acts as the liaison among lenders, field staff, and the central office staff.
Page18 GMIRCED-92-124SnullBudntu

Appendix II
Results of the Prkferred Lenders Program
When SW’S loan programs are measured by the number of loans made, processing efficiency, and loan failure rate, early indications are that the PLP has had better results than either the CI.P or regular loan program. Since fiscal year 1983, both the number and dollar amount of PLP loans have increased nearly every year. At the same time, the program’s processing efficiency has helped SBA handle its work load despite a 20-percent reduction in staff. The failure rate for PLP loans, 4.6 percent, is less than half the failure rate for certified and regular loans; this difference should be expected since preferred loans are intended for borrowers with stronger credit. However, when calculated using the dollar amount, the failure rate of PLP loans is about two-thirds that of U.,P and regular loans, because, on average, PLP loans that have failed are larger than those that have not. While SJM officials informed us that, on the whole, loan data for each program are accurate, they pointed out that the data on individual lenders is not always reliable because of SBA’S inability to automatically link all loans with individual lenders. As a result, we could not compare the performance of individual PLP lenders and other lenders.
Number of PLP Loans In all but 1 year since fwcal year 1983, the number of preferred loans made
Has Increased has surpassed the number made the previous year. During this same time, the combined number of CLP and regular loans made has decreased by 10 percent. As shown in table II. 1, the increase in the number of PLP loans began slowly, and nearly three-fourths of the 8,381 PLP loans made during fiscal years 1983 through 1990 have been made in the last 3 fiscal years. PLP loans account for an increasing share of SBA-guaranteed general business loans. In fiscal year 1990, PLFJ loans accounted for 16 percent of the number and 20 percent of the dollar value of all sw-guaranteed general business loans.
P8gt 19 GMUBCED-92-124 Snull Budner

&&I@- II l&mltio?thaPrtferrtdLtnde~Pro2run
Tablo II.1 : Numbar and Dollar Amount of Approved SBAQuarantwd Loan. Dollars in millions
Loana. bv wooram
Flacal war
PLP CLP Regular All Dollar Dollar Dollar Dollar
Number amount Number amount Numlxw amount Numbar amount 1983 83 $23.7 2,904 $441.3 12,389 $2,004.8 15,385 $2,469.8
1984 285 77.5 4,281 722.8 12,379 2,103.l 16,945 2,903.4 1985 282 79.5 4,255 768.0 10,896 1,877.3 15,433 2,724-a 1986 664 173.6 4.141 753.6 9.399 1636.0 14.204 2.563.2 1987 976 254.1 31950 783.3 9,604 1,726.4 14,530 2,763.8 1988 1,639 400.0 4,250 894.6 9,095 1,710.l 14,984 3,004.7
1989 2,017 541.0 3,837 835.8 8,264 1.680.8 14,118 3,057.6 1990 2,435 736.0 4,031 876.5 9,728 2,114.5 16,194 3,727.0
Total 8,381 $2,285.4 31,649 $6,07a.e 81,753 $14,853.0 121,793 $23,214.3
SBA offkials attribute the growth in the number of preferred loans to several conditions: (1) lenders’ increased confidence in making PIP loans as these lenders have gotten several years of operating experience; (2) an increase in the number of preferred lenders from 19 in fiscal year 1933 to about 169 in fiscal year 1990, and (3) a September 1933 increase in the maximum guarantee amount for SBA-guaranteed loans, from $6OO,ooO to $769,000. Though S&A increased the guarantee percentage for PLP loans from 76 percent to 80 percent in January 1999, it is too early to tell what effect this change could have on the program.
ThePLPIsan In a February 1989 study on the allocation of human resources in SBA field
Efficient Method for offices, the agency measured the time required to complete processing 6 tasks for PLP, CW, and regular guaranteed loans. On the basis of estimates
SBA to Process Loans from field offkes, SBA determined that loan processing under the PLP was the most efficient means by which the agency processes loans, taking only one-third and one-quarter the time of processing cw and regular loans, respectively. According to an SBA official, the gains in efficiency resulting from the PIP most benefit those S&A offices with the highest loan volumes.
While the number of all guaranteed loans has remained fairly stable since fLscal year 1933, the number of staff engaged in SBA'S financial and investment activities, including section 7(a) loan programs, has declined. Specifically, between 1933 and 1990, Finance and Investment staffing
Page20 GACVBCED-92.124SmtJlButintr

decreased 20 percent, from 1,614 to 1,212 personnel, owing to stsffing cuts mandated by the Of&e of Management and Budget.’ During the same period, however, SBA’S overall number of guaranteed loans decreased by only 8 percent. While SBA officials said they do not know if the PLP alone has allowed the agency to cope with staff reductions, they pointed out that should the program end, SBA would not have staff to perform the tasks that PLP lenders now do.
Failure Rate of PLP Loans Is Low
The failure rate of PLP loans is lower than those of SW’S other guaranteed loans. SBA deties failure rate as the number of loans in liquidation plus the number of loan guarantees purchased, divided by the number of loans disbursed. As shown in table II.2, fewer than 5 percent of all PLP loans disbursed between fiscal years 1983 and 1990 have failed. This failure rate is less than half that for SBA’S CLP loans and only one-third that for SBA’S regular loans. However, calculated using the dollar amount of failed loans rather than their number, the failure rate for PLp loans is closer to those for cm and regular loans.
Table 11.2: Faiiun Ratoo of Dioburud PLP, CLP, and Roguirr Loan& Fi8cai Yoarc, W82 Through 1990 Total amount Amount of failed
Faiiun rata ioanod (doiiarr in ioanr (dollar8 in bn ty~ Total loans Failed ioano (Pwcent) miliionr) miiiion8) PLP 7,748 352 4.5 $2,076 $172
Faiiuro rata of amount loaned
(percent) 8.3
CLP
Regular
28,543
75,976
2,911 10.2 5,423 566
12,004 15.8 13,184 1,879 Note: Failures include loans in liquidation and loan guarantees purchased.
10.4
14.3
According to SBA officials, the PIP’S comparatively lower failure rate is expected since preferred loans are intended for borrowers with better credit+those that have a high probability of repaying the loan. Additionally, SBA instructa FW lenders to submit risky or complicated loans under CLP or the regular loan program so that the agency can become more involved in making loan decisions.
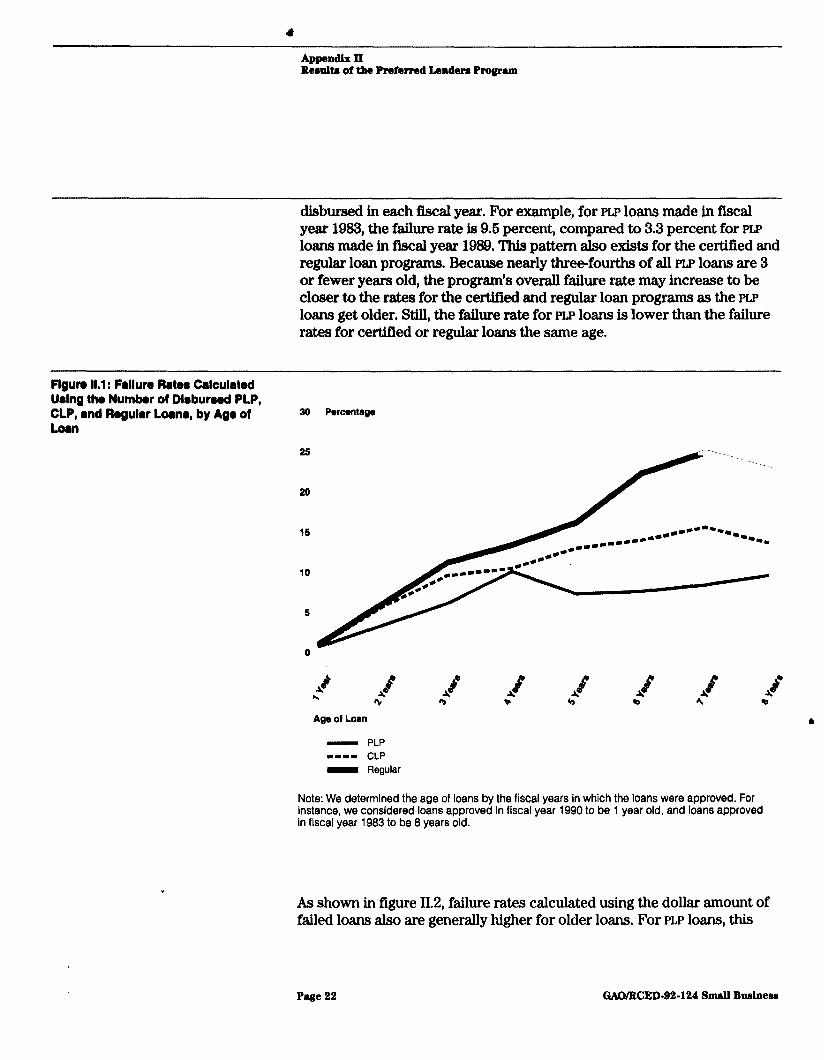
While PIP loans currently have a lower overall fai$re rate than cw and regular loans, the PLP’S failure rate may increase. As shown in figure II.1, loans that have been outstanding for a longer period of time have a higher failure rate than loans disbursed more recently. This trend becomes apparent when failure rates are computed separately for the loans
‘F’igurea represent full-timeequivalent employeea and exclude Disaster Aseietonce staff.
P-t! 21 &WINED-@2-124 Snmll B&new
ltemlte of the Preferred Laden Program
disbursed in each fiscal year. For example, for PLP loans made in fiscal year 1983, the failure rate is 9.5 percent, compared to 3.3 percent for PW loans made in fiscal year 1989. This pattern also exists for the certified and regular loan programs. Because nearly three-fourths of all PLP loans are 3 or fewer years old, the program ’s overall failure rate may increase to be closer to the rates for the cetied and regular loan programs as the PW loans get older. Still, the failure rate for PLP loans is lower than the failure rates for certified or regular loans the same age.
Figun 11.1: Faiiuro Rate@ Calculated Wng th8 Numkr of Dirburaod PLP, CLP, and Roguiar Loan,, by Ag8 of 20 Percantago
25
20
15
Age of Loan
- PLP -1-1 CLP - Regular
Note: We determined the age of loans by the fiscal years in which the loans were approved. For instance, we considered loans approved in fiscal year 1990 to be 1 year old, and loans approved in fiscal year 1983 to be 8 years old.
As shown in figure 11.2, failure rates calculated using the dollar amount of failed loans also are generally higher for older loans. For PLP loans, this
Page 22 GAO/WED-92-124 Small Busineaa
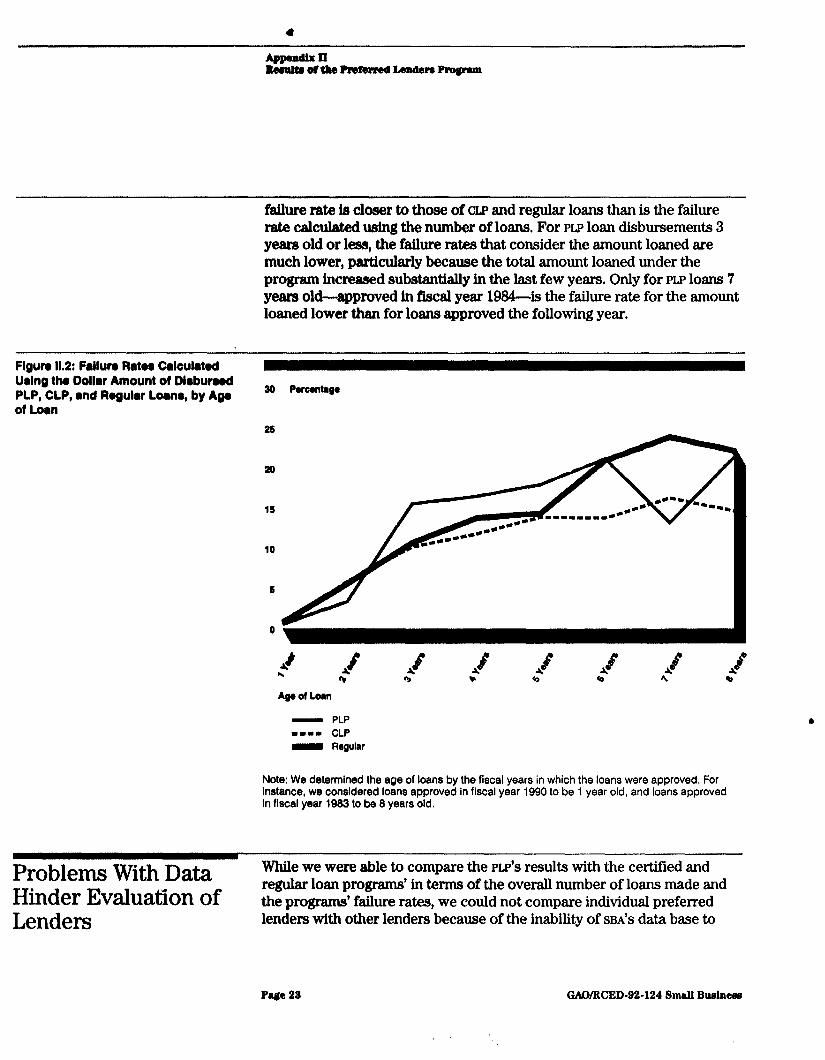
failure rate is closer to those of CLP and regular loans than is the failure rate cakulated using the number of loans. For PW loan disbursements 3 years old or less, the failure rates that consider the amount loaned are much lower, particularly because the total amount loaned under the program increased substantially in the last few years. Only for PLP loans 7 years old--approved in fiscal year 19344s the failure rate for the amount loaned lower than for loans approved the following year.
Figun 11.2: Failun Rat88 C8iCUiaWd Ming tha Dollar Amount of Diaburaed PLP, CLP, 8nd Roguiar Loan& by Ago of Loan
so Porcontsgo
- PLP -1-1 CLP B Regular
Note: We determined the age of loans by the fiscal years in which the loans were approved. For Instance, we considered loans approved In fiscal year 1990 to be 1 year old, and loans approved In fiscal year 1983 to be 8 years old.
Problems W ith Data While we were able to compare the PLP’S results with the certified and
Hinder Evaluation of regular loan programs’ in terms of the overall number of loans made and the programs’ failure rates, we could not compare individual preferred
Lenders lenders with other lenders because of the inability of SBA’S data base to
P-e 22 GAWRCED-92-124 Sd Budnew
automatically match all loans with the appropriate lenders. SEW officials stated that while they manually perform this task for the affected PLP and CLP loans, they do not do so for regular loans because of their high loan volume. These officials acknowledge that, until corrected, automated data on the performance of individual regular lenders ss reported in SBA’S management reports can be erroneous.
SBA assigns each lender participating in its guaranteed loan programs an identification number provided by a private vendor. These seven digit alphanumeric identifIera are contained in a reference manual supplied by the vendor to each SBA field office. The manual, consisting of separate volumes for each state, lists the address of each lender within the state and the lender’s corresponding identification number. SBA requires that an identification number be affixed to each loan before the loan can be entered into the agency’s data base so that the identification number can be used to compile information on each lender’s loans.
SBA officisls said the majority of the problems with the data result from the system’s inability to automatically link loans with a lender when the lender has different addresses, such as when a main bank has branch locations. The problems are generally associated with the use of temporary identification numbem. Under WA’S system for identifying lenders, temporary identification numbers are assigned to lenders that are not already listed in the reference manuals. These numbers are only to be used until a permanent identification number is assigned by the vendor, a process that should take about 3 months, according to SBA officials. Until a permanent number is assigned, SBA’S data system cannot automatically link the temporary identification number of a location, such as a branch office, to the permanent identification number assigned to the main bank. According to SBA ofIicials, in December 1991 their automated file of identification numbers contained 2,762 temporary identification numbers. l
SBA plans to delete 2,206 of these numbers because they have shown no activity and to determine why the remaining 466 temporary identification numbers have not been replaced with permanent numbers.
The examples in table II.3 illustrate how the number of loans a main bank makes and its failure rate can change when loans made by branch offices are properly accounted for. The examples represent actual cases in which SBA corrected the identification numbers for loans of branch offices.
Page 24 GMMBCED-82124 Small Budner

Tablo 11.3: kndlna by Thrn Main Bank8 and Tholr Bmnchor
Lendor
Failure rata Dlrburud loan@ Falled loan8 Porcont of Percent of
Numkr Amount Number Amount numbar amount Londor 1 Main 1,357 $172,612,993 197 $18,627,033 14.5 10.7
Branch 1 68 7,916,013 60 4,428,861 88.2 55.9
Branch 2 Combined Lander 2
12 1,510,136 12 1,369,229 100.0 90.6 1,437 $182,039,142 269 $24,425,123 18.7 13.4
Maln 208 $33,979,087 37 $4.357.751 17.7 12.8 Branch 1 13 2,300,710 10 1,410,749 76.9 61.3
Branch 2 29 4,301,620 23 2,517,153 79.3 58.5 Combined 250 $40,581,417 70 $8,285.653 28.0 20.4
kndor 3 Main 394 $52,996,794 98 $9,700,196 24.8 18.3
Branch 1 41 6,020,039 0 0 00.0 00.0 Combined 435 $59.016.833 98 $9.700.196 22.5 16.4
For the examples above, SBA'S management reports on the lending by individual lenders did not include the branches’ loans in the main bank’s statistics because the temporary identification numbers for the branch banks identified them as separate financial institutions. As a result, lender l’s number of loans and failure rate were understated by 80 loans and 4 percentage points (14.6 percent versus 18.7 percent). bnder 2’s number of loans and failure rate were understated by 42 loans and 10 percentage points (17.7 percent versus 28.0 percent). Lender 3’s number of loans was understated by 41 loans, and the lender’s failure rate was overstated by 2 percentage points (24.8 percent versus 22.6 percent).
The inability of SBA'S system to automatically link identification numbers can also affect banks that have merged under a new name, in which case a new identification number hss to be assigned to both banks, or banks that have been taken over by another bank, in which case one of the banks must receive a new identification number. According to SBA offkids, sometimes the old identification number remains in effect without being linked to the new identification number. Any additional loans made under the old identification number will not be accounted for in statistics on loans made under the new identification number. SBA officials have also
Page26 GAOAtCED-8%124SmllBudneu
AppendIs II Reeulta of the Preferred Lendem Progrun
found in their data system different permanent identification numbers designating the same bank.
SBA ofllcisls agree that there is no systematic process that identifies temporary identification numbers that are not linked to permanent numbers. Unless SBA personnel identify and manually link the information on loans made by a branch bank to a main bank’s information, the two will always be reported separately.
Page 26 GAO/BCED-82-124 SmaU Bwineaa

Appendix III 4
Characteristics of PLP Loans, Borrowers, and Lenders
Preferred loans are generally made for larger amounts than SBA'S certified and regular guaranteed loans. Overall, preferred loans have interest rates similar to those for SBA'S other guaranteed general business loans. In a judgmental sample of preferred loans, SBA'S Office of Inspector General (OIG) found that all or a portion of most loans sampled was used to repay debt. While the loan guarantee may be reduced for loans involving the repayment of debt owed to the lender, over QO percent of all PLP loans and about 60 percent of CLP and regular loans were made at the maximum guarantee. Borrowers of preferred loans tend to be established corporate entities, primarily from the retail and service industries, while most lenders are banks.
PLP Loans Are Larger PW loans are larger on average than CLP and regular 7(a) guaranteed loans.
Than CLP and Regular For PLP loans made between fiscal years 1933 and 1990, the average amount was $273,000, compared to $192,000 for CLP loans and $182,000 for
Guaranteed Loans regular loans. As shown in table III. 1, while 41 percent of PLP loans were for amounts of $260,000 or more, only about 26 percent of CLP and regular loans were of this size.
The average size of PLP loans dramatically increased when SBA raised the ceiling on all guaranteed loans from $600,000 to $760,000 in September 1933. (This ceiling applies to the amount of the loan that is guaranteed. The total amount of the loan may be greater.) This change has increased the average amount of PLP loans by 24 percent over the last 2 fBcal years. This increase compares to a 3-percent increase in the average amount of CIP loans and a M-percent increase in the average amount of regular loans.
Table III.1 : Dletrlbutlon of PLP, CLP, end Regular Loane, by Amount, Flrcal Percentage of loan& by program Yorrr 1993 Through 1990 Loan amount PLP CLP Regular b
$50,000 or less 9 15 20
$50,001-$99,999 11 21 20
$100,000-$249.999 39 38 36 $250,000-$499,999 25 18 17
$500,000-$749,999 11 6 6
$750,000 or more 5 2 1
Total 100 100 100
Page 27 GAO/WED-82-124 Small Buainem

charaet8ctettce of PLP LlJuu, Borroware, and Lender8
Interest Rates Charged Are Similar for the Three Loan Programs
Overall, the interest rates for PLP loans are similar to those for CLP and regular loans. This is true for both loans with variable and fixed interest rates. Variable-rate loans accounted for 81 percent of the PJ.,P loans, 87 percent of the CLP loans, and 86 percent of the regular loans made between fiscal years 1983 and 1990.
Our assessment of the reliabillty of SJSA’S data base showed that 10 district offices erroneously entered variable interest rates as fixed interest rates. These errors were found for all loan types, PLP, CLP, and regular. We therefore excluded from our analysis the interest rate data from all 10 offices and performed our analysis of interest rates using data from the remaining district offices. Loans made in these 10 districts represented 10, 17, and 11 percent of the PLP, CIP, and regular loans, respectively, made between fiscal years 1983 and 1990. However, according to SBA, omitting data on these loans did not affect our overall analysis of interest rates. (See app. IX for details on our assessment of the data base’s reliability.)
Variable Rates Were Similar for All Three PrOgramS
Table 111.2: Dlstrlbutlon of Variable Intorwt Rate@ for PLP, CLP, and Regular Loana, Placrrl Yoare 1883 Through 1oBo
For variable rate loans, interest rates did not appreciably differ among the three loan programs. As shown in table I&2,27 percent of PIP loans had interest rates that were more than 2.6 percentage points above the prime, compared to 32 percent of CLP and 36 percent of regular loans. Only 2 percent of PLP loans had interest rates above.3 percentage points over the prime. SBA officials stated that market competition keeps interest rates for PLP loans in line with the rates for other guaranteed loans.
Percentage of loans, bv program Inter881 above prime rate PLP CLP Regular 0.5% and below 1 5 3 0.51 - 1.0 3 4 4 ’
1.01 - 1.50 15 10 7
1.51 - 2.00 29 25 24
2.01 - 2.50 24 24 26 2.51 - 3.00 25 32 36 Above 3.0% 2 0 0
Total 1W 100 100 Note: Analysis does not include loans from 10 SEA district offices.
‘Does not equal 100 percent because of rounding.
Page 28 GAWBCED-W-124 Small Buainer

AppandJx III Char~rletlcr of PLP Lomu, Borrowelu, and Lenderr
S~A’S regulations require that for certified and regular loans, lenders may not charge interest rates more than 2.26 percentage points over the lowest prime rate for loans with terms of less than 7 years and 2.76 percentage points over the lowest prime rate for loans with terms of 7 years or longer. Because the interest rate charged may vary with the term of the loan, we attempted to compare the interest charged for preferred loans with that for other guaranteed loans of similar term. However, we were unable to perform this analysis because of problems with sacl’s data on loan term. Specifically, in assessing the reliability of the data base, we estimated that for one of three district offices assessed, data on loan term wss in error for 16.1 percent (f10.8 percent) of the records.
Most of the errors occurred for liquidated loans for which data on loan term (called maturity months) had been changed when the loans were serviced to reflect the remaining months outstanding on the loans instead of the originally approved term of the loans. SBA offWJs stated that these changes are intended to reflect the effect of deferments granted during the life of the loans. When asked how without having accurate data on loan term they ensure that lenders do not exceed the applicable interest rate limitations, SBA officials explained that they ensure compliance at the time the loans are approved.
Average F’ixed Rates Were the Same for All Three programs
For fixed-rate loans, interest rates were no different for PLP loans than for other SBA-guaranteed loans. For Axed-rate loans made under each of the three programs between fiscal years 1983 and 1990, the average interest rate was about 12 percent. Fixed rate loans accounted for 19 percent of the PUJ loans, 13 percent of the CLP loans, and 16 percent of the regular loans during this period.
Most Preferred Loans Sampled by the OIG Used to Repay Debt
In its fLscal year 1989 and 1990 auditsof the PLP, SBA’S OIG reviewed a sample of 166 loans at five participating lenders. Of the 166 loans sampled, 49 were described in sufficient detail in the audit reports to show how loan proceeds were used. As shown in table III.3,30 loans (61 percent), were used to repay debt, either solely or in combination with other uses. Debt repayment accounted for $10,380,222, or 46 percent of the total dollar amount of these loans. Of the amount used to repay debt, $3,362,193 (32 percent) was used to repay debt owed the preferred lender and $7,018,029 (68 percent) was used to repay debt owed other lenders. Lenders may make a loan that will be used for repaying existing debt only if the loan’s guarantee percentage is reduced so that the lender’s risk is not changed.
Page 29 CbW/BCEDP2-124 Small Buminer
8
AppendixIII Cheractartetice of PLP Lomu, Borrowers, md Lendera
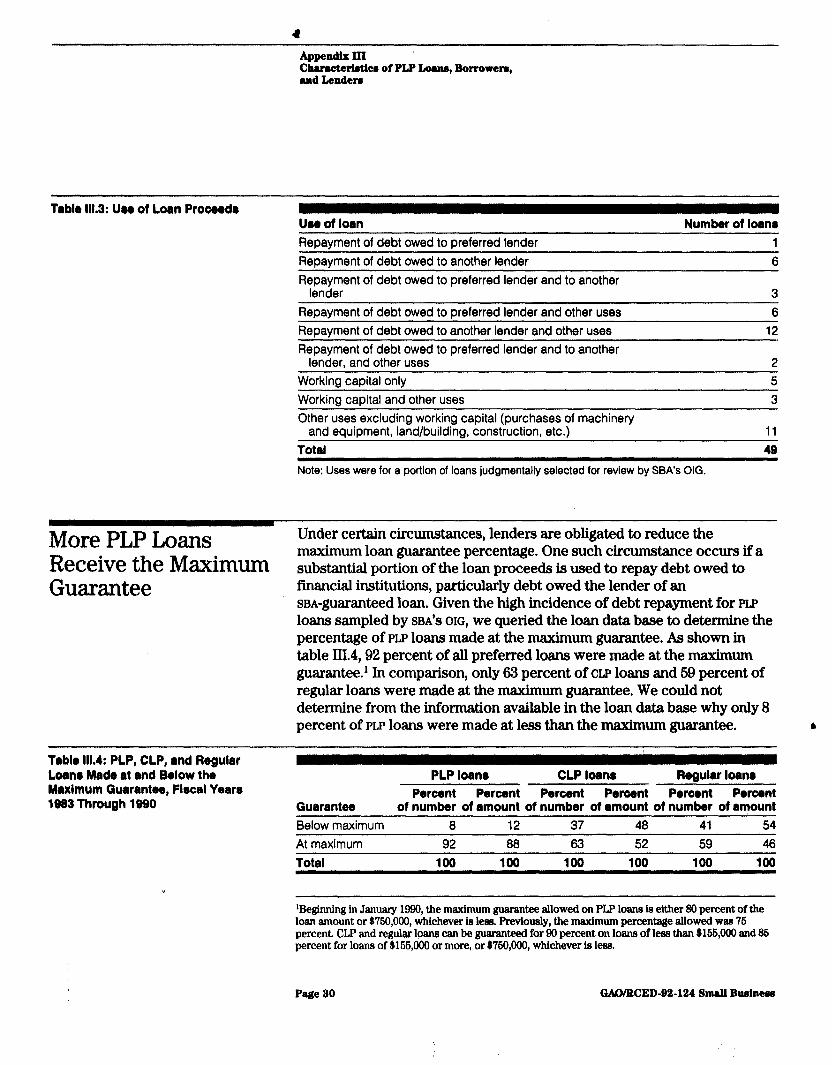
Tablo 111.3: Ulo of Loan Procerdr lJ80 of loan Number of loan8
More PLP Loans Receive the Maximum Guarantee
Reoavment of debt owed to oreferred lender 1
Repayment of debt owed to another lender
Repayment of debt owed to preferred lender and to another lender
6
3
Repayment of debt owed to preferred lender and other uses Repayment of debt owed to another lender and other uses Repayment of debt owed to preferred lender and to another
lender, and other uses
6 12
2 Working capital only Working capital and other uses
Other uses excluding working capital (purchases of machinery
5 3
and equipment, land/building, construction, etc.) 11 Total 49
Note: Uses were for a portlon of loans judgmentally selected for review by SBA’s OIG.
Under certain circumstances, lenders are obligated to reduce the maximum loan guarantee percentage. One such circumstance occurs if a substantial portion of the loan proceeds is used to repay debt owed to financial institutions, particularly debt owed the lender of an SBA-gUaI%nteed loan. Given the high incidence of debt repayment for PLP loans sampled by SBA’S OIG, we queried the loan data base to determine the percentage of PLP loans made at the maximum guarantee. As shown in table 111.4,92 percent of all preferred loans were made at the maximum guarantee.’ In comparison, only 63 percent of cLp loans and 69 percent of regular loans were made at the maximum guarantee. We could not determine from the information available in the loan data base why only 8 percent of PLp loans were made at less than the maximum guarantee. L
Teble 111.4: PLP, CLP, and Regular Loan@ Made at and Below the Maxlmum Quarantee, Flrcal Years 1983 Through 1990 Guarantee
PLP loans CLP loans Regular loan8 Percent Percent Percent Percent Percent Percent
of number of amount of number of amount of number of amount Below maximum 8 12 37 48 41 54 At maximum 92 88 63 52 59 46
Total 100 100 100 100 100 100
‘Beginning in January 1990, the maximum guarantee allowed on PJ.P loans is either 80 percent of the loan amount or $760,000, whichever is less. Previously, the maximum percentage allowed was 76 percent. CLP and regular loans can be guaranteed for 90 percent on loans of leas than $166,000 and 85 percent for loans of $166,000 or more, or $760,000, whichever is less.
Page 20 GAOAWED-92-124 Small Bmineur
Most PLP Borrowers Are Corporations, Existing Businesses, and in the Retail and Service Industries
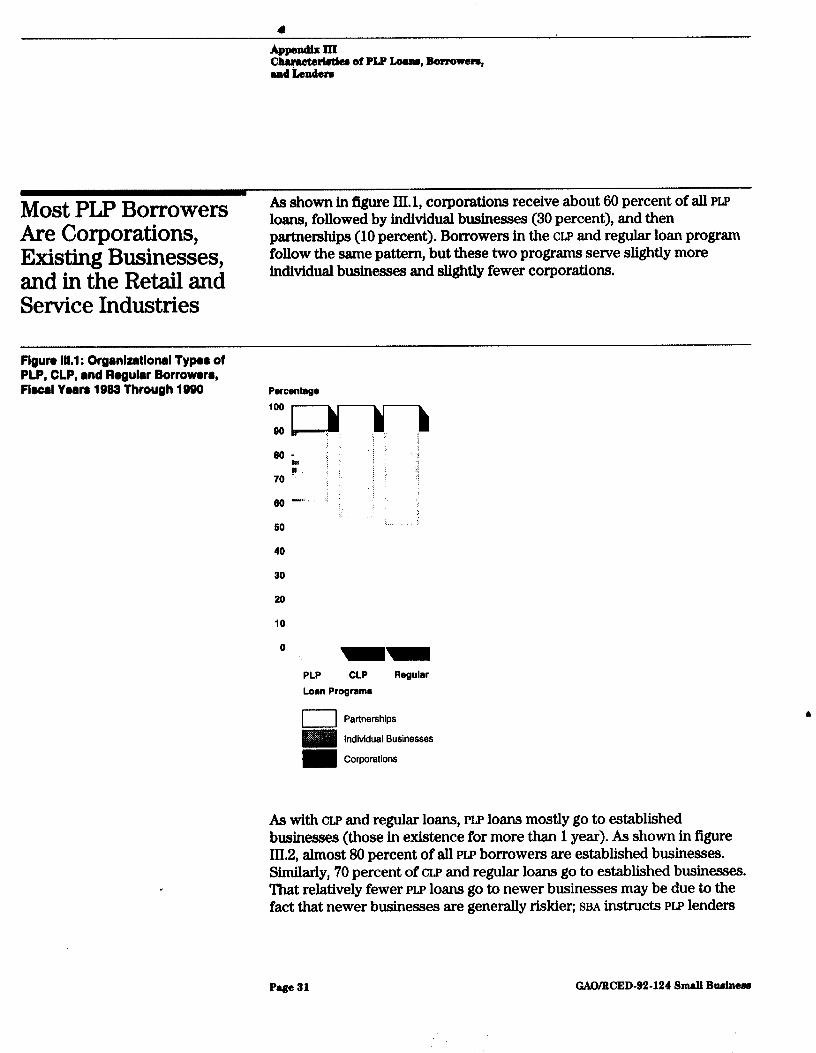
As shown in figure III. 1, corporations receive about 60 percent of all PW loans, followed by individual businesses (30 percent), and then partnerships (10 percent). Borrowers in the CLP and regular loan program follow the same pattern, but these two programs serve slightly more individual businesses and slightly fewer corporations.
Flgun III.1 : Orgmlzatlonal Type0 of PLP, CLP, and Rogulrr Borroworr, Flrorl Yoan 1983 Through 1990 Parcantage
30
PLP CLP Loan Programs
Regular
1 Partnerships
Individual Businesses
Corporations
As with CLP and regular loans, PIP loans mostly go to established businesses (those in existence for more than 1 year). As shown in figure III.2, almost 80 percent of all PIP borrowers are established businesses. Similarly, 70 percent of cw and regular loans go to established businesses. That relatively fewer PLP loans go to newer businesses may be due to the fact that newer businesses are generally riskier; SBA instructs PLP lenders
Page 81 GAO/NED-92-124 Small Budneu

-rt8ttcr of PLP JAmu, Borrowers, and Landen
to submit risky or complicated loans under the cw or the regular loan program rather than under the PLP.
PIgun 111.2: Dlotrlbutlon d Loana Made to Naw and Exlatlng Buslnoaaoo, Flmal Yaara 1983 Through 1990 Porcmtaga
100
a0
60
70
60
50
40
30
20 ’
10
0 L B
PLP CLP Ragular Loan Program8
I Existing Businesses
New Buslnesses
As shown in figure III.3, most borrowers under all three loan programs are in the retail and service industries. Borrowers in the manufacturing a industry account for an additional 18 percent of PLP loans, and 16 percent of cw loans and 16 percent of regular loans. Collectively, restaurants, grocery stores, and gas stations constitute the majority of borrowers in the retail industry, while he&h services, business services, and automobile repair services represent the majority of borrowers in the service industry. Borrowers in the manufacturing industry are generally producers of industrial and computer equipment as well as producers of fabricated metals.
Page a2 GAWRCED-92-124 Small Buoheu

Pigun 1ll.S: Dlrtrlbutlon of PLP, CLP, l d Rogulu Loam, by lndultry of Borrowor, RamI Vowa 1909 Through 1990
Porcwtago ,oo
40
30
20
10
O-B PLP CLP Rogulrr Loan Program8
- I 1 Other -
Manufacturing lnduetrles
Service lndustrles
Retail lndustrtes
MostPLPLendersAre According to SBA offkials and agency records, the mqjority of PLP lenders
Bi.kIlks are banks. Of the 212 past and present preferred lenders, only 20 have not been banks. These included four business and industrial development companies (mco), 11 small business lending companies (SBLC), and five savings and loans. BIDCOS are nondepository institutions that are regulated by the state banking commissions. SBLCS are also nondepository institutions; however, they are regulated by SBA. Since they have no deposits, SBLCS rely on the loan guarantee to raise lending capital. currently, only six SBLCXl and two BIDCOS remain in the program.
a
p4e 88 GAO/ItCED-92-124 Smdl Budnsr

Appendix IV 8
Geographic D istribution of Preferred Loans
‘Lending under the PLP is concentrated in relatively few SBA district offices, while other offices account for little or no PLp lending. PLp lending is greatest in California and in various eastern states and is least in the central and southeastern states. The average loan size also differs from office to office, sometimes substantia,lly. The distribution of borrowers follows the same pattern as that of lenders.
As shown in table IVJ, 10 of SBA’S 86 district/branch offices accounted for 61 percent of all PW loans made in fLscal year lfI90. Of SEW’S 85 districtiranch offices, the top 16 accounted for 74 percent of all PLP loans made. In contrast, many SBA district offices have little lending under the PLP. For example, in fiscal year 1990,27 SBA district offices accounted for no PLP loans, while 11 more accounted for three or fewer.
Table IV.1 : Dldrlbutlon of Approved PLP Loans, by SSA Dlrtrlct OffIce, FlIcal Year 1900 Dlrtrlct off Ice
San Francisco, Calif.
Number Portent Amount (dollar8 In Percent of loan0 of loanr mllllonr) of amount
298 12 $118.1 16 Los Angeles, Calif. 265 11 109.0 15
Montpelier, Vt. 204 8 33.7 5
Santa Ana, Calif. 151 6 71.5 10 Sacramento, Calif. 115 5 40.1 5 Newark, N.J. 95 4 25.1 3
Philadelphia, Pa. 93 4 30.1 4
San Dieao, Calif. 89 4 31.0 4
Milwaukee, Wis. 03 3 23.5 3 Seattle, Wash. 83 3 15.4 2 All Others 959
Total 2,435
ODoes not equal 100 percent because of rounding.
39 237.9 32
1W $735.9 1w 6
Lending under the PLP in fiscal year 1996 was most pronounced in three areas: California (38 percent of PLP loans), Vermont (8 percent), and the cities of Philadelphia and Newark (8 percent). Also, Milwaukee and Seattle each accounted for 3 percent of PLP loans. In contrast, many central and southeastern states had little or no lending under the program. For example, Alabama, Arkansas, Kansas, Louisiana, New Mexico, and Oklahoma together accounted for only eight preferred loans in fiscal year 1990.
Page a4 GkUMBCED-92-124 8md.l Budnesrr

Geogmphtc DLtributioa of Preferred Louu
Over a broader span of time, the distribution of lending by state is essentially the same as for fiscal year 1990, as illustrated in figure IV.l.
@n IV.l: Qeogmphic Dletrlbution of PLP Loam, Flrcal Yom 1983 Through 1990
I 0 to 50 Loans
I 51 to 100 Loans
101 to 200 Loans
201 to 400 Loans
Over 400 Loans
Page iii5 GAO/WED-92-124 Small Bruinem
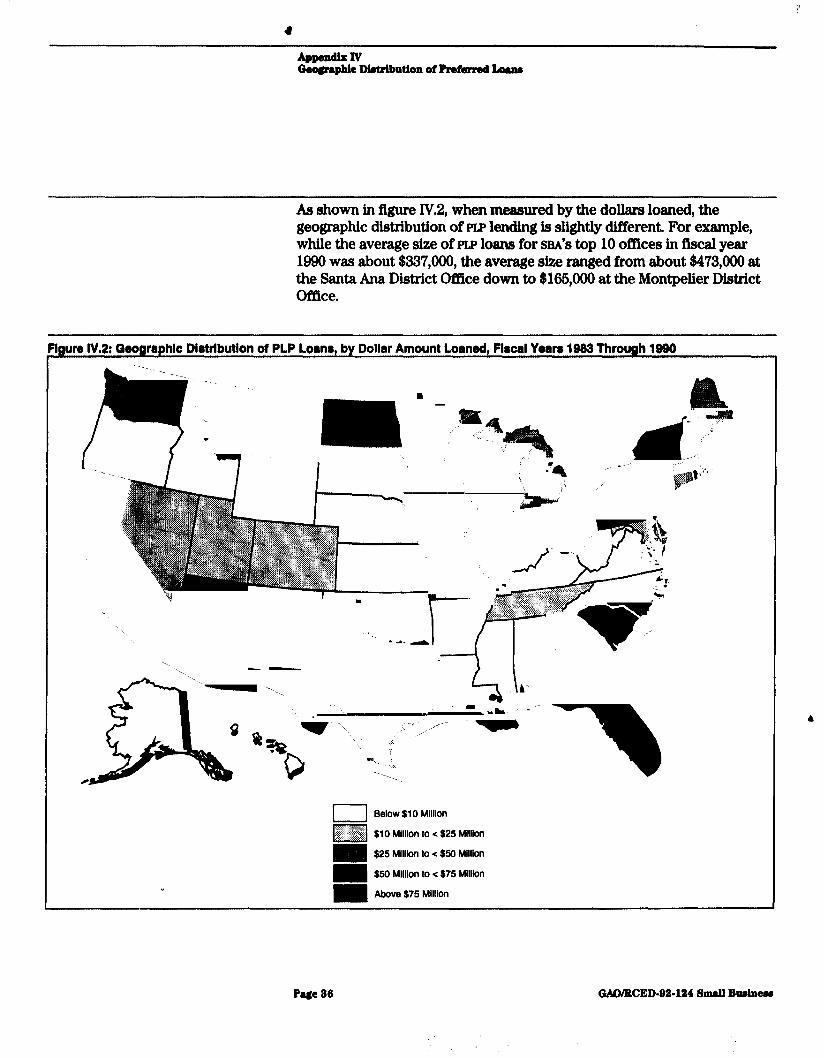
As shown in figure lV.2, when measured by the dollars loaned, the geographic distribution of PLP lending is slightly different. For example, while the average size of PLp loans for s&i’s top 10 offlces in fiscal year 1990 was about $337,000, the average size ranged from about $473,000 at the Santa Ana District Office down to $166,000 at the Montpelier District Office.
‘Iguro IV.2: Qeographlc Dlatrlbutlon of PLP Loans, by Dollar Amount Loaned, Flrcal Years 1982 Through 1890
Below $10 Million
$10 Million to < $25 Million
$25 MIllion to e $50 Million
I $50 Million to s $75 Million
I Above $75 Million
Page 86 GWMtCED-92.124 Small Budner

SBA officti cited many reasons for the concentration of FSP lending, including the number of KP lenders in a given area and the proximity of PLP lenders to borrowers, lenders’ market;ing efforts, regional economies’ effect on the demand for loans, and the degree of support SBA regional and district oppices provide for the program.
Lending under the PLP is generally greater in more densely populated areas and in locations where there are a large number of preferred lenders. A case in point is California, the nation’s most populous state. More preferred lenders, 26, are in California than any other state, and the highest number of preferred loans, 2,116, have been made there. Most borrowers are located in the same state as the preferred lender from which they get the PLP loan. The highest concentrations of PIZ borrowers are in California, Vermont, New York, New Jersey, and W isconsin. (See app. VII for a summary of PLP lenders, by state.)
SBA officials said that lending under the PLP is greater in areas where lenders market the program more aggressively and that regional economies have an effect on the demand for loans.
F’inally, because the program at the outset was designed as an option for district offices to use, SBA headquarters ofpicials said that regional and district of&es differ in their support of the FSP. Generally, these officials said district offices with greater work loads depend more on preferred lending than offices with lighter work loads. One SBA official believed that some district otTices still have the mistaken notion that preferred lending could result in lost jobs and therefore remain wary of the program.
Page a7
‘, I ,’ r -,/ ,,
GiUYRCED-92.124 SnuB Budmu
“,,I, ’

Appendix V 4
Preferred Lenders’ Compliance W ith SBA’s Regulations
In fiscal years 1989 and 1990, SBA’S OIG audited the PP. The OIG found that some preferred lenders did not always comply with program regulations and that SBA’S monitoring could be more effective. F’indings similar to the OIG’S have also been reported by SBA’S Of&e of Financial Assistance as a result of its reviews of loan applications and reports based on field reviews of PLP lenders. To better control lenders, SBA has made a number of changes to the PLP and is considering more. Some of the proposed changes could reduce the number of lenders participating in the program.
PLP Lenders Not Always in Compliance W ith Rules and Regulations
The OIG’S audit covered five preferred lenders located in four SBA district/branch offIces (Jacksonville, Florida; San Antonio, Texas; Montpelier, Vermont; and Milwaukee, W isconsin). The overall objectives of the audit were to determine whether (1) PLP lenders were carrying out loan processing, servicing, collection, and liquidation in accordance with SBA’S rules and regulations and (2) the agency was effectively overseeing PLP lenders.
In the four audit reports issued between March 1996 and January 1991, the OIG found that for 79 of the 166 PLP loans sampled, or 48 percent, lenders were not in compliance with SBA’S rules and regulations for the program. As shown in table V. 1, most deficiencies found by the OIG pertained to loan making. For loan making, the OIG questioned most often the use of loan proceeds and various matters affecting loan collateral. The OIG determined 10 loans to be ineligible for the PLP program since their proceeds were used for purposes disallowed by regulations. These loans often involved a business’ change in ownership and the payment of debts owed by principals rather than the borrower. For 17 other loans, the OIG believed the lender did not properly justify the use of the loan proceeds. For most of these loans, all or a part of the proceeds was used to refinance debt, l including the repayment of interim advances made by the preferred lender. For three of these loans, the OIG believed the lender had used the loan to reduce its credit exposure.
The OIG questioned 16 loans because the lender had taken a lien position superior to SBA’S on assets used to secure the loan. For seven loans, the OIG believed the lender overestimated the value of collateral. ln addition, the OIG found that for two loans, the lender sold collateral in excess of prescribed limits without SBA’S approval. In general, the OIG concluded that each of the five lenders audited did not always comply with SBA’S rules and regulations.
Page 29 GkAO/BCED-92-124 Small Bnoiner
Preferred Landen’ Compliance With SBA’a &rgUIdOM
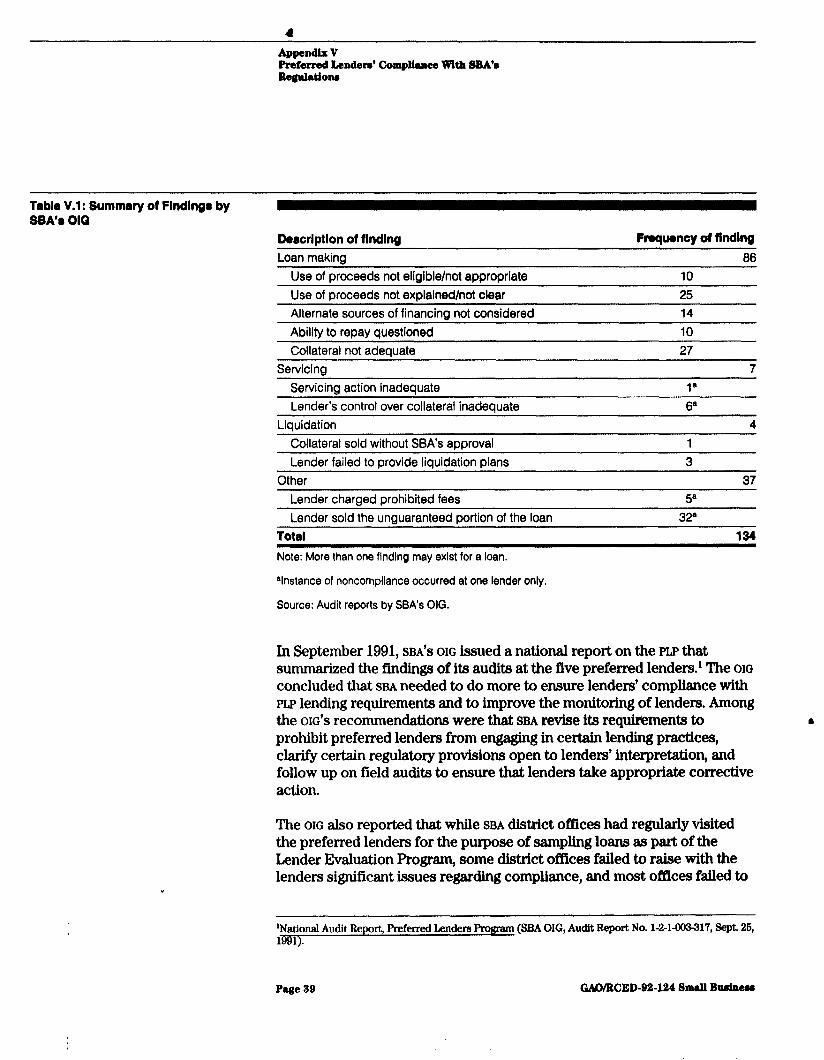
Table V.l: Summary of Findingr by SBA’r 010
Dsrcriptlon of findlng Frequency of flnding Loan making 86
Use of croceeds not eliaible/not acorooriate 10 Use of proceeds not explained/not clear 25 Alternate sources of financing not considered 14
Ability to recay questioned 10
Collateral not adeauate 27 Servicing 7
Servicing action inadequate 1’
Lender’s control over collateral inadequate 6’ Liquidation
Collateral sold without SBA’s approval
Lender failed to provide liquidation plans
4
1 3
Other 37
Lender charged prohibited fees 5’
Lender sold the unguaranteed portion of the loan 32’ Tatal 12d
Note: More than one finding may exist for a loan.
Vnstance of noncompliance occurred at one lender only.
Source: Audit reports by SEA’s OIG.
In September 1991, SBA’S OIG issued a national report on the PW that summarized the findings of its audits at the five preferred lenders1 The OIG
concluded that SBA needed to do more to ensure lenders’ compliance with PLP lending requirements and to improve the monitoring of lenders. Among the OIG’S recommendations were that SBA revise its requirements to 4 prohibit preferred lenders from engaging in certain lending practices, clarify certain regulatory provisions open to lenders’ interpretation, and follow up on field audits to ensure that lenders take appropriate corrective action.
The OIG also reported that while SBA district offices had regularly visited the preferred lenders for the purpose of sampling loans as part of the LRnder Evaluation Program, some district offices failed to raise with the lenders significant issues regarding compliance, and most offices failed to
‘National Audit Report, preferred Lenders program (SBA OIG, Audit Report No. l-2-1-003317, Sept. 26, ml).
Page 29 GAO/WED-92-124 Small Bush-

follow up to ensure that deficiencies were corrected. The OIG also reported that while the visits detected lenders’ noncompliance with most technical aspects of SBA’S regulations and operating procedures, the deficiencies continued to occur in subsequent PLP loans processed. The OIO concluded that each district of&e needed to improve its monitoring and evaluation of preferred lenders.
SBA district office officials having oversight of the lenders visited did not always agree with the 01~‘s findings. while the officials at each of&e agreed to take corrective action where appropriate, several strongly took exception to certain f¶ndings. In particular, these offices disagreed most v&h the OIG’S fhding~ on the subordination of co~ateral, the need for financing by SBA, and the effectiveness of SBA’S monitoring.
The findings of the OIG were corroborated by SBA’S F’inancial Institutions Branch of the Office of F’inancial Assistance, which, through sampling, examines loan applications and district o&ices reports based on field reviews. In memorandums lllurmnarizing the results of its reviews, the Financial Institutions Branch noted several common problems, including incomplete or missing documentation in loan files, missing justification for refinancing, and missing evahrations of collateral. SBA headquarters also shared the 01~‘s concern over recurring instances of noncompliance.
Despite the Financial Institutions Branch’s and, more recently, the OIG’S reports of lenders’ failure to follow SBA’S procedures, only one preferred lender has been terminated from the program because of noncompliance. According to SBA, however, some preferred lenders have not had their certification renewed.
4
SBASeekstoBetter SBA recently has issued a new handbook for agency personnel who deal
ControlLenders with the PLP and has issued new regulations to ensure the continued servicing of loans by preferred lenders. In addition, SBA is considering other measures to enhance the administration of the program, some of which could limit lenders’ participation.
Handbook Revised ”
In July 1990, SBA issued a revised handbook for the PIP to replace the one released in December 1984. The PLP Handbook is the agency’s repository for instructions, guidance, and policy direction for the program. The revised handbook changes, clarifies, and adds criteria affecting the selection and retention of preferred lenders; the standards for loan
Pas 40 WWWED-92.124 SmdI Budneu
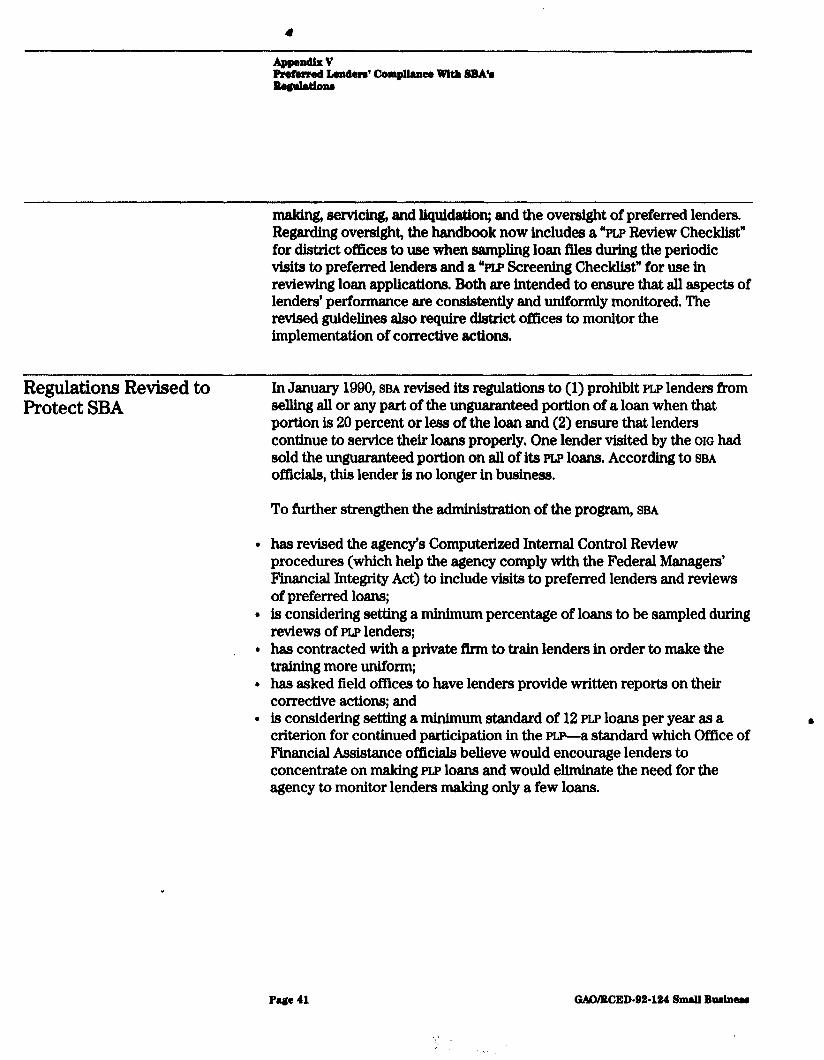
making, servicing, and liquidation; and the oversight of preferred lenders. Regarding oversight, the handbook now includes a “PIP Review Checklist” for district of&es to use when sampling loan files during the periodic visits to preferred lenders and a “PLP Screening Checklist” for use in reviewing loan applications. Both are intended to ensure that all aspects of lenders’ performance are consistently and uniformly monitored. The revised guidelines also require district offices to monitor the implementation of corrective actions.
Regulations Revised to Protect SBA
.
In January 1090, SBA revised its regulations to (1) prohibit PLP lenders from selling all or any part of the unguaranteed portion of a loan when that portion is 20 percent or less of the loan and (2) ensure that lenders continue to service their loans properly. One lender visited by the OIG had sold the unguaranteed portion on all of its PLP loans. According to SBA offWrls, this lender is no longer in business.
To further strengthen the administration of the program, SBA
has revised the agency’s Computerized Internal Control Review procedures (which help the agency comply with the Federal Managers’ Financial Integrity Act) to include visits to preferred lenders and reviews of preferred loans; is considering setting a minimum percentage of loans to be sampled during reviews of PLP lenders; has contracted with a private firm to tram lenders in order to make the training more uniform; has asked field offices to have lenders provide written reports on their corrective actions; and is considering setting a minimum standard of 12 PLP loans per year as a criterion for continued participation in the rr.z-a standard which Office of Financial Assistance officials believe would encourage lenders to concentrate on making PW loans and would eliminate the need for the agency to monitor lenders making only a few loans.
Page41 QALUBCED-92-124 Smdl Bud11444
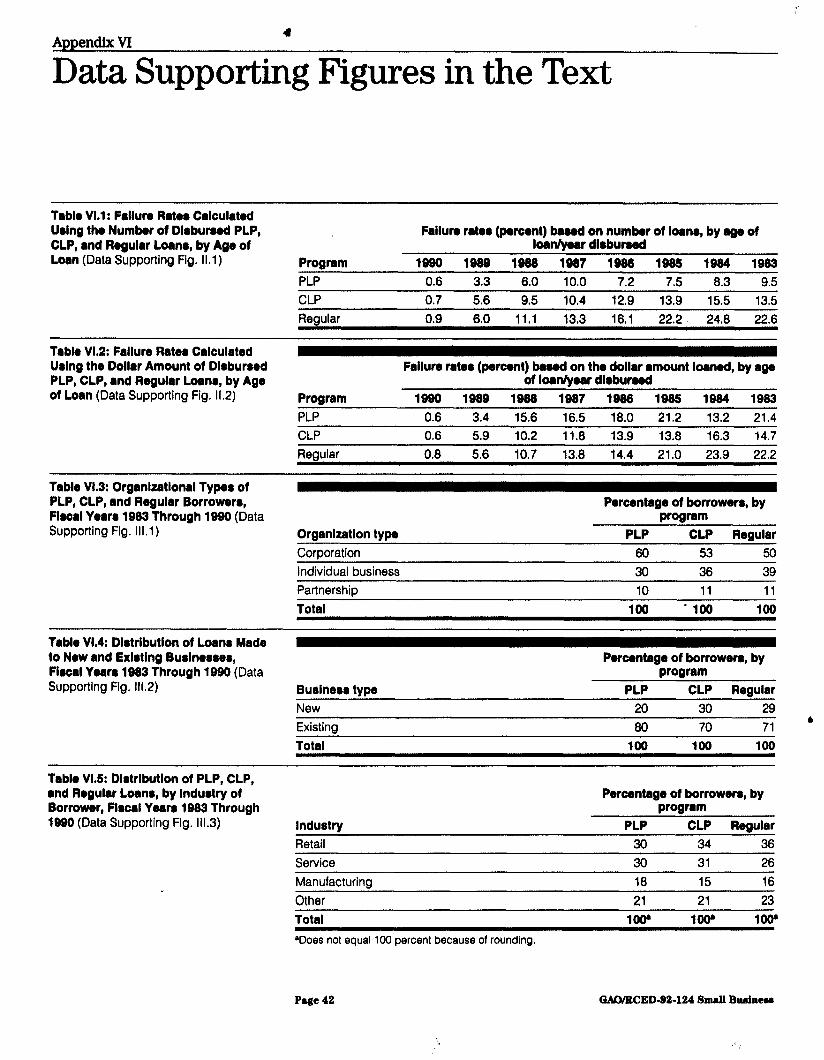
Appendix VI
Data Supporting Figures in the Text
Tablo VI.1 : Falluro Rate8 Calculated Ualng the Number of Dlaburaed PLP, CLP, and Regular Loena, by Age of Loan (Data Support ing Fig. 11.1) Program
Failure rotor (percent) beaed on number of loena, by age of lonn/year dlaburaed
1BBO 1989 1968 1887 1986 1985 1984 1983 PLP 0.6 3.3 6.0 10.0 7.2 7.5 8.3 9.5
CLP 0.7 5.6 9.5 10.4 12.9 13.9 15.5 13.5
Regular 0.9 6.0 11.1 13.3 16.1 22.2. 24.8 22.6
Table Vl.2: Failure Rate8 Calculated Ualng the Dollar Amount of Dlabureed PLP, CLP, and Regular Loana, by Age of Loan (Data Support ing Fig. 11.2) Proaram
Failure retea (percent) beaed on the dollar amount loened, by age of loelycur dlaburaed
1990 1989 1988 lB87 1986 1985 1984 1983 PLP 0.6 3.4 15.6 16.5 18.0 21.2 13.2 21.4
CLP 0.6 5.9 10.2 11.8 13.9 13.8 16.3 14.7
Regular 0.8 5.6 10.7 13.8 14.4 21.0 23.9 22.2
Table Vl.3: Organlxetlonal Types of PLP, CLP, end Regular Borrowera, Flacal Year8 1083 Through lBB0 (Data Support ing Fig. 111.1) Organlzatlon type
Corporation Individual business
PartnershiD
Total
Percentage of borrowera, by f=amm
PLP CLP Regular 60 53 50
30 36 39
10 11 11
100 - loo 100
Table Vl.4: Dlatrlbutlon of Loana Made to New and Exlatlng Bualneaaea, Fiacal Year8 1 B83 Through 1990 (Data Support ing Fig. 111.2) Bualnera type
Percentage of borrowers, by program
PLP CLP Regular New 20 30 29
Existing so 70 71 1,
Total 100 100 100
Table VI.& Dlatributlon of PLP, CLP, and Regular Loana, by lnduatry of Borrower, Flacal Yeera 1983 Through lWO(Data Support ing Fig. 111.3) Industry
Retail
Service
Percentego of borrowera, by program
PLP CLP Regular 30 34 36
30 31 26
Manufacturing 18 15 16
Other 21 21 23
Total aDoes not equal 100 percent because of rounding.
1w 1W 1W
Page 42 GAOiECED-@2-124 Small Bdneu

Table VI.@: Uogmphle Dlotributlon of PLP Loans, piawl Yeara 1989 Through loo0 (Data Supporting Fig. IV.1) 8tate
Alabama
Number of Number of PLP loans State PLP loena
1 Nebraska 42
Alaska 1 Nevada 58
Arizona 164 New Hampshire 0
Arkansas 2 New Jersev 466
California 2,116 New Mexico 10
Colorado 33 New York 533
Connecticut 33 North Carolina 39
Delaware 0 North Dakota 0
Florida 304 Ohio 362
Georgia 178 Oklahoma 28
Hawaii 16 Oreaon 16
Idaho 0 Pennsylvania 462
Illinois 195 Rhode Island 21
Indiana 1 South Carolina 31
Iowa 186 South Dakota 7
Kansas Kentucky
17 Tennessee
0 Texas
46
94
Louisiana 4 Utah 119
Maine 135 Vermont 954
Maryland 116 Virainia 4
Massachusetts 256 Washington 238
Michigan 109 West Virginia 6
Minnesota 123 Wisconsin 457
Mississipoi 1 Wvomina 9 24
1
. . . w
Missouri 171 Washington, DC.
Montana 171 Puerto Rico Unknown 1
Total 8.381
P44 42 GAO/WED-DZ-124 Small Bolriner

Data SUPPOSES FItwar Ln the ‘rat
Table Vl.7: Qoo~nphlo Dlotrlbutlon ot PLP Loan. by doll& Amount Loaned, Fllicrrl Yoan 1983 Through 1090 (Data Supporting Pig. IV.2)
Dollars in miiiions
State Amount ol Amount of PLP loan0 Stat0 PLP loan0
Alabama 0 Nebraska $6.7 Alaska 0 Nevada 11.7
Arizona $61.2 New Hampshire 0
Arkansas 0.6 New Jersev 142.0
California 713.8 New Mexico, 2.6
Colorado 13.2 New York 16107
Connecticut 13,O North Carolina 6.3
Delaware 0 North Dakota 0
Florida 86.7 Ohio 82.5
Georgia 72.4 Oklahoma 9.6 Hawaii 3.1 Oreaon 2.4
Idaho 0 Pennsylvania 139.8
Illinois 53.7 Rhode island 4.8
Indiana 0 South Carolina 9.0
Iowa
Kansas
33.4 South Dakota
5.7 Tennessee
1.4
17.7
Kentucky 0 Texas 26.0
Louisiana 1.0 Utah 23.3
Maine 25.0 Vermont 179.1
Marviand 19.3 VirQinia 2.6
Massachusetts 39,9 Washington 44.8
Michiaan 26.5 West Virainia 1.6
Minnesota 33.8 Wisconsin 138.6
Mississippi 0.2 Wyoming 2.4 ,
Missouri 32.0 Washington, D.C. 5.6
Montana 27.6 Puerto Rico 0.5 Unknown 0.3 Total 92.285.5
Page44
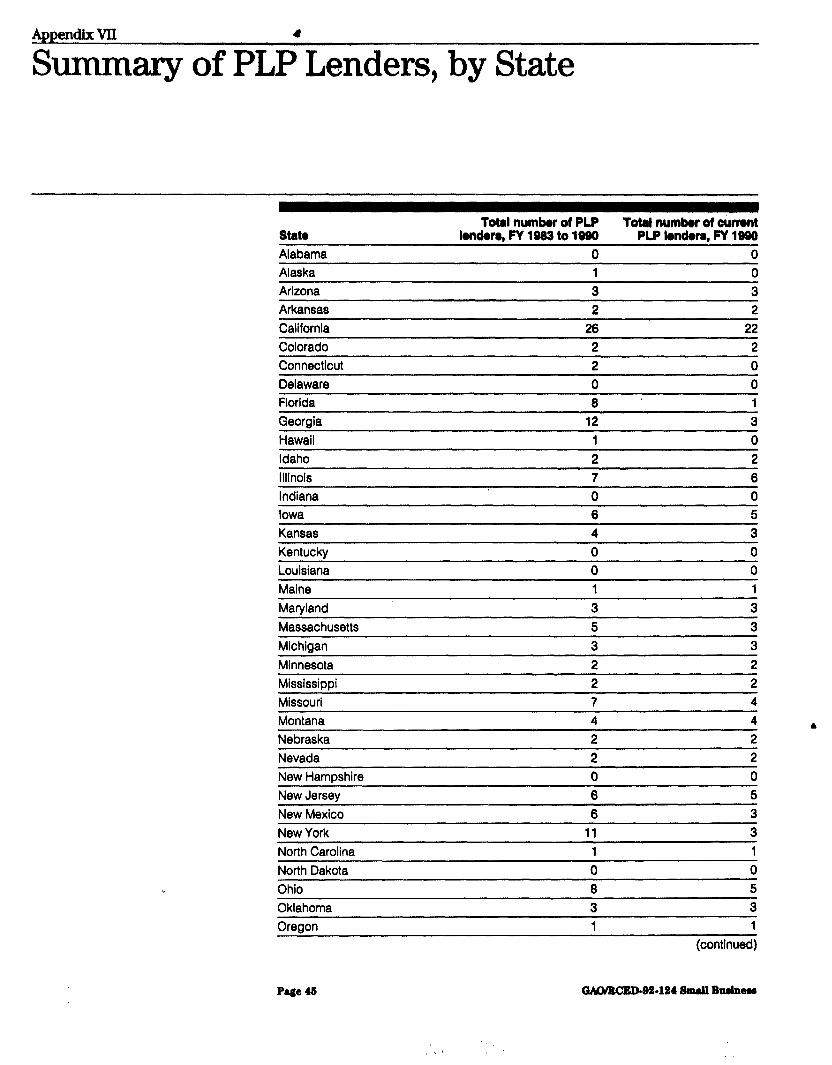
Appendix VII
Summary of PLP’Lenders, by State
Stem Alabama
Total numbor of PLP Total numbor of cGmnt Iendw8, FY 1983 to lQQ0 PLP Ionderr, FY 1990
0 0 Alaska 1 0 Arizona 3 3 Arkansas 2 2
California 26 22 Colorado 2 2 Connecticut 2 0
Delaware 0 0 Florida 8 1 Georgia 12 3 Hawaii 1 0 Idaho 2 2 iiiinols 7 6 Indiana 0 0
Iowa 6 5 Kansas 4 3
Kentucky 0 0 Louisiana 0 0
Maine 1 1
Maryland 3 3
Massachusetts 5 3
Michigan 3 3
Minnesota 2 2 Mississippi Missouri
Montana Nebraska Nevada
New Hampshire New Jersey
New Mexico New York North Carol ina
North Dakota Ohio
Oklahoma Oregon
2 7
4 2 2
0 6
6 11
1
0 8
3 1
2 4
4 2 2
0 5
3 3 1
0 5
3 1
(continued)
Page46 MWBCED-92.1248mdlBuaimam
4
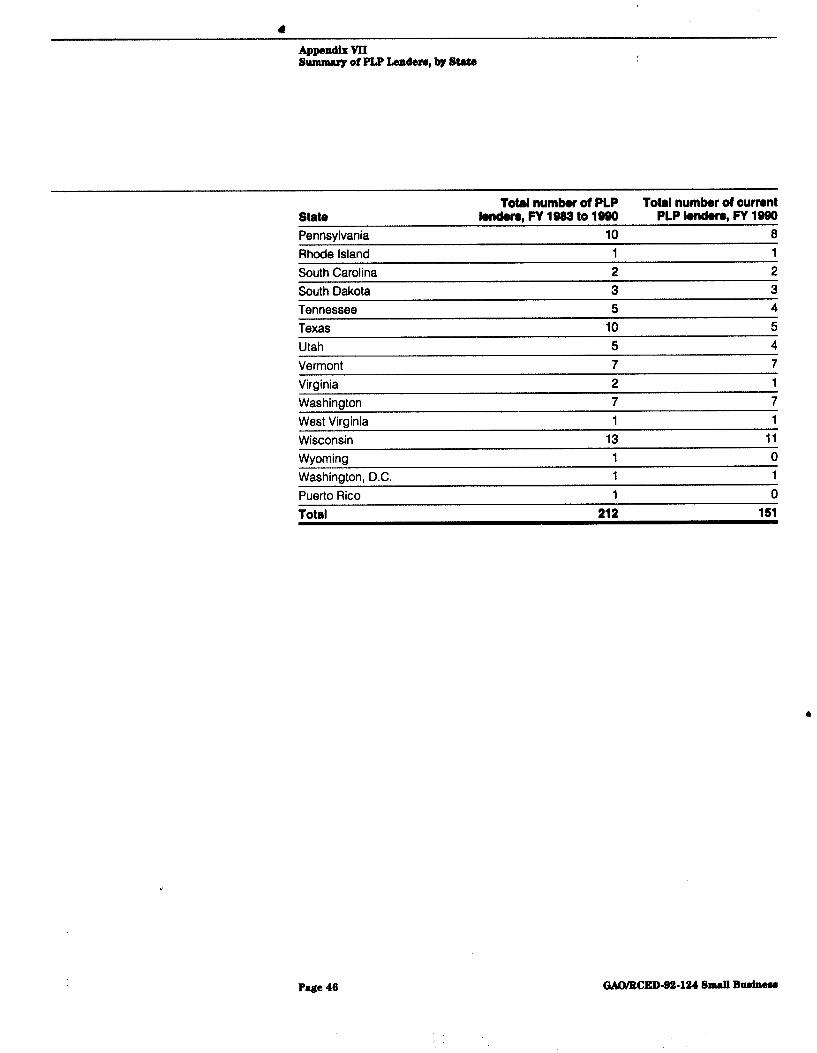
Smmary of PLP Lander., by State
State Total numbor of PLP Total numbor of current
I8nd8n. PY lQ83 to 1990 PLP Ionden, FY 1990 Pennsylvania 10 8 Rhode island 1 1 South Carol ina 2 2
South Dakota 3 3 Tennessee 5 4 Texas 10 5 Utah 5 4 Vermont 7 7 Virginia 2 1 Washington 7 7 West Virainia 1 1 Wisconsin 13 11 Wyoming 1 0 Washington, DC. 1 1
Puerto Rico Total
1 0
212 151
4
Page 46

Appendix VIII 1
Objectives, Scope, and Methodology
The objectives of our review were to obtain and analyze information on
l the results of sr3A’s PLp, l the characteristics of preferred loans as compared with other
s~guaranteed loans, l the geographic distribution of preferred loans, and l preferred lenders’ compliance with SBA’S regulations as determined by
independent audits.
To analyze the results of the program, we gathered information on the number and amount of loans, failure rates, and processing efficiency attributable to the PLP. Data on the number and amount of loans were obtained from SBA’S loan accounting system data base of all PLP, CLP, and regular loans approved from fiscal year 1983 through fLscal year 1990. To determine failure rates, we divided the number of loans in liquidation plus the number of loan guarantees SESA purchased by the number of loans disbursed. Data on resources saved were obtained from SBA headquarters officials and from an agency study on district offices’ work loads and loan processing efficiency.
To determine the characteristics of PLP loans and how they compare to other SBA-guaranteed loans, we analyzed information on the size, interest rates, use of SBA’S guarantee, and borrowers of loans from each loan program. Because SBA’S data base did not include the base rate upon which variable interest rates were computed, our analysis of variable interest rates was based on the interest rate spread over prime. Lenders may use any one of three rates as the base rate (i.e., the New York prime rate, their own prime rate, or the peg rate*), but according to SBA officials, the differences among the rates are slight. Most lenders use the New York prime rate, according to one sI3A official.
To determine variations in the number of loans and dollars loaned under the PLP across SBA districts, we stratified the loan data base by district office. To determine variations in the location of borrowers, we used the same procedure-this time by the borrower’s state.
We obtained data on lenders’ compliance from (1) reports on the PLP by SBA’S OIG and (2) assessments by SBA headquarters of the quality of district offices’ field reviews of PLP lenders from May 1987 to October 1990. The OIG’S reports were also the source for information on the use of loan
‘The peg rate is the S-month weighted average of money loaned by the U.S. Treasury for comparable periods of time. Only 10 PLP loans, 436 CLP loans, and 666 regular guaranteed loans are based on the peg rate.
Page 47 GAOIRCED-02-124 Small Budnese

proceeds. We also reviewed SM’S Federal Managers’ Financial Integrity Act reports for fiscal years 1989 and 1990.
To assess the reliability of data contained in the data base, we drew a random sample of loans made in three SBA district offices and compared the information in the data base to the loan applications. (For a detailed description of our assessment of the data’s reliability, see app. IX.)
Our review was conducted between September 1990 and October 1991 in accordance with generally accepted government auditing standards.
Page 48 GAWBCED-@a-124 Small B&en
The heliability of’SBKs Loan Data Base
Because our analysis of the chara&eristics of SFM-guaranteed loans relied on SFM’S automated data, we assessed the reliability of that data and discussed policies and procedures for maintaining the data base with SBA district office personnel and officials in the Financial Institutions Branch, Office of Financial Assistance, and the Offlce of Information Resources Management.
We combined this assessment with one conducted for another GAO review that analyzed SBA'S 7(a) general business loan portfolio. The GAO review of SBA’S 7(a) loan portfolio used a data base con-g all outstanding general business loans as of September 30,lQQO. Our data base included all PIP, CLP, and regular guaranteed loans approved in f!iscal years 1983 through 1990. Although the two data bases differed, of the 234 sample loans reviewed from the data base containing all outstanding 7(a) loans, 170 were in our data base. Therefore, to estimate the errors in our data base, we used the resulta from the earlier assessment of data and additionally assessed some data. The earlier assessment verified 16 data elements for two district oppices and one service center. Our assessment verified seven additional data elements at two of the three locations.
We used the statistical samples from the earlier assessment to estimate the errors in our data base. A random sample of loans was selected at two SBA district offices and one service center. Table IX.1 shows the number of errors found for each data element in the samples at the three locations.
Pue49 GMMXED-92-124 Small Bumineu
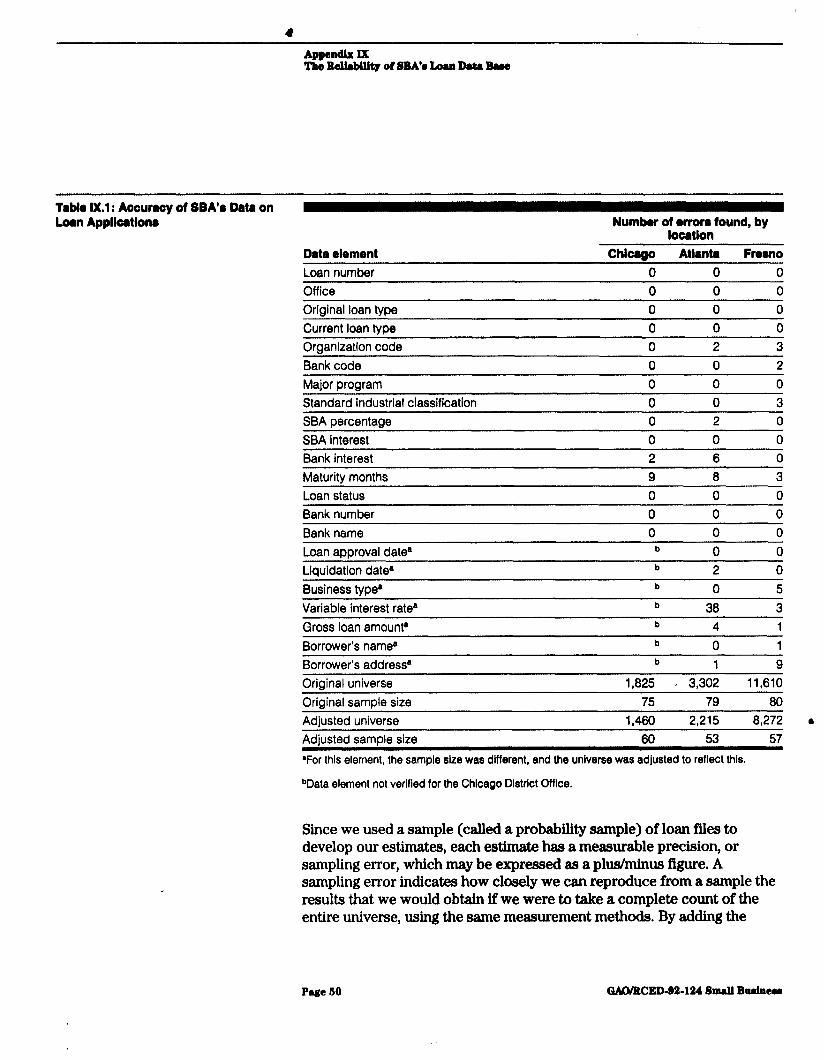
T&la IX.1 : Aoourrcy of SBA’a Data on Loan Appllcatlonr Number of l rrora found, by
locatlon Data element Chlcrlro Atlanta Fretmo Loan number 0 0 0 Off ice 0 0 0 Oriainal loan No0 0 0 0 Current loan type 0 0 0
Organization code 0 2 3 Bank code 0 0 2
Major program 0 0 0
Standard industrial classification 0 0 3 SBA percentaoe 0 2 0
SBA interest 0 0 0 Bank interest 2 6 0
Maturity months 9 0 3
Loan status 0 0 0 Bank number 0 0 0
Bank name 0 0 0
Loan approval date4 b 0 0 Liquidation date” b 2 0
Business type’ b 0 5
Variable interest rate0 b 38 3
Gross loan amounta b 4 1
Borrower’s name0 b 0 1
Borrower’s address’ b 1 9 Original universe 1,825 ’ 3,302 11,610
Original sample size 75 79 80 Adiusted universe 1,460 2,215 8,272 6
Adiusted samole size 60 53 57
OFor this element, the sample size was different, and the universe was adjusted to reflect this.
bData element not verified for the Chicago District Office.
Since we used a sample (called a probability sample) of loan files to develop our estimates, each estimate has a measurable precision, or sampling error, which may be expressed as a plus/minus figure. A sampling error indicates how closely we can reproduce from a sample the results that we would obtain if we were to take a complete count of the entire universe, using the same measurement methods. By adding the
Page 60 GAYItCED-B2-124 Small Budneu
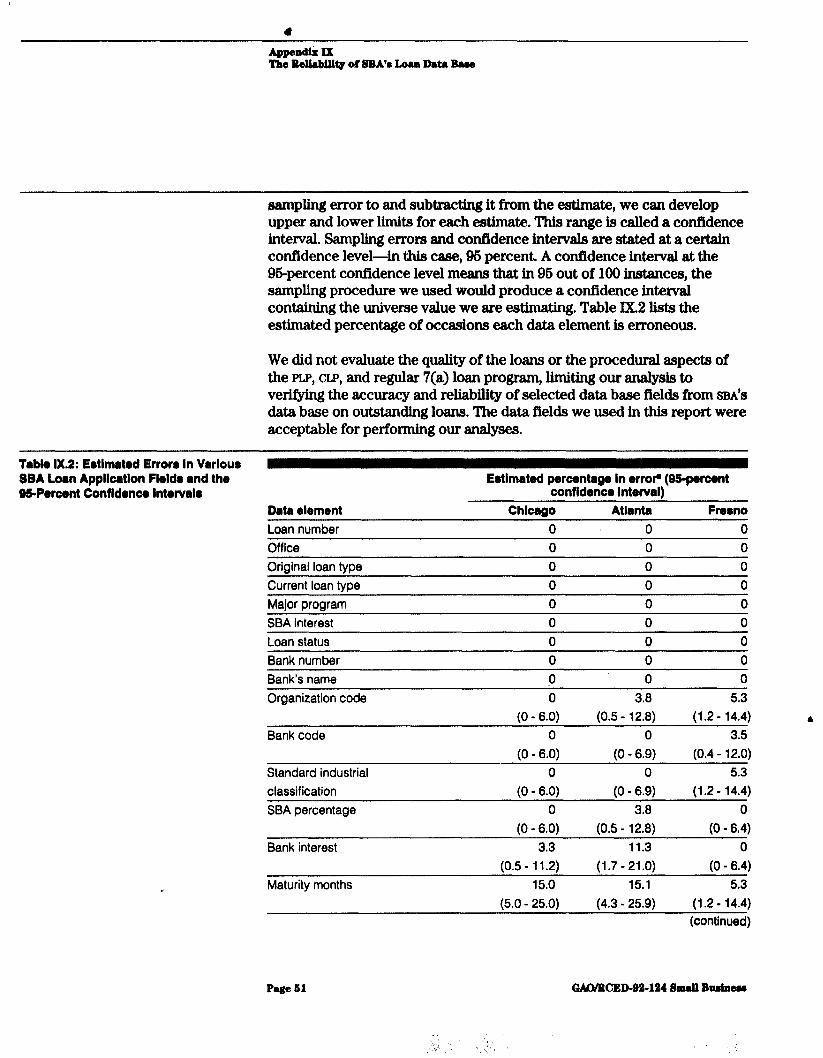
AppendtiE Ix The BeAhblUtg of SBA’r Loan Data Ban
sampling error to and subtracting it from the estimate, we can develop upper and lower limits for each estimate. This range is called a confjdence interval. SampUng errors and confidence intervals are stated at a certain confidence level-in this case, 96 percent. A confidence interval at the Qbpercent confidence level means that in 96 out of 100 instances, the sampling procedure we used would produce a confidence interval containing the universe value we are estimating. Table IX.2 lists the estimated percentage of occasions each data element is erroneous.
We did not evaluate the quality of the loans or the procedural aspects of the PIP, CLP, and regular 7(a) loan program, limiting our analysis to verifying the accuracy and reliability of selected data base fields from SBA’S data base on outstanding loans. The data fields we used in this report were acceptable for performing our analyses.
Table 1X.2: Eotlmatod Error8 In Varlour SBA Loan Appllcatlon Floldr and the QllcPercont Confldonw Intorvala
Data element
Estimated percentage In orrop (QS-perwnt confldenco Intenral)
Chicago Atlanta Fresno Loan number 0 ’ 0 0 Office 0 0 0
Oriainal loan tvoe 0 0 0 Current loan type 0 0 0
Major program 0 0 0
SBA interest 0 0 0
Loan status 0 Q 0
Bank number 0 0 0
Bank’s name
Organization code P 0 0
0 3.8 5.3 (0 - 6.0) (0.5 - 12.8) (1.2 - 14.4)
Bank code
Standard industrial
classification
0 0 3.5
(0 - 6.0) (0 - 6.9) (0.4 - 12.0)
0 0 5.3
(0 - 6.0) (0 - 6.9) (1.2 - 14.4)
SBA percentage
Bank interest
Maturity months
0 3.0
(0 - 6.0) (0.5 - 12.8)
3.3 11.3
(0.5 - 11.2) (1.7 - 21.0)
15.0 15.1
(5.0 - 25.0) (4.3 - 25.9)
0
(0 - 6.4) 0
(0 - 6.4) 5.3
(1.2 - 14.4) (continued)
Page 61 GAO/WED-92-124 Small Buaineu

Data element Loan approval date
Llquldation date
Business type
Variable interest rate
Wlmated porwntago In l rroP (W-porwnt oonfldenoo Intaml)
Chlcrgo Atlanta FtOUW b 0 0
(0 - 7.3) (0 - 16.1) b 4.2 0
(0.6 - 14.1) (0 - 6.6) b 0 9.1
(0 - 9.4) (3.2 - 19.6) b 97.6 5.4
(87.6 - 99.9) 11.2 - 14.6)
Gross loan amount b 8.0 1.8
(2.4 - 18.9) (0 - 9.6) Borrower’s name
Borrower’s address
b 0 1.8
(0 - 7.3) (0 - 9.6) b 2.0 16.1
*Except where noted, the data elements with zero errors are estimated to have confidence intervals of 0 - 6.0 percent In the Chicago District Office, 0 - 6.9 percent In the Atlanta Dlstrlct Office, and 0 - 6.4 percent in the Fresno Service Center. Estimated errors and confidence intervals are calculated on the basis of the number of error8 for the adlusted universe and 8ample size, as shown in table VII.1,
bData element not verified for the Chicago District Office.
Page 12 QAaRLCED-92-124 Small Buainam

Appendix X
Major Contrilmtdrs to This Report
; Resources, Community,and
Mathew J. S&b, Assignment Manager
Economic Development D ivision, Washington,D.C.
DetroitRegional Office
James S. Moore, Evaluatox-in-Charge Laurie Bruneel Arora, Evaluator Edmund 0. Price, Programmer/Analyst
ChicagoRegional Office
John Zarem, Programmer/Analyst
as0948 Page 58 OADIBCED-92-124 Small Budaer


Ordt*ring Information
The first copy of each GAO report and testimony is free. Additional copies are $2 each. Orders should be sent to the following address, accompanied by a check or money order made out to the Superin- t.endent of Documents, when necessary. Orders for 100 or more copies to be mailed to a single address are discounted 25 percent,.
l1.S. (;eneral Accounting Office P.O. Box 60 15 (;ait.hvrs burg, MD 20877
Ordt~rs may also be placed by calling (202) 2756241.

.__..___ ..__. -.. ..---.. .-..... __.._. . ~. .- ---...----.-....-.--