analysis of risk, threshold and issues and monitoring ... · suretrak, evolve and inspire. ......
TRANSCRIPT
International Journal of Emerging Trends & Technology in Computer Science (IJETTCS)
Web Site: www.ijettcs.org Email: [email protected] Volume 5, Issue 3, May-June 2016 ISSN 2278-6856
Volume 5, Issue 3, May – June 2016 Page 171
Abstract Project monitoring and control is the process of collecting, recording, and reporting information concerning project performance. Project controlling uses the data from monitor activity to bring actual performance to planned performance. The present study deals with the project monitoring process of “Standard Design Factory”, a three storied (G+2) factory building whose construction is in progress at Salem, Tamil Nadu. A comparison between the planned progress of construction work and actual progress is performed in this study using project management software Primavera P6. Despite well-established principles and policies of project monitoring the process itself may not be efficiently accomplished in a project, because of those practical problems existing or arising in the project. Such an attempt in realizing the practical problems in implementation of project monitoring and control will contribute to proper recognition of the problem areas and putting in place the control process to rectify the deviations. Keywords: Risk, Threshold, Monitoring Schedule, Building Construction, PPM Software 1. INTRODUCTION 1.1 General Construction industry is an integral component of a nation’s infrastructure and industrial growth. Even though construction industry is the second largest industry in India, the growth of this industry has been differential across the nation. The rural regions need tools for economic development, land use and environment planning to cope with the status of development in urban areas. The time available to achieve this goal is shrinking. Here arises the need for effective project management. Many issues are being faced by construction industry that must be taken care of. They include time and cost overruns due to inadequate project formulation, poor planning for implementation, lack of proper contract planning and management and lack of proper management during execution. It has been estimated by analysts that average cost of a project goes up by 30
percentage compared to the budgeted cost. Observations show that proper skillful management is imperative for the timely completion of the project within estimated budget and with allocated resources. Projects with good planning, adequate organizational machinery and sufficient flow of resources cannot automatically achieve the desired result. There must be some warning mechanism, which can alert the organization about its possible success and failures, off and on. Project monitoring is the process of collecting, recording, and reporting information concerning project performance that project manager and others wish to know. Monitoring involves watching the progress of the project against time, resources and performance schedule during execution of the project and identifying lagging areas requiring timely attention and action whereas project controlling uses data from monitor activity to bring actual performance to planned performance. 1.2 Objectives The main objectives of this study are To suggest the importance and purpose of monitoring
the construction work. To suggest guidelines to contractors for updating the
project. To present an ideal schedule for the factory
construction process. To suggest a layout for updating the schedule. Earned value analysis and tracking for the Standard
design factory construction work.
This study is mainly done using Primavera P6, project management software. All activities and their sequence of occurrence, duration, resources required and costs involved are studied. The organizational breakdown structure of company and work breakdown structure of the project are noted. Tacking of the completed activities and earned value analysis are done. This gives an idea about the resources involved and financial aspect of the completed work. “Project management is the application of knowledge, skills, tools and techniques to project
Analysis Of Risk, Threshold And Issues And Monitoring Schedule Of Building Construction
Using PPM Software
T.Subramani1, Kurian Jacob2
1Professor & Dean, Department of Civil Engineering, VMKV Engg. College, Vinayaka Missions University, Salem, India
2PG Student of Construction Engineering and Management, Department of Civil Engineering, VMKV Engg. College,
Vinayaka Missions University, Salem, India

International Journal of Emerging Trends & Technology in Computer Science (IJETTCS)
Web Site: www.ijettcs.org Email: [email protected] Volume 5, Issue 3, May-June 2016 ISSN 2278-6856
Volume 5, Issue 3, May – June 2016 Page 172
activities to meet the project requirements” (PMBOK, 2008). K K Chithkara (1998) has defined project management as an art and science of mobilizing and managing people, materials, equipment and money to complete the assigned project work on time within budgeted costs and specified technical performance standards. Mainly project management process comprises five process groups (PMBOK, 2008). They are initiating, planning, executing, monitoring and controlling, and closing. Monitor and control of project work is the process of tracking, reviewing and regulating the progress to meet the performance objectives defined in project management plan. Monitoring is an aspect of project management performed throughout the project. 2.CASE STUDY 2.1 Standard Design Factory Project Standard design factory is one of the leading projects undertaken by Tamil nadu contracting company in Salem. It involves construction of factory buildings of a typical design (plan) at various locations spread across Tamil Nadu. (Figure.1.)
Table.1. Case Study Details
Total contract value of the structural work project is 7crores with total built up area 5472 sq. Construction of G+2(three storied) RCC framed building to be used as Standard design factory at Salem is expected to complete within 21 months. Main steps involved in factory construction work apart from initial planning are Mobilization Piling Column& beam concreting Slab & stair concreting Post concreting works Masonry work Plastering Flooring, doing
External wall plastering Finishing
3. ABOUT THE SOFTWARE Primavera was launched in 1983 by Primavera Systems Inc. and was acquired by Oracle Corporation in 2008.Primavera software includes project management, product management, collaboration and control capabilities and integrates with other enterprise software such as Oracle and SAP’s ERP systems. Primavera Systems Inc. provides project and program management software for the Architecture, Engineering and Construction industry. Focused on project portfolio management, or PPM, Primavera solutions let users measure progress, assure governance, improve team collaboration and prioritize project investments and resources. Primavera's software packages include P6, Prosight, Contract Manager, Cost Manager, Pert master, SureTrak, Evolve and Inspire. The newest addition to the suite of project management solutions is Primavera P6, which is an integrated PPM (project portfolio management) solution that provides a real-time view of portfolio performance. P6 also offers what-if scenario modeling, tabular scorecards and capacity analysis. The hardware requirements of Primavera software vary depending on a client's specific needs, but some general technical specifications apply to all software packages: 4. METHODOLOGY OF MONITORING THE PROJECT WITH PRIMAVERA The construction projects have become so vast and complex that the application of information technology has become inevitable. Companies started developing software’s for project management such as Primavera P6, P3, Microsoft project, etc. This study involves monitoring and controlling the project using Primavera P6. The progress at site must be incorporated in the Primavera schedule and updated. These updates needs to be thoroughly monitored using Primavera. Tools and techniques involved in this process are: Earned value management (EVM)
Earned value management is a commonly used method of performance measurement. It integrates scope, cost, and schedule measures to help the project management team assess and measure project performance and progress. This technique requires the formation of an integrated baseline against which performance is measured for the duration of the project (Figure.1,Figure.2 And Figure3.). This can be effectively done in Primavera.
Cost performance baseline The project performance baseline is used to measure, monitor, and control overall cost performance on the project. Work performance measurements

International Journal of Emerging Trends & Technology in Computer Science (IJETTCS)
Web Site: www.ijettcs.org Email: [email protected] Volume 5, Issue 3, May-June 2016 ISSN 2278-6856
Volume 5, Issue 3, May – June 2016 Page 173
The calculated cost variance, schedule variance, CPI, values for WBS components, in particular the work packages and control accounts, needs to be documented and communicated to stakeholders. Steps involved in monitoring and control of SDF project are 4.1 Creating an ideal schedule To create a schedule for any project, first step is to collect data available for the project. Subsequently the following steps can be followed in Primavera. 4.1.1 Enterprise project structure (EPS) Create the structure of the company with its branches, which is executing the project. This is known as Enterprise project structure (EPS). 4.1.2 Organizational breakdown structure (OBS) After the EPS, OBS is created which is a hierarchy that reflects the persons responsible for the projects in the enterprise. 4.1.3 Creating new projects A project is a set of activities and associated information that constitutes a plan for creating a product or service. The project is created under the respective divisions in EPS and assigned the person in charge from OBS to it. The project can be given planned start and must finish dates. The project is assigned a calendar which can be global, resource or project calendar. 4.1.4 Work breakdown structure (WBS) WBS is a hierarchy of work that must be accomplished to complete a project. Each project has its own WBS hierarchy with top level WBS element being equal to that of each EPS node or project. Each WBS element may contain more detailed WBS levels, activities, or both. 4.2 Defining activities Activities are the fundamental work elements of a project and form the lowest level of a WBS and, are the smallest subdivision of a project. An activity has the following characteristics like activity ID, name, start and finish dates, activity calendar, activity type, activity codes, constraints, expenses, predecessor and successor relationships, resources, roles etc. Relationship between activities To from a network, the activities should be connected to each other, which is done by assigning preceding and succeeding activities with significant relationship to the activities. Finish to start (FS) relationship. Finish to finish (FF) relationship. Start to start (SS) relationship.
Start to finish (SF) relationship. 4.2.1 Determining activity duration When planning the work, the duration is entered in the original duration field. The actual duration can only be entered for the activities, which are completed. 4.2.2 Activity dates The following are the types of activity dates available in the primavera; actual start, actual finish, planned start, planned finish. 4.2.3 Activity cost The activity cost is the sum of all the cost incurred to complete the activity. 4.2.4 Creating baselines A simple baseline plan is a complete copy of the original schedule which provides a target against which a project’s performance is tracked. 4.2.5 Updating schedule If the project is progressing exactly as planned, then
only needed to estimate progress. If the project is not progressing as planned many
activities are starting out-of-sequence, actual resource use is exceeding planned use, and then update should be done for activities and resources individually.
Most projects contain some activities that progress as planned and some which do not. In this case, the best method is to combine the two updating methods.
4.2.6 Tracking Tracking window is used for monitoring a project’s progress using different types of layouts such as labour costs, project cost, resource forecasting, resource allocation unit wise and cost wise. 4.2.7 Earned value Earned value is a technique for measuring project performance according to both project cost and schedule. The technique compares the budgeted cost of the work to the actual cost. 4.2.8 Claim digger The claim digger is a schedule analysis tool that enables a company to generate a report that compares selected data fields in a revised project and a corresponding baseline. 4.2.9 Project thresholds Project thresholds consist of parameters assigned to WBS elements; they are used to monitor projects and generate issues

International Journal of Emerging Trends & Technology in Computer Science (IJETTCS)
Web Site: www.ijettcs.org Email: [email protected] Volume 5, Issue 3, May-June 2016 ISSN 2278-6856
Volume 5, Issue 3, May – June 2016 Page 174
4.2.10 Project issues Project issues are the problems within a schedule that must be addressed before the project can be completed. They can either be created by thresholds or manually. Preliminary steps to be done in updating. Choose project. Maintain baseline. Then add and save a copy of current project as a new baseline B1. Then choose project baseline as B1 and assign primary baseline as B1. 4.3 Daily updates to be made: a) Start date and end date Choose the activity to be updated. Then in the activity details window, select status tab. Then tick mark started if the activity has been started and select the date. Tick mark finished if the activity has been finished and select the finish date. b) Resource In activity details window, select resource tab. Then select the resources which are to be added to the particular activity c) Code In activity details window, select code tab. Then select the activity code for each resource. d) Notebook In activity details window, select notebook tab. Select the topic which we want to note and write the details in notebook topic. e) Steps In activity details window, select steps tab. Then if the activity has any steps update the activity in percentage complete and put a tick mark if the activity has been completed. f) Feedback In activity details window, select feedback tab. Then the details for the resources have to be mentioned in feedback. g)Work products and documents (WPs&Docs) In activity details window, select the WPs & Docs tab. Then the drawings, documents, specifications have to be uploaded here. Weekly updates to be made: a) Threshold In directory bar choose threshold tab. Then 3 variances are to be monitored regularly; finished date variance, start date variance and cost variance. b) Issues In directory bar choose project issues. The values which fall outside the threshold values are indicated in the issues. Contractor also has to add issues if there are any. c) Reports Choose tools. Then choose the data date which we want to update the progress. All the activities done in that week has to be selected. Then select update progress.
4.4.Schedule Analysis And Forecasting Schedule variance (SV)
It determines whether a project is behind or ahead of the schedule. It is calculated by subtracting planned value from the earned value.
Schedule performance index (SPI) It indicates efficiency with which the project team is using its time.
Cost analysis and forecasting Cost variance (CV)
It shows whether a project is under or over budget. Cost performance index (CPI)
It is one of the clearest indicators of the cumulative cost efficiency of the project.
Cost performance index (CPI) = Earned value (EV) / Actual cost (AC)
Figure. 1 Ground Floor Plan
Figure.2 First Floor Plan
International Journal of Emerging Trends & Technology in Computer Science (IJETTCS)
Web Site: www.ijettcs.org Email: [email protected] Volume 5, Issue 3, May-June 2016 ISSN 2278-6856
Volume 5, Issue 3, May – June 2016 Page 175
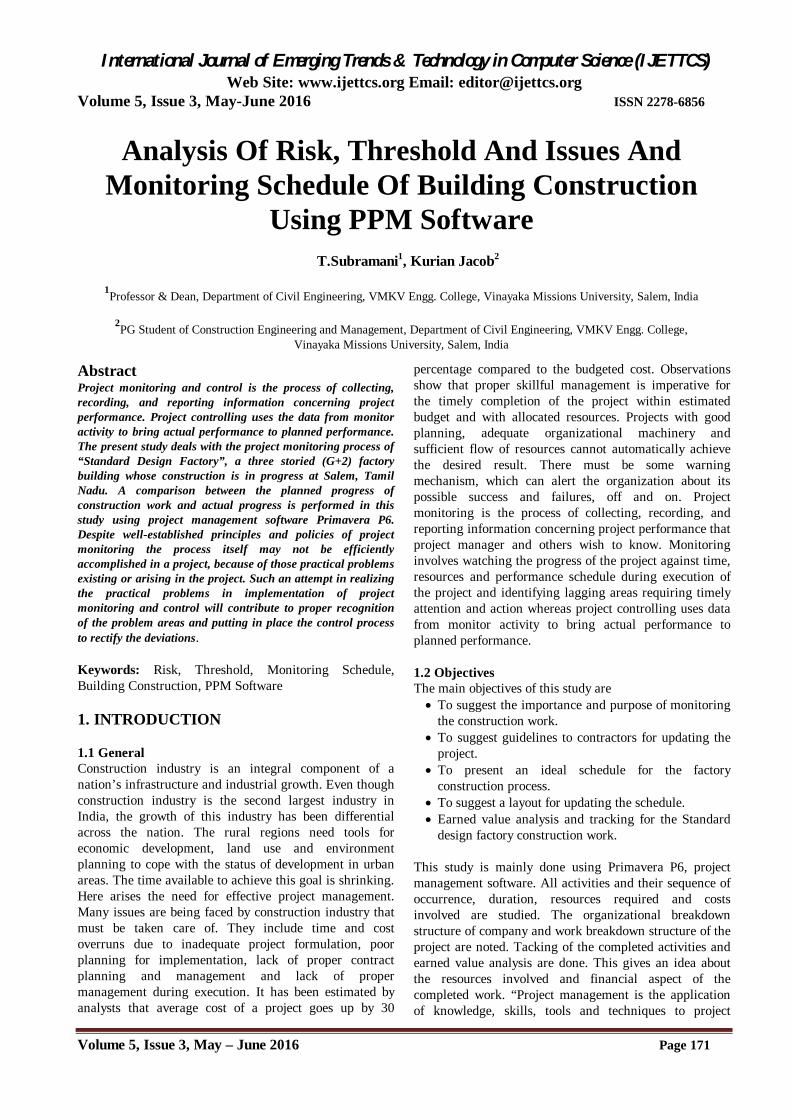
Figure. 3 Second Floor Plan
5. RESULTS AND DISCUSSIONS
5.1 Management Process In Factory Project The management team including project manager, planning manager, construction manager, quality and safety incharges work as a whole for all the activities. .Ideal baseline for Standard design factory An ideal baseline B1 was created in Primavera for the SDF case study. The work breakdown structure, activities and steps for activities are being discussed here. The structure for the baseline is presented from the WBS levels. In WBS a level may be again sub divided. Activities come under the WBS.
5.1.1 Gantt chart 1. The time scale of the gantt chart should be weekly
basis. 2. All relationships should be clearly given in the gantt
chart. (Figure.4)
Figure.4 Gantt Chart Window
5.1.2 Calendar The work is carried out in 6 days per week. So the standard 6 day workweek calendar is made with necessary holidays in it. A break of one hour is given in the afternoon. (Figure.5 and Figure.6)
Figure. 5 Global Calendar
Figure.6 Detailed Work Hours/Day
5.1.3 Activity usage spreadsheet and resource usage spreadsheet These two spreadsheets reflect the usage of resources and progress of activities at any stage of the construction project. This is based on classic WBS layout
International Journal of Emerging Trends & Technology in Computer Science (IJETTCS)
Web Site: www.ijettcs.org Email: [email protected] Volume 5, Issue 3, May-June 2016 ISSN 2278-6856
Volume 5, Issue 3, May – June 2016 Page 176
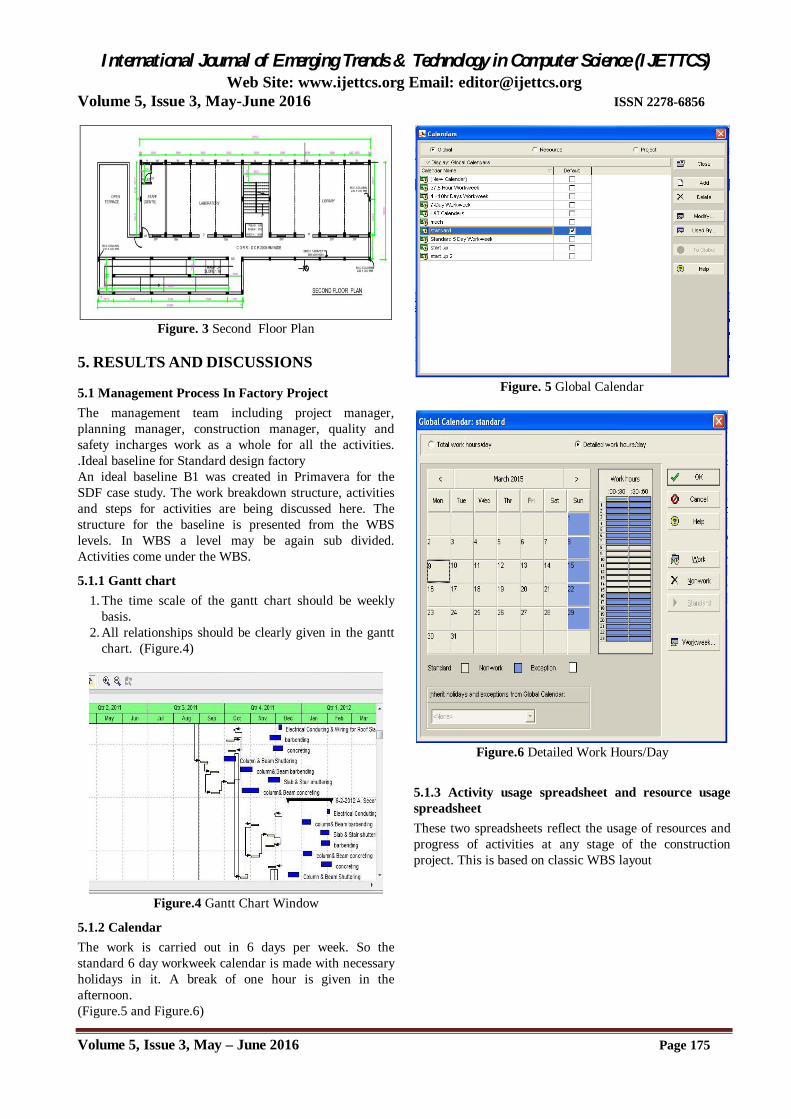
Figure.7 Activity Diagram(1)
Figure.8 Activity Diagram(2)
Figure. 9 Resource Usage Spreadsheet Window
4.3 5.1.4 Activity usage profile and resource usage profile These show graphical representation of cumulative values activity usage and resource usage at any stage of the construction project. This is based on classic WBS layout. Figure.7 shows Activity Diagram(1), Figure.8 shows Activity Diagram(2) and Figure. 9 shows Resource Usage Spreadsheet Window.
Figure.10 Resources(1)

International Journal of Emerging Trends & Technology in Computer Science (IJETTCS)
Web Site: www.ijettcs.org Email: [email protected] Volume 5, Issue 3, May-June 2016 ISSN 2278-6856
Volume 5, Issue 3, May – June 2016 Page 177
Figure.11 Resources(2)
Figure.12 Labour Salary/Day(1)
Figure.10 shows Resources(1), Figure.11 shows Resources(2), Figure.12 shows Labour Salary/Day(1).Figure.13 shows Labour Salary/Day(2) Figure.14 shows Activity Usage Profile Window and Figure.15 shows Resource Usage Profile Window
Figure.13 Labour Salary/Day(2)
Figure.14 Activity Usage Profile Window
Figure.15 Resource Usage Profile Window
Based on the guidelines from literature review and methodology described, it was possible to monitor the progress of SDF construction project. Till now we have gone through step by step procedure followed in monitoring the project using Primavera P6. The numerical results obtained after following the previously mentioned methodology is discussed in the following sections.
6.2 Master Schedule With Key Dates A schedule is being created using the key dates of the activities. The baseline project start date is on 15th March 2011 and baseline project finish date is on 20th August 2012. The actual start of project was on 15th March 2011. It shows that the actual start of project was as per baseline schedule. After knowing the dates of all key activities, all the constituent activities are arranged sequentially and logically to form a schedule. This schedule shows a slow and ever increasing gap between baseline schedule and

International Journal of Emerging Trends & Technology in Computer Science (IJETTCS)
Web Site: www.ijettcs.org Email: [email protected] Volume 5, Issue 3, May-June 2016 ISSN 2278-6856
Volume 5, Issue 3, May – June 2016 Page 178
actual work progress. The actual progress started shifting from planned schedule, from the second activity mobilisation of resources itself. (Figure.16 and Figure.17)
Figure.16 Project Report (Scheduling) 1
6.3 Resource Assignments And Usage The resource assignment window shows all the resource assignments, grouped by resource for the project. An approximate rate analysis was done to arrive at rates of individual resource groups, considering the various component resources. Most of the resources are taken as material. Machines are taken as non–labour and human involvement is listed as labour. The resource usage profile obtained using Primavera P6 shows that there has been a slight variation in the quantity of each resource used during the project life cycle.
Figure.17 Project Report (Scheduling) 2
6.4 Tracking Of The Standard Design Factory Project Tracking a project is very important in mega projects. While updating the schedule time to time, it was reviewed and the revised allocation of resources and the budgeted cost is estimated. All the associated resources of a project are tracked and kept record.
6.5 Threshold Calculation The parameter which is checked in the threshold is start day variance and finish day variance for the started activities. Threshold calculation of the factory project shows that 88 activities show start date variance and 88 activities show finish date variance. All these thresholds which fall outside are reported as issues. Hence 88 issues are identified for finish date variance and 88 issues are identified for start date variance. (Figure.18)
Figure.18 Project Threasholds
6.6 Delay Analysis The following reasons were observed during this thesis work, which can be held responsible for delays; Lack of knowledge about advanced tracking methods and softwares. Insufficiently skilled staff. Lack of proper fund flow throughout the project
progress A major portion of labour force was from West
Bengal and Orissa. Regional festivals in these areas cause sudden delays in work progress.
Even though delay due to monsoon rain was already accounted in the baseline schedule, unexpected extension of monsoon caused further delay in project progress.
Sand unavailability due to legal restrictions. Late delivery of resources.
International Journal of Emerging Trends & Technology in Computer Science (IJETTCS)
Web Site: www.ijettcs.org Email: [email protected] Volume 5, Issue 3, May-June 2016 ISSN 2278-6856
Volume 5, Issue 3, May – June 2016 Page 179
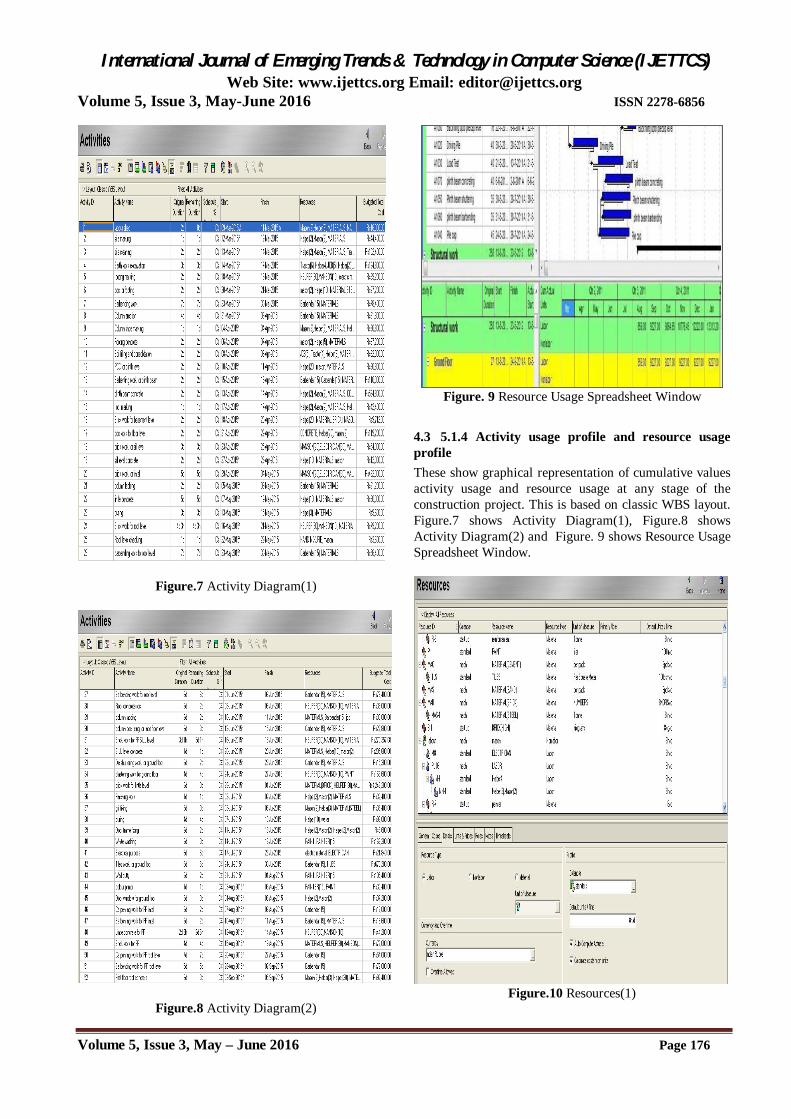
Figure.19 Project Risk
Figure.19 shows Project Risk, Figure.20 shows Project Risk, Figure.21 shows Project Issues
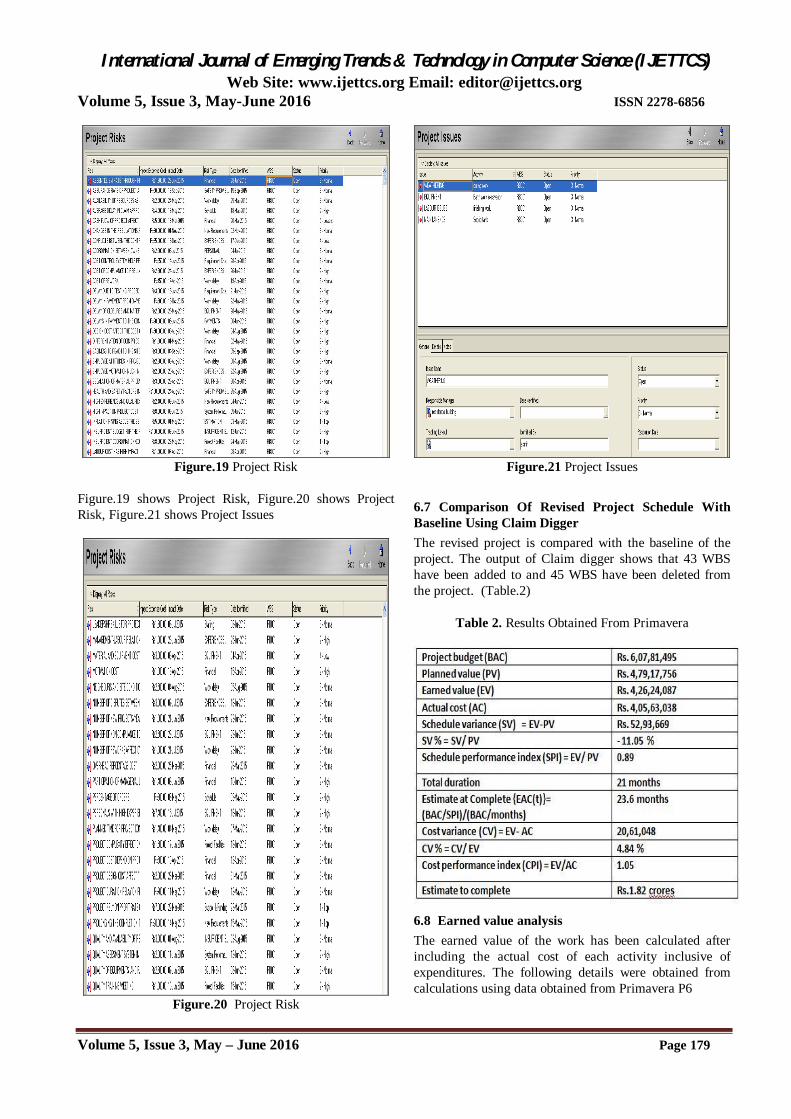
Figure.20 Project Risk
Figure.21 Project Issues
6.7 Comparison Of Revised Project Schedule With Baseline Using Claim Digger The revised project is compared with the baseline of the project. The output of Claim digger shows that 43 WBS have been added to and 45 WBS have been deleted from the project. (Table.2)
Table 2. Results Obtained From Primavera
6.8 Earned value analysis The earned value of the work has been calculated after including the actual cost of each activity inclusive of expenditures. The following details were obtained from calculations using data obtained from Primavera P6

International Journal of Emerging Trends & Technology in Computer Science (IJETTCS)
Web Site: www.ijettcs.org Email: [email protected] Volume 5, Issue 3, May-June 2016 ISSN 2278-6856
Volume 5, Issue 3, May – June 2016 Page 180
6.9 S Curve It is graphical representation of financial cash flow of a project. It is derived from activity usage profile, and it shows in Figure.22 and it is a “S like shape, flatter at the beginning and end and steeper in the middle. This shows that costs involved in the project is low in the beginning as well as in the end, whereas it increases at a rapid rate when the project is in its middle stage.
Figure.22 S-Curve Of Sdf Project
7. CONCLUSIONS The main objective of this study was to understand the role of monitoring and control in the progress and timely completion of a construction project. This objective was achieved through revision of literatures and methodologies involved in monitoring and control. The case study proved to be a guideline in understanding the progress of Standard design factory construction work and also to identify the specific problems arising during the process. Results of this study show the drawbacks of the present project management system in SDF project and the importance efficient planning, monitoring and controlling, as well as the need and effectiveness of a project management software like Primavera P6 in a construction project. Summary of the results obtained from the case study lead to following conclusions. Project progress is 51.73% of the total work after
consuming 62.48% of the total estimated project duration.
The project has a negative value for schedule variance (SV) which means that the project is behind schedule.
Schedule variance percentage is -11.05% therefore the project is 11.05 percent behind schedule.
A SPI of 0.89 would tell us that the project is only progressing at 89 % of the rate originally planned.
The originally estimated completion time for the project was 21 months, so the project manager now knows that if work continues at the current rate the
project will take 2.6 months longer than originally planned as time estimate at completion is 23.6 months.
The project has a favourable cost variance of 20,61,048. A positive value of CV means that the project is over budget.
Cost variance percentage is 4.84% therefore the project is 4.84 % below budget for the work performed till 31st March 2012, excluding penalties applicable due to delays.
A CPI of 1.05 would tell us that the project is currently running within budget.
Estimate to complete shows that Rs.1.82 crores is the expected cost required to finish all the remaining work.
88 issues in finish date variances and 88 issues in start date variances are reported when the finish date variance threshold and start date variance thresholds are monitored.
Comparison of revised project schedule with baseline of shows that 41 WBS have been added and 43 WBS have been deleted.
Generally it can be concluded that Inadequacy in implementation of monitoring policies
has been observed. Primavera 6 proves to be an efficient tool in
monitoring and controlling any construction project as the time and effort in updating is reduced drastically by this specific layout.
References [1]. T.Subramani, V.Jayaraman , " Analysis Of
Construction Workers Migrate From Industries" , International Journal of Application or Innovation in Engineering & Management (IJAIEM) , Volume 4, Issue 5, pp. 274-283 , 2015
[2]. T.Subramani, M.Sekar , " Preplanning And Scheduling Of Road Construction By Using PPM" , International Journal of Application or Innovation in Engineering & Management (IJAIEM) , Volume 4, Issue 5, pp. 234-244 , 2015
[3]. T.Subramani, K.Chinnadurai , " Construction Management And Scheduling Of Residential Building Using Primavera" International Journal of Application or Innovation in Engineering & Management (IJAIEM) , Volume 4, Issue 5, pp. 188-198 , 2015
[4]. T.Subramani., P.S.Sruthi,.M.Kavitha. , “Causes Of Cost Overrun In Construction”, IOSR Journal of Engineering, Volume. 4, Issue. 6 (Version 3), pp 1 - 7, 2014.
[5]. T.Subramani., A.Sarkunam., J.Jayalakshmi “Planning And Scheduling Of High Rise Building Using Primavera” , International Journal of Engineering Research and Applications, Volume. 4, Issue. 6 (Version 5), pp 134 - 144, 2014.

International Journal of Emerging Trends & Technology in Computer Science (IJETTCS)
Web Site: www.ijettcs.org Email: [email protected] Volume 5, Issue 3, May-June 2016 ISSN 2278-6856
Volume 5, Issue 3, May – June 2016 Page 181
[6]. T.Subramani., P.T.Lishitha, M.Kavitha, “Time Overrun And Cost Effectiveness In The Construction Industry”, International Journal of Engineering Research and Applications, Volume. 4, Issue. 6 (Version 5), pp 111- 116, 2014.
[7]. T.Subramani., R.Lordsonmillar., “Safety Management Analysis In Construction Industry”, International Journal of Engineering Research and Applications, Volume. 4, Issue. 6 (Version 5), pp 117- 120, 2014.
AUTHORS
Prof. Dr.T.Subramani Working as a Professor and Dean of Civil Engineering in VMKV Engg. College, Vinayaka Missions University, Salem, Tamil Nadu, India. Having more than 25 years of Teaching experience in Various
Engineering Colleges. He is a Chartered Civil Engineer and Approved Valuer for many banks. Chairman and Member in Board of Studies of Civil Engineering branch. Question paper setter and Valuer for UG and PG Courses of Civil Engineering in number of Universities. Life Fellow in Institution of Engineers (India) and Institution of Valuers. Life member in number of Technical Societies and Educational bodies. Guided more than 400 students in UG projects and 220 students in PG projects. He is a reviewer for number of International Journals and published 136 International Journal Publications and presented more than 30 papers in International Conferences.
Kurian Jacob, Completed his Bachelor of Engineering in the branch of Civil Engineering in V.M.K.V. Engineering College, Salem. Currently he is doing M.E (Construction Engineering and Management) in V.M.K.V
Engineering College of Vinayaka Missions University, Salem, Tamil Nadu, India.