analysis of rainfall and temperature over climatic zones
TRANSCRIPT

_____________________________________________________________________________________________________ *Corresponding author: E-mail: [email protected];
Journal of Geography, Environment and Earth Science International 11(2): 1-14, 2017; Article no.JGEESI.35304 ISSN: 2454-7352
Analysis of Rainfall and Temperature over Climatic Zones in Nigeria
M. T. Daramola1*, E. O. Eresanya1 and S. C. Erhabor1
1Departmet of Meteorology and Climate Science, Federal University of Technology, Akure, Nigeria.
Authors’ contributions
This work was carried out in collaboration between all authors. Author MTD designed the study,
performed the statistical analysis, wrote the protocol and wrote the first draft of the manuscript. Author EOE managed the analyses of the study. Author SCE managed the literature searches. All authors
read and approved the final manuscript.
Article Information
DOI: 10.9734/JGEESI/2017/35304
Editor(s):
(1) Anthony R. Lupo, Department of Soil, Environmental, and Atmospheric Science, University of Missouri, Columbia, USA.
Reviewers:
(1) Sylvester Odiana, University of Benin, Nigeria.
(2) Crépin B. Pene, Ivory Coast.
(3) Okunlola Oluyemi Adewole, University of Medical Sciences, Nigeria.
Complete Peer review History: http://www.sciencedomain.org/review-history/20361
Received 5th July 2017 Accepted 21st July 2017
Published 4th
August 2017
ABSTRACT This study presents the analysis of rainfall and temperature across the climatic zones in Nigeria. Data from ten Global Circulation Models (GCM) regridded to a 1° x 1° spatial resolution was used in this study. Model evaluation was carried out for the models using ground observed data from Nigerian Meteorological Agency (NIMET). Based on the comparison of the models with ground observed data, the ability of the models in simulating the seasonal pattern of precipitation and temperature over each climatic zone and the whole of Nigeria differ to different degrees. Of the four periods, June, July, August (JJA) showed the highest deviation. The seasonal variation of rainfall and temperature across the climatic zones revealed the influence of the Intertropical Discontinuity (ITD) in rainfall variation across each zone with dual rainfall peak over the Guinea. The rainfall distribution showed that Sahel recorded the lowest rainfall while guinea recorded the highest rainfall. Further analysis revealed that rainfall and temperature varied mostly in the sahel. The trend analysis of rainfall and temperature showed increasing trend in rainfall over the whole of Nigeria under RCP45 and RCP85. There was general increase in temperature for all RCPs across the zones and the whole of Nigeria. Further analysis revealed that sahel will experience more dry
Original Research Article

Daramola et al.; JGEESI, 11(2): 1-14, 2017; Article no.JGEESI.35304
2
years in rainfall and more warm years across the zones for temperature. The changes in rainfall and temperature have implications in various sectors of the economy such as agriculture, water resources and health sector. It is well known that research and development complement each other. It is important that further research be carried out particularly in projecting the change in climate at regional scales. This will provide information about the expected change or variation in climate and hence help in the mitigation of the implications of the change in climate.
Keywords: Seasonal variation; trend; climate model; concentration pathway.
1. INTRODUCTION There is now scientific consensus that the global climate is changing [1]. Observations show that as climate changes, changes are occurring in the amount, intensity, frequency and type of precipitation. These aspects of precipitation generally exhibit large natural variability, and El Niño and changes in atmospheric circulation patterns such as the North Atlantic Oscillation have substantial influence [2]. Several studies have shown that temperature is rising and rainfall frequency and intensity is fluctuating [3-6]. In 2007, the Intergovernmental Panel on Climate Change (IPCC) in its report reflected scientific consensus that climate change is the result of increased levels of greenhouse gases in Earth’s atmosphere and that these increased emissions are primarily the product of the burning of fossil fuels (coal, oil, and natural gas) for energy and practices in agriculture, land use, and forestry. Our present understanding of the climate system and how it is likely to respond to increasing concentrations of greenhouse gases in the atmosphere would be impossible without the use of global climate models (GCMs) [7]. GCMs are powerful computer programs that use physical processes to replicate, as accurately as possible, the functioning of the global climate system. GCMs use mathematical equations to simulate the functioning of the global climate system in three spatial dimensions and in time. Modern climate models include coupled atmosphere, ocean, sea-ice and land-surface components [8]. Climate models have continued to be developed and improved since the Assessment Report (AR4), and many models have been extended into Earth system models by including the representation of biogeochemical cycles important to climate change. These models allow for policy-relevant calculations such as the carbon dioxide (CO2) emissions compatible with a specified climate stabilization target. The climate system is chaotic and for the long period
simulations required to study climate change, these complex models are generally run at a global scale using equations, parameterizations, and assumptions [9–13]. Future climate scenarios show not only possible changes in the mean climate of the Earth system but also changes in extreme weather and climate events. Occurring on time scales from tens of minutes to seasons and longer extreme weather and climate events influence many aspects of human society: economy, ecosystem, health. Possible future changes in intensity and/or frequency of extreme events need new adaptation and risk management strategies taking into account how the statistics of extreme events may change [14]. In 2007, the IPCC responded to calls for improvements to Special Report on Emissions Scenarios (SRES) by catalyzing the process that produced the Representative Concentration Pathways (RCPs). The RCPs are the latest iteration of the scenario process, and are used in IPCC report - Assessment Report Five (AR5) in preference to SRES [15]. In the time line of the 5th assessment report (AR5) of the Intergovernmental Panel on Climate Change (IPCC), the simulations from a new generation of state-of-the-art global climate models (GCM) are becoming available for analysis within the Coupled Model Inter comparison Project Phase 5 (CMIP5) [16]. In comparison with the previous model generation (CMIP3) [17], CMIP5 includes more comprehensive global climate models (i.e., Earth system models) with generally higher spatial resolution enabling the research community to address a wider variety of scientific questions. One important task is the evaluation of CMIP5 model performance in representing not only aspects of the mean climate, but also extreme climate and weather events. Over the last two decades, the analysis of such extreme events have become increasingly important due to the recognition of their significant impacts on society and natural systems [18].

2. MATERIALS AND METHODS
2.1 Study Area
The study area, Nigeria (Fig. 1) was subdivided latitudinally into three zones: Guinea (coast 8°N), Savanna (8°N–11°N) and Sahel (1116°N) following [19].
2.2 Climate Models
In this study, data from ten global climate models (GCMs) (Table 1) obtained from the Canadian Climate Data and Scenarios database were used. The dataset comprises of 29/29/29
Fig. 1. Map of Nigeria the study area showing the climatic zones
Table 1. List of Models used for the study
Modeling 1 College of Global Change and Earth System Science, Beijing
Normal University (GCESS) 2 NCAR Community Climate System Model, (CCSM)3 Centre National de Recherches Météorologiques Centre
Européen de Recherche et Formation Avancée en Calcul Scientifique
4 NOAA Geophysical Fluid Dynamics Laboratory (NOAA5 NASA Goddard Institute for Space Studies (NASA GISS)6 NASA Goddard Institute for Space Studies (NASA GISS)7 Met Office Hadley Centre (MOHC)8 Japan Agency for Marine-Earth Science and Technology,
Atmosphere and Ocean Research Institute (The University ofTokyo), and National Institute for Environmental Studies (MIROC)
9 Max-Planck-Institut für Meteorologie (Max PlanckInstitute for Meteorology) MPI-
10 Meteorological Research Institute (MRI)
Daramola et al.; JGEESI, 11(2): 1-14, 2017; Article no.JGEESI.35304
3
HODS
1) was subdivided latitudinally into three zones: Guinea (coast -
N) and Sahel (11°N
In this study, data from ten global climate models (GCMs) (Table 1) obtained from the Canadian Climate Data and Scenarios database were used. The dataset comprises of 29/29/29
scenario experiments for Representative Concentration Partways RCP2.6/4.5/8.5, constructed using the Coupled Model Intercomparison Project (CMIP5) model output from the PCMDI site. The dataset consists of climate model projections that have been regridded onto a common 1 x 1 degree global grid.
2.3 Data Analysis Taylor diagram [20] was used to assess the models’ ability to simulate precipitation and temperature in each sub-region and the whole of Nigeria. Taylor diagram provides a way of
Map of Nigeria the study area showing the climatic zones
Table 1. List of Models used for the study
Modeling group Model name College of Global Change and Earth System Science, Beijing BNU-ESM
Community Climate System Model, (CCSM) CCSM4 Centre National de Recherches Météorologiques Centre
de Recherche et Formation Avancée en Calcul Scientifique
CNRM-CM5
NOAA Geophysical Fluid Dynamics Laboratory (NOAA-GFDL) GFDL-CM3 NASA Goddard Institute for Space Studies (NASA GISS) GISS-E2-H NASA Goddard Institute for Space Studies (NASA GISS) GISS-E2-R Met Office Hadley Centre (MOHC) HadGEM2-ES
Earth Science and Technology, Atmosphere and Ocean Research Institute (The University of Tokyo), and National Institute for Environmental Studies
MIROC5
Institut für Meteorologie (Max Planck -M
MPI-ESM-LR
Meteorological Research Institute (MRI) MRI-CGCM3
; Article no.JGEESI.35304
scenario experiments for Representative Concentration Partways RCP2.6/4.5/8.5, onstructed using the Coupled Model Inter
comparison Project (CMIP5) model output from the PCMDI site. The dataset consists of climate model projections that have been regridded onto a common 1 x 1 degree global grid.
Taylor diagram [20] was used to assess the models’ ability to simulate precipitation and
region and the whole of Nigeria. Taylor diagram provides a way of
Country China
USA France
USA USA USA
UK Japan
Germany
Japan
Daramola et al.; JGEESI, 11(2): 1-14, 2017; Article no.JGEESI.35304
4
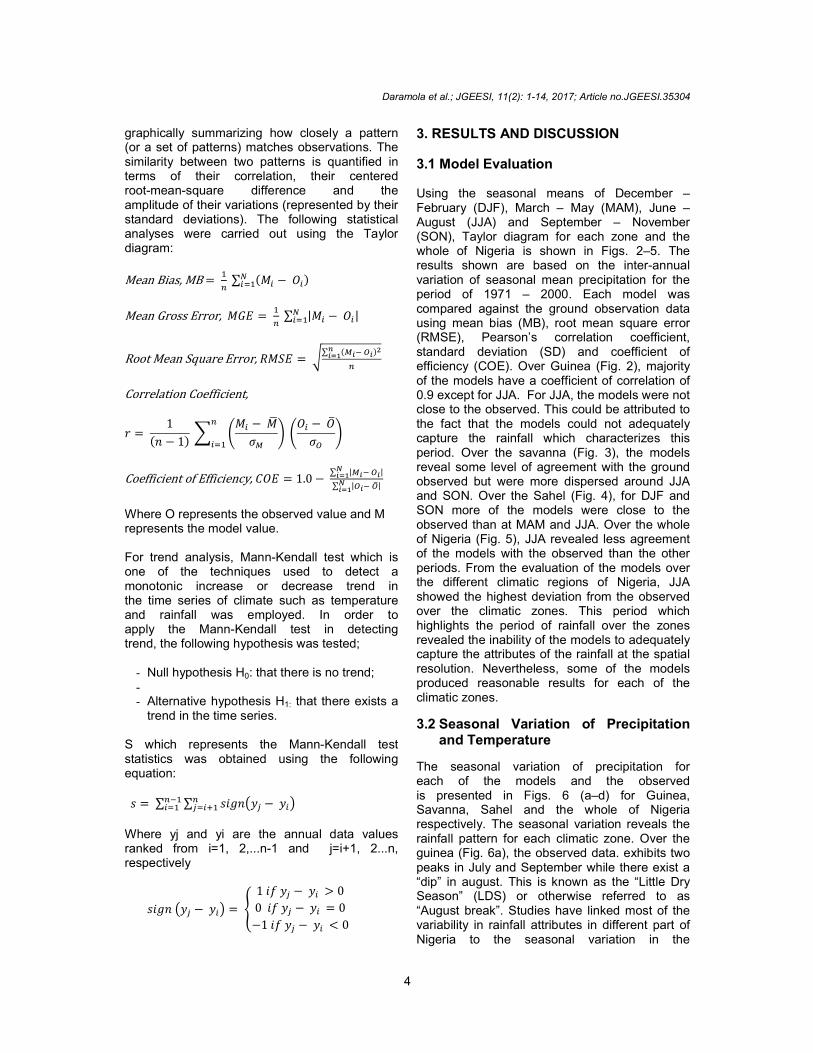
graphically summarizing how closely a pattern (or a set of patterns) matches observations. The similarity between two patterns is quantified in terms of their correlation, their centered root-mean-square difference and the amplitude of their variations (represented by their standard deviations). The following statistical analyses were carried out using the Taylor diagram:
Mean Bias, MB = �
� ∑ (�� − ��)�
���
Mean Gross Error, ��� = �
� ∑ |�� − ��|�
���
Root Mean Square Error, ���� = �∑ (��� ��)��
���
�
Correlation Coefficient,
� = 1
(� − 1) � �
�� − ��
��
� ��� − ��
��
��
���
Coefficient of Efficiency, ��� = 1.0 − ∑ |��� ��|�
���
∑ |��� ��|����
Where O represents the observed value and M represents the model value. For trend analysis, Mann-Kendall test which is one of the techniques used to detect a monotonic increase or decrease trend in the time series of climate such as temperature and rainfall was employed. In order to apply the Mann-Kendall test in detecting trend, the following hypothesis was tested;
- Null hypothesis H0: that there is no trend; - - Alternative hypothesis H1: that there exists a
trend in the time series. S which represents the Mann-Kendall test statistics was obtained using the following equation:
� = ∑ ∑ ������� − ���������
������
Where yj and yi are the annual data values ranked from i=1, 2,...n-1 and j=i+1, 2...n, respectively
���� ��� − ��� = �
1 �� �� − �� > 0
0 �� �� − �� = 0
−1 �� �� − �� < 0
�
3. RESULTS AND DISCUSSION
3.1 Model Evaluation Using the seasonal means of December – February (DJF), March – May (MAM), June – August (JJA) and September – November (SON), Taylor diagram for each zone and the whole of Nigeria is shown in Figs. 2–5. The results shown are based on the inter-annual variation of seasonal mean precipitation for the period of 1971 – 2000. Each model was compared against the ground observation data using mean bias (MB), root mean square error (RMSE), Pearson’s correlation coefficient, standard deviation (SD) and coefficient of efficiency (COE). Over Guinea (Fig. 2), majority of the models have a coefficient of correlation of 0.9 except for JJA. For JJA, the models were not close to the observed. This could be attributed to the fact that the models could not adequately capture the rainfall which characterizes this period. Over the savanna (Fig. 3), the models reveal some level of agreement with the ground observed but were more dispersed around JJA and SON. Over the Sahel (Fig. 4), for DJF and SON more of the models were close to the observed than at MAM and JJA. Over the whole of Nigeria (Fig. 5), JJA revealed less agreement of the models with the observed than the other periods. From the evaluation of the models over the different climatic regions of Nigeria, JJA showed the highest deviation from the observed over the climatic zones. This period which highlights the period of rainfall over the zones revealed the inability of the models to adequately capture the attributes of the rainfall at the spatial resolution. Nevertheless, some of the models produced reasonable results for each of the climatic zones.
3.2 Seasonal Variation of Precipitation and Temperature
The seasonal variation of precipitation for each of the models and the observed is presented in Figs. 6 (a–d) for Guinea, Savanna, Sahel and the whole of Nigeria respectively. The seasonal variation reveals the rainfall pattern for each climatic zone. Over the guinea (Fig. 6a), the observed data. exhibits two peaks in July and September while there exist a “dip” in august. This is known as the “Little Dry Season” (LDS) or otherwise referred to as “August break”. Studies have linked most of the variability in rainfall attributes in different part of Nigeria to the seasonal variation in the

Daramola et al.; JGEESI, 11(2): 1-14, 2017; Article no.JGEESI.35304
5
Fig. 2. Precipitation Taylor diagram for models over Guinea for (a) DJF (b) MAM (c) JJA (d) SON from 1971 – 2000
Fig. 3. Precipitation Taylor diagram for models over Savanna for (a) DJF (b) MAM (c) JJA (d) SON from 1971 – 2000
position of ITD during its migration and the resident time over a zone [21]. The ITD reaches its northern limits between latitudes 19.6°N and
22.2°N in August, and its southern extremity between latitudes 5.2°N and 8°N in February [22]. Upon northwards advancement and

Daramola et al.; JGEESI, 11(2): 1-14, 2017; Article no.JGEESI.35304
6
Fig. 4. Precipitation Taylor diagram for models over Sahel for (a) DJF (b) MAM (c) JJA (d) SON from 1971 – 2000
Fig. 5. Precipitation Taylor diagram for models over the whole of Nigeria for (a) DJF (b) MAM (c) JJA (d) SON from 1971 – 2000
southwards retreat, the ITD zones associated with rainfall comes over the guinea twice and once over the sahel. This results in the dual rainfall peaks and single rainfall peak over the guinea and sahel respectively. Over the Savanna and Sahel (Figs. 6b and c), from the observed data, the rainfall peaks in August, over the whole
of Nigeria (Fig. 6d), the rainfall pattern shows maximum values in July through to September. In comparing the rainfall pattern of the models to the observed data, over the Guinea, MIROC5 and BNU-ESM captured the two rainfall peaks for the climatic zone, though BNU-ESM showed the first peak in June, the other was in September.

Daramola et al.; JGEESI, 11(2): 1-14, 2017; Article no.JGEESI.35304
7
MIROC5 shows the same pattern as that of the observed both in July and September even though it over estimates the rainfall. The over estimation of the rainfall amount could be as a result of the spatial resolution of the model. Over the Savanna, GISS-E2-H, MIROC5 and MPI-ESM-LR captures the rainfall peak in August while over Sahel, BNU-ESM, MIROC5 and MPI-ESM-LR captures the seasonal pattern. For the whole of Nigeria (Fig. 6d) the models generally capture the rainfall pattern except for MRI-CGCM3 and CCSM4.
Figs.7 (a - d) show the seasonal variation of the mean temperature for each of the models and the observed for Guinea, Savanna, Sahel and the whole of Nigeria respectively. Over the guinea, from the observed data the temperature variation reveals a wave-like pattern with the high values recorded in February to March and November, December. The temperature drops as year approaches the May though to August. The models generally capture the variation though most of them underestimated the temperature. Similar pattern can be observed over the other climatic zones and the whole of Nigeria.
A summary statistic of the long-term (temporal) series of precipitation for the respective climatic zones is given in Table 2. Rainfall varied mostly in the north (Sahel) with coefficient of variation (CV) of 16.01%, its value ranged from about 1.36 to 2.53 mm/day (mean = 1.84 mm/day). Rainfall values for savanna ranged from about 2.38 to 3.64 mm/day with coefficient of variation (CV) of 7.98%, while rainfall values for guinea ranged from 3.77 to 5.96 mm/day with coefficient of variation (CV) of 10.15%. It can be observed that Sahel records the lowest rainfall while guinea records the highest this could be due to the two rainy seasons the guinea zones experiences. This agrees with Oguntunde et al. [23]. For the country as a whole, precipitation varied from 2.52 to 3.75 mm/day with a mean of 3.28 mm/day with a coefficient of variation of 8.5%. A summary statistic of the long-term (temporal) series of temperature for the respective climatic zones is given in Table 3. Temperature varied most in the sahel and least in the savanna with coefficient of variation (CV) of 1.66% and 1.20 % respectively.
Fig. 6. Mean monthly precipitation for the ground observed and Climate models over (a) Guinea (b) Savanna (c) Sahel and (d) the whole of Nigeria

Daramola et al.; JGEESI, 11(2): 1-14, 2017; Article no.JGEESI.35304
8
Fig. 7. Mean monthly temperature for the ground observed and Climate models over (a) Guinea (b) Savanna (c) Sahel and (d) the whole of Nigeria
Table 2. Summary statistics of precipitation for the climatic zones for 1971 to 2000
Climatic zone Minimum
(mm/day) Maximum (mm/day)
Mean (mm/day) Standard deviation
Coefficient of variation (%)
Guinea 3.77 5.96 4.96 0.50 10.15 Savanna 2.38 3.64 3.05 0.24 7.98 Sahel 1.36 2.53 1.84 0.30 16.01 Nigeria 2.52 3.75 3.28 0.28 8.50
Table 3. Summary statistics of temperature for the climatic zones for 1971 to 2000
Climatic zone
Minimum (°C)
Maximum (°C)
Mean (°C)
standard deviation
Coefficient of variation (%)
Guinea 26.24 27.9 27.02 0.35 1.28 Savanna 26.09 27.47 26.68 0.32 1.20 Sahel 26.38 28.24 27.45 0.46 1.66 Nigeria 26.24 27.85 27.05 0.33 1.22
Based on the comparison of the models with ground observed data, the ability of the models in simulating the seasonal pattern of precipitation and temperature over each climatic zone and the whole of Nigeria differ to different degrees. Based on the degree to which each model simulated the seasonal pattern of precipitation and temperature, MPI-ESM-LR, was used for Sahel and Savanna while MIROC5 was used for Guinea and GISS-E2-R for the whole of Nigeria. For temperature, MIROC5 simulation was the closest of the models for each climatic zone and the whole of Nigeria.
3.3 Trend Analysis On running the Mann-Kendall test on precipitation data, the following results in Tables 4 to 7 were obtained for the climatic zones. Table 4 reveals the trend test for the period of 1971 – 2000 which indicates that the null hypothesis was accepted for guinea and savanna and the null hypothesis was rejected for Sahel and the whole of Nigeria. Rejecting the null hypothesis revealed an increasing trend of precipitation for Sahel and Nigeria with Sahel increasing at the rate of 0.015 mm/day per year and Nigeria increasing at the

Daramola et al.; JGEESI, 11(2): 1-14, 2017; Article no.JGEESI.35304
9
rate of 0.0143 mm/day per year. The Mann-Kendall test for the RCP26 covering the period of 2011 - 2100 as shown in Table 5 for the climatic zones reveals that the null hypothesis was accepted for all the zones indicating non-significant trend. Table 6 indicates that the null hypothesis was accepted for guinea and savanna and rejected for sahel and the whole of Nigeria under the RCP 45. Over the sahel, the trend test revealed a decreasing trend at the rate of 0.002 mm/day per year while the trend test revealed an increasing trend for Nigeria at the rate of 0.0015 mm/day per year. Under the RCP 85, the null hypothesis was accepted for guinea, savanna and sahel but was rejected over the whole of Nigeria as indicated by Table 7. Rejecting the null hypothesis over Nigeria
indicates an increasing trend of 0.0034 mm/day per year. On running the Mann-Kendall test on temperature data, the following results in Tables 8 to 11 were obtained for the climatic zones. Table 8 indicates that the null hypothesis was accepted for only one climatic zone, sahel and rejected for the other zones, guinea, savanna and Nigeria. Rejecting the null hypothesis which indicates a trend in the temperature data revealed an increasing trend for guinea, savanna and Nigeria at the rate of 0.02, 0.018 and 0.02°C per year respectively. The Mann-Kendall test for the RCP26 covering the period of 2011 - 2100 as shown in Table 9 for the climatic zones
Table 4. Results of the Mann-Kendall test for precipitation for 1971 – 2000
1971 - 2000 Kendal's
tau
2 sided
p-value
Test Z Sen slope, Q Test
interpretation
Trend
Guinea 0.224 0.08666 1.7133 0.018421 Accept H0 NST
Savanna 0.0667 0.61739 0.4995 0.001257 Accept H0 NST
Sahel 0.287 0.028011 2.1971 0.015 Reject H0 Trend (increasing)
Nigeria 0.287 0.026947 2.2123 0.014288 Reject H0 Trend (increasing)
Table 5. Results of the Mann-Kendall test for precipitation for RCP26 (2011 – 2100)
2011 – 2100
Kendal's tau
2 sided p-value
Test Z Sen slope, Q
Test interpretation
Trend
Guinea 0.13 0.069932 1.8124 0.003896 Accept H0 NST
Savanna -0.0165 0.82078 -0.227 -0.00023 Accept H0 NST
Sahel -0.1 0.16328 -1.394 -0.00123 Accept H0 NST
Nigeria 0.013 0.85891 0.1778 0.000109 Accept H0 NST
Table 6. Results of the Mann-Kendall test for precipitation for RCP45 (2011 – 2100)
2011 – 2100
Kendal's tau
2 sided p-value
Test Z Sen slope,Q
Test interpretation
Trend
Guinea 0.0791 0.27218 1.098 0.002188 Accept H0 NST
Savanna -0.102 0.15589 -1.419 -0.00188 Accept H0 NST
Sahel -0.142 0.049655 -1.963 -0.00182 Reject H0 Trend (decreasing)
Nigeria 0.148 0.040001 2.0537 0.0015 Reject H0 Trend (increasing)
Table 7. Results of the Mann-Kendall test for precipitation for RCP85 (2011 – 2100)
2011 –
2100
Kendal's tau
2 sided
p-value
Test Z Sen
slope, Q
Test interpretation
Trend
Guinea -0.0686 0.34131 -0.952 -0.00189 Accept H0 NST
Savanna -0.0464 0.52122 -0.641 -0.00083 Accept H0 NST
Sahel -0.101 0.16213 -1.398 -0.00125 Accept H0 NST
Nigeria 0.268 0.0002044 3.7135 0.003448 Reject H0 Trend (increasing)

Daramola et al.; JGEESI, 11(2): 1-14, 2017; Article no.JGEESI.35304
10
reveals that the null hypothesis was rejected for all the zones indicating a trend in the temperature data. Table 10 indicates that the null hypothesis was rejected for all the climatic zones under RCP45. Under the RCP 85, the null hypothesis was rejected for all the climatic zones as indicated by Table 11. The trend test result for guinea, savanna, Sahel and Nigeria as presented in Table 8 to 11
all revealed an increasing trend in the temperature data. For RCP26, the increase was at the rate of 0.0063, 0.0069, 0.0078 and 0.0067°C per year respectively. For RCP45, the increase was the rate of 0.0167, 0.0187, 0.02 and 0.0186°C per year respectively. For RCP85, the increase was the rate of 0.038, 0.04, 0.039 and 0.039°C per year respectively.
Table 8. Results of the Mann-Kendall test for temperature for 1971 – 2000
1971 – 2000
Kendal's tau
2 sided p-value
Test Z Sen slope,Q Test interpretation
Trend
Guinea 0.43 0.00095581 3.30322 0.021818 Reject H0 Trend (increasing) Savanna 0.368 0.0047788 2.821579 0.01875 Reject H0 Trend (increasing) Sahel 0.145 0.26836 1.106849 0.013889 Accept H0 NST Nigeria 0.373 0.0040677 2.872863 0.02 Reject H0 Trend (increasing)
Table 9. Results of the Mann-Kendall test for temperature for RCP26 (2011 – 2100)
2011 – 2100
Kendal's tau
2 sided p-value
Test Z Sen slope, Q
Test interpretation
Trend
Guinea 0.273 0.00014886 3.792967 0.006383 Reject H0 Trend (increasing) Savanna 0.252 0.00045974 3.503181 0.006957 Reject H0 Trend (increasing) Sahel 0.227 0.0015872 3.158252 0.007797 Reject H0 Trend (increasing) Nigeria 0.252 0.00046536 3.499944 0.006667 Reject H0 Trend (increasing)
Table 10. Results of the Mann-Kendall test for temperature for RCP45 (2011 – 2100)
2011 – 2100
Kendal's tau
2 sided p-value
Test Z Sen slope,Q
Test interpretation
Trend
Guinea 0.485 1.46E-11 6.751766 0.016765 Reject H0 Trend (increasing)
Savanna 0.477 2.93E-11 6.65021 0.018696 Reject H0 Trend (increasing)
Sahel 0.456 2.19E-10 6.347144 0.02 Reject H0 Trend (increasing)
Nigeria 0.481 2.14E-11 6.695887 0.018571 Reject H0 Trend (increasing)
Table 11. Results of the Mann-Kendall test for temperature for RCP85 (2011 – 2100)
2011 – 2100
Kendal's tau
2 sided p-value
Test Z Sen slope,Q
Test interpretation
Trend
Guinea 0.773 2.22E-16 10.78034 0.038077 Reject H0 Trend (increasing)
Savanna 0.761 2.22E-16 10.60004 0.040926 Reject H0 Trend (increasing)
Sahel 0.68 2.22E-16 9.466825 0.039583 Reject H0 Trend (increasing)
Nigeria 0.75 2.22E-16 10.46311 0.039677 Reject H0 Trend (increasing)
3.4 Precipitation and Temperature Anomaly
Fig. 8 shows the standardized rainfall anomaly over different climatic zones in Nigeria from 2011-2100. The positive anomaly shows those years when the annual mean precipitation exceeded the average, the negative anomaly shows those years when the mean precipitation was less than the average. In the guinea and
savannah areas it can be observed that there are more wet years than dry years (Table 12). But for the Sahel and the whole of Nigeria, the dry years were more than the wet years for the 90-year study period. The result corresponds to IPCC projection stating that the coastal areas are prone to more wet years leading to the occurrence of flooding while region around the Sahel will experience more of drought as a result of reduction in the total precipitation.

Daramola et al.; JGEESI, 11(2): 1-14, 2017; Article no.JGEESI.35304
11
Fig. 8. Standardized anomaly of precipitation for (a) Guinea (b) Savanna (c) Sahel and (d) the whole of Nigeria
Table 12. Summary statistics of precipitation anomaly for the climatic zones
Climatic zones Guinea Savanna Sahel Nigeria No. of occurrences
No. of occurrences
No. of occurrences
No. of occurrences
Positive anomaly (wet years)
46 47 40 43
Negative anomaly (dry years)
44 43 50 47
Fig. 9 shows the standardized temperature anomaly over the different climatic zones in Nigeria from 2011-2100. The positive anomaly shows those years when the annual mean precipitation exceeded the average, the negative anomaly shows those years when the mean precipitation was less than the average. For guinea, it can be observed that between 2011-2069, negative anomaly of air temperature was more prominent than positive anomaly but a change was noted from 2070 when temperature began to change to positive anomaly and these prolong well into 2100. From 2089, it was all positive anomalies through to 2100. Over savanna, negative anomaly of air temperature was more prominent from 2011 to 2059 than positive anomaly but a change was noted from 2070 when temperature began to change to positive anomaly and from 2093, the anomaly
was all positive till 2100. Similarly, over Sahel, negative anomaly was more prominent from 2011 to 2047, but a change was observed from 2048 and from 2092, it became fully positive anomaly through to 2100. From the summary statistics of the temperature anomaly for the zones presented in Table 13, positive anomaly exceeds the negative anomaly across all the zones, indicating more warm years than colder years.
3.5 Implication of Changes in Precipitation and Temperature
The major challenge that climate change presents for Nigeria is an increase in air temperature over the entire country [24]. This can be seen by the increasing trend in temperature over the entire country and the

Daramola et al.; JGEESI, 11(2): 1-14, 2017; Article no.JGEESI.35304
12
Fig. 9. Standardized anomaly of temperature for (a) Guinea (b) Savanna (c) Sahel and (d) the whole of Nigeria
Table 13. Summary statistics of temperature anomaly for the climatic zones
Climatic zones Guinea Savanna Sahel Nigeria No. of occurrences
No. of occurrences
No. of occurrences
No. of occurrences
Positive anomaly - warmer than normal
46 46 47 47
Negative anomaly - colder than normal
44 44 43 43
climatic zones. The predicted climate change could lead to flooding and drought in different parts of the country. Over the Sahel, precipitation trend was on the decrease, which could lead to drought in the Sahel region. The agricultural sector is prone to the influence of climate change due to its reliance on rainfall and temperature. The climate determines not only where and when to plant a crop but also whether the crop will yield effectively or not. Therefore, change or variation in the climate ultimately affects agricultural production. From the anomaly analysis, warmer years were more than cooler years further suggesting a possible increase in events associated with increased temperature. The implication of this is extensive over many sectors of the economy such as the health sector. The impact includes alteration in the spatial and temporal transmission of disease vectors such as malaria, meningitis and cholera. Areas where some pests could not breed initially due to low temperature will eventually become a suitable ground for them with increase in temperature.
4. CONCLUSION This study uses climate projection data for scenario experiments for Representative Concentration Partways RCP2.6/4.5/8.5 from ten models. The models captured the seasonal variation differently across the zones with the highest deviation in JJA. Rainfall and temperature analysis showed that rainfall and temperature varied mostly in the sahel, compared to other zones. Trend analysis showed no significant trend (NST) mostly in the RCP projection in rainfall across the zones but a general increase in temperature for all RCPs for all the zones. The anomaly plot showed that sahel will experience more dry years in rainfall and for temperature, there will be more warm years across all the zones. The changes in rainfall and temperature have implications in various sectors of the economy such as agriculture, water resources and health sector. It is well known that research and development complement each other. It is important that further research be carried out particularly in

Daramola et al.; JGEESI, 11(2): 1-14, 2017; Article no.JGEESI.35304
13
projecting the change in climate at regional scales. This will provide information about the expected change or variation in climate and hence help in the mitigation of the implications of the change in climate.
COMPETING INTERESTS
Authors have declared that no competing interests exist.
REFERENCES
1. Kandji ST, Verchot L, Mackensen J. Climate change and variability in the Sahel region: Impacts and adaptation strategies in the agricultural sector. World Agroforestry Centre (ICRAF)/United Nations Environment Programme (UNEP); 2006.
2. Trenberth KE, Jones PD, Ambenje P, Bojariu R, Easterling D, Klein TA, Zhai P. Observations: Surface and atmospheric climate change. In Solomon, S, Qin D, Manning M, Chen Z, Marquis M, Averyt KB, Tignor M, Miller HL, (Eds). Climate Change. The physical science basis. Contribution of working group i to the fourth assessment report of the intergovernmental panel on climate change. United Kingdom and New York, NY: Cambridge University Press. 2007; 235-336.
3. Mendelsohn R, Dinar A, Arne D. Climate Impact on African agriculture. Climate Change. 2000;45:583–600.
4. Paavola J. Livelihoods, vulnerability and adaptation to climate change in the Morogoro region, Tanzania. Working Paper EDM. 2004;04-12.
5. Ozor N, Cynthia N. Difficulties in adapting to climate change by farmers in Enugu State, Nigeria. Journal of Agricultural Extension. 2010;14(2):106–122.
6. Mohammed D, Kwaghe PV, Bukar U, Umar J. Economic of adaptation to climate change among crop farmers in Adamawa State, Nigeria. IOSR Journal of Agriculture and Veterinary Science. 2013;5(4):61–66.
7. Environment Canada. Poster 5: Climate Modelling: Predicting global climate change in series science for sustainable development presented at the 2002 world summit on sustainable development at Johannesburg, South Africa; 2002.
8. Fenech A, Comer N, Gough B. Selecting a global climate model for understanding future projections of climate change. In:
linking climate models to policy and decision-making, UPEI Climate Lab, Prince Edward Island. 2002;5:133-145.
9. Broecker WS. Chaotic climate. Sci Am. 1995;267:62–68.
10. Skelly WC, Henderson-Sellers ANN. Grid box or grid point: What type of data do GCMs deliver to climate impacts researchers? Int J Climatol. 1996;16(10):1079–1086.
11. Phillips TJ, Potter GL, Williamson DL, Cederwall RT, Boyle JS, Fiorino M, Hnilo JJ, Olson JG, Xie S, Yio JJ. Evaluating parameterizations in general circulation models: Climate simulation meets weather prediction. Bull Am Meteorol Soc. 2004;85(12):1903–1915.
12. Rial JA, Pielke RA, Beniston M, Claussen M, Canadell J, Cox P, Held H, de Noblet-Ducoudré N, Prinn R, Reynolds JF, Salas JD. Nonlinearities, feedbacks and critical thresholds within the Earth's climate system. Clim Chang. 2004;65(1):11–38.
13. Raisanen J. How reliable are climate models? Tellus. 2007;59A:2–29.
14. Nikulin G, Kjellstrom E, Hansson U, Strandberg G, Ullerstig A. Evaluation and future projections of temperature, precipitation and wind extremes over Europe in an ensemble of regional climate simulations. Tellus. 2011;63A:41–55.
15. Wayne G. The Beginner’s guide to representative concentration pathways. Skeptical Science. 2013.Version1.0.
16. Taylor KE, Stouffer RJ, Meehl GA. An overview of CMIP5 and the experiment design Bull. Am. Meteorol. Soc. 2012;93:485–498.
17. Meehl GA, Covey C, Delworth T, Latif M, McAvaney B, Mitchell JFB, Stouffer RJ, Taylor KE. The WCRPCMIP3 multimodel dataset: A new era in climatic change research. Bull. Amer. Meteor. Soc. 2007;88:1383–1394.
18. Managing the risks of extreme events and disasters to advance climate change adaptation. A special report of working groups I and II of the Intergovernmental Panel on Climate Change (IPCC); 2012.
19. Omotosho JB, Abiodun BJ. A numerical study of moisture build-up and rainfall over West Africa. Meteorology Application. 2007;14(3):209-225.
20. Taylor KE. Summarizing multiple aspects of model performance in a single diagram.

Daramola et al.; JGEESI, 11(2): 1-14, 2017; Article no.JGEESI.35304
14
J. Geophys. Res. 2001;106(D7):7183–7192.
21. Odekunle TO, Andrew O, Aremu SO. Towards a wetter Sudano-Sahelian ecological zone in twenty-first century Nigeria. Weather. 2008;63(3):66-70.
22. Obasi GOP. Atmospheric synoptic climatological features over the West African Region. Nigerian Meteorological Service Technical Note. 1965;28.
23. Oguntunde PG, Abiodun BJ, Lischeid G. Rainfall trends in Nigeria, 1901–2000. Journal of Hydrology. 2011;411:207–218.
24. Abiodun BJ, Salami AT, Tadross M. Climate change scenarios for nigeria: understanding biophysical impacts. climate systems analysis group, Cape Town, for Building Nigeria's Response to Climate Change Project. Ibadan, Nigeria: Nigerian Environmental Study/Action Team (NEST); 2011.
_________________________________________________________________________________ © 2017 Daramola et al.; This is an Open Access article distributed under the terms of the Creative Commons Attribution License (http://creativecommons.org/licenses/by/4.0), which permits unrestricted use, distribution, and reproduction in any medium, provided the original work is properly cited.
Peer-review history: The peer review history for this paper can be accessed here:
http://sciencedomain.org/review-history/20361