analysis of radioactive contamination in the near zone of
TRANSCRIPT
59
Analysis of Radioactive Contamination in the Near Zone of Chornobyl NPP
Alexander GAYDAR and Oleg NASVIT*
Institute of Nuclear Research, NASU, Prospekt Nauki, 47, Kyiv-28, 03680, Ukraine: [email protected]
*Research Innovative Implementation Enterprise “Stroom”, Office “Stroom-Kyiv” 28A, Artema St.,Kyiv, 04053, Ukraine: [email protected]
Abstract As a result of the Chornobyl accident a large amount of radionuclides have been turned out
to the environment and spread over a large territory. The largest part of radioactive depositions is located on the territories adjacent to Chornobyl NPP.
The paper presents a brief review of the history and the current state of investigation of the Chornobyl accident deposition around the territories adjacent to Chornobyl NPP where a massive amount of reliable data have been accumulated about contamination levels and radionuclide compositions by using improved techniques for sampling and measurements. A geostatistical analysis of the obtained data provided a possibility to reveal the regional tendencies for levels and composition of the contamination, and to compile detailed maps of the contamination levels on the investigated territory for radionuclides such as 137Cs, 90Sr, 241Am and plutonium isotopes. The contributions to the transuranium contamination due to Chornobyl were estimated by separating the contributions due to global depositions, and a prognostic map of 241Am contamination was developed.
New geoinformation technologies elaborated by the authors are shown to provide a possibility to reveal the influence of landscape factors upon the contamination structure formation. An explanation of peculiarities of the shape and location of highly contaminated areas is proposed on the bases of landscape approach.
Introduction Radioactive contamination of the environment in global scale was formed as a result of nuclear
weapon tests in the atmosphere. The most part of residual radioactive products of nuclear explosions penetrated into the stratosphere (up to 40-50 km) and then slowly (during months and years) deposited on the earth surface and formed more or less uniform contamination with the maximum in the middle-attitudes of northern hemisphere [1]. As a result of the major accidents at nuclear and radioactive wastes processing and storage installations (Windscale, UK in 1957, the industrial complex �Mayak�, USSR in 1957 and 1967) the areas with high levels of radioactive contamination were formed [2].
On April 26, 1986, at about 1.24 a.m. two successive explosions that followed the reactor runaway at the Unit IV of Chornobyl NPP destroyed the reactor active zone and the unit building [3]. As a result of the accident various materials of the active zone (dispersed fuel, bits of fuel rods and graphite stack) were ejected from the reactor well and turned out into the environment. The initial release of radioactive materials to the atmosphere was so large and energetic that it resulted in penetrating of fission products to the atmospheric layer up to some kilometers [3, 4]. The exposed reactor core with burning graphite stack was a source of continued release of radioactive material to the atmosphere [4,5,6].
During ten days (April 26 � May 5, 1986) a large amount of radioactive materials released into the atmosphere (Fig. 1) were transported to a large distance in different directions depending on the change of wind directions [7, 8].

60
The highest levels of radionuclides deposition were formed on the territories of Ukraine and Belarus adjacent to Chornobyl NPP [7], while Chornobyl depositions were found in most of countries within the Europe [1]. With regard to its radioecological consequences the Chornobyl accident is recognized as the worst nuclear accident in the history of peaceful use of nuclear energy.
Radiation levels around Chornobyl NPP after the accident
From the first days after the accident extraordinary efforts to determine the contamination levels were undertaken to prevent the unwarrantable overirradiation of people. For the most contaminated area (up to 100 km around the Chornobyl NPP) the first map of radiation levels was made as early as May 1, 1986, [4] (at that time the formation of the Southern trace was being continued). By May 10, 1986, the map of exposure dose rates of gamma radiation was made. The first governmental decrees on people evacuation and other protective measures were decided on the basis of these maps.
However, the study of the detailed structure of contamination fields, comprehension of fallout characteristics and their time variation required significant efforts and could not be done right after the accident because of the large scale of contamination areas and specific features of the Chornobyl accident release.
Due to the lack of reliable objective data on the accident releases, contamination parameters and dose rate dynamics have been obtained by calculations which were based on the analysis of radionuclide depositions and the corresponding synoptic maps. These estimations have been corrected as new more detailed information has become available or new approaches have been developed.
On the basis of data on caesium isotopes deposition on the territory of the former Soviet Union the total release of 137Cs has been estimated as 37·1015 Bq or 13% of its activity in the reactor core [5]. Later an analysis of data on precipitation in the Northern Hemisphere resulted in correction of the corresponding values up to 70 - 85·1015 Bq or near 33% [9]. This estimation is in a good agreement with the results obtained from the analysis of quantity and radionuclide composition of the fuel remaining in the �Shelter� object [6].
The release into the environment of significant quantity of radioactive iodine is considered as one of peculiarities of the Chornobyl accident. The radioiodine effect on thyroid is one of principal consequences of the Chornobyl accident. However, there is uncertainty in the assessments of the total release of
Fig. 1. Daily release rate of radioactive material into the atmosphere by the Chornobyl accident [1].
61
radioiodine from the Unit VI of Chornobyl NPP. The report [5] has given the value of (0.62±0.3)·1018 Bq or 20% of activity in the core (re-calculation for May 6, 1986). Later a more pessimistic evaluation was made up to 50-60% [9]. On the basis of the investigation of 129I content in the fuel remaining in the �Shelter� object [6] the value near 60% is considered as more reliable.
Comprehensive investigation of the distribution and specific features of the contamination around Chornobyl NPP provides necessary information for more correct assessments of absorbed radiation doses to population as well as for verification of hypothesis (models) of the processes and conditions in the destroyed reactor core.
History of investigation of spatial distribution of Chornobyl deposition
Among specific features of the Chornobyl accident contamination, it is necessary to note the following: • extreme mosaic structure of contamination of large affected areas [1,4,7,10,11,12]; • complicated radionuclide composition of radioactive fallout [13,14,15]; • wide range of types and physical-chemical properties of radioactive precipitations [16,17]; • diversity of landscape and meteorological conditions, and their influence upon the processes of
deposition, redistribution and migration of radionuclides in ecosystems [18]. A simple application of previous experience without taking into account above-mentioned specific
features could lead and, unfortunately, did result in some slips, especially at the first post accident period. The radiological data with gridding to nearest settlements have permitted to estimate the average values of contamination levels for certain settlements but were unusable to provide information for the detailed investigations of spatial distribution of contamination. Due to the strong inhomogeneous distribution of hot particles the radiochemical determination of the content of certain radionuclides from different sample aliquots led to significant errors in radionuclides composition determination.
It should be mentioned also that in the former Soviet Union practically all investigations connected with nuclear energy and industry were unreasonably secret and centralized. By this reason a significant part of radioecological data for the first days and months after the disaster were accumulated in the secret departments of central offices and have been practically lost.
The most detailed information on the contamination structure has been obtained with airborne-gamma-spectrum survey (AGS). Such investigations were carried out from the very first days after the accident. But, due to complicated character of gamma-spectra, the first reliable and detailed maps of 137Cs contamination were obtained only by 1988-89 [4]. Unfortunately, these results are available (in Ukraine) only on paper.
At present, there are some regular digital sets of 137Cs contamination levels for the territories adjacent to Chornobyl NPP. One of the first digital maps of 137Cs contamination was compiled on the basis of data obtained with the AGS survey carried out by the Institute of Radiology UAAS and STC �Prypiat� in 1992-1993 [19]. This map covered, however, only the 30-km zone and the scale of mapping was not sufficient enough for detailed analysis of the contamination structure.
During the ensuing years enterprise "Pivnichukrgeologiya" carried out AGS for the adjacent territories to Chornobyl NPP as well as for the most contaminated part of Ukraine. The map compiled on the basis of theses data [20] provided more detailed information on the contamination structure, but later investigations found certain discrepancy in a number of cases about the 137Cs contamination level between AGS and measurements of soil samples [21].
At present 137Cs dominates the radioecological situation on the major part of the contaminated territories in Ukraine. For the territories adjacent to ChNPP, however, the study of spatial distribution and properties of 90Sr and transuraniums contamination will remain the task of great importance for a long
62
time. In 1987-88 for the purpose of detailed and systematic investigation of contamination properties and
their dynamics, a special observation network was establish on the territories adjacent to ChNPP [4,7]. By this network the sampling and determination of contamination levels have been performed for wide range of radionuclides including 241Am, 144Ce, 137Cs, 90Sr and 238,239+240Pu. On the basis of obtained data the corresponding maps have been made as well as necessary evaluations of the radioecological situation. But, the very inhomogeneous spatial distribution of contamination and the formalism of establishing of the network (nomination of observation points) didn�t permit to obtain the detailed information about spatial distribution of contamination (especially at the periphery and outside of the 30-km zone). For example, the �narrow west trace�, which was most contaminated by fuel component, appeared to be situated between two sets of observation points and was practically lost under the map compiling [7].
Modern approach to investigation of spatial distribution of Chornobyl deposition
In order to obtain more detailed information about the contamination structure a group of scientists of the Institute for Nuclear Research of NASU (KINR) has been carrying out sampling and measurements since 1992 based on a more regular network established in the frame of national programs. Using improved techniques investigation is being carried out on the spatial distribution and the radionuclide composition of radioactive contamination on the territories adjacent to Chornobyl NPP [21,22,23] as well as on the remote regions of Ukraine.
The latest developments in Geographical Information Systems (GIS) for compiling of contamination maps provides a possibility to formulate the basic protocols of the new approach, which include requirements for data analysis as well as for soil sampling and radionuclides measurements, as follows: • sampling location is selected after analysing the existing data and the information about the
contamination structure of the territory being considered; • sampling plot within the selected location is determined on the basis of careful radiological inspection
of the location so as to provide the most representative position; • exact gridding of sampling plots by using GPS and topographic maps of the corresponding scale; • determination of sampling depth on the basis of preliminary study of the 137Cs depth profiles; • sampling of not less then 5 soil cores for each sampling plot; • using of the same sample for measurements of all radionuclides; • careful verification of the obtained data and establishing of the most reliable values for the location; • geostatistical analysis of the obtained data (spatial distribution of the absolute values as well as
regional peculiarities of the radionuclides ratios); • determination of the regional regularities and invariants of the spatial distributions of radionuclides
(including their ratios); • taking into account landscape features of the locations and territory; • selection of the most appropriate methods for map compiling according to the established regularities.
By now the data on the contamination levels were obtained for more than 1,500 locations on the territories adjacent to Chornobyl NPP. For example, a map indicating sample location (the Voronoi-Thiessen polygons) is shown in Fig. 2, together with 137Cs contamination levels obtained by AGS survey. The density and the shapes of polygons characterize the quality of new observation (the center of each polygon coincides with the sampling points). For each sampling location the levels of contamination by long-lived radionuclides, including 137Cs, 90Sr, 238,239+240Pu, 241Am have been determined.
Due to high gradient of contamination levels on the investigated territory the representativeness of the observed locations takes on special significance. The exact locating of sampling plots has permitted to make a precise comparison of the data obtained for locations (soil samples) with the average data for the

63
nearest grid points of AGS (Fig. 3). Grouping of data points near the bisecting line testifies a high level of the agreement for data
obtained by different techniques and the representativeness of the observed plots. As a result of spatial analysis for the corresponding data, it has been established that at locations with high levels of contamination the data of AGS must be slightly corrected accordingly to the data of soil samples measurements. The improved map compiled by new approaches about 137Cs contamination on the adjacent territory to Chornobyl NPP is shown in Fig. 4.
The used techniques of sampling and measurements permitted to carry out comprehensive analysis of regional tendencies for the values of ratios between different radionuclides. For example, the trends of the
101 102 103 104 105101
102
103
104
105
137 Cs
Prob
e , kB
q/m
2
137CsAGS ,kBq/m2
Fig. 3. The regression of data obtained by the probe sampling measurements and by AGS.
Fig. 2. Map of the locations studied on the adjacent territory to Chornobyl NPP (Ukrainian part) overlapping the AGS: 137Cs contamination.

64
137Cs/239+240Pu values for the various radioactive traces are presented in Fig. 5. As it can be seen in Fig. 5, the ratio of 137Cs/239+240Pu for all directions is practically constant up to
10 km (for the south trace up to 30 km), and similar to that of the Unit IV fuel. As the distance increases, the regional peculiarities become apparent. For example, for the north trace the ratio begins increasing at about 10 km and exceeds 350 at distance 20 km, while for the western trace the corresponding values remain less then 300 up to 100 km.
Fig. 4. 137Cs contamination map of the adjacent territory to Chornobyl NPP (Ukrainian part).
0 5 10 15 200
100
200
300
400North Trace
137 C
s/239+
240 Pu
Distance, km
0 5 10 15 20 25 300
100
200
300
400 South Trace
137 C
s/ 239
+240
Pu
Distance, km
Fig. 5 Dependence of 137Cs/239+240Pu ratio on the distance from Unit IV of Chornobyl NPP for the various traces. 0 20 40 60 80 100
0
100
200
300
400W est Trace
137 Cs
/ 239
+240
Pu
65
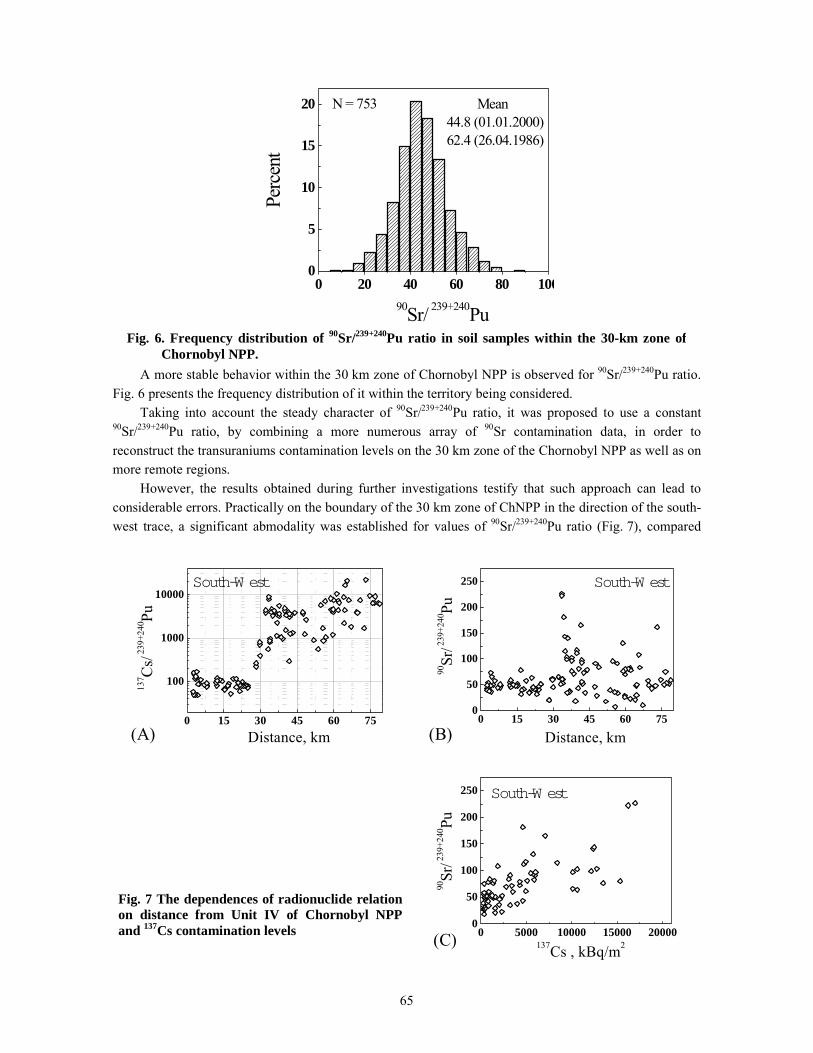
A more stable behavior within the 30 km zone of Chornobyl NPP is observed for 90Sr/239+240Pu ratio. Fig. 6 presents the frequency distribution of it within the territory being considered.
Taking into account the steady character of 90Sr/239+240Pu ratio, it was proposed to use a constant 90Sr/239+240Pu ratio, by combining a more numerous array of 90Sr contamination data, in order to reconstruct the transuraniums contamination levels on the 30 km zone of the Chornobyl NPP as well as on more remote regions.
However, the results obtained during further investigations testify that such approach can lead to considerable errors. Practically on the boundary of the 30 km zone of ChNPP in the direction of the south-west trace, a significant abmodality was established for values of 90Sr/239+240Pu ratio (Fig. 7), compared
0 20 40 60 80 1000
5
10
15
20 N = 753 Mean44.8 (01.01.2000)62.4 (26.04.1986)
Perc
ent
90Sr/ 239+240PuFig. 6. Frequency distribution of 90Sr/239+240Pu ratio in soil samples within the 30-km zone of
Chornobyl NPP.
0 15 30 45 60 75
100
1000
10000South-W est
137 C
s/ 239
+240
Pu
Distance, km
0 15 30 45 60 750
50
100
150
200
250 South-W est
90Sr
/ 239
+240
Pu
Distance, km
Fig. 7 The dependences of radionuclide relation on distance from Unit IV of Chornobyl NPP and 137Cs contamination levels
0 5000 10000 15000 200000
50
100
150
200
250 South-W est
90Sr
/ 239
+240
Pu
137Cs , kBq/m2
(A) (B)
(C)
66
with the corresponding values in Fig. 6. Analysis of the dependency of 90Sr/239+240Pu values on the 137Cs contamination levels (Fig 7C) indicates a similar behavior of 90Sr to that of 137Cs, which permits to suppose that the vaporized-condensed component was significant in the formation of 90Sr contamination on this region. More distinctly this contribution is observed on the territory of more remote regions along the south and the north-east traces [15, 23].
As it was mentioned above, the drastically inhomogeneous spatial distribution of radionuclide depositions on the adjacent territory to Chornobyl NPP does not permit to make quantitative and detailed contamination maps based just on the data of soil samples measurements, even under high density of investigated plots [21]. Thereafter, taking into consideration local tendencies of radionuclide composition and their regularities, new technique has been developed for mapping of contamination by transuraniums and 90Sr [23]. This technique includes: • unification and preliminary verification of all available data; • compilation of the regular data grid for the most detailed studied long-lived radionuclide (137Cs); • investigations of radionuclide composition and local peculiarities of contamination; • compilation of the regular grid data for the less studied radionuclide (90Sr or transuraniums) on the base
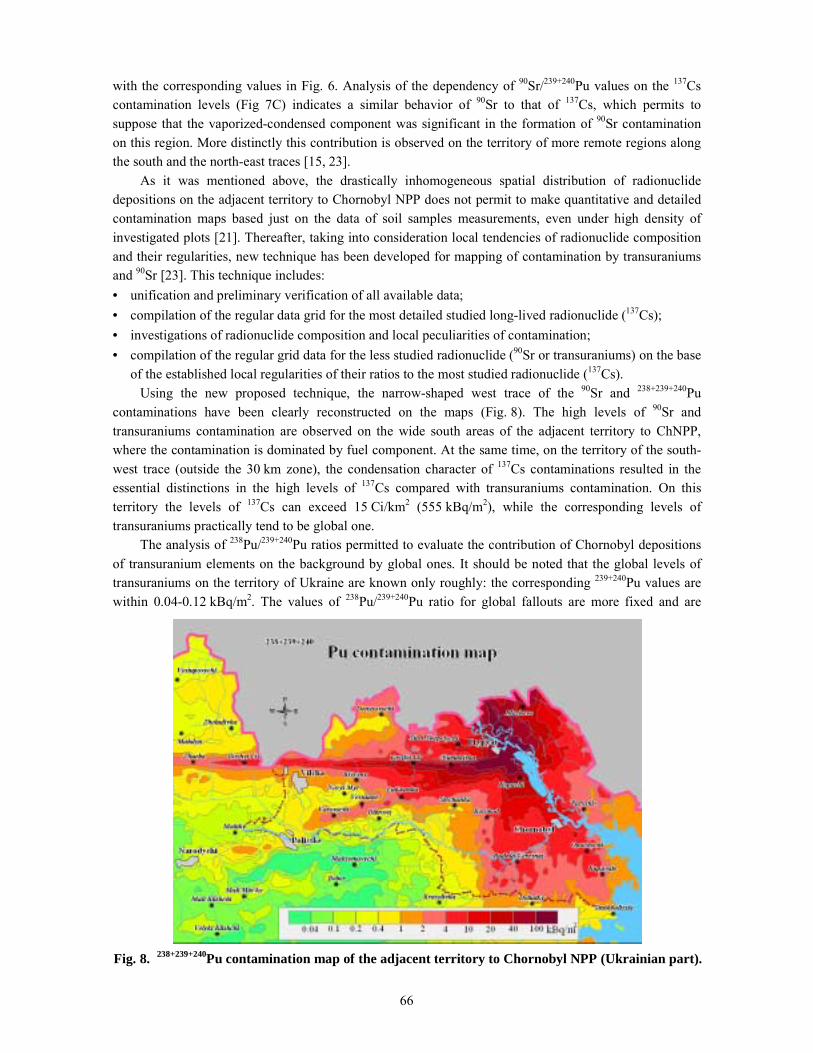
of the established local regularities of their ratios to the most studied radionuclide (137Cs). Using the new proposed technique, the narrow-shaped west trace of the 90Sr and 238+239+240Pu
contaminations have been clearly reconstructed on the maps (Fig. 8). The high levels of 90Sr and transuraniums contamination are observed on the wide south areas of the adjacent territory to ChNPP, where the contamination is dominated by fuel component. At the same time, on the territory of the south-west trace (outside the 30 km zone), the condensation character of 137Cs contaminations resulted in the essential distinctions in the high levels of 137Cs compared with transuraniums contamination. On this territory the levels of 137Cs can exceed 15 Ci/km2 (555 kBq/m2), while the corresponding levels of transuraniums practically tend to be global one.
The analysis of 238Pu/239+240Pu ratios permitted to evaluate the contribution of Chornobyl depositions of transuranium elements on the background by global ones. It should be noted that the global levels of transuraniums on the territory of Ukraine are known only roughly: the corresponding 239+240Pu values are within 0.04-0.12 kBq/m2. The values of 238Pu/239+240Pu ratio for global fallouts are more fixed and are
Fig. 8. 238+239+240Pu contamination map of the adjacent territory to Chornobyl NPP (Ukrainian part).
67
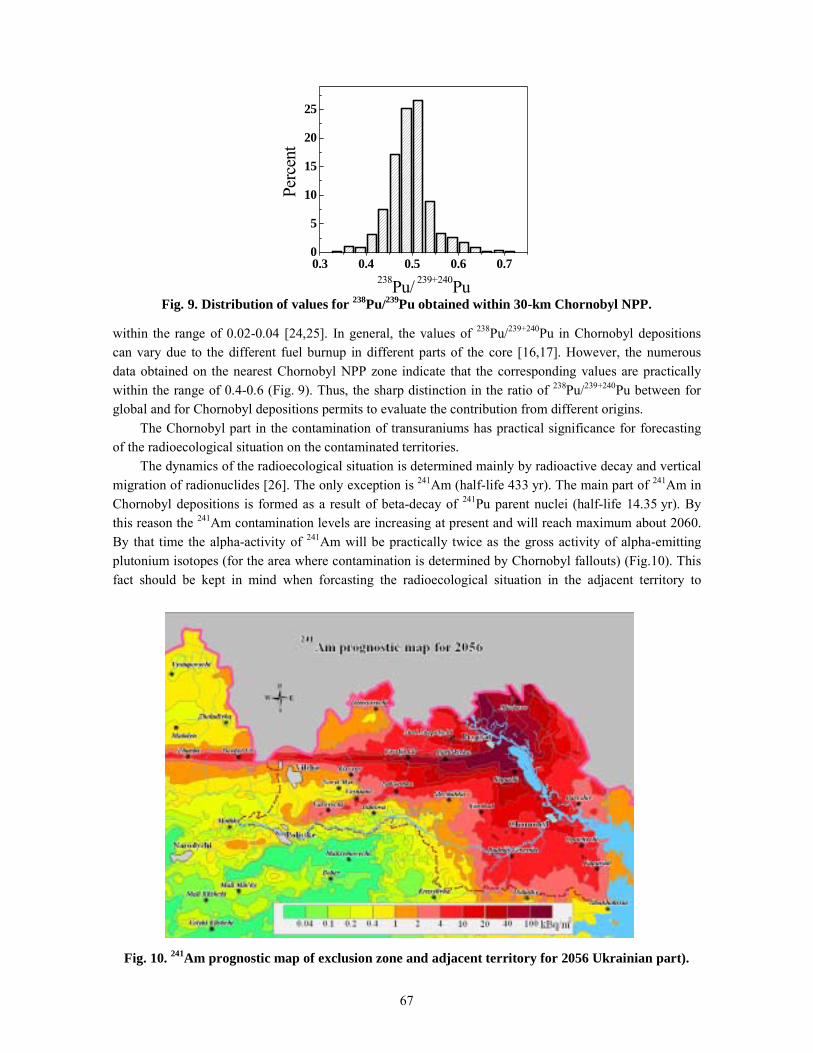
within the range of 0.02-0.04 [24,25]. In general, the values of 238Pu/239+240Pu in Chornobyl depositions can vary due to the different fuel burnup in different parts of the core [16,17]. However, the numerous data obtained on the nearest Chornobyl NPP zone indicate that the corresponding values are practically within the range of 0.4-0.6 (Fig. 9). Thus, the sharp distinction in the ratio of 238Pu/239+240Pu between for global and for Chornobyl depositions permits to evaluate the contribution from different origins.
The Chornobyl part in the contamination of transuraniums has practical significance for forecasting of the radioecological situation on the contaminated territories.
The dynamics of the radioecological situation is determined mainly by radioactive decay and vertical migration of radionuclides [26]. The only exception is 241Am (half-life 433 yr). The main part of 241Am in Chornobyl depositions is formed as a result of beta-decay of 241Pu parent nuclei (half-life 14.35 yr). By this reason the 241Am contamination levels are increasing at present and will reach maximum about 2060. By that time the alpha-activity of 241Am will be practically twice as the gross activity of alpha-emitting plutonium isotopes (for the area where contamination is determined by Chornobyl fallouts) (Fig.10). This fact should be kept in mind when forcasting the radioecological situation in the adjacent territory to
0.3 0.4 0.5 0.6 0.70
5
10
15
20
25
Perc
ent
238Pu/ 239+240Pu Fig. 9. Distribution of values for 238Pu/239Pu obtained within 30-km Chornobyl NPP.
Fig. 10. 241Am prognostic map of exclusion zone and adjacent territory for 2056 Ukrainian part).

68
ChNPP.
Landscape factors and their influence on the formation of contamination structure As described above, more detailed and accurate contamination maps than ever have been elaborated
by new techniques. New techniques, in addition, have brought to light on some questions about the Chornobyl depositions: strange shapes of traces and spots, and the peculiarities of the radionuclide composition of depositions (often for the neighbouring regions).
At present there are numerous model calculations to explain the spatial distribution of Chornobyl fallouts based on the synoptic maps in the scale of European part of the former USSR or the European continent. Due to the lack of information about releases parameters and meteorological data, the uncertainty in the input parameters for calculations led to discrepancy in the results obtained by different authors [8,27,28]. Furthermore, practically all of them could not explain the detailed shape of the contamination spots under local-scale mapping [29]. It must be noted that the complicated character of the interaction between the air streams and the underlying surface was considered in these models only partially [30].
Therefore, it was interesting to perform comprehensive analysis of the improved radioecological data and the landscape factors to determine a role of the latter on the shaping of a primary contamination. Modern GIS techniques provide an opportunity to link and analyse simultaneously several layers of information (contamination level isolines, surface geometry, location of forestry, rivers, settlements etc.) [31]. Results of such analysis can be presented as three- or multi-dimensional drawings .
The interaction between the ground surface and the atmosphere depends significantly upon meteorological condition [30]. During the active stage of the accident releases these conditions were essentially changing [4, 7, 8 , 28].
During April 25-26, 1986, the Chornobyl NPP region was situated in the low gradient barometric field of the anti-cyclone periphery part. Such condition determined the considerable changes of wind direction under weak speed of it (up to 2-3 m/s). At night, the air stream directions at the ground surface might be different from the wind direction at height 1.5-2.5 km up to 45-50°. At the near surface layer the dominating directions of the contaminated air mass flow were west and south-west but, while at the layer
Fig. 11. Trajectories of radioactivity transport that started on 26 April, 1986 at 3:00 from Unit-
IV of Chornobyl NPP by atmosphere layers in different height.

69
of 1.5-2.0 km high the corresponding directions might be west or north-west (Fig. 11) [7]. The stable conditions in the boundary layer were observed during the night. As a result of weak atmosphere perturbance, the narrow-shaped �explosion� west trace was formed (Chornobyl NPP-Vilcha-Pershotravneve). At the same time, the air stream at height more than 1 km, which was enriched in volatile radionuclides, started to move in the north-west direction. During April 27 the speed and the direction of the air mass transport remained without considerable changes. During April 28-30 the directions of transport considerably changed and practically made rotation on 360o, while the wind speed remained weak.
During May 1-6 a considerable increase of wind speed was observed (on May 2-3 gale-force wind). The contaminated air masses were being transported predominantly in the south direction (south-east on May 4 and south-west on May 5). This period is characterised by a more uniform distribution of the wind speed and the direction along the atmosphere layers at different heights. Also must be noted the increasing of the boundary layer height and the intensity of diffusion processes. During this period the wide south trace was formed.
Thus, the contamination fields on the territory of Ukraine in the west (north-west, south-west) and south directions were formed under different meteorological conditions. It is reasonable to expect (because of more quiet atmospheric conditions) the most noticeable influence of landscape factors on the formation of the contamination fields in west and south-west direction from Unit IV of Chornobyl NPP [30]. Multi-dimensional topographic maps of the corresponding territories were constructed on the basis of improved digital techniques. This gave a possibility to analyse the radiological data in the form of the superposed colour isolines together with the landscape features of the area.
As a result of multi-dimensional view visual analysis the followings were found: • correlation between the location of highly contaminated areas and the elevation of forestland locations; • under the condition of low-gradient barometric fields the river flood-planes became the guiding lines
for contaminated air streams, especially in west and south-west directions; • influence of the chain of hills and the mountain-valley wind on the streamline of air mass propagation.
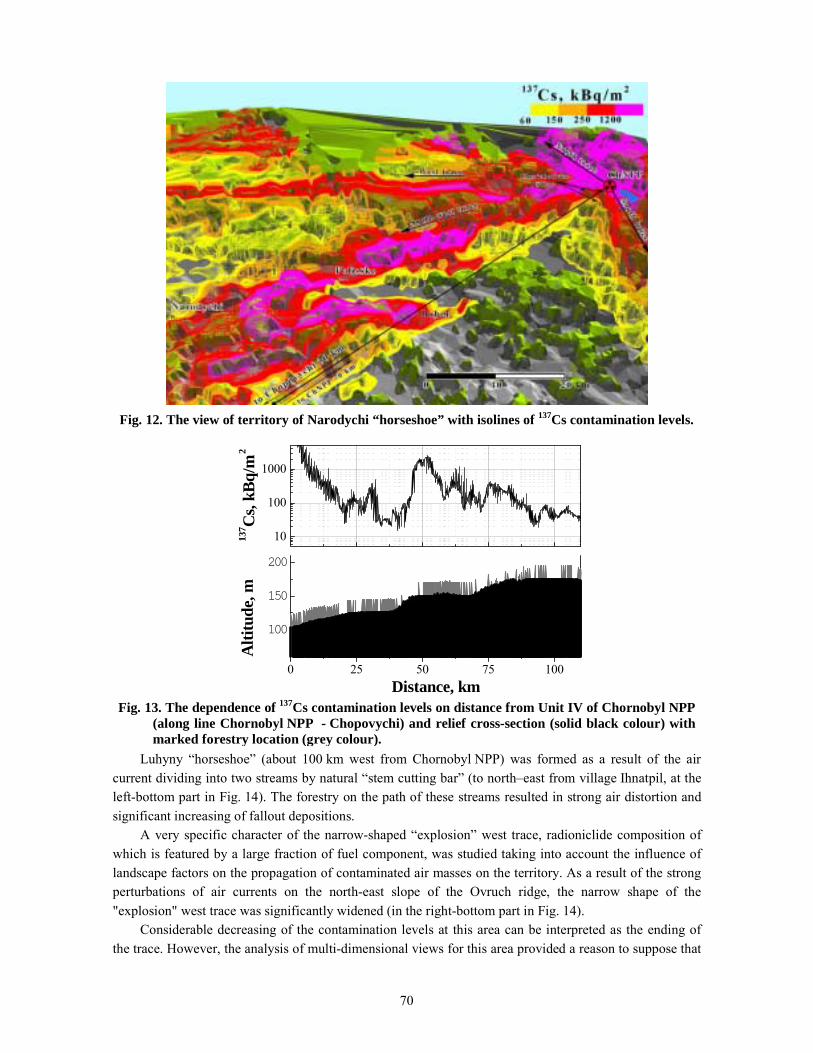
In the light of above-mentioned findings the strange shape of Narodychi �horseshoe� (near 70 km south-west from Chornobyl NPP, Fig. 12) can be explained by the interaction of forestlands with passing air currents above them. The radioactively polluted air masses, which had overcome the Chystohalivka ridge, passed the low laying area without noticeable deposition on it (Figs. 12 and 13).
Strong perturbations of air currents at the region of the forest-covered hills caused considerable increasing of fallout depositions. It must be noted that fallouts in this case were originated from atmosphere layers up to 1.5-2.5 km. Experimental data obtained for radionuclide composition on the corresponding territory can be considered as an evidence of the proposed model. As it was mentioned earlier, the domination of 137Cs and considerable 90Sr contamination were found on this area. Such peculiarities of contamination (radionuclide composition) are also observed for more remote regions where depositions were caused by fallout from the top atmosphere layers, while Narodychi �horseshoe� situated not far than 70 km from Unit-IV of Chornobyl NPP.
The suggested landscape approach was also fruitful for explanation of a number of phenomena. The minor change of the direction of the narrow "explosion" west trace was caused by the influence of the Chystohalivka chain of hills (about 6 km south-west from Chornobyl NPP). The perturbance of the air-flow at this area resulted in significant increasing of fallouts at the northern slopes of the Chystohalivka chain of hills due to depletion of passing air currents. Though the height of the Chystohalivka chain of hills does not exceed 200 m, the formation of low contaminated wedge-shaped region in the south-west part of the exclusion zone can be explained by its influence. The depleted air current passed over the comparatively low altitude area (village Stechanka in Fig. 4) and then went onto the higher one (Narodychi-Bober), forming the observed shape of the contamination field.
70
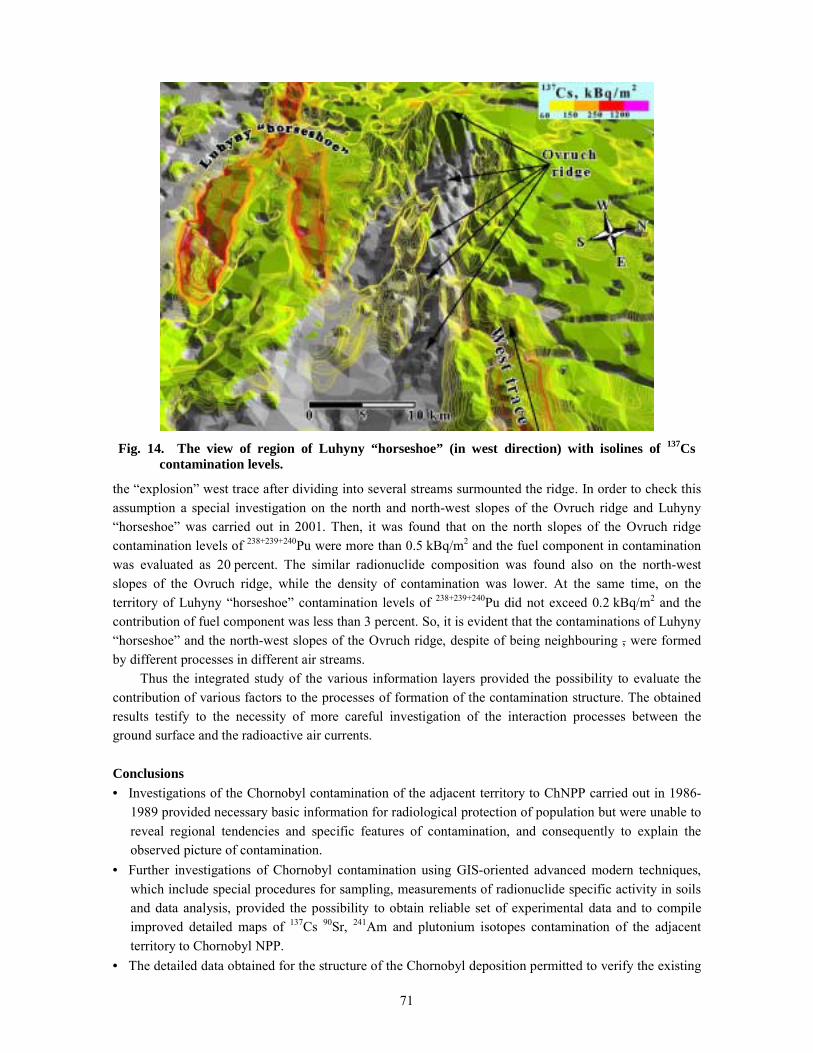
Luhyny �horseshoe� (about 100 km west from Chornobyl NPP) was formed as a result of the air current dividing into two streams by natural �stem cutting bar� (to north�east from village Ihnatpil, at the left-bottom part in Fig. 14). The forestry on the path of these streams resulted in strong air distortion and significant increasing of fallout depositions.
A very specific character of the narrow-shaped �explosion� west trace, radioniclide composition of which is featured by a large fraction of fuel component, was studied taking into account the influence of landscape factors on the propagation of contaminated air masses on the territory. As a result of the strong perturbations of air currents on the north-east slope of the Ovruch ridge, the narrow shape of the "explosion" west trace was significantly widened (in the right-bottom part in Fig. 14).
Considerable decreasing of the contamination levels at this area can be interpreted as the ending of the trace. However, the analysis of multi-dimensional views for this area provided a reason to suppose that
Fig. 12. The view of territory of Narodychi “horseshoe” with isolines of 137Cs contamination levels.
0 25 50 75 100
100
150
200
10
100
1000
Alti
tude
, m
Distance, km
137 C
s, kB
q/m
2
Fig. 13. The dependence of 137Cs contamination levels on distance from Unit IV of Chornobyl NPP(along line Chornobyl NPP - Chopovychi) and relief cross-section (solid black colour) withmarked forestry location (grey colour).
71
the �explosion� west trace after dividing into several streams surmounted the ridge. In order to check this assumption a special investigation on the north and north-west slopes of the Ovruch ridge and Luhyny �horseshoe� was carried out in 2001. Then, it was found that on the north slopes of the Ovruch ridge contamination levels of 238+239+240Pu were more than 0.5 kBq/m2 and the fuel component in contamination was evaluated as 20 percent. The similar radionuclide composition was found also on the north-west slopes of the Ovruch ridge, while the density of contamination was lower. At the same time, on the territory of Luhyny �horseshoe� contamination levels of 238+239+240Pu did not exceed 0.2 kBq/m2 and the contribution of fuel component was less than 3 percent. So, it is evident that the contaminations of Luhyny �horseshoe� and the north-west slopes of the Ovruch ridge, despite of being neighbouring , were formed by different processes in different air streams.
Thus the integrated study of the various information layers provided the possibility to evaluate the contribution of various factors to the processes of formation of the contamination structure. The obtained results testify to the necessity of more careful investigation of the interaction processes between the ground surface and the radioactive air currents.
Conclusions • Investigations of the Chornobyl contamination of the adjacent territory to ChNPP carried out in 1986-
1989 provided necessary basic information for radiological protection of population but were unable to reveal regional tendencies and specific features of contamination, and consequently to explain the observed picture of contamination.
• Further investigations of Chornobyl contamination using GIS-oriented advanced modern techniques, which include special procedures for sampling, measurements of radionuclide specific activity in soils and data analysis, provided the possibility to obtain reliable set of experimental data and to compile improved detailed maps of 137Cs 90Sr, 241Am and plutonium isotopes contamination of the adjacent territory to Chornobyl NPP.
• The detailed data obtained for the structure of the Chornobyl deposition permitted to verify the existing
Fig. 14. The view of region of Luhyny “horseshoe” (in west direction) with isolines of 137Cscontamination levels.
72
models of propagation and deposition of radioactive releases. • Landscape factors significantly influenced the processes of the air currents propagation from Chornobyl
NPP and shaping of contamination areas especially on condition of the low gradient barometric field that continued during the first two days of the accident.
• Landscape approach together with meteorological modelling seems to be the most fruitful method for explanation of the shapes and the radionuclide composition of radioactive traces on the local scale mappings.
References 1. Atlas on Caesium Deposition on Europe after the Chernobyl Accident. London, Lovell Jons Ltd., 1998, 175 p. 2. Izrael Yu.A. Radioactive Pollution after nuclear explosions and accidents � integral approach. // Proceedings of
international conference "Radioactivity after nuclear explosions and accidents", Moskow, 2000, Sankt-Peterburg, Hydrometeoizdat, 2000 (in Russ)
3. Kiselev A.N., Checherov K.P. The model of destruction process of the unit-4 thr Chernobyl NPP. Atomnaya Energia, 2001, v. 91, N6, p. 425-434 (in Russ.)
4. �Chernobyl: Contamination in the Environment. Edited by Y.A.Izrael. Leningrad. Gidrometeoizdat. 1990 (in Russ.)
5. �Information to IAEA about the Chernobyl NPP Accident�. Atomnaya Energia, 1986, v. 61, N5, p. 301-320 (in Russ.)
6. Borovoy A.A, Gegerinsky A.Yu. Release of radioactivity from destroyed unit of the Chernobyl NPP. Atomnaya energia. 2001, v.90, N2, p. 137-145 (in Russ.)
7. Atlas of radioactive contamination of European Russia, Belarus and Ukraine. /Elaborated at Institute of Global Climate and Ecology under Roshydromet and Russian Academy of Science under scientific supervision of Ac. Izrael Yu.A. Moscow. Federal Service of Geodesy and Cartography of Russia. 1998. 143 p. (in Russ.)
8. Borzilov V.F., Klepikova N.V., Kostrikov A.A. at al. Meteorological conditions of long-range transport of ChNPP radioactivity. Meteorologia i gidrologiya, 1989, N1, p.5-11 (in Russ.)
9. Devel L., Guntay S., Powers D. The Chernobyl reactor accident sours term. OCDE/GD 1996, (12), Paris. 29 p. 10. Fifteen years of Chornobyl catastrophe. experience of overcoming// National Report of Ukraine, Kyiv,2001 (in
Ukr.) 11. Belarus and Chernobyl: The second decade// Ed. by H.E. Minister I.A. Kenik - Minsk: Ministry of
Emergencies of the Republic of Belarus, 1998, - 92 p. 12. Chernobyl catastrophe. Results and the problems of overcoming its consequences in Russia 1986-2001//
National Report of Russia, Moscow, 2001 13. Results of investigations of radioactive contamination of 60-km radius zone around Chernobyl NPP using
airborn-gamma-spectrum survey and plane-table set.// Proceedings of international conference "Radioactivity after nuclear explosions and accidents", Moskow, April 24-26, 2000, Sankt-Peterburg, Hydrometeoizdat, 2000 (in Russ.)
14. Kvasnikova E.V., Pegoev A.N., Stukin E.D. Modern radionuclide contain of the Chernobyl deposition on the different distance from the location of the accident. // Proceedings of international conference "Radioactivity after nuclear explosions and accidents", Moskow, April 24-26, 2000, Sankt-Peterburg, Hydrometeoizdat, 2000 (in Russ.)
15. Arutunjan R.V., Bolshov L.A., Vasilieva S.K. at al. Spatial regularity of radionuclide contamination caused by accident on ChNPP. Atomnaya Energia, v.61, N6, 1993, p.453-457 (in Russ.)
16. Bogatov S.A., Borovoy A.A., Dubasov Yu.V. et al. Form and characteristics of fuel particles from ChNPP accident release. Atomnaya Energia, v.69, N.1, 1990, с.36-40 (in Russ.)
17. Loshilov N.A., Kashparov V.A., Polyakov V.D. at al. Nuclear-physical characteristics of hot particles caused by ChNPP accident. Radiochimiya, N4, 1992, p.113-119 (in Russ.)
18. Davydchuk V.S., Zarudnaya R.F., Mikheli S.V. Landscapes of the Chernobyl zone and their assessment by the condition of radionuclides migration. Kyiv, Naukova Dumka, 1994 (in Ukr.)
19. Buletеn ekologichnogo stanu zoni vidchudgennya ta zoni bezumovnogo (obov�yaskovogo) vidselenya, N5, 1995, p.20-21 (in Ukr.)
73
20. Gricenko N.N, Nechaeva N.S., Malachov at al. The radioactive contamination of exclusion zone of Zhitomir and Kyiv regions. Buletеn ekologichnogo stanu zoni vidchudgennya ta zoni bezumovnogo (obov�yaskovogo) vidselenya, N11, 1995, p.15-17 (in Ukr.)
21. Ageev V.A., Virichek S.L., Gaydar A.V. at al. The contamination of the Chornobyl exclusion zone by long-lived radionuclides. The object �Shelter� � 10 years, the basic results of scientific researches. Chornobyl, 1996, p.140-147(in Russ.)
22. Lyovshin E.B., Ageev V.A., Gaydar A.V. at all. Transuranium elements in the exclusion zone. Buletеn ekologichnogo stanu zoni vidchudgennya ta zoni bezumovnogo (obov�yaskovogo) vidselenya, N13, 1999, p.57-59 (in Ukr.)
23. Vishnevsky I.N., Gaydar A.V., Lyovshin E.B. et all. The compiling of the deposition maps of long lived radionuclides on the territory of Ukraine. // Proceedings of international conference "Radioactivity after nuclear explosions and accidents", Moskow, 2000, Sankt-Peterburg, Hydrometeoizdat, 2000 (in Russ)
24. Belyaev B.N., Gavrilov V.M., Domkin B.D. at al. Plutonium isotope content in soil and possibilities of contamination source identification. Atomnaya Energia, v.83, N4, 1997, p. 298-303 (in Russ.)
25. Bunzl K., Forster H., Kracke W. at al. Residence times off Fallout 239+240Pu, 238Pu, 241Am and 137Cs in the upper horizons of an undisturbed grassland soil. J. Environ. Radioactivity, 1994, v.22, N.1, p.11-27
26. Izrael Yu.A., Imshennik E.V., Kvashnikova E.V. at al. Long-range forecast of changes of radioactive contamination on territory of Russia by 137Cs after accident in Chernobyl NPP. Meteorologia i gidrologiya, 1998, N4, p.5-17 (in Russ.)
27. Izrael Yu.A., Petrov V.N., Severov D.A. Regional model of transport and radionuclide fallout due to ChNPP catastrophe. Meteorologia i gidrologiya, 1989, N6, p. 5-13 (in Russ.)
28. Buikov M.V., Garger E.K., Talerko N.N. Study of spotty structure of radioactive fallout by means of Lagrangian-Euler model. Meteorologia i gidrologiya. 1992, N12, p.33-45 (in Russ.)
29. Izrael Yu.A., Petrov V.N., Severov D.A. Radioactive fallout modelling for the nearest Chernobyl NPP zone. Meteorologia i gidrologiya. 1987, N7, p. 5-11 (in Russ.)
30. Meteorology and nuclear energy. /Edited by Bizova N.I. and Machonko K.P. Leningrad, Gidrometeoizdat, 1971, 648 p. (in Russ.)
31. Gaidar A.V., Tabachny L.Ya., Foursat A.D. Chornomorets N.F. Effect of landscape on the formation of the contamination structure on adjacent to ChNPP territory. Buletеn ekologichnogo stanu zoni vidchudgennya ta zoni bezumovnogo (obov�yaskovogo) vidselenya, 2000, N15, p. 58-61 (in Ukr.)
32. Beschasnov S.P., Naydenov A.V. Diffusion models of gas-aerosol current for local system of radiation monitoring. Atomnaya Energia, v.88, N6, 2000, p. 464-470 (in Russ.)