analysis of parameters effects on crack breathing … · analysis of parameters effects on crack...
TRANSCRIPT
*e-mail: [email protected]
Analysis of Parameters Effects on Crack Breathing and Propagation in Shaft of Rotor Dynamic Systems
M. Serier*, A. Lousdad , K. Refassi, A. Megueni
Mechanics of Structures and Solids Laboratory (LMSS), Mechanical Engineering Department, Faculty of Engineering Science, University of Sidi-Bel-Abbès, BP 89,
Cité Ben M’ hidi Sidi-Bel-Abbes 22000 – Algeria
Received: September 11, 2012; Revised: January 3, 2013
In this paper the design of experiment method is used to investigate and explain the effects of the rotor parameters on crack breathing and propagation in the shaft. Three factors are considered which have an influence on the behavior and the propagation of the crack: the rotational speed, the length of the rotor and the diameter of the shaft. The elaborated mathematical model allows determining the effects and interaction of speed, diameter and length on crack breathing mechanism.The model also determines the optimal values of the parameters to achieve high performance.
Keywords: rotor, shaft, crack, fracture, design of experiment (DOE)
1. IntroductionFatigue cracks are an important form of rotor damage
which can lead to catastrophic failures, production loses as well as casualties unless detected early. They can have detrimental effects on the reliability of rotating shafts.
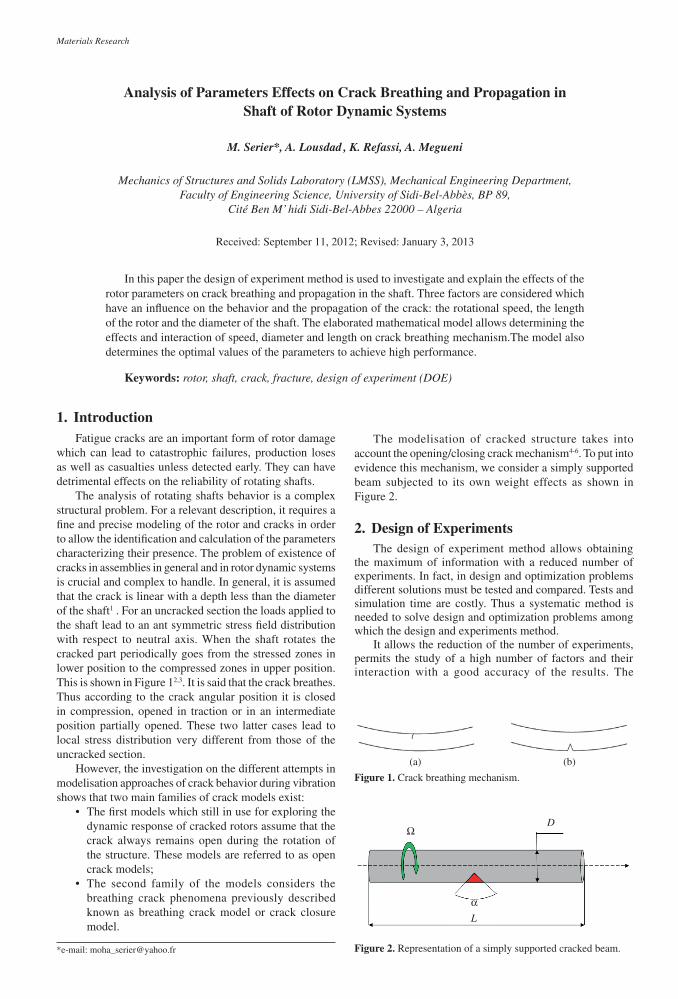
The analysis of rotating shafts behavior is a complex structural problem. For a relevant description, it requires a fine and precise modeling of the rotor and cracks in order to allow the identification and calculation of the parameters characterizing their presence. The problem of existence of cracks in assemblies in general and in rotor dynamic systems is crucial and complex to handle. In general, it is assumed that the crack is linear with a depth less than the diameter of the shaft1 . For an uncracked section the loads applied to the shaft lead to an ant symmetric stress field distribution with respect to neutral axis. When the shaft rotates the cracked part periodically goes from the stressed zones in lower position to the compressed zones in upper position. This is shown in Figure 12,3. It is said that the crack breathes. Thus according to the crack angular position it is closed in compression, opened in traction or in an intermediate position partially opened. These two latter cases lead to local stress distribution very different from those of the uncracked section.
However, the investigation on the different attempts in modelisation approaches of crack behavior during vibration shows that two main families of crack models exist:
• The first models which still in use for exploring the dynamic response of cracked rotors assume that the crack always remains open during the rotation of the structure. These models are referred to as open crack models;
• The second family of the models considers the breathing crack phenomena previously described known as breathing crack model or crack closure model.
The modelisation of cracked structure takes into account the opening/closing crack mechanism4-6. To put into evidence this mechanism, we consider a simply supported beam subjected to its own weight effects as shown in Figure 2.
2. Design of ExperimentsThe design of experiment method allows obtaining
the maximum of information with a reduced number of experiments. In fact, in design and optimization problems different solutions must be tested and compared. Tests and simulation time are costly. Thus a systematic method is needed to solve design and optimization problems among which the design and experiments method.
It allows the reduction of the number of experiments, permits the study of a high number of factors and their interaction with a good accuracy of the results. The
Figure 1. Crack breathing mechanism.
Figure 2. Representation of a simply supported cracked beam.
Materials Research

Serier et al.
method allows a rapid interpretation by giving an accurate experimental model of the system under study7,8.
2.1. Representation and determination of the number of experiments
A factorial plan is represented by 2k. The Figure 3 gives the interpretation of the representation.
2.2. Factorial plan
A factorial plan is one that has two or more factors9. In this context the Design of Experiment method is the suitable for this investigation.
In general the study of any phenomenon can be schematized as follows:
We are interested by a variable Y which we refer to as response which itself depends on a number of variables X1, X2, , Xn called factors.
The mathematical modeling consist in finding a function f such that Y = f (X1, X2, , Xn). A classical study method relies on the measure of the response Y for many values of variable Xi by maintaining fixed the (n-1) values of the other variables. The method is iterated for each variable. For four variables and with a decision to give five experimental values for each then 54 = 625 experiments should be conducted.
This high number crosses the feasible limit both in time and cost. Thus the number of experiments has to be reduced without altering the results10. The use of the design of experiment plan gives a strategy in the choice of experimental methods. The success of the design of experiments in research and industry is related to the need of competitivity of enterprises. They allow improvement of quality and reduction of costs. The method has been developed in the 1920s by Ronald A. Fisher11,12 for agronomic studies. It has had a considerable development due to the computer and computational development. The great novelty of design of experiment is that it proposes a factorial experimentation that is all the factors vary simultaneously. The treatment of the results is made by multiple linear regression and analysis of variance.
3. Optimization of Cracked Rotor by DOEThe modelisation of cracked structure is based on the
crack opening/closing mechanism which should be taken into account. To put into evidence this mechanism and investigate a cracked rotor dynamic system, we consider a simply supported beam subjected to the effects of its own weight.
In this study three factors are considered which have an influence on the behavior and the propagation of the crack:
the rotational speed, the length of the rotor and the diameter of the shaft. Each factor has two levels as shown in Figure 2.
3.1. Parameters definition and levels
Table 1 gives the experimental values of the parameters considered in this investigation obtained from a number of tests.
The first column identifies the tests, the second, the third and the fourth give the values of the three effects, and the fifth column gives the response.
3.2. Parameters coding
Table 2 gives the corresponding levels of the three parameters.
In the first line the three factors are at the lower levels, 250 rpm (–1 in coded units), 70 mm (–1) and 260 mm (–1). The eighth line contains the values of three factors with their high levels respectively 400 rpm (+1), 90 mm (+1) and 300 mm (+1). The intermediate lines represent the combination of values of the three effects.
3.3. Study domain
The grouping of the domains of the three factors defines the global study domain which is the experimental space chosen by the investigator to perform the eight tests. This means a well define experiments which are represented by the distribution of points in the domain of study as shown in Figure 4.
Table 1. Experimental table.
Test Rotational speedrpmX1
DiametermmX2
LengthmmX3
Crack’s angleα°Y
01 250 70 260 1.1
02 400 70 260 0.9
03 250 90 260 0.65
04 400 90 260 1.09
05 250 70 300 0.88
06 400 70 300 0.85
07 250 90 300 1.3
08 400 90 300 0.2
Table 2. Parameters coding and levels.
Test Rotational speedX1
DiameterX2
LengthX3
Crack’s angleα°Y
01 –1 –1 –1 1.1
02 +1 –1 –1 0.9
03 –1 +1 –1 0.65
04 +1 +1 –1 1.09
05 –1 –1 +1 0.88
06 +1 –1 +1 0.85
07 –1 +1 +1 1.3
08 +1 +1 +1 0.2Figure 3. Representation of experiment plan.
Materials Research

Analysis of Parameters Effects on Crack Breathing and Propagation in Shaft of Rotor Dynamic Systems
3.4. Factors effects and interaction
In this study we have considered three influencing parameters respectively the speed, the diameter and the length. Thus it is necessary to compute their effects and interaction. In the following their interaction effect is evaluated and characterized by the average mean (a0).
The calculation uses matrix system of the form:
y(n,1)
= X(n,p)
⋅ a(p,1)
(1)
The solution of the system is obtained by the root mean square method. The solution is noted â and is given by the following expression:
â = (Xt X)–1 Xt y (2)
The mathematical model obtained has the following form:
y = a0 + a1 x1+ a2 x2+a3 x3+ a4 I12 + a5 I13+ a6 I23 (3)
where ai (i =0,1,..,6) are given in Table 3.
4. Results and AnalysisFrom the obtained model the effect of each parameter
and the interaction of the three combined factors are analyzed.
4.1. Analysis of the single factor effect
The effect of each single factor is represented in Figure 5a-c for speed, diameter and length.
It can be observed that for a length equal to 260 mm, the crack mechanism angle is 0.78°. For the maximum value of the length the crack angle increases up to 1.419° as shown in Figure 5c.
The same observation is made for the diameter. For a diameter of 70 mm the crack angle is 0.769° and for 90 mm the crack angle is 1.42° as show in Figure 5b.
We also notice that the slope of the curve representing the speed in Figure 5a is less steep than the slope of the other two parameters as shown in Figures 5b, c. This means that the length and the diameter have significant effects than the speed.
4.2. Analysis of parameters interaction
4.2.1. Speed and diameter interaction
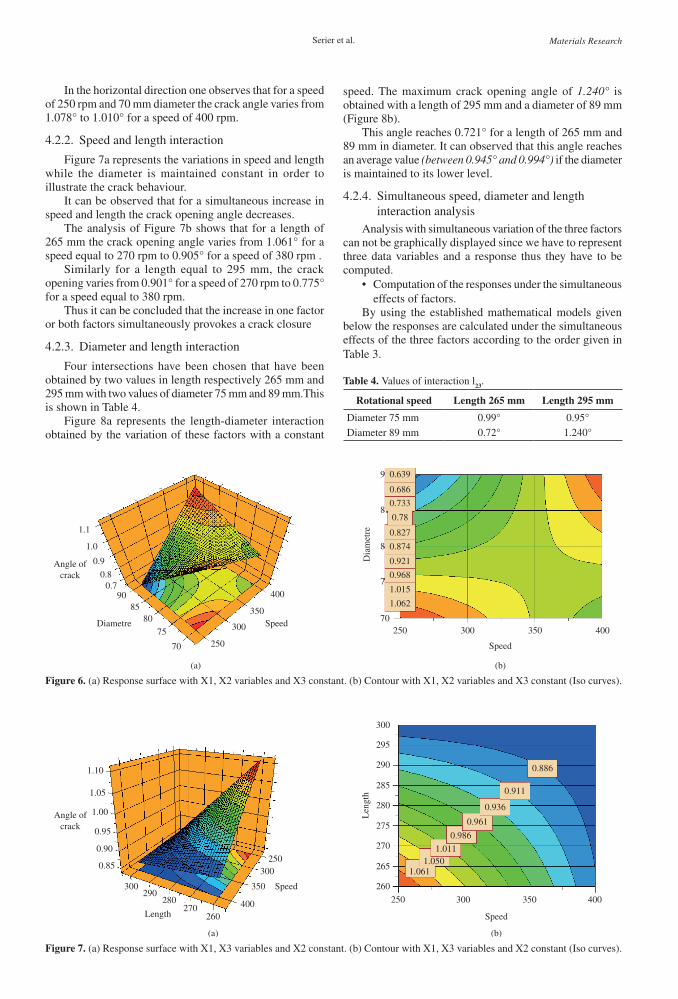
The diameter and speed interaction is represented by the response surface shown in Figure 6a and by the contour plot shown in Figure 6b.
The speed of the rotor varies from 250 rpm to 400 rpm and the variation of the diameter from 70 mm to 90 mm. The length of the rotor has been maintained constant.
Figure 6b represents the projection of the response surface referred to as iso-curves. On can easily pick other predicted by the model than those measured.
From the figure and in the vertical direction one can notice that for a speed of 200 rpm the opining angle of the crack varies from 1.062° for 73 mm diameter to 0.632° for a 90 mm diameter.
Table 3. Effects of factors and their interactions.
a0 a1 a2 a3 a4 a5 a6
Average Effect of speed Effect of diameter
Effect of length InteractionSpeed/diameter
I12
InteractionSpeed/length
I13
Interactiondiameter/length
I23
1.09625 0.2275 0.3275 0.3225 0.3425 0.1075 0.4575
Figure 4. Study domain.
Figure 5. Representation of parameter effects.
Serier et al.
In the horizontal direction one observes that for a speed of 250 rpm and 70 mm diameter the crack angle varies from 1.078° to 1.010° for a speed of 400 rpm.
4.2.2. Speed and length interaction
Figure 7a represents the variations in speed and length while the diameter is maintained constant in order to illustrate the crack behaviour.
It can be observed that for a simultaneous increase in speed and length the crack opening angle decreases.
The analysis of Figure 7b shows that for a length of 265 mm the crack opening angle varies from 1.061° for a speed equal to 270 rpm to 0.905° for a speed of 380 rpm .
Similarly for a length equal to 295 mm, the crack opening varies from 0.901° for a speed of 270 rpm to 0.775° for a speed equal to 380 rpm.
Thus it can be concluded that the increase in one factor or both factors simultaneously provokes a crack closure
4.2.3. Diameter and length interaction
Four intersections have been chosen that have been obtained by two values in length respectively 265 mm and 295 mm with two values of diameter 75 mm and 89 mm.This is shown in Table 4.
Figure 8a represents the length-diameter interaction obtained by the variation of these factors with a constant
speed. The maximum crack opening angle of 1.240° is obtained with a length of 295 mm and a diameter of 89 mm (Figure 8b).
This angle reaches 0.721° for a length of 265 mm and 89 mm in diameter. It can observed that this angle reaches an average value (between 0.945° and 0.994°) if the diameter is maintained to its lower level.
4.2.4. Simultaneous speed, diameter and length interaction analysis
Analysis with simultaneous variation of the three factors can not be graphically displayed since we have to represent three data variables and a response thus they have to be computed.
• Computation of the responses under the simultaneous effects of factors.
By using the established mathematical models given below the responses are calculated under the simultaneous effects of the three factors according to the order given in Table 3.
Figure 6. (a) Response surface with X1, X2 variables and X3 constant. (b) Contour with X1, X2 variables and X3 constant (Iso curves).
Figure 7. (a) Response surface with X1, X3 variables and X2 constant. (b) Contour with X1, X3 variables and X2 constant (Iso curves).
Table 4. Values of interaction l23.
Rotational speed Length 265 mm Length 295 mm
Diameter 75 mm 0.99° 0.95°
Diameter 89 mm 0.72° 1.240°
Materials Research

Analysis of Parameters Effects on Crack Breathing and Propagation in Shaft of Rotor Dynamic Systems
y = 1.09625+ 0.2275x1+ 0.3275x2+0.3225x3+ 0.3425I12+ 0.1075I13+ 0.4575I23 (4)
y1 = 1.09625+ 0.2275(-1)+ 0.3275(-1)+0.3225(-1)+ 0.3425(1)+ 0.1075(1)+ 0.4575(1)
y1 = 1.33
y2 = 1.09625+ 0.2275(1)+ 0.3275(-1)+0,3225(-1)+ 0.3425(-1)+ 0.1075(-1)+ 0.4575(1)
y2 = 0.68
y3 = 1.09625+ 0.2275(-1)+ 0.3275(1)+0.3225(-1)+ 0.3425(-1)+ 0.1075(1)+ 0.4575(-1)
y3 = 0.18
y4 = 1.09625+ 0.2275(1)+ 0.3275(1)+0.3225(-1)+ 0.3425(1)+ 0.1075(-1)+ 0.4575(-1)
y4 = 1.11
y5 = 1.09625+ 0.2275(-1)+ 0.3275(-1)+0.3225(1)+ 0.3425(1)+ 0.1075(-1)+ 0.4575(-1)
y5 = 0.64
y6 = 1.09625+ 0.2275(1)+ 0.3275(-1)+0.3225(1)+ 0.3425(-1)+ 0.1075(1)+ 0.4575(-1)
y6 = 0.63
y7 = 1.09625+ 0.2275(-1) + 0.3275(1) +0.3225(1) + 0.3425(-1) + 0.1075(-1) + 0.4575(1)
y7 =1.53
y8 = 1.09625+ 0.2275(1) + 0.3275(1) +0.3225(1) + 0.3425(1) + 0.1075(1) + 0.4575(1)
y8 = 2.33
Figure 8. (a) Response surface with X2, X3 variables and X1 constant. (b) Contour with X2, X3 variables and X1 constant (Iso curves).

Serier et al.
It is evident that crack breathing is detrimental, so it must be avoided by not using the values that give the maximum crack opening angle which may result in shaft fracture.
The graph of Figure 9 shows two types of values, the theoretical values obtained from the mathematical model which are represented by the straight line due to the linearity of the model. The second type concerns the experimental values which are represented by cloud points.
4.3. Estimation on the variance
The statistics that permit to know if the effects are significant, to compute confidence interval and to validate the linearity of the model are based on residuals ei which is the difference between the experimental and predicted values.
4.3.1. Calculation of residuals
The expression of residual is given by:
ei = |yiexp- yipre| (5)
Table 5 gives the values of the standard deviation.The values of the deviation representing the difference
between experimental and predicted values are small and thus one can conclude that the model is validated and is accurate as shown in Figure 9.
For better confirmation of model fitness, the computation of the variance is made whose square is given by:
2 21– is e
n p= ∑
(6)
where n is the number of experiments and p the model coefficients.
Thus we have:
( )2 1 0.5338 – 7
s = (7)
In this condition we can demonstrate that all the effects
have the same variance given by:
2 0.533 0.0668is = =
(8)
4.3.2. Tests of the significance of the effects
Student<< t>> test is used. An effect is significant if
the associated variable or interaction has an influence on
the response. A Student table is used with vn – p degree of
freedom with a first kind risk α (commonly 5% or 1%). This
allows picking the value of tcrit (α, ν) from Student table.
The rule of the test is as follows:
• If | the parameter effect | > tcrit (α, ν) * si: The effect
is significant.
• If | the parameter effect | < tcrit (α, ν) * si: The effect
is not significant.
If we take α = 0. 2 we have ν = 1 then ti = 3.078 tcrit
(α, ν) * si = 0.203
Thus:
Table 5. Values of the deviations.
yiexp yipre ei = |yiexp – yipre|
1.1 1.33 0.23
0.9 0.68 0.22
0.65 0.18 0.47
1.09 1.11 0.02
0.88 0.64 0.24
0.85 0.63 0.22
1.3 1.53 0.23
2 2.33 0.33
Figure 9. Distribution of the calculated response with respect to the response line.
Materials Research
Analysis of Parameters Effects on Crack Breathing and Propagation in Shaft of Rotor Dynamic Systems
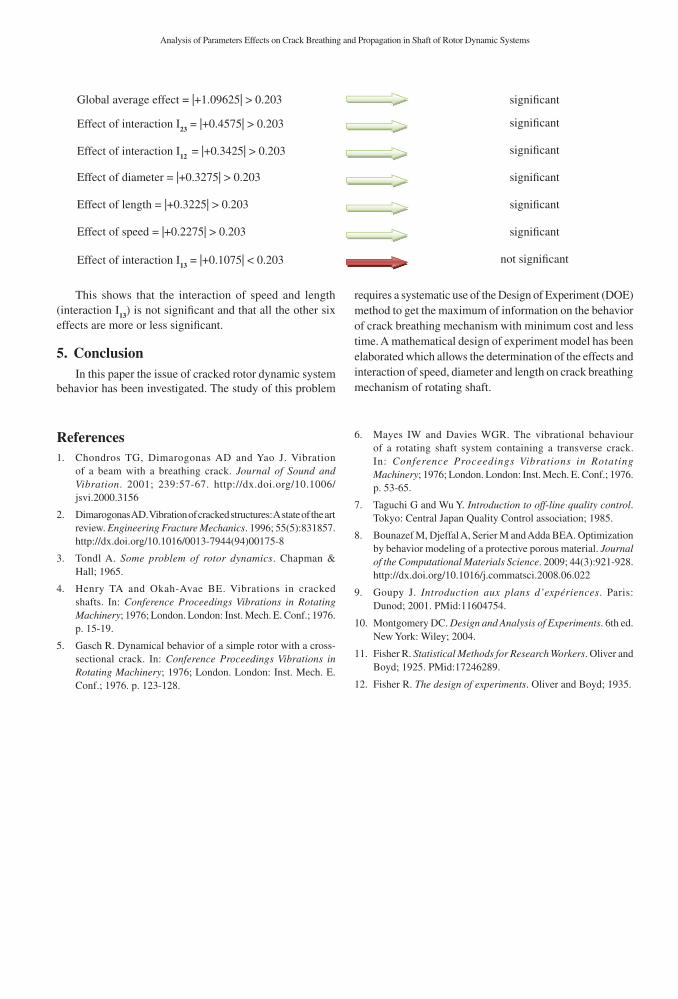
This shows that the interaction of speed and length (interaction I13) is not significant and that all the other six effects are more or less significant.
5. ConclusionIn this paper the issue of cracked rotor dynamic system
behavior has been investigated. The study of this problem
requires a systematic use of the Design of Experiment (DOE) method to get the maximum of information on the behavior of crack breathing mechanism with minimum cost and less time. A mathematical design of experiment model has been elaborated which allows the determination of the effects and interaction of speed, diameter and length on crack breathing mechanism of rotating shaft.
Global average effect = |+1.09625| > 0.203 significant
Effect of interaction I23 = |+0.4575| > 0.203 significant
Effect of interaction I12 = |+0.3425| > 0.203 significant
Effect of diameter = |+0.3275| > 0.203 significant
Effect of length = |+0.3225| > 0.203 significant
Effect of speed = |+0.2275| > 0.203 significant
Effect of interaction I13 = |+0.1075| < 0.203 not significant
References1. Chondros TG, Dimarogonas AD and Yao J. Vibration
of a beam with a breathing crack. Journal of Sound and Vibration. 2001; 239:57-67. http://dx.doi.org/10.1006/jsvi.2000.3156
2. Dimarogonas AD. Vibration of cracked structures: A state of the art review. Engineering Fracture Mechanics. 1996; 55(5):831857. http://dx.doi.org/10.1016/0013-7944(94)00175-8
3. Tondl A. Some problem of rotor dynamics. Chapman & Hall; 1965.
4. Henry TA and Okah-Avae BE. Vibrations in cracked shafts. In: Conference Proceedings Vibrations in Rotating Machinery; 1976; London. London: Inst. Mech. E. Conf.; 1976. p. 15-19.
5. Gasch R. Dynamical behavior of a simple rotor with a cross-sectional crack. In: Conference Proceedings Vibrations in Rotating Machinery; 1976; London. London: Inst. Mech. E. Conf.; 1976. p. 123-128.
6. Mayes IW and Davies WGR. The vibrational behaviour of a rotating shaft system containing a transverse crack. In: Conference Proceedings Vibrations in Rotating Machinery; 1976; London. London: Inst. Mech. E. Conf.; 1976. p. 53-65.
7. Taguchi G and Wu Y. Introduction to off-line quality control. Tokyo: Central Japan Quality Control association; 1985.
8. Bounazef M, Djeffal A, Serier M and Adda BEA. Optimization by behavior modeling of a protective porous material. Journal of the Computational Materials Science. 2009; 44(3):921-928. http://dx.doi.org/10.1016/j.commatsci.2008.06.022
9. Goupy J. Introduction aux plans d’expériences. Paris: Dunod; 2001. PMid:11604754.
10. Montgomery DC. Design and Analysis of Experiments. 6th ed. New York: Wiley; 2004.
11. Fisher R. Statistical Methods for Research Workers. Oliver and Boyd; 1925. PMid:17246289.
12. Fisher R. The design of experiments. Oliver and Boyd; 1935.