analysis of nursing data flow to nurse managersioe481/ioe481_past_reports/w0411.pdf · analysis of...
TRANSCRIPT

Analysis of Nursing Data Flow to Nursing Managers Final Report
University of Michigan Hospitals and Health Centers
Program and Operations Analysis Department
Nursing Business Operations
Fernando Gonzalez
Luis Salas Dave Stajninger Elliott Walter
April 19, 2004

TABLE OF CONTENTS
EXECUTIVE SUMMARY......................................................................................3
INTRODUCTION & BACKGROUND....................................................................6
APPROACH & METHODOLOGY ........................................................................6
GENERAL FINDINGS AND CONCLUSIONS ......................................................7
CLINICAL DATA ..................................................................................................8
Patient Restraint Orders .......................................................................................................... 8
Patient Controlled Analgesia...................................................................................................9
Clinical Performance Indicators............................................................................................10
Clinical Data Recommendations...........................................................................................11
EMPLOYEE SATISFACTION ............................................................................12
PATIENT SATISFACTION.................................................................................15
CONCLUSIONS .................................................................................................18
APPENDIX A: DETAILED DESCRIPTION OF THE FLOW MAP FOR EMPLOYEE SATISFACTION ............................................................................19
APPENDIX B: DETAILED DESCRIPTION OF THE FLOW MAP FOR PATIENT SATISFACTION .................................................................................................20
APPENDIX C: WEBSURVEYOR END USER SURVEY ....................................22
2

Executive Summary Initially, Nursing Business Operations within the University of Michigan Hospitals and Heath Center (UMHHC) did not have a well documented account of the existing processes for collecting, analyzing and disseminating nursing data. Our team investigated these processes and conducted analyses. The analysis included interviewing pivotal data auditors and facilitators, surveying end users of nursing data, and shadowing data auditors. The task of the team was to document the current processes and identify areas of improvement. Included in the scope of nursing data are three specific types of data:
• Clinical Data • Employee Satisfaction Data • Patient Satisfaction Data
Clinical Data Clinical data consists of three groups; patient restraint orders, patient controlled analgesia, and clinical performance indicators. Findings
• Data collection process is highly variable, requiring as much as 30 minutes per audit, and as little as 5 minutes per unit audited.
• Sources of variation: flow boards are not used in some departments, flow boards do not have a standard location in other departments, and doctors’ signatures are often hard to obtain (or require a long waiting period, dependent on doctors’ availability).
• Sources of variation are beyond the control of Nursing Business Operations. They require modification of current nurse and doctor procedures.
• Data entry is very inefficient. Data is initially entered in Microsoft Word, then manually copied from Word to Microsoft Excel, then manually processed into graphs and charts to create unit specific reports.
• Data collection is completely manual. • All activities involving Nursing Business Operations cost approximately
$97,000 per year. Recommendations
• Design a future student project to focus more specifically on this area, where the group would have the influence to modify the current data collection process.
• Investigate the use of Morrisey Concurrent Care Manager software and/or other IT tools such as handheld electronic devices for data collection and auditing. This would give real-time data that is immediately loaded into a database and ready to be processed, once it is recorded.
• Use one FTE instead of two PTE to audit data
3

Employee Satisfaction Data Findings
• Sample size of internal survey, which is used to evaluate employee sentiments, has been declining over the past year and a half (1201 respondents in June of 2002, compared to 819 in December of 2003).
• Respondents can answer the survey as many times as they wish, which can lead to unrepresentative data.
• From the survey our group conducted on nursing data end users (i.e. nursing managers, directors, and support personnel), approximately half of the respondents stated that they received reports in an untimely manner. This indicates that the usability of reports declines if they are outdated once they are received (Survey based on the responses of 38 out of the 47 who were invited to complete the survey)
• Approximately 30% of respondents also said that the reports they received were not presented clearly.
• Creating employee satisfaction reports cost Nursing Business Operations approximately $1,600 annually to produce reports.
Recommendations
• Purchase a contract with WebSurveyor <www.websurveyor.com>. This service will allow employee satisfaction to be delivered to end users faster. It would not allow those surveyed to answer more than once. Additionally, more effective and efficient surveys may help remedy the problem with decreasing sample size. The service would also be available for other functions of Nursing Business Operations, not just employee satisfaction.
• If Nursing Business Operations wants to keep the current system, hire a junior programmer (a student from the computer science field at the University) to write Microsoft Excel macros. The macros would be constructed to automatically process employee satisfaction responses and create reports. After the initial cost outlay to create the macros, they would require little maintenance.
Patient Satisfaction Data Findings
• Outsourced to Press Ganey. • Costs approximately $6,400 annually to Nursing Business Operations to
create reports. • Data from Press Ganey reports that is already in electronic form is being
re-entered into Excel to create specialized reports. • These specialized reports are then emailed to the end users. • Manual process can often take longer than one month, and reports are
presented quarterly.
4

Recommendations • Use eCompass software currently provided by Press Ganey to create
patient satisfaction reports for end users. Data is updated approximately once a month, not quarterly. Specialized reports can be produced in less than 15 minutes, as opposed to the current one month process.
• Provide training to nursing managers and other end users, so that they can create real-time, specific reports. Training requirements would be minimal, as eCompass is very straightforward. Make this part of the nursing managers’ job descriptions.
• This would eliminate $6,400 in labor hours to produce current reports.
5

Introduction & Background This project was conducted for Nursing Business Operations within the University of Michigan Hospitals and Health Center (UMHHC). Initially, a well-documented account of the methods used for collecting, preparing, and disseminating nursing administrative data to its twenty-nine nursing units did not exist (nursing administrative data consists of clinical data, employee satisfaction data, and patient satisfaction data). As a result, Nursing Business Operations was not fully aware of the resources being allocated to the existing processes. Additionally, the timeliness and usefulness of nursing data as perceived by the end users (nursing managers, nursing directors, and support personnel) were also unknown. The task, therefore, was to collect information relevant to the nursing data process, to analyze findings, and to recommend solutions that will increase efficiency, cost effectiveness, organization, and usefulness of nursing data. This report presents our findings and recommendations. Approach & Methodology The three steps conducted for each of three nursing data types are data collection, data analysis, and recommendations. The following section describes the data collection process. Data Collection The data collection phase included interviewing data auditors and facilitators, shadowing data auditors, and surveying end users. Data facilitators are those who process data and create and disseminate reports.
Interviews First, we interviewed key data collectors, processors, and disseminators. A clinical nurse
consultant (CNC) and Quality Improvement (QI) personnel provided insight on the collection, preparation, dissemination, and overall structure of employee and patient satisfaction data. From this information, we created process flow maps for employee and patient satisfaction data flow. These process flow maps identify the current channels that employee and patient satisfaction data follows from conception to dissemination.
Secondly, our team interviewed two data auditors, who perform manual data collection throughout the various units, to gain an understanding of the flow of clinical data. Clinical data includes three categories that Nursing Business Operations is responsible for; patient restraint orders, clinical performance indicators (CPI), and patient controlled analgesia (PCA). Shadowing Data Auditors
6

One project goal was to determine the cost of specific clinical operations performed by Nursing Business Operations in the UMHHC. Specifically, the client wished to identify both the cost of auditing and the cost of producing clinical data reports. Initially, interviews were conducted with the data auditors to understand the process. Then, members of our team followed the auditors throughout the hospital while they performed their duties. The team recorded the amount of time to accomplish tasks and made observations on the current process. End User Survey Ultimately, timeliness and usability of nursing data is critical to its purpose. An eleven question web-based survey was conducted to determine the perceptions of the end users with regard to the nursing data reports they receive. End users include the nursing managers, 4 nursing directors, and support personnel. The service used is an on-line platform called WebSurveyor. Of the forty-seven survey recipients, thirty-seven responded within the allotted one week period. The survey asked about timeliness, format, and usefulness of the nursing data reports received by end users. The questions and results of the entire survey are included in Appendix C. After collecting data, we analyzed interview results, process flow maps, and end user surveys to identify areas for improvement. General Findings and Conclusions The results of the end user survey revealed similar perceptions of all three types of nursing data. Timeliness of Delivery Participants were asked if nursing data reports are delivered in time to be included in management decisions. Table 1 shows that nearly half of the participants feel that the reports are delivered too late, for each data type. Table 1: Timeliness of delivery
Report Arrives on time (%) Arrives too late (%) Employee Satisfaction 56.8 43.2 Patient Satisfaction 45.7 54.3 Clinical Data 51.4 48.6 These results, along with additional comments provided by survey participants, indicate that end users would benefit greatly from faster delivery. Specifically, the comments provided by some respondents expressed the need for real-time results to make effective management decisions. Clarity of Reports
7

Currently, all reports are manually generated in Microsoft Excel. Approximately 30% of respondents indicated that the presentation of nursing reports is unclear. This statistic indicates that improvements in the format of nursing data reports would benefit end users. Clinical Data
Clinical data is collected and prepared to monitor compliance with Joint Commission on Accreditation of Healthcare Organizations (JHACO) requirements and to track unit performance. Nursing Business Operations is responsible for three types of clinical data: patient restraint orders (restraints), patient controlled analgesia (PCA), and clinical performance indicators (CPI). Currently, two PTE act as data auditors. One works 20 hours per week and the other works 24. Patient Restraint Orders Patient restraint orders must be completed whenever a patient is physically restrained to a bed by straps or other restraints. For each 24 hour period that a patient is restrained, a doctor must sign a restraint order. Nursing Business Operation’s role is to audit the hospital’s compliance with this requirement. Reports are created quarterly. Current State Our team planned to map the restraint collection process by shadowing the data auditors through their rounds in the hospital. After shadowing the data auditors and discussing with our client and coordinator, we concluded that the actual data collection and auditing process was outside the scope of this project. Extensive time and intense investigation must be allocated to clinical data collection analysis. The team instead mapped the creation of restraint order reports. Figure 1 displays the data flow, once the audits and collections have taken place.
Restraint auditingprocess is high in
variation and outside ofproject scope
1. Auditors sendrestraint results to
CNC
2. CNC enters data toExcel and creates
comparative reports
3. CNC sendsspecific reports to
end users
Figure 1: Restraint data process flow Findings The following findings are based on interviews and observations.
• The cost of auditing restraint order is based on the labor of the CNC and the two auditors. The CNC estimated that she spends 196 hours receiving, sorting, and performing other duties related to maintaining all clinical data. Since there are three types of clinical data, this translates roughly to 65.33 hours for each type per
8

year. She also estimated that each quarter, she spends roughly 80 hours creating clinical data reports. This means that she spends 320 hours per year creating clinical data reports. Since there are three types of clinical data, 106.67 hours are allocated to creating restraint reports.
Using nine months of a recorded time sheet, and extrapolating to twelve months, we determined that the first data auditor spends about 607 hours on restraints. Since the second data auditor does not complete time sheets, we interviewed and determined that she spends about 613 hours per year on restraints. All three employees are paid $40 per hour in salary and benefits. The total cost to audit and create reports for restraints each year is computed as follows: (65.33 + 106.67 + 607 + 613) * $40 = $55,680 per year
• Each year, 64 audits are conducted, 52 on ICUs and 12 on general units. The cost
per audit is computed as follows: $55,680/64 audits = $870 per audit • The data collection process is highly variable. This process can take anywhere
from 5 to 30 minutes to complete an audit on one unit. • Data collection is mostly manual. • There are several sources of variation. Flow boards, which are binders used to
hold restraint orders, do not have standard locations in each unit. Also, doctors’ signatures are often hard to obtain (or require a long waiting period, dependent on doctors’ availability).
• Improvement on these sources of variation is beyond the scope of this project, since it would require intervention in nursing unit practices and doctors’ procedures.
Patient Controlled Analgesia Patient controlled analgesia audits are conducted to track the completion and efficacy of pain management. Reports are created quarterly. Current State As with restraints, after the initial shadowing of the data auditors, our group focused on mapping the report creation for PCA, not the actual auditing process. The flow map in Figure 2 is similar to that of restraints.
9

PCA auditing process ishigh in variation and
outside of project scope
1. Auditors sendPCA results to
CNC
2. CNC enters data toExcel and creates
comparative reports
3. CNC sendsspecific reports to
end users
Figure 2: PCA data process flow. Findings
• The cost of auditing PCA has the same components as restraints. Maintenance of PCA is also 65.33 hours and report creation is 106.67 hours.
From the first data auditor’s time sheets, we found that she spends about 107 hours per year on PCA. The second data auditor does not perform PCA functions. The cost of auditing and reporting PCA is computed as follows: (65.33 + 106.67 + 107) * $40 = $11,160 per year
• Each year, 52 audits are conducted.
$11,160 / 52 audits per year = $214.62 per audit
• Data collection is completely manual. Clinical Performance Indicators Clinical performance indicators are a series of critical areas that are measured to gauge performance of a particular unit. The Functional Health Pattern Assessment is audited to ensure that employees are completing the inpatient charts correctly. A correct completion percentage of 95% is required by JCAHO. Current State Our team investigated both the auditing process and the creation of reports for clinical performance indicators. Figure 3 displays the process flow map.
10

1. Auditor retrievescharts from chart
storage
2. Auditors enterchart info to
Word template
3. Auditor emailscompleted
templates to CNC
4. CNC printscompletedtemplates
5. CNC entersdata to Excel andcreates reports
6. CNC sendsreports to end
users
Figure 3: CPI data process flow Findings
• As with the previous two clinical data types, the CNC contributes 65.33 and 106.67 labor hours per year for CPI.
From the time sheets of the first data auditor, we determined that she contributes 148 labor hours per year. From interviewing the second data auditor, we determined that she contributes 438 labor hours per year. The cost of auditing and reporting CPI is computed as follows:
(65.33 + 106.67 + 148 + 438) * $40 = $30,320 per year • PCA audits take place quarterly. Each quarter, 10 charts are audited in each of the
29 nursing units, for a total of 290 charts. The cost per PCA is computed as follows:
$30,320 / 116 units per year = $261. 38 per unit
• Data collection is highly manual. • Data processing is highly redundant.
Clinical Data Recommendations The clinical data process is highly manual and variable. After interviewing and shadowing data auditors, and attempting to conduct time studies, we determined that a second student group should be asked to focus on the specifics of the clinical data auditing process.
• Design a future student project to focus more specifically on this area. The investigating group would need the ability to modify the current process. This includes the power to relocate flow boards and change doctor procedures.
11

• Investigate the use of Morrisey Concurrent Care Manager. This software is already owned and utilized by UMHHC. It offers the ability to utilize wireless technology to conduct data collection and auditing in a highly efficient manner.
• Instead of 2 PTE (20 hours, 24 hours) use 1 FTE working 40 hours per week. The
savings will be realized by eliminating one benefits package. Employee Satisfaction Current State Employee satisfaction reports are created semiannually from internal surveys taken by UMHHC employees. The following process flow map represents the steps that are completed twice a year to produce employee satisfaction reports for Nursing Business Operations.
1. Electronic SurveyInitiated by QI
2. Employees haveone month to
complete survey
3. Excel reportscreated by QI
5.CNC extracts 3pertinent responses
No
Errors? Yes 4.Report Edited(QI)
Errors?
6. CNC creates unitspecific reports in
Excel
7. CNC disseminatesreports to end users
Yes
No
20 Day Lead Tim
e
Employee Satisfaction Data Flow Process Description (refer to Figure 4) Quality Improvement initiates an in-house electronic survey to all UMHHC employees, which is voluntarily completed. QI uses filters and macros to create Excel reports. At this point, the data enters into Nursing Business Operations, which is represented by the dotted line. The clinical nurse consultant receives the report on behalf of Nursing Business Operations. If there are errors found in the data, the CNC returns it for correction to QI. The CNC then extracts three responses from the survey and creates specific reports in Excel. The CNC then sends the reports to the end users via email. For a more detailed description of the process refer to APPENDIX A.
Figure 4: Employee satisfaction data flow
12

Findings Based on the interviews, web-based survey, and flow maps, our findings are as follows:
• QI processes and sends ~ 130 personalized employee satisfaction reports to different areas of the UMHHC. Nursing Business Operations relies on QI for employee satisfaction reports. Excessive processing due too software limits and centralized reception of the survey information by one FTE creates a lag in the process. This prevents the end user from receiving the data in a timely manner.
• Due to the use of a centralized Oracle database, to which only one FTE on QI has
access, real-time data is not available for distribution. End users expressed that the data from these reports is sometimes not useful since action taken on delayed indicators is not always accurate and effective.
• The actual survey conducted by QI, from which Nursing Business Operations’
reports are subsequently created, is unreliable since the survey can be completed multiple times by a single employee. QI attempts to filter noise from the surveys, but knowing weather a repeated IP address is from the same employee, or from a different one taking the survey on a shared computer, is not possible.
• One manager expressed that in many cases, the sample sizes for survey responses
are very low. When data is filtered for specific units, sample sizes can be much less than 10. Decisions can not be made on data with an extremely low sample size because it leads to inaccurate conclusions.
Recommendations Alternative 1: Macros
• Investigate the feasibility of creating Microsoft Excel macros to expedite the process of creating reports for Nursing Business Operations. This would require hiring a junior programmer to write macros that will automatically create and send the reports needed by end users after QI has processed the survey results. This entails a one time set up cost with periodic maintenance from an administrative assistant.
Alternative 2: WebSurveyor
• Implement the WebSurveyor service within Nursing Business Operations. Nursing Business Operations could conduct specific surveys independent of QI. This will also allow Nursing Business Operations to create and conduct other surveys when needed. The service can be obtained for $1500 per year. Other, more capable contracts are available for more money. Refer to Table 2 for pricing details.
13

Table 2: WebSurveyor pricing NOW PRO PRO PLUS ENTERPRISE SERVER
Type Hosted Hosted Hosted Dedicated Hosted License
Concurrent Surveys¹ 1 1 1 25 1
Number of Surveys 1 Unlimited Unlimited Unlimited Unlimited
Duration 3 months 12 months 12 months 12 months Perpetual²
Number of Users 1 1 1 Unlimited Unlimited
Email Invitations $0.05 ea $0.05 ea Included n.a. n.a.
Administration Tools n.a. n.a. n.a. Included Included
Price³ $449/survey $1,500/year $2,000/year $1,000/month $3,000
Call 1-800-787-8755 for a custom price quotation.
• Further investigation on budget allocation for WebSurveyor service is necessary.
Potential Improvements
Alternative 1: Macros
• Steps 4-7 on Figure 4 can be eliminated, which allow data to be processed closer to real-time.
• This translates into a cost savings of approximately $1600/year (40 hours x $40/hour). The startup costs and maintenance of the macros would most likely have similar costs, but there would be improvement in quality and timeliness of reports.
Alternative 2: WebSurveyor
• This would also save $1600 in labor, which instead could be spent on the service. • Surveys can be conducted within Nursing Business Operations as often as
necessary without the addition of a new FTE, and they yield real-time information on any employee satisfaction related issue.
• Real-time display in graphs of data collected, as well as actual response rate displayed.
• Data could become more reliable. Assuming that the low cost for this software can be absorbed by the Nursing Business Operations budget, employees will be able to express their concerns on a real time basis. Nursing Business Operations can also observe the general perceptions of employees, on multiple issues. As the data becomes more reliable and used in decision making, employees will have an incentive to complete the surveys.
• Software provides user friendly interface.
14

• Cumbersome current process flow transforms to a self-contained and continuous three step process with no lead time.
Patient Satisfaction Current State Patient satisfaction reports are created quarterly. The following process flow map represents the steps that are completed four times per year to produce patient satisfaction reports for Nursing Business Operations.
1.Press Ganeyconducts surveys on
previous patients
2. PG delivers reportto UMHCC in
electronic format
3. QI sends uneditablereport via email to
CNC
4. Report printed byCNC
5. Selected surveyresponses extracted
by CNC
6. Select survey responsesre-entered to create individual
unit reports in Excel
7. Reports sentelectronically to end
users
20-30 Day Lead Tim
e
Patient Satisfaction Data Flow Process Description (refer to Figure 5). Press Ganey conducts surveys on a random sample of patients who have been treated at the UMHHC. Press Ganey then sends the survey results electronically to the UMHHC. Using this data, Quality Improvement uses eCompass software to create reports for different departments throughout the UMHHC. A clinical nurse consultant (CNC) in Nursing Business Operations receives a report. The dotted box encloses the area involving NBO. The CNC prints the report, selects responses from the report that are relevant to nursing managers, directors and supporting employees, and then reenters that information into Excel. Individualized reports are created based on the selected responses. These reports are then sent by CNC via email to the end users. For a more detailed description of the process refer to APPENDIX B.
Figure 5: Patient satisfaction data flow The CNC performs Steps 4-7. The CNC reported that it takes roughly 40 hours to complete. Since the process is repeated four times per year, the total number of hours committed to this process is 160 hours. With salary and benefits totaling $40 per hour for the CNC, this process represents $6,400 in cost to Nursing Business Operations per year.
15

Steps 4-7, those which Nursing Business Operations conducts, take 20 or 30 days, and sometimes longer. Findings Based on the interviews, web-based survey, and flow charts our findings are:
• 54.3% of the users who receive patient satisfaction reports feel that the reports do not arrive on time.
• 30% of participants indicated that the presentation of information is not clear. • The cost of creating individual reports by the CNC is $6,400 per year. • Excessive and unnecessary data entry and processing is being done by the CNC.
Based on these findings we determined that there are opportunities for improvements with respect to clarity, timeliness and cost of the reports. Recommendations Our process flow recommendation is based on the following premises:
1. People are willing to share their unit data with other units (94.1% of the respondents agreed on the survey).
2. Timeliness of data arrival is questionable. 3. Quality of data presentation needs improvement.
Recommendation based on the above premises:
• End users should use eCompass software from Press Ganey to create their own customized reports
Steps 4-7 of Figure 5 can be replaced by the user friendly software that is currently available to the UMHHC at no additional cost. The eCompass software provided by Press Ganey, which is currently owned and utilized by UMHHC, is a tool that allows the user to manipulate the patient satisfaction results and tailor a report that serves his or her needs. It creates reports that are comprehensive, clear, and fast. eCompass can eliminate the unnecessary data entry that currently exists in the process, as well drastically reduce lead time of the report creation process. Figure 6 is a screen shot of the eCompass interface.
16

Figure 6: Press Ganey eCompass software screen shot
Instead of using an FTE to create and send reports to managers, end users can create reports on their own. Press Ganey updates the data every month. Instead of receiving reports four times per year, end users can create reports as needed. By participating in a short training session, they could learn to create patient satisfaction reports and obtain information in real-time. Potential Improvements
• Ability for nursing managers to create their own reports in real-time • Highly customizable, flexible, and user friendly reports • Improved report quality and accuracy, void of human error • Savings of $6400 for Nursing Business Operations • Lead time reduced to approximately 15 minutes
Figure 7 displays the flow map for the improved process incorporating eCompass.
17

1.Press Ganeyconducts surveys on
previous patients
2. PG delivers reportto UMHHC in
electronic format
3. End users useeCompass to create
reports
15 minutes
Figure 7: Recommended patient satisfaction data flow Steps 4-7 are eliminated in the current state, reducing the production lead time to 15 minutes. Implementation plan Teaching end users to use eCompass would require a small training session. Since the software is very user friendly, this training could take between 30 min and 2 hours, depending on the computer skills of the user. Additionally, the information technology department must make sure that all the end users have access to eCompass. Conclusions Nursing Business Operations has the ability to improve and streamline the current nursing data processes. The current processes are highly manual and would benefit from automation, which is available to UMHHC at reasonable costs, often less than the costs of the current methods being used.
18

APPENDIX A: Detailed description of the flow map for employee satisfaction 1) Quality Improvement initiates an in-house survey that was previously developed.
The survey is administered using web-based software that is licensed for general use in the UMHHC. Employees are notified by email and have one month to complete the survey, which is voluntary.
2) Employees complete the survey via intranet within one month of the release.
3) Quality Improvement compiles survey responses into an Oracle database. The
data is then sorted using macros, and specialized reports are created in Excel for different departments.
4) The CNC receives a nursing specific employee satisfaction report that contains
employee responses for various nursing units. At times, errors are found in the report received from Quality Improvement. If this occurs, the CNC sends the report back. The report is corrected, and then sent back to the CNC.
5) If no errors are found in the report, the CNC extracts the statistics for the
responses to following three questions/statements from the Excel report: 1. I feel satisfied with how my workplace concerns are addressed. 2. I enjoy working with my direct supervisor. 3. Willingness to recommend my department as a good place to work.
6) The CNC takes the three questions from the previous steps and creates individual Excel reports for different nursing units. Reports are also created for the four nursing directors.
7) Finally, the individual reports are sent to their respective units. The personnel who
receive these reports are nursing managers, nursing directors, as well as selected supporting employees.
19

APPENDIX B: Detailed description of the flow map for patient satisfaction
1. Press Ganey contacts a representative sample of patients from the UMHHC, and compiles a report comparing many aspects of patient satisfaction to those of other hospitals. Last quarter, 611 adult patients were surveyed for the adult report, and 308 children for the pediatric report. Press Ganey is under contract with the UMHHC, so this step is not changeable.
2. Press Ganey delivers their comprehensive report to the UMHHC. The report can
be viewed on the Press Ganey software, eCompass, by any health system employee with an authorized password. Passwords can be obtained from Quality Improvement. Quality Improvement accesses the Press Ganey results in eCompass and creates reports for different departments using eCompass. The reports are sent via email.
3. One of the departments that receives an electronic report from Quality
Improvement is Nursing Business Operations, which is the department that the team is performing this study. The Clinical Nurse Consultant (CNC) receives a copy.
4. The CNC then prints a hardcopy of the Press Ganey report.
5. Looking at the hardcopy, the CNC extracts survey answers from several
categories and enters them in to Excel. These categories are as follows (number of answers from respective category in parentheses):
a. Nursing (9) b. Visitors and Family (4) c. Physician (6) d. Discharge (4) e. Personal (10) f. Overall – Likelihood of Recommending (3) g. Intensive Care (4) h. Patient Education (3)
6. During the extraction process, the CNC creates reports specific to different nursing units within the hospital. These reports contain the same answer categories from the Press Ganey survey (a through h in the previous step), but with the responses of patients who stayed on the unit for whom the specific report is being created for. For example, the CNC would create one report with responses of patients who stayed on Unit 6a. The CNC would create a different report with responses of patients who stayed on Unit 7b. Reports are also created for the four nursing directors, with their corresponding units’ statistics in their respective reports.
20

7. Finally, the individual reports are sent to their respective units. The personnel who receive these reports are nursing managers, nursing directors, as well as selected supporting employees.
21

APPENDIX C: WebSurveyor End User Survey
EmailHard CopyWeb Page
Over what medium do you currently receive the following data?
Employee Satisfaction Patient Satisfaction Clinical Data
38
36
34
32
30
28
26
24
22
20
18
16
14
12
10
8
6
4
2
0
94.6 %
83.8 %
89.2 %
16.2 %
29.7 % 27.0 %
0.0 %
5.4 % 5.4 %
35 Email6 Hard Copy
Over what medium do you currently receive the following data? - Employee Satisfaction
Email Hard Copy
38
36
34
32
30
28
26
24
22
20
18
16
14
12
10
8
6
4
2
0
94.6 %
16.2 %
22

31 Email11 Hard Copy2 Web Page
Over what medium do you currently receive the following data? - Patient Satisfaction
Email Hard Copy Web Page
34
32
30
28
26
24
22
20
18
16
14
12
10
8
6
4
2
0
83.8 %
29.7 %
5.4 %
33 Email10 Hard Copy2 Web Page
Over what medium do you currently receive the following data? - Clinical Data
Email Hard Copy Web Page
36
34
32
30
28
26
24
22
20
18
16
14
12
10
8
6
4
2
0
89.2 %
27.0 %
5.4 %
23

EmailHard CopyWeb Page
Over what medium would you prefer to have the following data delivered to you?
Employee Satisfaction Patient Satisfaction Clinical Data
34
32
30
28
26
24
22
20
18
16
14
12
10
8
6
4
2
0
86.5 %
78.4 %
67.6 %
16.2 % 16.2 %
27.0 %
13.5 % 13.5 %
18.9 %
32 Email6 Hard Copy5 Web Page
Over what medium would you prefer to have the following data delivered to you? - Employee Satisfaction
Email Hard Copy Web Page
34
32
30
28
26
24
22
20
18
16
14
12
10
8
6
4
2
0
86.5 %
16.2 % 13.5 %
24

29 Email6 Hard Copy5 Web Page
Over what medium would you prefer to have the following data delivered to you? - Patient Satisfaction
Email Hard Copy Web Page
32
30
28
26
24
22
20
18
16
14
12
10
8
6
4
2
0
78.4 %
16.2 % 13.5 %
25 Email10 Hard Copy7 Web Page
Over what medium would you prefer to have the following data delivered to you? - Clinical Data
Email Hard Copy Web Page
26
24
22
20
18
16
14
12
10
8
6
4
2
0
67.6 %
27.0 %
18.9 %
25

YesNo, too soonNo, too late
Do the following data arrive when you need it?
Employee Satisfaction Patient Satisfaction Clinical Data
22
212019
18
171615
14
131211
10
987
6
543
2
10
55.6 %
47.1 %
52.9 %
0.0 % 0.0 % 0.0 %
44.4 %
52.9 %
47.1 %
20 Yes16 No, too late
Do the following data arrive when you need it? - Employee Satisfaction
Yes No, too late
22
212019
18
171615
14
131211
10
987
6
543
2
10
55.6 %
44.4 %
26

18 No, too late16 Yes
Do the following data arrive when you need it? - Patient Satisfaction
No, too late Yes
19
18
17
16
15
14
13
12
11
10
9
8
7
6
5
4
3
2
1
0
52.9 %
47.1 %
18 Yes16 No, too late
Do the following data arrive when you need it? - Clinical Data
Yes No, too late
19
18
17
16
15
14
13
12
11
10
9
8
7
6
5
4
3
2
1
0
52.9 %
47.1 %
27

YesNo
Do you feel the following data is presented clearly (clear charts, clear graphs, easy to read format, etc.)?
Employee Satisfaction Patient Satisfaction Clinical Data
28
26
24
22
20
18
16
14
12
10
8
6
4
2
0
63.9 %
76.5 %
64.7 %
36.1 %
23.5 %
35.3 %
23 Yes13 No
Do you feel the following data is presented clearly (clear charts, clear graphs, easy to read format, etc.)? - Employee Satisfaction
Yes No
252423222120191817161514131211109876543210
63.9 %
36.1 %
28

26 Yes8 No
Do you feel the following data is presented clearly (clear charts, clear graphs, easy to read format, etc.)? - Patient Satisfaction
Yes No
28
26
24
22
20
18
16
14
12
10
8
6
4
2
0
76.5 %
23.5 %
22 Yes12 No
Do you feel the following data is presented clearly (clear charts, clear graphs, easy to read format, etc.)? - Clinical Data
Yes No
2423222120191817161514131211109876543210
64.7 %
35.3 %
29

012345
What level of contribution do the following data make to your management decisions (zero being none, five being signifcant)?
Employee Satisfaction Patient Satisfaction Clinical Data
17
16
15
14
13
12
11
10
9
8
7
6
5
4
3
2
1
0
0.0 % 0.0 %
5.9 %
2.8 %
0.0 %
2.9 %
8.3 %
2.9 %
0.0 %
16.7 %
8.8 %
20.6 %
36.1 %
47.1 %
41.2 %
36.1 %
41.2 %
29.4 %
13 413 56 33 21 1
What level of contribution do the following data make to your management decisions (zero being none, five being signifcant)? - Employee Satisfaction
4 5 3 2 1
14
13
12
11
10
9
8
7
6
5
4
3
2
1
0
36.1 % 36.1 %
16.7 %
8.3 %
2.8 %
30

16 414 53 31 2
What level of contribution do the following data make to your management decisions (zero being none, five being signifcant)? - Patient Satisfaction
4 5 3 2
17
16
15
14
13
12
11
10
9
8
7
6
5
4
3
2
1
0
47.1 %
41.2 %
8.8 %
2.9 %
14 410 57 32 01 1
What level of contribution do the following data make to your management decisions (zero being none, five being signifcant)? - Clinical Data
4 5 3 0 1
15
14
13
12
11
10
9
8
7
6
5
4
3
2
1
0
41.2 %
29.4 %
20.6 %
5.9 %
2.9 %
31

34 Unit based employee satisfaction data33 Unit based patient satisfaction data28 Unit based incident report22 Unit based length of stay data22 Organization based patient satisfaction data21 Unit based monthly admission data21 Organizational based quality indicators21 Unit based clinical indicator data21 Organization based employee satisfaction data20 Unit based average time of discharge20 Unit based monthly discharge data19 Current unit based census data (for all inpatient units)17 Organizational based patient flow indicators16 Organizational based length of stay indicators16 Historical unit based census data (for all inpatient units)14 Unit based daily admission data11 Unit based daily discharge data4 Other
Which of the following data would you like to receive to aid in your managment decisions (check all that apply)?
based employee satisfaction data Unit based average time of discharge Other
36
34
32
30
28
26
24
22
20
18
16
14
12
10
8
6
4
2
0
91.9 % 89.2 %
75.7 %
59.5 % 59.5 % 56.8 %
56.8 % 56.8 % 56.8 %
54.1 % 54.1 % 51.4 %
45.9 % 43.2 % 43.2 %
37.8 %
29.7 %
10.8 %
27 0 thru 95 10 thru 191 20 thru 290 30 thru 390 40 thru 490 50 thru 591 60 thru 69
How many total hours per month do you spend gathering, organzing, and analyzing data related to employee satisfaction and patient satisfaction?
Mean = 7.41Min = 2.00, Max = 60.00Median = 4.50
0 thru 9 10 thru 19 20 thru 29 30 thru 39 40 thru 49 50 thru 59 60 thru 69
30
28
26
24
22
20
18
16
14
12
10
8
6
4
2
0
79.4 %
14.7 %
2.9 %0.0 % 0.0 % 0.0 %
2.9 %
32

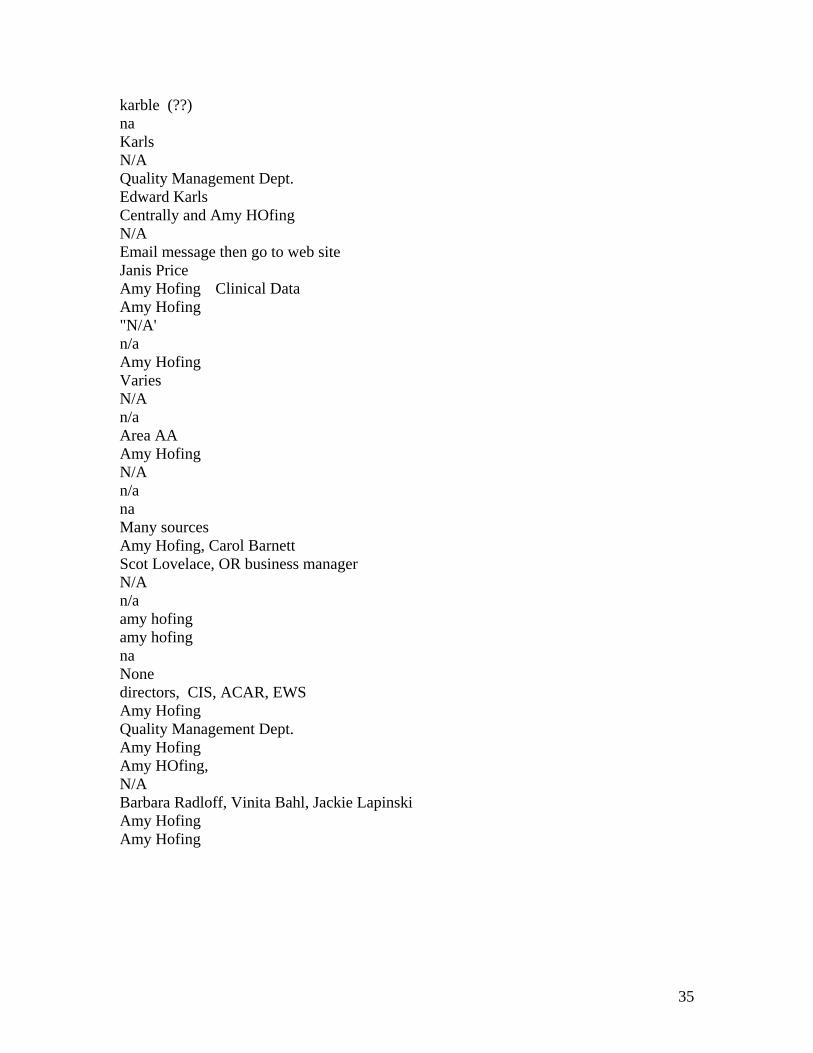
From whom do you receive the following reports? Employee Satisfaction Patient Satisfaction Clinical Data na na Amy Hofing n/a n/a Paul Salow same "N/A' n/a n/a n/a N/A N/A Amy Hofing CQI CQI Varies n/a N/A N/A N/A n/a Maureen McCarthy Unit Host n/a centrally centrally (but not unit specific-ICU Area AA N/A Edward Karls Amy Hofing NURSING N/A N/A Virginia Walter, Internal Medicine Virginia Walter, Internal Medicine n/a na na na N/A Melinda Adler Many sources person who replaced Deb Rich my AA; Press-Ganey from person who replaced Deb Rich Amy Hofing, Carol Barnett n/a n/a Scot Lovelace, OR business manager N/A N/A N/A n/a n/a n/a our own info amy hofing amy hofing karble (??) amy hofing na na na NA Karls None administrator N/A directors, CIS, ACAR, EWS Ed Karls Amy Hofing HR Dept. Quality Management Dept. Quality Management Dept. Amy Hofing Edward Karls Amy Hofing Centrally and Amy Hofing Centrally and Amy HOfing Amy HOfing, N/A N/A N/A Melina Adler Email message then go to web site Barbara Radloff, Vinita Bahl, Jackie Lapinski Amy Hofing Janis Price Amy Hofing Amy Hofing Amy Hofing Amy Hofing Employee Satisfaction na n/a Paul Salow n/a
33

N/A CQI n/a N/A n/a centrally N/A NURSING Virginia Walter, Internal Medicine na N/A person who replaced Deb Rich n/a N/A n/a amy hofing na NA administrator Ed Karls HR Dept. Amy Hofing Centrally and Amy Hofing N/A Melina Adler Amy Hofing Amy Hofing Patient Satisfaction na n/a same n/a N/A CQI N/A Maureen McCarthy Unit Host centrally (but not unit specific-ICU Edward Karls N/A Virginia Walter, Internal Medicine na Melinda Adler my AA; Press-Ganey from person who replaced Deb Rich n/a N/A n/a our own info
34
karble (??) na Karls N/A Quality Management Dept. Edward Karls Centrally and Amy HOfing N/A Email message then go to web site Janis Price Amy Hofing Clinical Data Amy Hofing "N/A' n/a Amy Hofing Varies N/A n/a Area AA Amy Hofing N/A n/a na Many sources Amy Hofing, Carol Barnett Scot Lovelace, OR business manager N/A n/a amy hofing amy hofing na None directors, CIS, ACAR, EWS Amy Hofing Quality Management Dept. Amy Hofing Amy HOfing, N/A Barbara Radloff, Vinita Bahl, Jackie Lapinski Amy Hofing Amy Hofing
35

14 50-75%10 25-50%8 75-100%2 0-25%
Of the information you receive regarding employee satisfaction, patient satisfaction, and clinical data, what percentage do you feel is relevant to your u
50-75% 25-50% 75-100% 0-25%
15
14
13
12
11
10
9
8
7
6
5
4
3
2
1
0
41.2 %
29.4 %
23.5 %
5.9 %
20 Yes, in addition to the data I currently receive10 Yes, in place of the data I currently receive4 No
With respect to all of the management data that you receive, would a monthly or quarterly newsletter summarizing signinficant indicators be useful to
Yes, in addition to the data I currently receive No
22
212019
18
171615
14
131211
10
987
6
543
2
10
58.8 %
29.4 %
11.8 %
36

31 Yes2 No
Are you willing to share data derived from your unit(s) with other units?
Yes No
34
32
30
28
26
24
22
20
18
16
14
12
10
8
6
4
2
0
93.9 %
6.1 %
Need paper surveys for clinical people.they can't sit at computers in the OR and do this- so they don't and all data given to me is from office and clerical staff- not relevant. Routinely share with staff and managers in my area and have discussions about the data and key drivers and how to improve or sustain consistant with organizational mission. The problem that I have is that the number of respondents for both employee and patient satisfaction is too low to be generalized for my area. I don't want to take action on unreliable data. The MAC cluster has devleoped a dashboard for all clinical data/ patient satisfaction and employee satisfaction. This works extremely well. If we could receive them when they are being done, we would be able to address & followup with staff "real time". When it's 2-4 months after the fact, it's difficult to express the importance. Also,we need to track the RNs who are doing the admissions, because many times it's not our own unit staff. We manage our own data base with respect to our own pt satisfaction survey, since Press Ganey does not service our unit's needs. We would always appreciate central support for this data input and management. Data received is too old making a prompt response to change impossible. Data should be streamlined and presented all together.
37

I find the data is useful but addressed in a very punitve manner by directors, when issues brought forward to ask for help for improvement no real direction given. We need to redo the clinical indicators and manage this in a more proactive and positive supportive manner, not in such a negative culture. Staff want to do well and the flow of work is sometimes a barrier to getting documentation done. The whole documentation process needs to be reviewd. We all want to do a better job with this but we need help and a positive supportive and helpful environment to do it in...
38