analysis of net-zero energy homes and...
TRANSCRIPT

1
ANALYSIS OF NET-ZERO ENERGY HOMES AND NET-ZERO ENERGY COMMUNITIES IN HOT AND HUMID CLIMATES FROM THE BUILDERS PERSPECTIVE
By
ROBERT LAMB
A THESIS PRESENTED TO THE GRADUATE SCHOOL OF THE UNIVERSITY OF FLORIDA IN PARTIAL FULFILLMENT
OF THE REQUIREMENTS FOR THE DEGREE OF MASTER OF SCIENCE IN BUILDING CONSTRUCTION
UNIVERSITY OF FLORIDA
2009

2
© 2009 Robert Lamb

3
To my parents: Robert Lamb, Justine Bodmer, and Peter Bodmer
Without their support none of this would have been possible
4
ACKNOWLEDGMENTS
I would like to thank all those who assisted in the completion of this thesis, directly and
indirectly. First, I would like to thank my thesis committee, which consists of Drs. Robert Ries,
Charles Kibert, and Svetlana Olbina. Without their guidance, knowledge, and overall expertise I
would not have been able to complete this work. Additionally, I would like to thank all those
whom I contacted regarding this work for their patience and guidance.
Furthermore, I would like to thank my girlfriend Valerie Robertson for putting up with
me through the years and instilling confidence in myself. I would also like to thank Matt Hill for
convincing me to switch to Building Construction, Joe Hart for exposing me to the notion of
Sustainable Construction, and Ayesh Bhagvat for teaching me the value of rhetoric. I would also
like to thank my grandmother Mary Barbara Marra for guidance given throughout the years.
Finally, I would like to thank all my family and friends whom I haven’t mentioned for their
support and indirect contributions to this work.

5
TABLE OF CONTENTS
page
ACKNOWLEDGMENTS ...............................................................................................................4
LIST OF TABLES ...........................................................................................................................8
LIST OF FIGURES .........................................................................................................................9
ABSTRACT ...................................................................................................................................10
CHAPTER
1 INTRODUCTION ..................................................................................................................12
2 LITERATURE REVIEW .......................................................................................................15
Introduction .............................................................................................................................15 Defining the Net-Zero Energy Community ............................................................................15 DOE Energy Efficiency and Renewable Energy (EERE) Programs Addressing NZE ..........20 Heating, Ventilation, & Air Conditioning (HVAC) ...............................................................25
Liquid Desiccant Cooling System ...................................................................................27 Solar Assisted Desiccant Cooling System .......................................................................28
Domestic Water Heating .........................................................................................................30 Passive Solar Thermal System ........................................................................................32 Active Solar Thermal System ..........................................................................................34
Lighting ...................................................................................................................................35 Envelope .................................................................................................................................37
Attic System Goals ..........................................................................................................38 Wall System Goals ..........................................................................................................39 Foundation System Goals ................................................................................................39 New Materials Goals .......................................................................................................40
Windows .................................................................................................................................40 Dynamic Windows ..........................................................................................................42 Highly Insulated Windows ..............................................................................................43 Enabling Technology Research for Efficient Products ...................................................44 Daylighting and Advanced Façade Systems ...................................................................44
Photovoltaics (PV) ..................................................................................................................45 Building Integrated Photovoltaics ...................................................................................45 Building Applied Photovoltaics ......................................................................................46 Photovoltaic Constraints ..................................................................................................47 Photovoltaic Cost .............................................................................................................48 Improved Disaster Resistance .........................................................................................49
Progress toward Creating NZEC: Past and Present Projects ..................................................50 Premier Gardens ..............................................................................................................50 Other Builder/Developer Attempts ..................................................................................51 Gainesville, Florida: NZEC Prospect ..............................................................................51

6
The Business Case for the Development of NZECs ...............................................................52
3 METHODOLOGY .................................................................................................................61
Step 1: Literature Review .......................................................................................................61 Step 2: Determine Gainesville’s Baseline Cost/SF ................................................................61 Step 3: Identify the Builder/Developers Advantages & Goals ...............................................63
Builder/Developer Advantages .......................................................................................63 Builder/Developer Goals .................................................................................................64
Step 4: Energy-10 Development .............................................................................................65 Load Profiles ...................................................................................................................65 Lighting ...........................................................................................................................66 Unit Conversion ...............................................................................................................66 Operating Conditions .......................................................................................................67
Step 5: Develop the Gainesville Baseline Home in Energy-10 ..............................................67 Step 6: Develop the BA Best Practices Home in Energy-10 ..................................................68 Step 7: Develop the NZEH in Energy-10 ...............................................................................69 Step 8: Determine Averages Annual Energy Consumption ...................................................70 Step 9: Quantify the Incremental Costs ..................................................................................71 Step 10: Determine Feasibility ...............................................................................................72
4 DATA ANALYSIS AND RESULTS ....................................................................................73
Gainesville Baseline versus BA Best Practices ......................................................................73 Gainesville Baseline versus NZEH ........................................................................................75 Photovoltaic Sizing .................................................................................................................76 BA Best Practices and NZEH Incremental Costs ...................................................................76 BA Best Practices ...................................................................................................................77 NZEH ......................................................................................................................................77 Gainesville Baseline, BA Best Practices, NZEH Comparison ...............................................78
Builder/Developer Costs .................................................................................................78 Homebuyer Costs ............................................................................................................80
5 SUMMARY, CONCLUSIONS, LIMITATIONS, AND RECOMMENDATIONS ..............83
Summary .................................................................................................................................83 Conclusions.............................................................................................................................84 Financial Feasibility Analysis .................................................................................................85
First Cost Analysis ..........................................................................................................85 Final Cost Analysis ..........................................................................................................86
Net-Zero Energy Ready Communities ...................................................................................87 Limitations ..............................................................................................................................88
Holistic Feasibility Analysis ............................................................................................88 Quantifying Material and Time Reductions when Developing NZECs ..........................89 Energy-10 Limitations .....................................................................................................89
Recommendations for Future Research ..................................................................................90

7
APPENDICES
A GAINESVILLE BASELINE VS BA BEST PRACTICES ENERGY-10 DATA .................91
Energy-10 Input/Output ..........................................................................................................91 0 Degrees .........................................................................................................................91 90 Degrees .......................................................................................................................92 180 Degrees .....................................................................................................................93 270 Degrees .....................................................................................................................94
Example Comparative Bar Chart ............................................................................................95
B GAINESVILLE BASELINE VS NZEH ENERGY-10 DATA .............................................96
Energy-10 Input/Output ..........................................................................................................96 0 Degrees .........................................................................................................................96 90 Degrees .......................................................................................................................97 180 Degrees .....................................................................................................................98 270 Degrees .....................................................................................................................99
Example Comparative Bar Chat ...........................................................................................100
C PV WATTS DATA ..............................................................................................................101
D BA BEST PRACTICES INCREMENTAL COST ...............................................................102
E NZEH INCREMENTAL COST ...........................................................................................103
LIST OF REFERENCES .............................................................................................................104
BIOGRAPHICAL SKETCH .......................................................................................................108
8
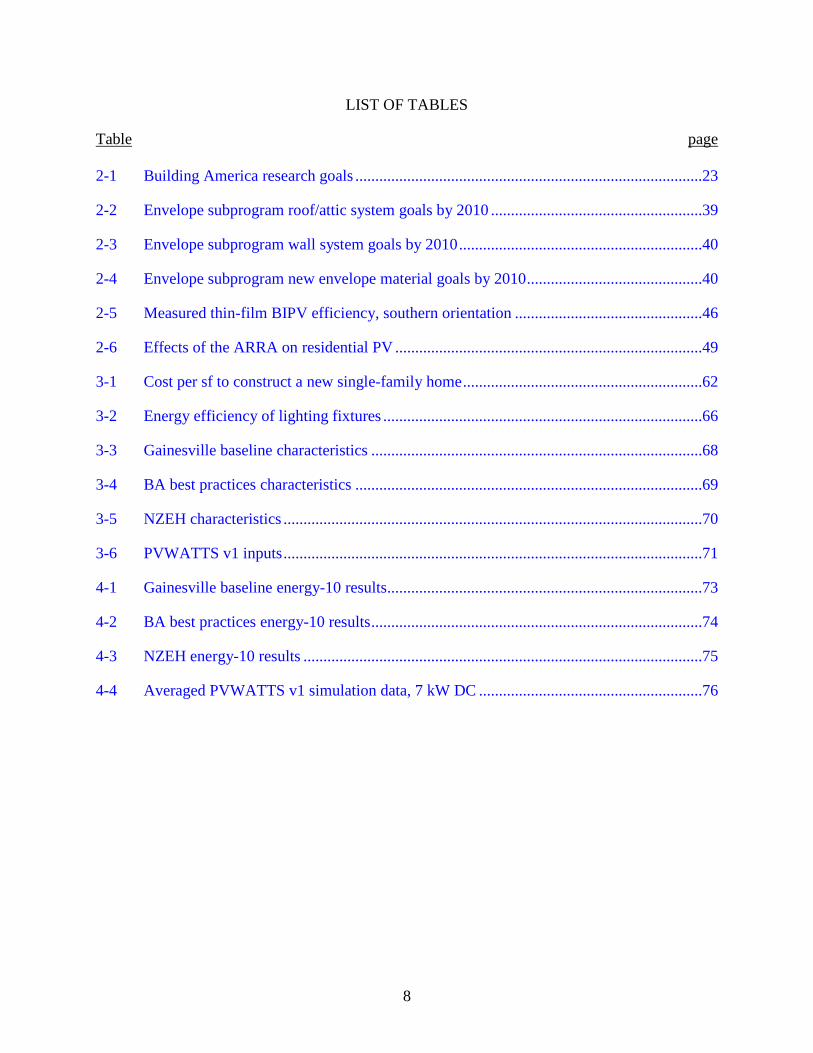
LIST OF TABLES
Table page 2-1 Building America research goals .......................................................................................23
2-2 Envelope subprogram roof/attic system goals by 2010 .....................................................39
2-3 Envelope subprogram wall system goals by 2010 .............................................................40
2-4 Envelope subprogram new envelope material goals by 2010 ............................................40
2-5 Measured thin-film BIPV efficiency, southern orientation ...............................................46
2-6 Effects of the ARRA on residential PV .............................................................................49
3-1 Cost per sf to construct a new single-family home ............................................................62
3-2 Energy efficiency of lighting fixtures ................................................................................66
3-3 Gainesville baseline characteristics ...................................................................................68
3-4 BA best practices characteristics .......................................................................................69
3-5 NZEH characteristics .........................................................................................................70
3-6 PVWATTS v1 inputs .........................................................................................................71
4-1 Gainesville baseline energy-10 results ...............................................................................73
4-2 BA best practices energy-10 results ...................................................................................74
4-3 NZEH energy-10 results ....................................................................................................75
4-4 Averaged PVWATTS v1 simulation data, 7 kW DC ........................................................76

9
LIST OF FIGURES
Figure page 2-1 DOE EERE program hierarchy ..........................................................................................22
2-2 DOE BA timeline ...............................................................................................................24
2-3 DOE BA climate zones (subarctic, Alaska not shown) .....................................................25
2-4 Typical hybrid liquid desiccant cooling system (DCS) .....................................................28
2-5 Solar desiccant cooling system (SDCS) ............................................................................30
2-6 Typical thermosiphon domestic hot water system .............................................................34
2-7 A) Typical ASDS install, B) Typical drainback system ................................................35
2-8 BT windows subprogram performance goals ....................................................................42
4-1 Gainesville baseline v. BA best practices averaged annual energy use .............................74
4-2 Gainesville baseline v. NZEH averaged annual energy use ..............................................75
4-3 Builder/developer incremental costs ..................................................................................79
4-4 Builder/developer cost per sf to construct .........................................................................79
4-5 Homebuyer incremental first cost ......................................................................................80
4-6 Homebuyer first/final cost/sf to construct..........................................................................81
4-7 Homebuyer rebates and incentives ....................................................................................82
4-8 Homebuyer first and final complete costs .........................................................................82
10
Abstract of Thesis Presented to the Graduate School
of the University of Florida in Partial Fulfillment of the Requirements for the Degree of Master of Science in Building Construction
ANALYSIS OF NET-ZERO ENERGY HOMES AND NET-ZERO ENERGY COMMUNITIES
IN HOT AND HUMID CLIMATES FROM THE BUILDERS PERSPECTIVE
By
Robert Lamb
August 2009
Chair: Robert Ries Cochair: Charles Kibert Major: Building Construction This thesis studied the feasibility of net-zero energy homes (NZEH) and net-zero energy
communities in hot and humid climates. This work focused on the problem statement from the
perspective of the builder/developer. Feasibility was analyzed based on the cost per square foot
to construct a single-family home in Gainesville, Florida to varying standards of energy
efficiency. Energy-10 energy modeling software was used to evaluate energy reductions from
the modeled Gainesville Baseline, to the Building America (BA) Best Practices, and proposed
NZEH. The energy efficient home schemes targeted reductions, as compared to the Gainesville
Baseline, of 30 % and 70 % respectively. The NZEH supplements the remaining 30 % of energy
consumed via an onsite photovoltaic array (PV). The PV array was sized and modeled using
PVWATTS v1 software.
Once the energy efficient schemes achieved their targeted energy reductions, the
incremental costs of the added efficiency measures were determined. These costs were then
organized by total incremental cost, annual amortized cost, and increase in cost per square foot to
construct. These costs were separated into those to the builder/developer and those to the
11
homebuyer. The homebuyer costs included a 10 % markup from the builder/developer.
Furthermore, the costs were separated into costs before rebates and incentives and costs after
rebates and incentives. The final costs were compared against the calculated Gainesville average
cost per square foot to construct a new single-family home in a typical community. The
calculated Gainesville average cost per square foot to the homeowner before rebates and
incentives was determined to be $146 while the BA Best Practices (30 % energy reduction) was
$146.46, and the NZEH was $199.80. Without accounting for the rebates and incentives,
NZEHs and NZECs were determined to not be feasible at this time. The cost per square foot to
construct including rebates and incentives were $140.67 for the Gainesville Baseline, $140.80
for the BA Best Practices, and $167.04 for the NZEH. Including the rebates and incentives
NZEHs and NZECs were determined to be feasible at this time.

12
CHAPTER 1 INTRODUCTION
A glutton in the truest sense of the word, the built environment consumes 30% of all
primary energy in the United States. The associated burden (extracting, processing, transporting)
of gathering the energy necessary to satiate this high demand belongs to the built environment as
well. Furthermore, the sprawling unchecked growth of the built environment has led to
increased dependency on automobiles. The built environment consumes 40% of all materials
annually extracted in the United States, and contains nearly 90% of all materials historically
extracted (Kibert 2002). Waste generated through the construction and demolition (C/D) of the
built environment contributes over 145 million metric tons (MMT) annually in the United States,
nearly one-third of all municipal solid waste. Of this C/D waste about 92% can be linked
directly to demolition activities (Kibert 2002). Two other contributors to the energy profile of
the built environment are the Ecological Rucksack and Embodied Energy inherent to all
construction materials. On the low end of the spectrum, iron ore extraction has an Ecological
Rucksack of 14:1. That ratio translates to disruption/displacement of 14 metric tons of waste
material to produce 1 metric ton of iron (Kibert 2002). Taking these two principles into
consideration, the amount of energy necessary to build a building is overwhelming. Society has
only recently begun to pay attention to these metrics as ecosystems fail, materials dwindle, and
energy prices rise. Consequently, the Sustainable Construction movement (read “Green”) was
developed in an attempt to reduce the impact of the built environment.
Reducing the impacts of the built environment is no simple task. One must approach the
problem holistically, tackling it from social, environmental, and economic perspectives. Perhaps
the single most impactful attribute of the built environment is its energy profile. As described
above, the amount of energy consumed, existing in, and traveling through the built environment
13
is astronomical. Additionally, the prevailing source materials for energy are non-renewable,
radioactive, and contribute to global warming. Furthermore, these centralized energy sources are
distributed through long, archaic transmission lines further reducing the efficiency of the cycle.
Sadly, at this time it is cost prohibitive to produce all the energy we need from sustainable
sources. The demand is simply too high. Current building practices must be altered to make a
sustainable energy platform viable in the future. The prevailing practice of designing a building
to draw 100 kWh per square foot per year in the United States is unacceptable. Thankfully, there
has been a large shift in the Construction Industry to design to higher standards, most of which
are inherent to meeting USGBC’s Leadership in Energy and Environmental Design (LEED)
criteria. We must continue to challenge the Industry to reach for standards like LEED, Factor 4,
and Factor 10. Without a significant reduction in the current energy consumption of buildings a
future of sustainably obtained renewable energy seems unlikely. It is imperative to research and
develop construction materials and methods which will aide in the reduction of the built
environments energy profile, therefore making the feasibility of these energy systems more
viable.
Combined, the commercial and residential sector of the built environment consumed $370
billion worth of energy in 2005. Moreover, the residential sector was the largest user, consuming
21.8 quads (1 Quad equals 293,071,000,000 kWh’s) in 2005 (DOE 2008). Reducing the energy
profile of the residential sector will offer the most significant, and tangible benefits to society.
While a reduction of energy consumption of any magnitude is a definite improvement, it is
important for society to continually demand more from the built environment. If the demand for
higher performing buildings is demonstrated, then industry professionals will deliver. The
ultimate goal, in terms of energy consumption, is a net-zero condition. In a net-zero energy

14
circumstance the building produces, onsite, as much energy as it uses over the course of a year.
The purpose of this thesis is to demonstrate whether or not obtaining a net-zero energy case in
residential communities (NZEC) of hot and humid climates is feasible. The building block of the
NZEC is the net-zero energy home (NZEH). For that reason, this work has examined the
incremental cost to construct a NZEH. Additionally, this work has considered feasibility from
the perspective of the builder/developer, and determines feasibility based on cost per square foot
to construct a new single-family home.
A comprehensive literature review has been conducted. First, the review outlines the
development of energy efficient homes in the United States. Then it discusses the Department of
Energy’s (DOE) Building Technology (BT) and Building America (BA) programs. These
government funded programs are paving the way to NZEHs and NZE Buildings by 2020 and
2025, respectively. Next, the review identifies the ideal areas for energy enhancement in
residences and provides readily available material alternatives/systems vital to achieving NZE.
Finally, the review states the business case for the development of NZEHs and NZECs. To
evaluate feasibility of NZECs three homes were developed; Gainesville Baseline, BA Best
Practices, and NZEH. These homes were then modeled in Energy-10 software to determine their
annual energy consumed and respective reduction in comparison to the baseline. In the NZEH,
the remaining energy consumed was supplemented via an onsite photovoltaic (PV) system whose
size was calculated using PVWATTS v1 simulation software. Cost to construct per square foot
was then calculated based on all energy efficiency features incremental costs. Ultimately,
feasibility was determined by comparing the as designed cost per square foot to construct to the
prevailing market cost per square foot to construct a new single-family home in typified
communities. The results were analyzed, discussed, and recommendations were made.
15
CHAPTER 2 LITERATURE REVIEW
Introduction
This literature review examines the techniques and technology necessary to achieve net-
zero energy communities (NZEC) in hot and humid climates. The review presents the evolution
of high-efficiency homes in the United States (U.S.) and consequently defines the concept of the
NZEC. Secondly, the review discusses the means and methods of achieving NZEC, focusing on
the U.S. Department of Energy (DOE) Building Technologies (BT) and Building America (BA)
programs. Next, the review analyzed the latest attempts at creating energy efficient
communities. Finally, the review evaluated the environmental and business case for
sustainability in the built environment; ultimately providing the basis for corporate adoption of
the NZEC concept.
Defining the Net-Zero Energy Community
The first section of the literature review outlined a brief overview of the history of energy
efficient home design in the U.S., and the evolution toward NZEC. It documented the major
trends and their contributions to the evolving science of residential design; all the while
emphasizing significant projects and case-studies.
The concept of a NZEC is relatively new, however interest in the reduction of energy
consumption in the building sector originated just before World War II (Parker 2009). The first
studies aimed at reducing building energy consumption were carried out at the Massachusetts
Institute of Technology (MIT) and focused on the use of solar energy to heat a structure.
Through these studies the MIT Solar House IV, built in 1959, was able to provide 57% of space
and domestic water heating from the solar energy collected by 60 m2 of active solar collectors
(Engebretson 1964).

16
The next wave of development in the energy efficiency of homes in the United States was
driven by the energy crisis of the 1970’s. This era focused on passive solar heating features as a
result of the high costs associated with active solar heating identified by the MIT Solar Houses.
Passive systems implemented during this time period used, “insulated south-oriented glazing
systems with direct gain, indirect gain (e.g. Trombe walls) and attached sunspace features”
(Parker 2009, p. 513). The most important, and widely used, passive design strategy was thermal
mass. Thermal mass operates by absorbing solar heat gain during the daytime and releasing the
stored heat slowly throughout the night, providing space heating. The thermal mass was
essential in providing interior comfort and reducing the demand for active thermal control
systems (Balcomb 1984). The passive design strategies culminated in an average savings of
70% in additional space heating (SERI 1984). During this era the realization that an overall
reduction in building energy demand, via more efficient building systems, coupled with solar
heating efforts would yield the highest performing structure at the lowest overall cost (Balcomb
1986).
The next evolutionary movement of energy efficient home design appeared with the
implementation of superinsulated homes. In cold and cloudy climates researchers made the
correlation between higher levels of insulation and lower overall energy demand (Palmiter
1981). Parker (2009, p.513) summarizes the characteristics of super-insulated homes:
“… high insulation levels for ceiling, walls and floor (typically RSI-18.8, 5.4 and 3.6 K m2/W or greater), very tight air construction and sun-tempering, with most of glass located on the south side of the building. Ventilation was provided by an air to air heat exchanger and target auxiliary design heat loads were a fraction of the size of ordinary furnaces.”
A number of superinsulated homes were built and proved to be successful at relatively low
incremental cost. The Saskatchewan House, built in Regina, Saskatchewan in 1977, had no
furnace and was able to thrive in the harsh environment. It quickly became the poster child for
17
superinsulated homes, and did so for an incremental cost of approximately $6000 in 1982
(Parker 2009). This low incremental cost is consequence of the advanced passive design features
and elimination of the entire furnace system. Another noteworthy experiment involved the
construction of three 223 m2 superinsulated homes in Great Falls, Montana. In a climate with
4222 metric heating degree days the homes averaged 20 kWh/m2/year (Palmiter and Hanford
1985). Interest in superinsulated homes subsided as the cost of energy dropped during the 1980s.
The superinsulated home movement was a great step forward in terms of residential
energy efficiency. The focus within the passive solar and superinsulated home movements was
to reduce the amount of energy used to heat a home. These approaches neglected reductions in
cooling, water heating, and plug load energy profiles (Parker 2009). Without addressing these
major consumers of energy, the overall efficiency of homes continued to suffer greatly. Enter
the net-zero energy home (NZEH) movement which aimed to combat the entire spectrum of
residential inefficiencies.
Once more, a NZEH is a residence which greatly reduces the energy consumption of the
building through improved building techniques and materials and creates enough onsite energy
to result in net-zero energy use annually. The NZEH concept is driven by a low cost of
photovoltaic (PV) panels which are the primary means to generate onsite energy from the sun. It
is important to note that PV is not the only option for onsite energy production; however it is the
option which is most widely available regardless of climate. The closer the cost per unit of
energy gathered using PV to that of the electrical provider, the more feasible the PV panels
become. During the 1980’s the cost of onsite PV energy production declined, making the energy
source more viable (Parker 2009). In the early 90’s the cost per peak kW of PV was slightly
above $6,000 (EIA 2003); currently the cost per peak kW hovers around $8,000. Consequently,

18
in the 90’s the Florida Solar Energy Center (FSEC) developed the Minimum Electricity Building
(MEB) a home designed to aggressively reduce the amount of energy necessary to operate
annually, through an improved envelope and onsite PV, in a hot and humid climate. Due to the
success of the MEB experiment the FSEC speculated that a net-zero energy condition could be
achieved through the reduction in energy demand and supplemental renewable onsite energy
production (Parker and Dunlop 1994).
One generalized method to reduce energy demand, and achieve NZE, is whole building
design (WBD). When implemented, WBD can reduce the energy profile of a building by as
much as 70%. WBD is related to integrated project delivery, when all parties responsible in the
design, construction, and operation of a building collaborate throughout the building process. In
essence, WBD ensures that every component or system of a building is complementary to one
another (Fischer and Finnell 2007). For example, the lighting consultant would spec compact-
fluorescent bulbs in lieu of traditional incandescent bulbs to reduce internal heat gains which
might negate the high efficiency HVAC system the mechanical engineer has selected.
Renewable onsite energy production can be achieved through a variety of methods. As
mentioned, the type of energy producing system implemented is dictated directly by the site and
its available natural resources. Examples of readily available renewable onsite energy systems
include PV, solar thermal, geothermal, and wind (Fischer and Finnell 2007). Once the project
team has determined which system is ideal for their project, the system is installed and tied into
the grid. Most utility providers bill via the net metering concept, where you pay for the amount
of power you take from the grid. When a NZEH is creating more energy than it is using the
power is fed into the grid and, via the net metering concept, the excess energy is subtracted from
the gross energy needs. Fischer and Finnell (2007, p. 8) explain, “If a home generates more
19
power in one month than it uses, the bill is zero or the extra kilowatt-hours are carried over to
summer or winter months.”
Following the principles of WBD outlined above, in 1998 the FSEC designed a
controlled experiment to test the feasibility of NZEHs. The FSEC built two homes in Lakeland,
Florida with identical floor plans, constructed by the same builder. The first home was designed
and built conventionally to the prevailing code while the other, dubbed PVRES, was
collaboratively designed and built exceeding the local code with the objective of obtaining NZE
(Parker 2009). Some of the energy efficient features of PVRES were, “interior HVAC ductwork,
a high efficiency heat pump, higher levels of wall insulation, a white reflective roofing system,
solar water heating, efficient interior appliances and lighting, and a 4 kW DC PV system”
(Parker 2009, p. 513). To provide quantitative information the homes were precisely monitored
for a period of one year. During that time period the PVRES home consumed 6960 kWh of grid
derived electricity while producing 5180 kWh of onsite renewable energy from its PV array. In
contrast, the control home, through the same period of time, consumed 22600 kWh’s (Parker
2009). While the PVRES home was unable to achieve a true NZE condition, the home
demonstrated a 92% reduction in energy demand as compared to the control home (Parker 2009).
The value of the study performed by the FSEC was immense. They proved that the
concept of NZEH is technologically feasible. The project became the poster child for the DOE’s
Zero Energy Homes program. The program’s overall goal is to achieve NZE via superinsulation,
intelligent design, active and passive solar features, and high efficiency appliances/lighting
(Parker 2009). Arguably the most successful attempt at a NZEH to date, the Habitat for
Humanity’s home in Wheat Ridge, Colorado was able to achieve 1.1kWh/m2 over the course of a

20
year in 2005, while remaining affordable (Parker 2009). Parker (2009, p. 515) highlights the
small homes energy saving features;
“superinsulated with RSI-10.8 ceiling insulation, RSI-7.2 double stud walls and RSI-5.4 floor insulation (Fig. 6). Ventilation is provided by a small heat recovery ventilator. Very high performance low-e solar glass with argon fill and a U-factor (SI) of 1.14W/m2 K was used for the east, west and north faces with a higher solar transmission U-factor 1.70 glass used for the south exposure. The home used a 9m2 solar collector with 757 L of storage, backed up by a tankless gas water heater. The home was mated with a 4 kW roof-top PV system.”
Data was collected for a year and during that time the PV system produced 1542 kWh more than
was needed to operate the home. However, the home consumed 57 therms (about 1700 kWh) of
natural gas resulting in the 1.1 kWh/m2/year figure. Additionally, the home’s incremental cost
was $42,500 which includes the cost of all onsite energy systems. However, the total
incremental cost minus the onsite energy systems was only about $3,400 (Parker 2009).
As demonstrated, the NZEH is the building block for the NZEC. To achieve a NZEC
you simply develop homes which achieve NZE and multiply per the desired density. The
difficulty is identifying and satisfying the developer’s goals for building communities at greater
initial cost. Thankfully, the available research has proven that NZEH’s are technologically
feasible. The quintessential example above, the Habitat for Humanity case study, has proven
that a very near-zero energy home is technologically feasible at a small incremental cost. Due to
the success of such research efforts, the DOE has invested immensely in the concept of reducing
the energy profile of the residential sector. Their solution, the Building Technologies (BT) and
Building America (BA) programs’, strive to provide a prescriptive means and methods to create
a NZEH.
DOE Energy Efficiency and Renewable Energy (EERE) Programs Addressing NZE
This second section of the literature review has focused on the available means and
methods to creating NZEH, the building blocks of NZEC. It will concentrate on the DOE’s

21
Building Technologies (BT) and Building America (BA) programs’ as an emerging prescriptive
guideline to achieve NZEHs. Additionally, this section will identify, and explain in detail,
specific systems and technologies vital in achieving NZEC.
BT is the umbrella organization to BA and is responsible for defining the problems and
creating the solutions necessary to achieve NZE in the residential sector by 2020 (DOE 2008).
BA focuses on information and technology which can be implemented in the now, whereas BT
plans ahead and strives to identify new methods and evaluate innovative technologies to achieve
the tiered energy reduction goals on time. The BT program is broader in scope than BA, and
addresses energy reduction in the Commercial and Residential building sectors (DOE 2008).
Combined, the two sectors energy demand in 2005 was valued at $370 billion. Reducing said
demand can drastically reduce America’s vulnerability to energy supply disruptions and
fluctuations in the price of energy (DOE 2008). The BT program’s mission statement is to
achieve NZE for the residential sector by 2020, and 2025 for the commercial sector. This review
will focus on the BT’s agenda for achieving NZE in the residential sector by 2020. BT tackles
this challenge via three main areas of activity: Research and Development, Equipment Standards
and Analysis, and Technology Validation and Market Introduction (DOE 2008).
Research and Development (R&D) under BT is conducted via, “a balanced portfolio of
high-risk and applied research to accelerate the introduction of energy-efficient building
technologies and practices” (DOE 2008, p. 2-1). The program evaluates potential gains in
efficiency via two trains of thought: R&D of systems integration, and individual building
components. Systems integration focuses on the interaction between building systems to
improve efficiency while R&D of individual components evaluates the building blocks within
the systems (DOE 2008). To create precisely targeted subprograms and develop relevant

22
strategies to achieve energy efficiency, BT implements whole building design which accounts
for the complex relationship between building and its environment, and the Stage-Gate
methodology which sets goals for a project, aka gates, which will be evaluated against pre-
determined data to conclude if the project will be approved for the next phase, rejected, or
recycled (DOE 2008). The Residential Integration (RI) subprogram is responsible for R&D
applied to the residential sector; and BA is the primary program within RI (Figure 2-1).
Figure 2-1. DOE EERE program hierarchy
The DOE’s Building America program (BA) is a government funded, industry driven
research program focused on reducing the overall environmental impact of the U.S. Residential
Sector. The program places a strong emphasis on tiered reductions in residential buildings
energy consumption over time. The mission statement of BA is, “reengineering new and
existing American homes for energy efficiency, energy security, and affordability” (DOE 2009a)
The program is founded on the systems engineering approach which is very similar to the WBD
approach described earlier in this review. In essence, the BA teams make design decisions based
on the interactions between all main building systems; the building envelope, mechanical
systems, landscaping, neighboring houses, orientation, climate, lighting systems, and so on
(DOE 2009a). The research goals of BA are comprehensive and can be viewed in Table 2-1.
Goals one and two are most relevant to this literature reviews scope.
23
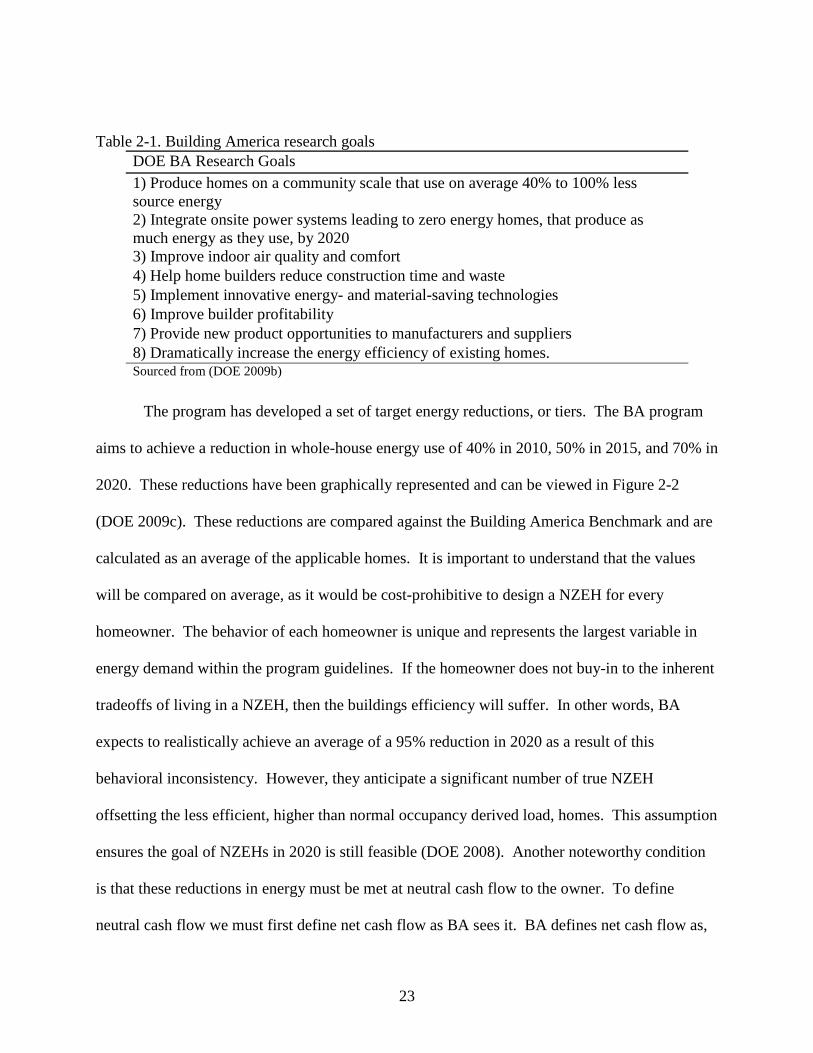
Table 2-1. Building America research goals
DOE BA Research Goals 1) Produce homes on a community scale that use on average 40% to 100% less source energy 2) Integrate onsite power systems leading to zero energy homes, that produce as much energy as they use, by 2020 3) Improve indoor air quality and comfort 4) Help home builders reduce construction time and waste 5) Implement innovative energy- and material-saving technologies 6) Improve builder profitability 7) Provide new product opportunities to manufacturers and suppliers 8) Dramatically increase the energy efficiency of existing homes. Sourced from (DOE 2009b)
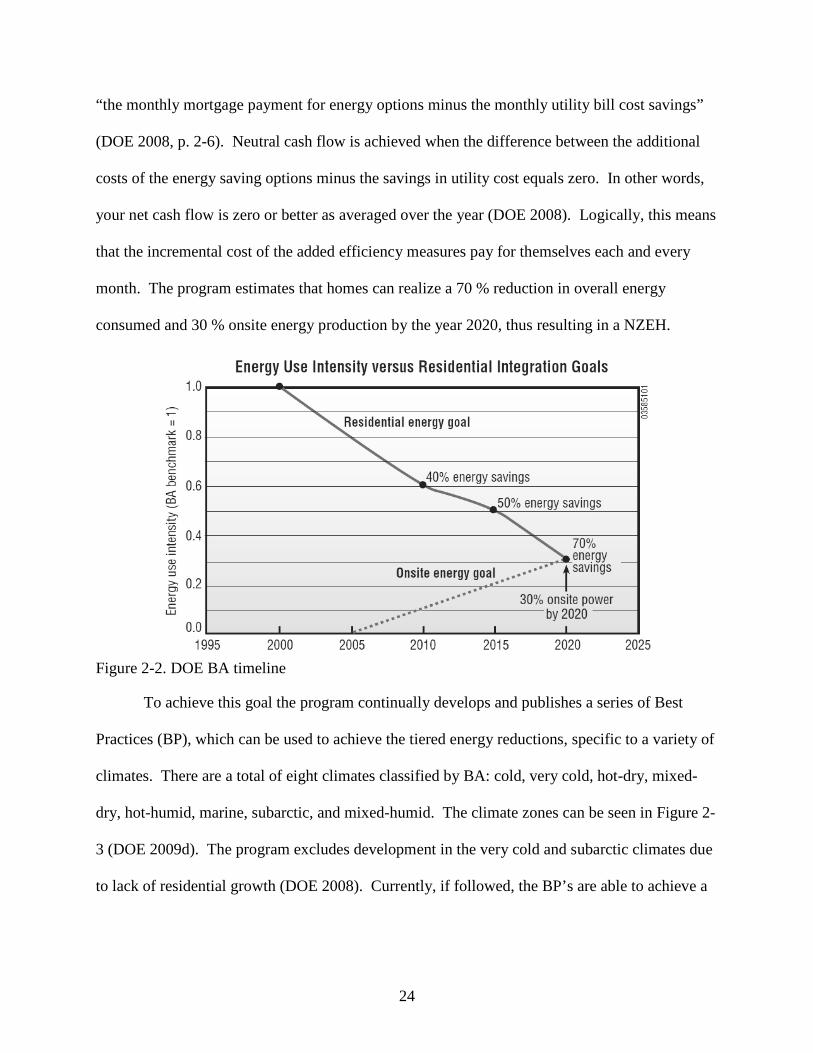
The program has developed a set of target energy reductions, or tiers. The BA program
aims to achieve a reduction in whole-house energy use of 40% in 2010, 50% in 2015, and 70% in
2020. These reductions have been graphically represented and can be viewed in Figure 2-2
(DOE 2009c). These reductions are compared against the Building America Benchmark and are
calculated as an average of the applicable homes. It is important to understand that the values
will be compared on average, as it would be cost-prohibitive to design a NZEH for every
homeowner. The behavior of each homeowner is unique and represents the largest variable in
energy demand within the program guidelines. If the homeowner does not buy-in to the inherent
tradeoffs of living in a NZEH, then the buildings efficiency will suffer. In other words, BA
expects to realistically achieve an average of a 95% reduction in 2020 as a result of this
behavioral inconsistency. However, they anticipate a significant number of true NZEH
offsetting the less efficient, higher than normal occupancy derived load, homes. This assumption
ensures the goal of NZEHs in 2020 is still feasible (DOE 2008). Another noteworthy condition
is that these reductions in energy must be met at neutral cash flow to the owner. To define
neutral cash flow we must first define net cash flow as BA sees it. BA defines net cash flow as,
24
“the monthly mortgage payment for energy options minus the monthly utility bill cost savings”
(DOE 2008, p. 2-6). Neutral cash flow is achieved when the difference between the additional
costs of the energy saving options minus the savings in utility cost equals zero. In other words,
your net cash flow is zero or better as averaged over the year (DOE 2008). Logically, this means
that the incremental cost of the added efficiency measures pay for themselves each and every
month. The program estimates that homes can realize a 70 % reduction in overall energy
consumed and 30 % onsite energy production by the year 2020, thus resulting in a NZEH.
Figure 2-2. DOE BA timeline
To achieve this goal the program continually develops and publishes a series of Best
Practices (BP), which can be used to achieve the tiered energy reductions, specific to a variety of
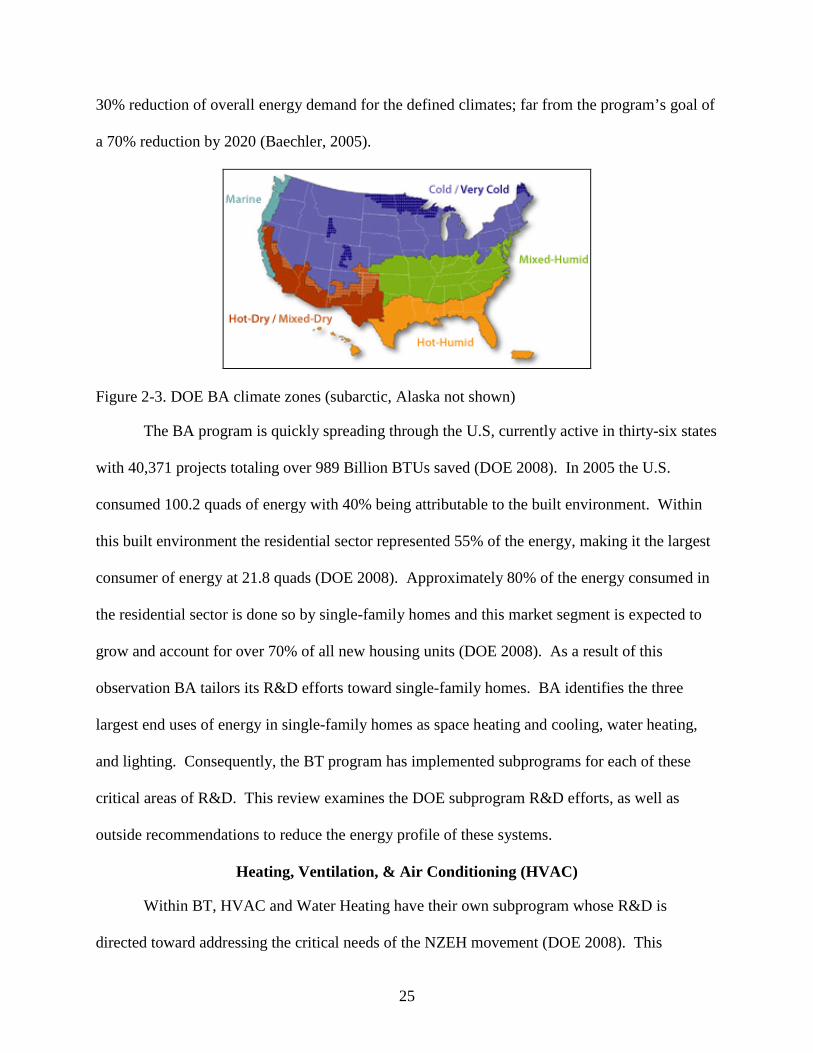
climates. There are a total of eight climates classified by BA: cold, very cold, hot-dry, mixed-
dry, hot-humid, marine, subarctic, and mixed-humid. The climate zones can be seen in Figure 2-
3 (DOE 2009d). The program excludes development in the very cold and subarctic climates due
to lack of residential growth (DOE 2008). Currently, if followed, the BP’s are able to achieve a
25
30% reduction of overall energy demand for the defined climates; far from the program’s goal of
a 70% reduction by 2020 (Baechler, 2005).
Figure 2-3. DOE BA climate zones (subarctic, Alaska not shown)
The BA program is quickly spreading through the U.S, currently active in thirty-six states
with 40,371 projects totaling over 989 Billion BTUs saved (DOE 2008). In 2005 the U.S.
consumed 100.2 quads of energy with 40% being attributable to the built environment. Within
this built environment the residential sector represented 55% of the energy, making it the largest
consumer of energy at 21.8 quads (DOE 2008). Approximately 80% of the energy consumed in
the residential sector is done so by single-family homes and this market segment is expected to
grow and account for over 70% of all new housing units (DOE 2008). As a result of this
observation BA tailors its R&D efforts toward single-family homes. BA identifies the three
largest end uses of energy in single-family homes as space heating and cooling, water heating,
and lighting. Consequently, the BT program has implemented subprograms for each of these
critical areas of R&D. This review examines the DOE subprogram R&D efforts, as well as
outside recommendations to reduce the energy profile of these systems.
Heating, Ventilation, & Air Conditioning (HVAC)
Within BT, HVAC and Water Heating have their own subprogram whose R&D is
directed toward addressing the critical needs of the NZEH movement (DOE 2008). This

26
literature review has separated the two major consumers of energy to provide a clear analysis and
allow for exploration of technologies beyond the scope of the BT program.
HVAC loads are the number one consumer of energy in the residential and commercial
sectors. A dramatic increase in the efficiency of these appliances is essential to the success of
the BT program objectives. It would be cost-prohibitive to design a home to operate at NZE
using conventional HVAC equipment, the cost/size of the on-site energy system needed to offset
the demand created by the unit would be too great (DOE 2008). When combined, the
commercial and residential sectors operation of HVAC equipment accounts for approximately
38.6 % of the total amount of energy used in buildings; totaling 15.34 quads (DOE 2008).
Within the residential sector space heating consumes the most energy, 30.7 %, whereas space
cooling accounts for 12.3 % (DOE 2008). In order to achieve the NZEH goal defined by BA
HVAC systems need to become 50 % more efficient, as compared to the BA 2004 Benchmark,
by 2010 (DOE 2008). Developments in HVAC efficiency have been unimpressive and driven by
increasing minimum efficiency standards, the last occurring in January of 2006 specifying a
minimum 13 SEER rating (DOE 2008). The HVAC subprogram identifies several market
challenges and barriers limiting penetration and development of high efficiency HVAC units.
The most apparent limitation is the higher first cost of high efficiency systems. In addition to
greater cost, premium HVAC units are touted as: providing improved air filtration, reduced
noise, and better fit and finish. These features represent what the market is currently demanding,
and often have little benefit to overall system efficiency (DOE 2008). These touted benefits
create a pseudo premium unit, once which offers no gain in efficiency but is sold at a higher
price. Efficiency gains in HVAC equipment are particularly difficult to comprehend and
quantify in a NZE condition as the load which will be imposed on the system is much lower than

27
what is conventional. HVAC equipment efficiency tends to lessen as system capacity is reduced.
This is due to losses related to, “clearance volume flow in compressors and high-to-low pressure
section leakage in reversing valves” (DOE 2008, p. 2-40). In addition to this problem,
controlling humidity in a NZEH will prove to be difficult with conventional HVAC equipment,
due to the tight envelope (DOE 2008). The tighter the envelope, the fewer air changed per hour
which allows moisture to accumulate and cause indoor air quality problems.
The subprogram recognizes that radically new ideas and systems are necessary to solve
the HVAC conundrum. Preliminary investigations into innovative techniques and systems are:
“reduction of distributional losses and recovery of waste heat, stand-alone direct expansion dehumidification systems with energy recovery ventilation, low leakage thermal loss duct systems, low capacity space conditioning system that may be integrated with night cooling or other evaporative cooling options, combined desiccant/evaporative cooling unit to supply any mix of sensible and latent loads in any climate” (DOE 2008, p. 2-41).
The RI program has identified 24 SEER systems with substantial dehumidification capabilities as
the target if NZE is to be realized by 2020 (DOE 2008). A potential technology to aide in
dehumidification, increase HVAC efficiency, and improve thermal comfort is desiccant cooling.
Liquid Desiccant Cooling System
In any climate your perception of thermal comfort is dictated by two factors, the
temperature and humidity. However, if two rooms in a hot and humid climate were conditioned
to the same temperature, but room B had a lower relative humidity; occupants would feel more
comfortable in room B (Toolbase 2009). This observation is the driving force behind desiccant
cooling technologies. The load imposed on an HVAC system is a combination of sensible load
and latent load. In hot and humid climates HVAC cooling loads are dominated by the latent
load. The latent load is the load due to condensation and removal of moisture from the air. By
combining a traditional vapor compression system and a desiccant dehumidification system
reductions in overall electrical consumption for cooling are possible (Mago et al. 2006). Hybrid
28
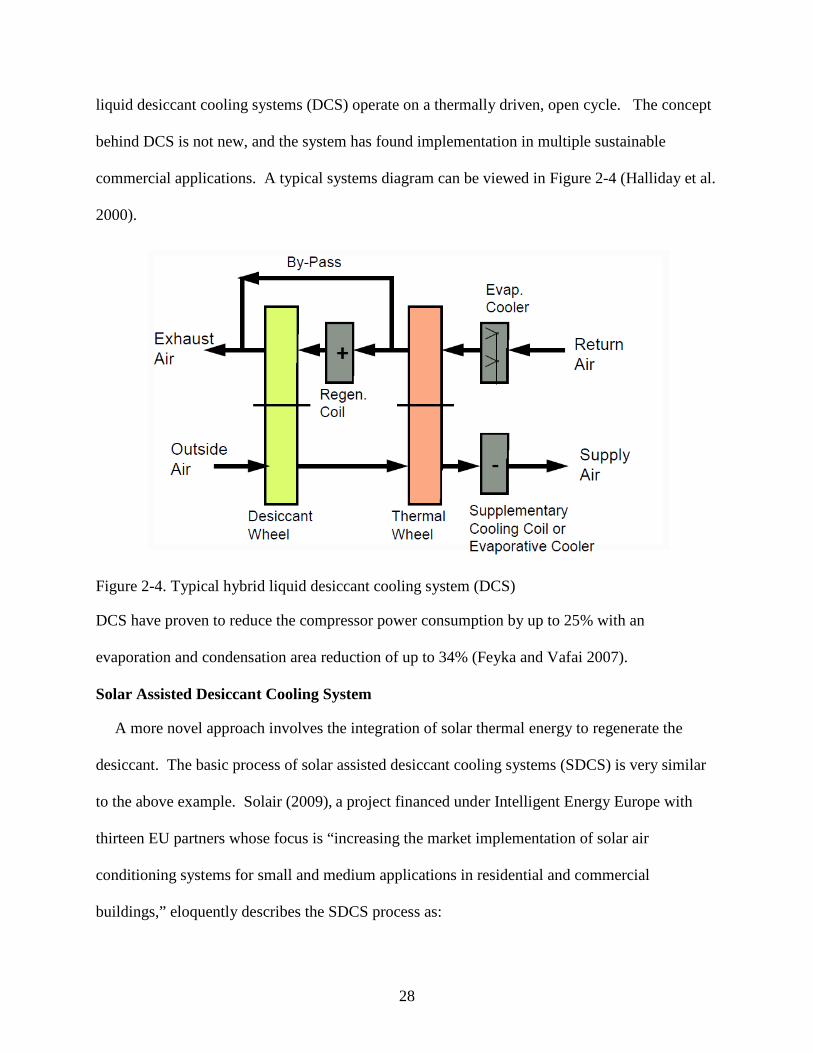
liquid desiccant cooling systems (DCS) operate on a thermally driven, open cycle. The concept
behind DCS is not new, and the system has found implementation in multiple sustainable
commercial applications. A typical systems diagram can be viewed in Figure 2-4 (Halliday et al.
2000).
Figure 2-4. Typical hybrid liquid desiccant cooling system (DCS)
DCS have proven to reduce the compressor power consumption by up to 25% with an
evaporation and condensation area reduction of up to 34% (Feyka and Vafai 2007).
Solar Assisted Desiccant Cooling System
A more novel approach involves the integration of solar thermal energy to regenerate the
desiccant. The basic process of solar assisted desiccant cooling systems (SDCS) is very similar
to the above example. Solair (2009), a project financed under Intelligent Energy Europe with
thirteen EU partners whose focus is “increasing the market implementation of solar air
conditioning systems for small and medium applications in residential and commercial
buildings,” eloquently describes the SDCS process as:
29
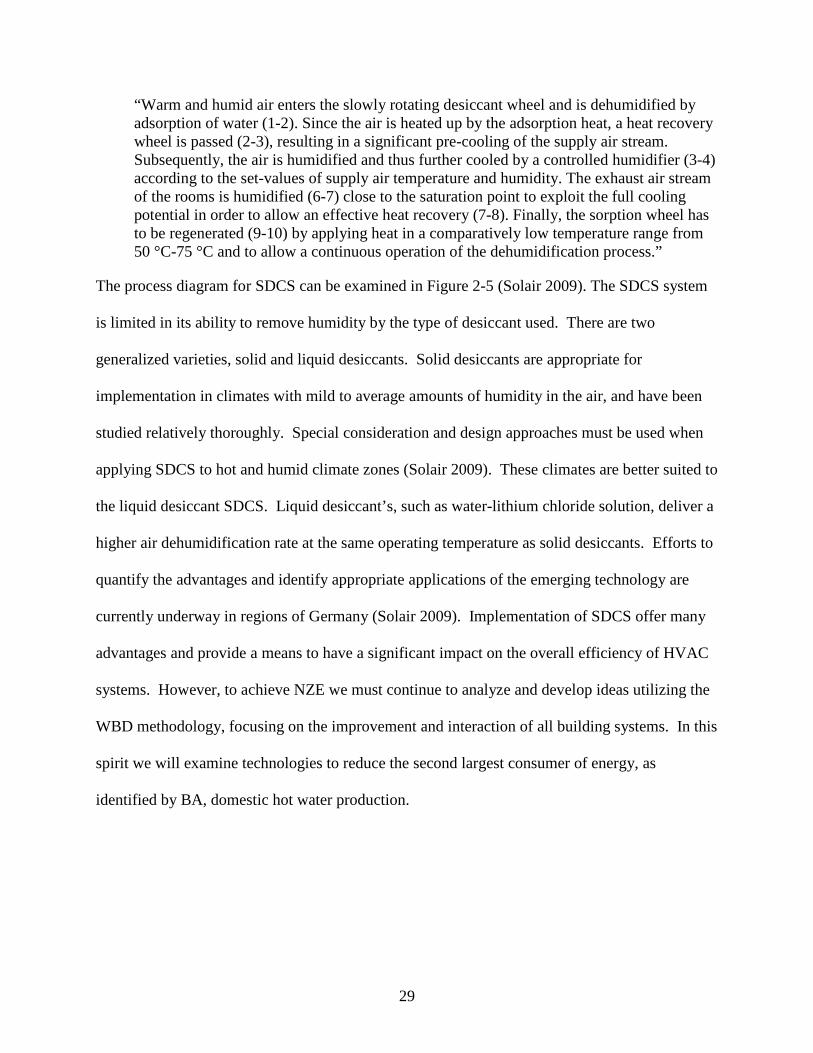
“Warm and humid air enters the slowly rotating desiccant wheel and is dehumidified by adsorption of water (1-2). Since the air is heated up by the adsorption heat, a heat recovery wheel is passed (2-3), resulting in a significant pre-cooling of the supply air stream. Subsequently, the air is humidified and thus further cooled by a controlled humidifier (3-4) according to the set-values of supply air temperature and humidity. The exhaust air stream of the rooms is humidified (6-7) close to the saturation point to exploit the full cooling potential in order to allow an effective heat recovery (7-8). Finally, the sorption wheel has to be regenerated (9-10) by applying heat in a comparatively low temperature range from 50 °C-75 °C and to allow a continuous operation of the dehumidification process.”
The process diagram for SDCS can be examined in Figure 2-5 (Solair 2009). The SDCS system
is limited in its ability to remove humidity by the type of desiccant used. There are two
generalized varieties, solid and liquid desiccants. Solid desiccants are appropriate for
implementation in climates with mild to average amounts of humidity in the air, and have been
studied relatively thoroughly. Special consideration and design approaches must be used when
applying SDCS to hot and humid climate zones (Solair 2009). These climates are better suited to
the liquid desiccant SDCS. Liquid desiccant’s, such as water-lithium chloride solution, deliver a
higher air dehumidification rate at the same operating temperature as solid desiccants. Efforts to
quantify the advantages and identify appropriate applications of the emerging technology are
currently underway in regions of Germany (Solair 2009). Implementation of SDCS offer many
advantages and provide a means to have a significant impact on the overall efficiency of HVAC
systems. However, to achieve NZE we must continue to analyze and develop ideas utilizing the
WBD methodology, focusing on the improvement and interaction of all building systems. In this
spirit we will examine technologies to reduce the second largest consumer of energy, as
identified by BA, domestic hot water production.

30
Figure 2-5. Solar desiccant cooling system (SDCS)
Domestic Water Heating
Domestic Hot Water (DHW) production accounts for 12.2 % of energy consumption in
residences, categorizing it as the second highest system consumer of energy in homes (DOE
2008). Dramatic improvements to the efficiency of DHW systems are necessary to achieve the
BA program goal of NZE by 2020. The DHW subprogram of BT states that DHW systems need
to attain reductions in energy consumption between 50 and 80 %, relative to the BA Benchmark,
to achieve NZE by 2020 (DOE 2008). Market barriers relative to the adoption of high
efficiency DHW systems are even more daunting than HVAC systems. The impediment in
marketing better DHW systems is the lack of tangible premium features. It is difficult for the
manufacturer to substantiate the additional cost without proving any added comfort, aesthetics,
image, or enhanced functionality that can be coupled with the added energy efficiency (DOE
2008). Compounding the situation, DHW systems are most often purchased in an emergency
situation forcing the consumer to settle for what is readily available from suppliers.

31
Additionally, any new high efficiency DHW system must be able to provide significant energy
reductions at a very low incremental cost in order to gain any market penetration. One of the
most significant barriers to higher efficiency DHW systems is the relatively low cost to operate
conventional systems. A readily available higher efficiency DHW system is the electric heat
pump DHW system. Due to the premium price attached to the higher efficiency heat pump
systems, of the 4 to 5 million DHW systems sold annually in the U.S. only a few thousand are
electric heat pump systems, even though they offer nearly double the efficiency of a traditional
unit (DOE 2008.) The DHW subprogram recognizes that radically new ideas and systems are
necessary to solve the DHW conundrum. Preliminary investigations into innovative techniques
and systems are: “integration of tankless hot water systems; … integration of simple, durable,
low cost solar hot water systems; … and acceptance of heat pump water heaters” (DOE 2008, p.
2-41). For hot and humid climates the availability of solar thermal energy is abundant
positioning solar thermal DHW systems as a promising renewable candidate for DHW
production.
There are two high level variants of solar thermal DHW systems (STS), direct and
indirect systems. In a direct system the potable water is heated directly in the solar collector and
distributed to the end user. Direct systems cannot be used in areas with hard or acidic water as
Scale deposits would clog the system. An indirect system is closed loop and passes a heat
transfer fluid through the collector and to a heat exchanger (NCSC 2002). A typical indirect STS
is generally composed of flat plate solar collectors, an external heat exchanger, a temperature
controller, and a storage tank with backup (Biaou and Bernier 2008). The backup energy source
varies, typically with whatever is readily available, between electric, natural gas, diesel, wood,

32
and so on. STS can be further categorized as either thermosiphon (passive) or pumped (active)
systems.
Passive Solar Thermal System
Thermosiphon STS (TSTS) operate on the principal of natural circulation and represents
the simpler of the two technologies (Kalogirou 2009). This type of system has gained wide
acceptance abroad and is able to supply hot water at 140° F from solar radiation. A TSTS
typically operates on an open loop cycle, heating and delivering potable water directly to the end
user. In areas where freezing is a concern a freeze resistant heat transfer liquid can be used in
lieu of potable water, however system efficiency often suffers. TSTSs heat potable water (or
heat transfer fluid), via a solar collector, and utilize natural convection to move the fluid from the
collector to storage (Kalogirou 2009). Kalogirou (2009, p. 41) explains thermosiphoning occurs
when, “the water (or heat transfer fluid) in the collector expands becoming less dense as heat is
added by solar energy and rises through the collector header into the top of the storage tank.
There it is replaced by the cooler water that has sunk to the bottom of the tank from which it
flows down to the collector.” This process will continue as long as the sun is shining and is
driven by relatively small density differences, consequently larger than typical piping is
necessary to reduce pipe friction (Kalogirou 2009). Systems are often designed to supply two
days worth of hot water to account for fluctuations in solar insolation available. The fixed solar
collectors are installed at an angle equal to the latitude of the location plus 5° (Kalogirou 2009).
This has been determined to be the optimum tilt angle for yearlong performance. To account for
extended periods of low solar insolation, such as winter, the systems are outfitted with a backup
conventional heating element (Kalogirou 2009). The primary benefit of TSTS is that they can
operate passively, utilizing zero electricity. The applicability of this technology in hot and

33
humid climates in the U.S. to aide in achieving NZE is apparent; however TSTS marketability is
limited by many factors.
The largest barrier to the acceptance of these types of systems in the U.S. is their size.
TSTS are relatively tall systems which are aesthetically less attractive than conventional and
active solar systems (Kalogirou 2009). To maximize efficiency of the system, and prevent
reversal of the thermosiphon process at night, it is imperative to place the storage tank well
above the solar collector (Kalogirou 2009). Consequently, the systems are quite noticeable when
installed on the roof of a residence. Internationally where these systems are popular (the
Mediterranean) the built environment is denser than in the U.S. As a result, these bulky systems
can more easily be installed out of sight, reducing their visual impact. However, single-family
homes in hot and humid climates are predominantly 1-2 stories with a pitched roof. The
installation of a traditional TSTS would be very apparent and unattractive to homeowners.
Certain TSTS systems can integrate the storage tanks into available attic space, however this
creates its own set of problems to solve; such as the increased load from the large amount of
water, additional piping, maintenance inaccessibility, and so on. The energy efficiency of TSTS
is on the high end of the BT DHW subprogram goal of reducing DHW loads by 50 to 80 %. A
conventional TSTS, as shown in Figure 2-6, has been proven to provide a reduction of 79 % in
annual DHW energy used with a payback time of 2.7 years (Kalogirou 2009).

34
Figure 2-6. Typical thermosiphon domestic hot water system
Active Solar Thermal System
Active solar DHW systems (ASDS) rely on the addition of an electric pump to move the
fluid through the system (MREA 2009). As these types of systems are not relying on the natural
process of thermosiphoning to move the fluid through the system, implementation is much less
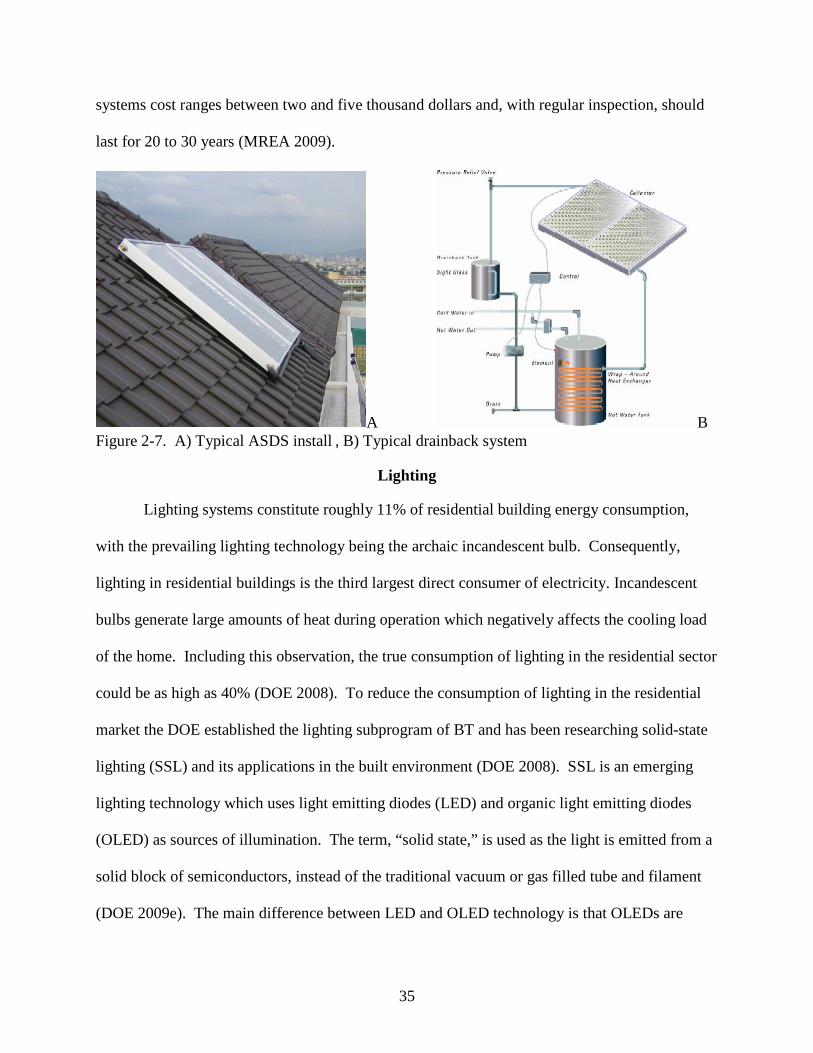
aesthetically intrusive as seen in Figure 2-7A (Allproducts 2009). Drainback systems represent a
common approach when implementing indirect ASDS. Even in hot and humid climates freezing
temperatures occur multiple times throughout the year. The Drainback system shown in Figure
2-7 B is designed to empty its collectors of water to avoid freezing damage when a freeze is
eminent (NCSC 2002). To counteract the use of grid provided electricity some variants of ASDS
integrate a PV powered pump with its own dedicated collector panels. The pump will consume
PV electricity generated onsite when it is available and default to grid sourced power when
onsite electrical demand is greater than onsite production (MREA 2009). Pumps used are able to
operate directly on DC current, the power output of PV panels, which eliminates the AC to DC
derate factor, boosting their efficiency. ASDS are able to reduce the amount of energy needed
for DHW production by 40 to 70 %, making them a viable alternative for the BA program. The
35
systems cost ranges between two and five thousand dollars and, with regular inspection, should
last for 20 to 30 years (MREA 2009).
A B Figure 2-7. A) Typical ASDS install , B) Typical drainback system
Lighting
Lighting systems constitute roughly 11% of residential building energy consumption,
with the prevailing lighting technology being the archaic incandescent bulb. Consequently,
lighting in residential buildings is the third largest direct consumer of electricity. Incandescent
bulbs generate large amounts of heat during operation which negatively affects the cooling load
of the home. Including this observation, the true consumption of lighting in the residential sector
could be as high as 40% (DOE 2008). To reduce the consumption of lighting in the residential
market the DOE established the lighting subprogram of BT and has been researching solid-state
lighting (SSL) and its applications in the built environment (DOE 2008). SSL is an emerging
lighting technology which uses light emitting diodes (LED) and organic light emitting diodes
(OLED) as sources of illumination. The term, “solid state,” is used as the light is emitted from a
solid block of semiconductors, instead of the traditional vacuum or gas filled tube and filament
(DOE 2009e). The main difference between LED and OLED technology is that OLEDs are
36
based on organic, carbon based materials and provide a diffuse area light source, as opposed to
the direct point source of LEDs (DOE 2009e). The DOE evaluates performance of the
alternative lighting systems based on color rendering index (CRI), correlated color temperature
(CCT), and product lifetime (DOE 2008). In addition to these metrics, the program places great
emphasis on the energy efficiency rating of the device. The metric of said measurement is
lumens of light produced per watt of energy consumed (lm/W). The technical name for this
measurement is efficacy, and many of today’s lighting products are regulated using an efficacy
target (DOE 2008). A typical incandescent bulb operates with an efficacy of 14 lumens per watt
while readily available compact fluorescent bulbs operate around 60 lumens per watt. SSL
technologies have the potential to reach efficacy ratings of 186 lumens per watt by the year 2015
(DOE 2008). Currently, SSL technology has an average operating lifetime of 50,000 hours.
This represents lamp life double that of conventional linear fluorescent lighting, five times longer
than compact fluorescent, and fifty times longer than incandescent bulbs (DOE 2008). As a
result of the longevity of the SSL systems their life cycle cost (LCC) is greatly reduced as
compared to incandescent bulbs. In addition to the savings from a LCC perspective, the cost of
SSL is expected to decrease from $25/klm in 2006 to $2/klm in 2015 (DOE 2008). LEDs have
entered the marketplace and been met with great acceptance in the area of colored niche lighting.
Areas of common application include traffic signals, holiday lights, and commercial signage.
Attractive characteristics include: energy savings, longer operational life, lower operating costs,
improved durability, compact size, greater controllability, and faster on time (DOE 2008).
Market penetration is expected to increase and diversify as efficacy increases and costs decrease,
ultimately being implemented into the residential building sector.
37
Envelope
The building envelope is the combination of the roof system, attic, walls, and foundation.
The envelope separates the end user from the outdoors and its design and construction
significantly impact the energy efficiency of a home. Building a home via traditional residential
construction techniques, or to simply meet building code, represents the pervasive sentiment
toward the building envelope in the residential sector. Many a homeowner expects to have a
monthly utility bill, within a certain range, and has come to accept this as part of owning a home.
A conventional residential envelope consists of a roof and truss system with blown in, loose-fill
fiberglass insulation, wood framed walls with 3.5” fiberglass batt resulting in R-11/R-13
insulation levels and un-insulated foundation (DOE 2008). The BT R&D program realizes that
redesign of the baseline envelope can yield significant efficiency gains. To address the
advancement of residential envelope systems BT established the Envelope subprogram.
The envelope is where the direct interaction between indoor conditioned space and
outdoor air takes place. Ideally the envelope mitigates the transfer of thermal loss and gain while
maintaining indoor comfort, with the least amount of energy being expended. The Envelope
subprogram identifies heating and cooling loads in residential buildings as the number one
consumer of primary energy in homes; consuming forty-three % of all primary energy (DOE
2008). The magnitude of these heating and cooling loads is directly related to the insulating
value of the envelope. The Envelope subprogram has developed and aligned its milestones as
necessary to achieve NZE by 2020. The milestones promise to deliver new materials and
enabling technologies in a timely manner. One such objective addresses the roof/attic system in
single family homes, an area laden with energy loss. By 2015 the subprogram will develop
advanced attic systems which will reduce the thermal losses caused by poor attic insulation by
fifty %, as compared to the BA Benchmark, at no additional operating cost or increased envelope
38
failure risk (DOE 2008). Another goal of the subprogram is to develop advanced wall systems
which will achieve R-25 and higher levels of insulation, with 40 % solar reflectivity at little
incremental cost (DOE 2008). The Envelope subprogram also focuses heavily on maintaining
the durability and reducing vulnerabilities of envelope materials. By 2015 it will have developed
innovative materials which will improve the thermal performance of the envelope, “by 50 %
relative to functionally-comparable components of the Building America regional baseline new
construction; or resolve durability-related problems (moisture, termite, structural, etc.) that may
increase envelope failure risk” (DOE 2008, p. 2-46). In addition to these goals, the subprogram
will encourage private industry investment in created new and innovative products; such as air
barrier research and ASHRAE SP 160 Interior Moisture Conditions (DOE 2008). Finally, the
subprogram will advance the often overlooked foundation system by developing construction
guidelines for optimum foundation performance by 2015 (DOE 2008). The Envelope
subprogram’s goal is to implement many of the planned improvements at, “no additional
operating cost.” This is defined as the sum of the mortgage-amortized installed cost and the
annual energy cost savings (DOE 2008). The review will now examine the subprograms short
term goals for each of the main envelope systems.
Attic System Goals
The Envelope subprogram’s short term goal for roofing and attic systems is to achieve
twice the efficiency, as compared to the BA regional benchmarks, by 2010 (DOE 2008). The
resulting system would achieve, on average, R-45. The subprogram places great emphasis on
this building system because there is currently no documentation on how to achieve energy
efficient attic systems. The attic system is defined as the space between the roof and finished
ceiling and includes the roof structure (DOE 2008). To achieve this lofty goal by 2010 the
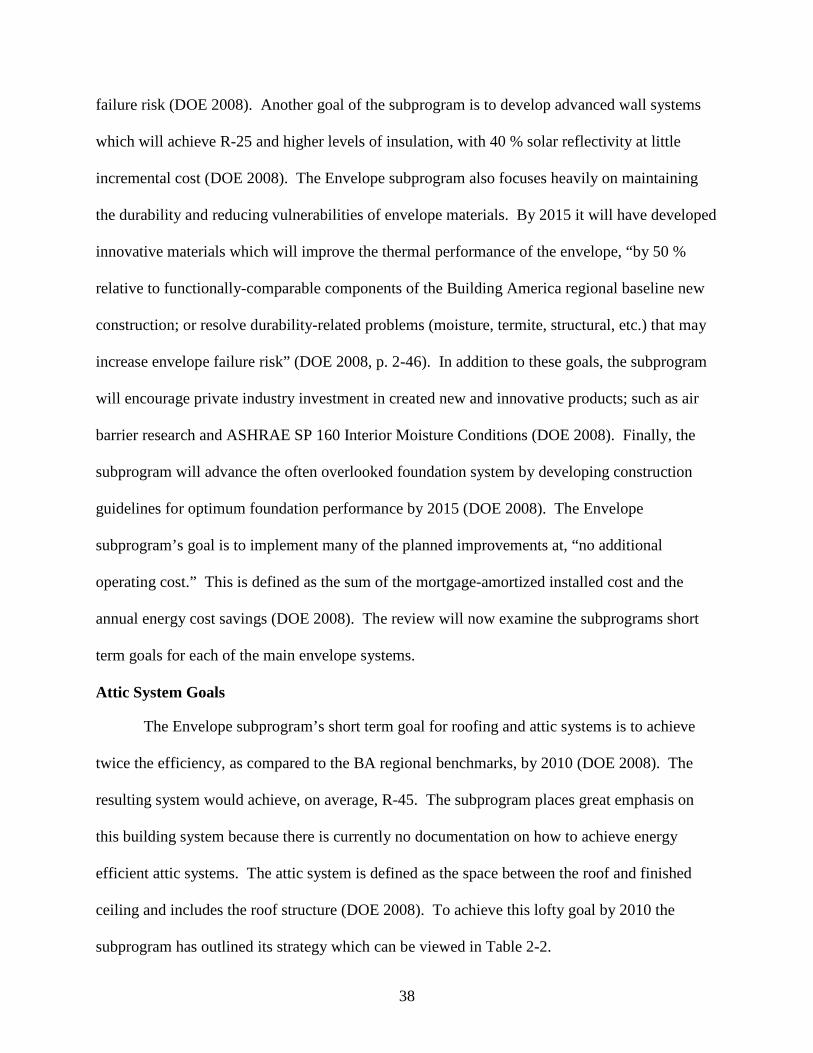
subprogram has outlined its strategy which can be viewed in Table 2-2.
39
Table 2-2. Envelope subprogram roof/attic system goals by 2010 Envelope Subprogram Strategies for Next Generation Attic Systems by 2010 Integration of PCM, Cool Colors, ASV, Radiant Barrier and Advanced Lightweight Insulations Regionally Optimization of Above-Sheathing Ventilation Best Practice for Integration of PCM in Roof and Attic Assembly Demonstration of Dynamically Active Roof and Attic Consolidation of Existing Energy Estimating Tools Sourced from (DOE, 2008)
Wall System Goals
Next, the achievement of advanced wall systems by 2010 is driven by the development of
wall assemblies which are more air tight and energy efficient. Again, the wall system represents
another area where major improvements are necessary to achieve the goals of BA. By 2010, the
subprogram will meet conventional insulation durability requirements while providing R-20
insulation levels (DOE 2008). Additionally, the wall assembly will achieve double the
efficiency of the prevailing BA regional benchmark. This value ranges from R-12 in warm
climates to R-26 in cold climates (DOE 2008). Traditionally, the residential market has resisted
adoption of thicker wall assemblies, hindering the potential for development and implementation
of energy efficient systems. Thus, the subprogram will have to improve the efficiency of the
wall assemblies without increasing the wall assembly thickness (DOE 2008). The strategies to
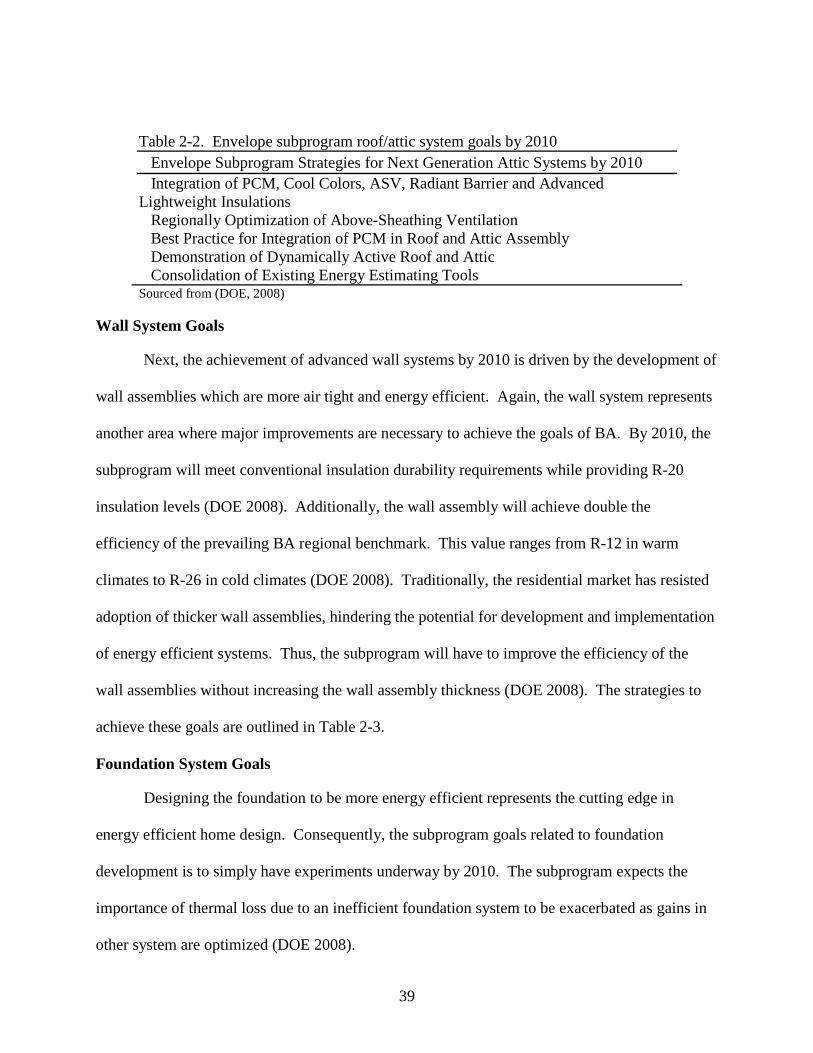
achieve these goals are outlined in Table 2-3.
Foundation System Goals
Designing the foundation to be more energy efficient represents the cutting edge in
energy efficient home design. Consequently, the subprogram goals related to foundation
development is to simply have experiments underway by 2010. The subprogram expects the
importance of thermal loss due to an inefficient foundation system to be exacerbated as gains in
other system are optimized (DOE 2008).
40
Table 2-3. Envelope subprogram wall system goals by 2010 Envelope Subprogram Strategies for Next Generation Wall Systems by 2010 Demonstrate the next generation of exterior insulation finish systems (EIFS) Develop a non-organically faced Structural Insulated Panel (SIP) Sourced from (DOE, 2008)
New Materials Goals
The importance of researching and developing new and innovative materials is obvious.
Without material advancements the goal of NZE will be impossible to achieve. Currently, the
Envelope subprogram goals for the R&D of new materials focus on field testing, durability
assessment, and prototyping for market implementation (DOE 2008). The development of new
envelope materials is subject to substantial barriers. The key barriers preventing implementation
of energy efficient envelopes are concerns with durability, lack of technical data, and insufficient
technical standards. Additionally concerns with moisture, the number one cause of envelope
failure, abound as these new technologies have not yet proven themselves (DOE 2008). The
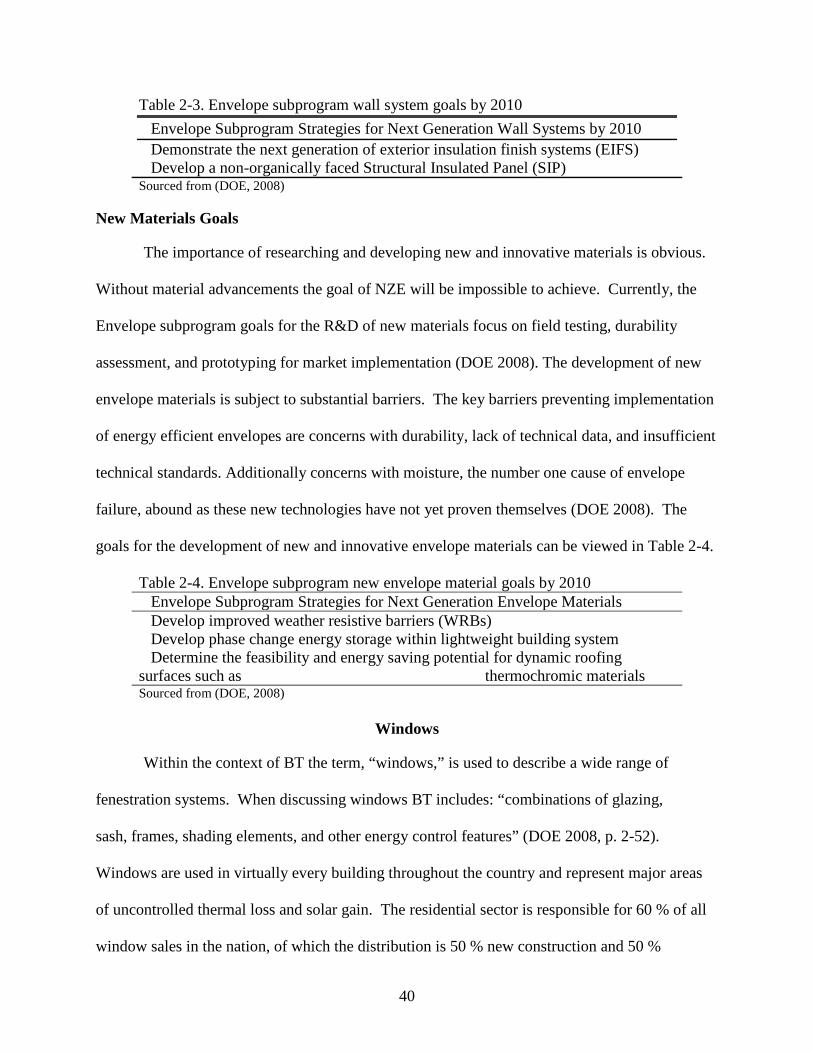
goals for the development of new and innovative envelope materials can be viewed in Table 2-4.
Table 2-4. Envelope subprogram new envelope material goals by 2010 Envelope Subprogram Strategies for Next Generation Envelope Materials Develop improved weather resistive barriers (WRBs) Develop phase change energy storage within lightweight building system Determine the feasibility and energy saving potential for dynamic roofing surfaces such as thermochromic materials Sourced from (DOE, 2008)
Windows
Within the context of BT the term, “windows,” is used to describe a wide range of
fenestration systems. When discussing windows BT includes: “combinations of glazing,
sash, frames, shading elements, and other energy control features” (DOE 2008, p. 2-52).
Windows are used in virtually every building throughout the country and represent major areas
of uncontrolled thermal loss and solar gain. The residential sector is responsible for 60 % of all
window sales in the nation, of which the distribution is 50 % new construction and 50 %

41
renovation (DOE 2008). Obviously, windows do not directly consume energy however they are
responsible for 30 % of overall building heating and cooling loads, or about 4.4 quads annually
(DOE 2008). Additionally, the potential to reduce lighting loads through daylighting is
significant; nearly 1 quad can be saved annually (DOE 2008). Windows have the unique ability
to operate as a net energy gainer (DOE 2008). Through proper design and selection, windows
can help heat a space in the winter, allow for cross ventilation, and provide daylighting. The
process of selecting the ideal window for an application is difficult due to the number of
variables which must be considered: such as which technology, size, application, orientation, and
climate. Thus, the development and proper application of more efficient and specialized
windows is essential to achieving NZE by 2020 (DOE 2008). BT approaches the problem in a
unique fashion. The program states the first step is to shift windows from being areas of thermal
loss, thus energy consumptive, to being energy neutral. Once this is achieved the windows
should then shift to create a net energy surplus, through passive heating, cooling, and so on
(DOE 2008). Essential to the development of net energy surplus window systems is altering the
role of windows from static systems to dynamic systems. Once a window system can alter its
performance in accordance with the hour, season, and weather condition the role of a net
provider of energy can be achieved (DOE 2008). In general, a window should reduce thermal
loss in the winter, control solar gain in the summer, and provide enough daylight throughout the
day (DOE 2008). Additionally, all these criteria should be met while providing a safe,
affordable, durable, aesthetically pleasing, and maintainable window. A major goal of the BT
R&D is to implement these, “smart, dynamic” window systems into the built environment (DOE
2008). The window performance goals outlined by the BT program can be viewed in Figure 2-8.
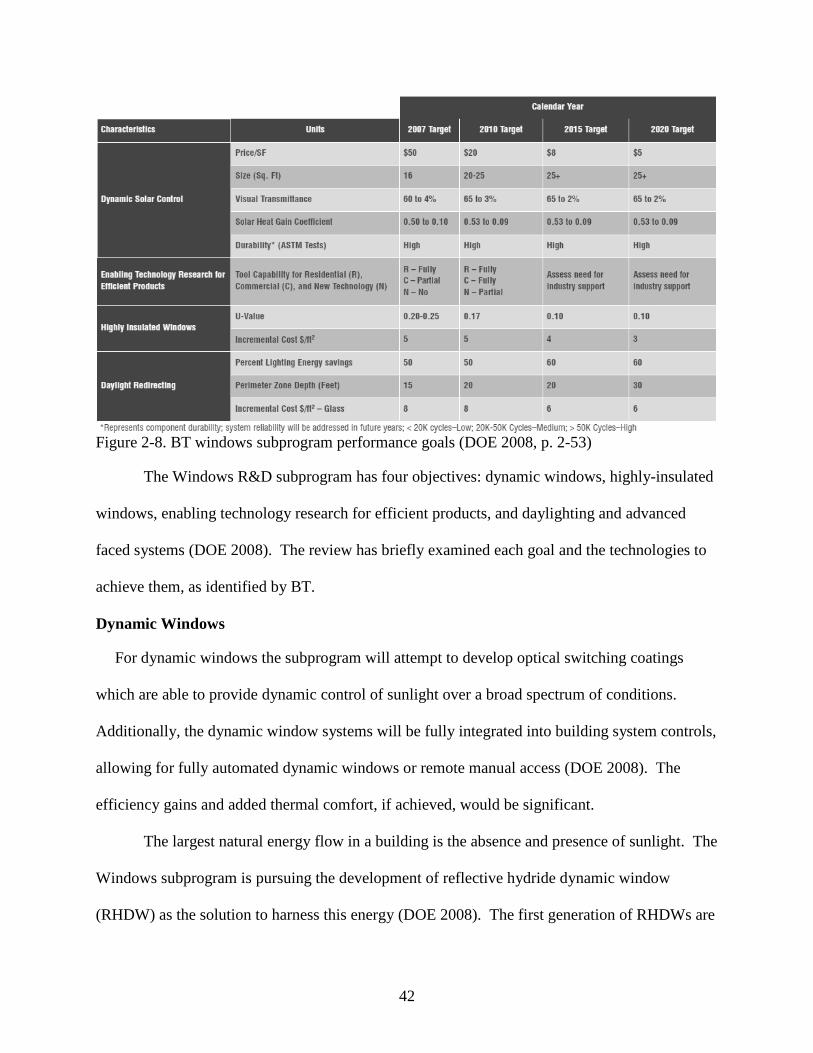
42
Figure 2-8. BT windows subprogram performance goals (DOE 2008, p. 2-53)
The Windows R&D subprogram has four objectives: dynamic windows, highly-insulated
windows, enabling technology research for efficient products, and daylighting and advanced
faced systems (DOE 2008). The review has briefly examined each goal and the technologies to
achieve them, as identified by BT.
Dynamic Windows
For dynamic windows the subprogram will attempt to develop optical switching coatings
which are able to provide dynamic control of sunlight over a broad spectrum of conditions.
Additionally, the dynamic window systems will be fully integrated into building system controls,
allowing for fully automated dynamic windows or remote manual access (DOE 2008). The
efficiency gains and added thermal comfort, if achieved, would be significant.
The largest natural energy flow in a building is the absence and presence of sunlight. The
Windows subprogram is pursuing the development of reflective hydride dynamic window
(RHDW) as the solution to harness this energy (DOE 2008). The first generation of RHDWs are

43
too small and cost-prohibitive for implementation. Consequently, the subprogram is currently
researching and developing the second generation of RHDWs, chemical engineering
applications, and advanced manufacturing processes to reduce the cost and increase market
penetration of these systems between 2010 and 2015 (DOE 2008).
Highly Insulated Windows
The next main goal of the subprogram, highly-insulating windows, attempts to reduce
heat loss rates of windows and develop high solar heat gain windows for northern climates; all
the while preserving the traditional characteristics of windows (DOE 2008). When high-R
glazing systems are implemented in conventional window frames half of the energy lost is
through the frame. Thus, the subprogram focuses on the advancement of conventional window
frames via examination of: “how low-conductivity materials are used, the potentials of insulating
voids, the use of thermal breaks in selected areas, suppression of radiation and convection within
voids, interactions of spacers, impacts of hardware, and product design for function” (DOE 2008,
p. 2-57). In conjunction with the development of a more energy efficient window frame, the
subprogram is pursuing the development of low-cost, high r-value insulating glazing systems.
Today, the highest performing windows in the U.S. achieve U-values between 0.15 and 0.35.
These levels of insulation are achieved via multiple layers of glass and gas filled voids, making
the systems exceedingly heavy, thick, and expensive. Consequence of the significant additional
cost, these systems have not had much market penetration (DOE 2008). The subprogram will
address issues of weight and cost; aiming to reduce them significantly by developing new high
performing glazing systems with conventional components and manufacturing techniques, to
keep incremental costs low (DOE 2008).

44
Enabling Technology Research for Efficient Products
In order to properly design, test, and rate these new dynamic systems the subprogram’s
goal of, “enabling technology research for efficient products,” will develop the, “tools, test
facilities, and data resources needed to accurately predict component, product, and systems
thermal, optical, daylighting, and energy performance under a full range of operating conditions”
(DOE 2008, p. 2-54). Such facilities and procedures will be necessary if market penetration of
the new window systems is to be successful. The R&D teams must be able to demonstrate
significant efficiency gains while preserving aesthetics, durability, and low incremental cost.
Crucial to the success of this goal is the development of design tools to assist manufacturers with
efficient product production (DOE 2008). In the past, the process of prototyping was costly and
time consuming. Manufacturers had to physically build and test each prototype to gain accurate
performance data. Today, computer modeling software allows for relatively quick and cost
effective testing of new systems. These modeling programs are able to model heat transfer and
solar gain through glazing and heat transfer through framing. The BT program’s goal is to
extend the capabilities of the available software so that parameters are easily updated, to stay
current or ahead of material R&D efforts (DOE 2008).
Daylighting and Advanced Façade Systems
Finally, the daylighting and advanced façade systems goal of the subprogram will attempt
to develop technologies which will eliminate 50 to 90 % of daytime electrical lighting necessary
for building perimeter areas (DOE 2008). The subprogram will also effectively increase the
depth which light can penetrate into a building, increasing the building perimeter area.
Historically, many of the advancement’s in window systems have focused on thermal
characteristics, typically sacrificing the optics of the systems. The BT Windows subprogram
will explore technologies which can improve the transmittance of light into buildings, effectively

45
reducing artificial lighting needs. The subprogram will also investigate and promote
implementation of new technologies dedicated to natural light distribution in buildings, such as
light pipes (DOE 2008). Furthermore, this goal addresses the development of innovative façade
solutions which will achieve net 60 to 80 % energy and demand savings as compared to typical
ASHRAE compliant façades per climate (DOE 2008). Current technologies allow for a semi-
dynamic building façade with computer controlled shading devices and dynamic lighting via
perimeter sensors. The Window subprogram will advance current control algorithms, create
better sensors, and develop these technologies in test facilities. Moreover, new commissioning
and operation strategies will be developed to optimize operational efficiency (DOE 2008).
Photovoltaics (PV)
While BT acknowledges PV technology as the most widely applicable onsite energy
producing system, it neglects to describe the current and future state of the technology.
Throughout most of the BA defined hot and humid climate region, PV energy is the only feasible
source for onsite energy production. The BA program identifies onsite renewable energy
production of 30 % of annual energy consumed as the target by 2020 to achieve NZEH. The
review will now briefly examine the current state of PV energy production and its residential
application. Currently there are two prevailing methods of implementing PV in residential
buildings, building attached photovoltaics (BAPV) and building integrated photovoltaics (BIPV).
Building Integrated Photovoltaics
BIPV are fully integrated into the building structure and are essentially permanently
installed. Examples of such systems include PV shingles, tiles, slate, and metal. Furthermore,
BIPV can be utilized to wholly replace building components such as windows, awnings,
skylights, and roof decking systems (Barkaszi and Dunlop 2001). BIPV often employ thin-film
PV panels which can be integrated almost seamlessly with materials and thus are aesthetically
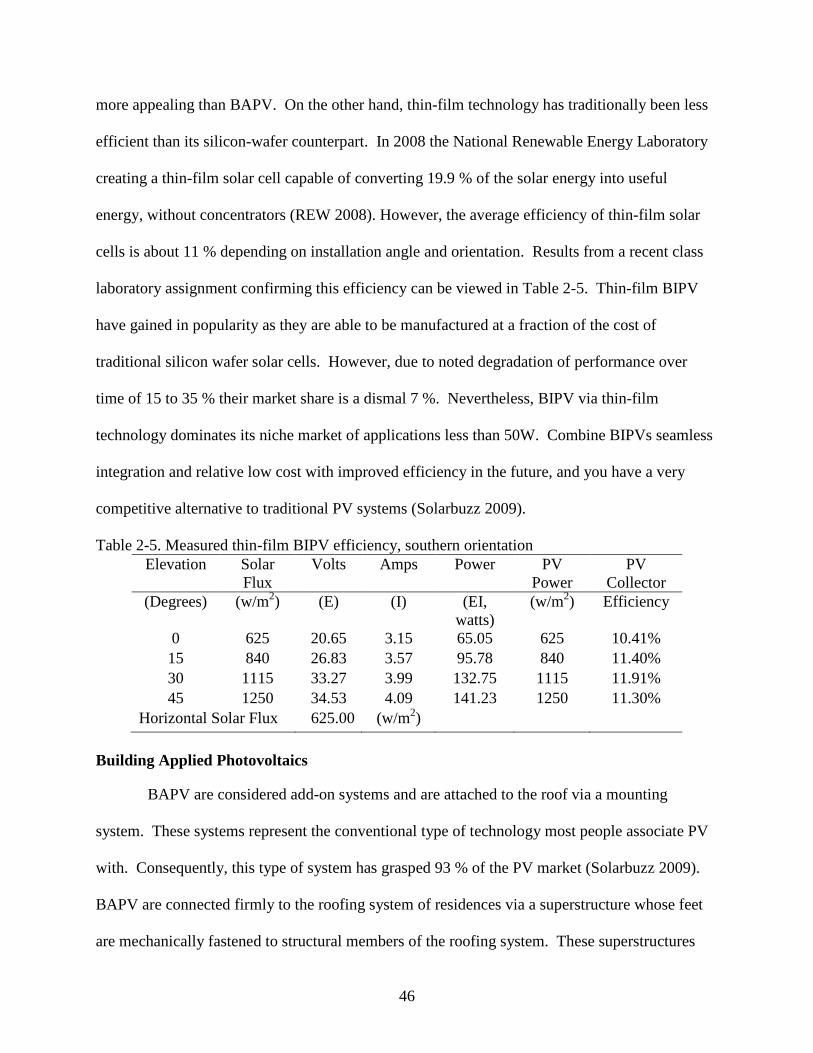
46
more appealing than BAPV. On the other hand, thin-film technology has traditionally been less
efficient than its silicon-wafer counterpart. In 2008 the National Renewable Energy Laboratory
creating a thin-film solar cell capable of converting 19.9 % of the solar energy into useful
energy, without concentrators (REW 2008). However, the average efficiency of thin-film solar
cells is about 11 % depending on installation angle and orientation. Results from a recent class
laboratory assignment confirming this efficiency can be viewed in Table 2-5. Thin-film BIPV
have gained in popularity as they are able to be manufactured at a fraction of the cost of
traditional silicon wafer solar cells. However, due to noted degradation of performance over
time of 15 to 35 % their market share is a dismal 7 %. Nevertheless, BIPV via thin-film
technology dominates its niche market of applications less than 50W. Combine BIPVs seamless
integration and relative low cost with improved efficiency in the future, and you have a very
competitive alternative to traditional PV systems (Solarbuzz 2009).
Table 2-5. Measured thin-film BIPV efficiency, southern orientation Elevation Solar
Flux Volts Amps Power PV
Power PV
Collector (Degrees) (w/m2) (E) (I) (EI,
watts) (w/m2) Efficiency
0 625 20.65 3.15 65.05 625 10.41% 15 840 26.83 3.57 95.78 840 11.40% 30 1115 33.27 3.99 132.75 1115 11.91% 45 1250 34.53 4.09 141.23 1250 11.30%
Horizontal Solar Flux 625.00 (w/m2)
Building Applied Photovoltaics
BAPV are considered add-on systems and are attached to the roof via a mounting
system. These systems represent the conventional type of technology most people associate PV
with. Consequently, this type of system has grasped 93 % of the PV market (Solarbuzz 2009).
BAPV are connected firmly to the roofing system of residences via a superstructure whose feet
are mechanically fastened to structural members of the roofing system. These superstructures

47
can be separated into standoff and rack mounted array types (Barkaszi and Dunlop 2001). The
main difference between the two systems is the angle at which the panels are oriented. Standoff
BAPVs are mounted parallel to the slope of the roof, and thus, their efficiency is subject to the
angle and orientation of the roof. Rack mounted arrays are typically used for flat roof situations
and align the panels at the optimum angle and orientation for that specific location (Barkaszi and
Dunlop 2001). Efficiencies for BAPV average around 16 % but vary widely; consequence of
multiple types of silicon wafer production technologies, site constraints, orientation, angle, and
so forth (Solarbuzz 2009). Despite their large market share, BAPV via silicon wafer
technologies have many disadvantages. The most obvious disadvantage is cost, due to their
intensive use of silicon material. Other shortcomings include thickness of the system, aesthetics,
and possible shortage of solar grade silicon (Goetzberger 2005).
Photovoltaic Constraints
As mentioned, the performance of any PV system is highly dependent upon orientation,
location, and site conditions. The single most inhibiting factor of PV cell performance is
shadows. Even covering a very small %age of the collector area has proven to have significant
impacts on system performance (Barkaszi and Dunlop 2001). As a result, great attention must be
placed on shielding the PV system from shadows. Shadows can come from nearby buildings,
flag poles, vegetation, towers, and so on. When finalizing the location for the PV system is it
vital to consider future property development and tree growth (Barkaszi and Dunlop 2001).
When installed, PV systems ideally will have unobstructed solar access from 9:00 a.m. to 3:00
p.m. (Barkaszi and Dunlop 2001). When determining the final tilt and azimuth angles it is
imperative to consider the site latitude and annual energy performance desired from the system.
As most PV systems tilt is limited by the pitch of the roof, the generalized rule of thumb is to
orient the panels facing south, within +/- 15 degrees of your latitude (Barkaszi and Dunlop
48
2001). Tailoring the PV tilt to suit the highest seasonal energy demand is an important
consideration as well. For northern climates the majority of space conditioning occurs in the
winter months, thus PV systems should be installed with higher tilt to take advantage of the low
path of the winter sun. Conversely, in the hot and humid climates of the south less tilt should be
applied to panels to maximize energy production during the summer months (Barkaszi and
Dunlop 2001). Furthermore, mounting technique can impact the cooling and heating load
necessary throughout the year. Directly mounted BAPV and BIPV can increase heat transfer
between roof surfaces and conditioned space as the panels heat up during the day. This
observation is mostly beneficial in northern climates and an obvious detriment in warmer
climates. On the other hand, standoff systems can reduce the amount of heat transfer as they
shade the roof, a good strategy for hot and humid climates (Barkaszi and Dunlop 2001).
Photovoltaic Cost
The financial feasibility of PV implementation in the residential sector is improving.
Installed cost per kW is, on average, about $10,000 (GLSL 2009). The cost of the onsite energy
systems is, currently, highly subsidized in many areas by the state and federal government. For
example, it is possible to install a 5 kW PV system on a residence in Florida for around $6,000,
about $32,000 less than its non-supplemented value. These savings are the results of the
implementation of the American Recovery and Reinvestment Act of 2009 (ARRA). The details
of the financials can be viewed in Table 2-6 (Allsolar, personal communication, May 15, 2009).
Additionally, with the recent adoption of net metering and the feed in tariff in the U.S. the
payback period for PV systems can be drastically reduced. Leading the way in promoting
decentralized PV energy production, Gainesville Regional Utilities (GRU) has come up with a
promising incentive for homeowners implementing PV. GRU is offering $0.32 per kWh
contributed to the grid. This feed in tariff is the first in the U.S. and offers nearly 3.5 times as

49
much per kWh sold as kWh used (Armistead 2009). The GRU program will likely spur similar
incentives around the nation, making the feasibility of PV for early adopters more promising
than ever.
Table 2-6. Effects of the ARRA on residential PV Allsolar Residential Example
Before January 1, 2009 5kW System $ 40,000 FL State Rebate -20,000 30% Tax Credit -6,000 Final Cost after incentives $14,000 Current ARRA 2009 5kW System $40,000 FL State Rebate -20,000 30% Tax Credit -12,000 Final Cost after incentives $6,000
Improved Disaster Resistance
Weather phenomena in hot and humid climates are some of the most severe in the nation;
specifically hurricanes. An added benefit of designing NZEHs and utilizing PV for onsite
energy production is the added function of a more disaster resistant building. In addition to
advanced construction techniques, such as connecting the roof to the foundation, a disaster
resistant building relies on renewable energy sources to provide the bare minimum amount of
energy necessary to maintain the essential life supporting functions of a home in the aftermath of
a disaster (Haggard and Young 2006). Providing the added benefits of weathering the storm and
thriving afterwards, represents an added benefit of NZEH design which is difficult to quantify.
Regardless this, “…priceless life and property saving…” building technique is an important
consideration when building in hot and humid climate zones and consequence of the PV array
installed (Haggard and Young 2006, p. 2514).
50
Progress toward Creating NZEC: Past and Present Projects
The review has briefly spotlighted past and present attempts at creating NZECs. While
none of these examples achieved NZE, their contributions to the advancement of energy efficient
community design are noteworthy. As mentioned before, the equation to create NZECs is quite
simple; a builder/developer designs a home which can achieve NZE and multiplies it to the
desired community density. Ultimate feasibility of the NZEC concept relies on the selling price
of a NZEH falling within said market’s acceptable range; all the while providing the expected
return on investment for the builder/developer.
Premier Gardens
Several developments implementing the above strategy have been built since 2001, and
many more are currently in early conceptual phases. One of the earliest and most valuable
studies in energy efficient communities to date is the Premier Gardens community in
Sacramento, California. This project is considered to be so valuable because directly across the
street a similar community was built by a similar builder without any energy efficient features,
resulting in a apples to apples comparison. Premier Gardens is comprised of 95 entry level
homes varying in size between 1280 and 2250 square feet (Parker 2009). These homes were
designed and built to very moderate levels of energy efficiency as described by Parker (2009, p.
515): “RSI-6.8 (roughly R-40) ceiling insulation and RSI-2.3–3.4 (about R-13 to R-19) wall
insulation, tankless gas water heaters, high efficiency gas furnaces, tightly sealed ducts buried in
the attic insulation, fluorescent lighting in all permanent fixtures.” Furthermore, each home was
equipped with its own 2.2 kW PV array. The Sacramento Municipal Utilities District (SMUD)
monitored both communities and concluded that the Premier homes averaged, “34% lower gas
consumption and 16% lower electricity use without solar power production being considered.
With the PV included, the homes averaged 54% lower electrical demand—particularly evident
51
during summer peak periods” (Parker 2009, p. 515). SMUD continued to monitor the homes in
the development for a year which resulted in an average energy consumption of 70.1 kWh/m2;
this figure is less than half of what an average SMUD home consumes, about 144 kWh/m2
(Parker 2009). Consequently, the Premier homes community demonstrated a 50 % reduction in
energy use at an average incremental cost of $18,836 without factoring in California specific
rebates (Parker 2009).
Other Builder/Developer Attempts
Due to the relative success of the Premier homes project, three other builders in
California and one in Arizona have mimicked the concept. The builders in California are Shea
Homes, Clarum Homes, and Grupe Homes; the one in Arizona is John Wesley Miller (Parker
2009). Shea Homes has monitored their projects and have averaged a 54 % reduction in energy
consumption, as compared to their traditional homes. A huge marketing tool for these builders is
the significant reduction in the homeowner’s monthly utility bill. The average utility bill for
Armory Park del Sol, the John Wesley Miller community, is $16/month (Parker 2009).
Additionally, all three California builders have said the near-zero energy homes sell much more
quickly than a conventional home. At Grupe Homes community Carsten Crossings, the energy
efficient homes were selling twice as quickly as the competitions homes. Therefore the builder
has stated a savings of $13 million in overhead (Parker 2009). With such compelling historical
evidence it is difficult to imagine the decline of the NZEC concept.
Gainesville, Florida: NZEC Prospect
The NZEC concept is currently under development in the hot and humid climate zone.
As mentioned, this type of climate represents a significant challenge in achieving reductions in
energy consumption due to the existence of large cooling loads. Gainesville, Florida, an oasis in
the desert that is the hot and humid climate zone, is a front runner in energy efficient home

52
design for the climate zone; implementing the first energy star homes, near zero energy homes,
and soon to be one of the first NZEHs in the area. Gainesville is the home to multiple BA
program builders and developers: Atlantic Design and Construction, G.W. Robinson, Richard
Schackow, and Tommy Williams Homes to name a few (Baechler and Love 2004).
Consequence of the improved energy performance of the homes, G.W. Robinson targets a 10 %
return on investment. The builder has no problem attaining these figures as homeowners are
given 1/8 point discounted mortgage rates and are approved for higher priced homes due to the
expected lower monthly utility bill (Baechler and Love 2004). The next major advancement for
energy efficient homes in the hot and humid climate zone is under development by local builder
Tommy Williams Homes. The builder is currently working in conjunction with BA and FSEC
professionals to design and build the first true NZEH in the hot and humid climate zone; the
home will be in the emerging Long Leaf development. If successful, the home will provide the
builder with the solution to the NZE equation, possibly elevating Long Leaf to the status of the
first true NZEC in the nation.
The Business Case for the Development of NZECs
The final part of this review focused on the business case for implementing sustainable
ideas in the built environment at the corporate level. The review will take a large step back and
examine the environmental, social, and economic reasons to adopt sustainable practices at all
scales. By examining the impacts of sustainable practices at the broadest level the review will
indirectly identify why today’s builders/developers need to adopt this mentality to not only turn a
profit, but make the NZEC concept a reality. Total buy in from all scales of economic and social
stakeholders is essential if the NZEC concept is to be a success.
A shift in the corporate mindset is on the horizon. Business leaders around the world
recognize that “sustainability has moved beyond the corporate social responsibility agenda to

53
become an integral part of core business strategy and success (of a business) (Bent 2008).”
Companies are moving away from asking; how do we integrate a sustainability plan into our
business? Towards; how do we develop a business strategy from our sustainability plan (Bent
2008)? The biggest obstacle to these types of corporate changes is the lack of a strong business
case for operating sustainably.
Multiple entities around the world strive to provide these forward looking businesses with
compelling arguments for the adoption of a sustainable development plan. The World Business
Council for Sustainable Development (WBCSD) is one such entity. The WBCSD is a coalition
of 160 international companies who share in their commitment to sustainable development via
the three pillars of economic growth, ecological balance, and social progress (WBCSD 2002).
The WBCSD defines sustainable development as, “…forms of progress that meet the needs of
the present without compromising the ability of future generations to meet their needs (WBCSD
2002).” Simply put sustainable development is about ensuring a better quality of life for
everyone, now and for generations to come. This umbrella term, sustainable development, is
anchored by the three overarching subsections: social, environmental, and economical
responsibility. The WBSCD argues that the execution of all three criteria, while maintaining a
profit, will define the successful business of the future (WBCSD 2002). So, how does the
business case for sustainable development relate to the built environment and the NZEC
concept?
Simply put, every business has a physical building which contributes to the glutton that is
the built environment. The business case for sustainability in the built environment mirrors that
of the WBCSD. Buildings and infrastructure which take into consideration social,
environmental, and economic concerns will outperform and outlast those which do not. The
54
ultimate acceptance of sustainable development in the built environment is exacerbated by the
magnitude of the impacts it has on the environment and society. The Built Environment
consumes 30% of all primary energy in the United States. The associated burden (extracting,
processing, transporting) of gathering the energy necessary to satiate this high demand belongs to
the Built Environment as well. Additionally, the sprawling unchecked growth of the Built
Environment has led to increased dependency on automobiles. The Built Environment consumes
40% of all materials annually extracted in the United States, and contains nearly 90% of all
materials historically extracted (Kibert 2002). Clearly there is room to improve. This section
highlighted the business case for reducing the impacts of the built environment from an
economical perspective. However, it is important to note that most of these economic benefits
also pay dividends in social and environmental capacities as well.
The business case for sustainability in the built environment is based on a framework of
benefits: economic, productivity, risk management, health, public relations and marketing,
recruitment and retention, and funding (Yudelson 2008). The arguments which provide the most
compelling evidence for acceptance by stakeholders are the economical indicators. One
economical benefit of sustainably built buildings is that they generally operate using 25 to 40 %
less energy than comparable code compliant buildings. This reduction in energy use translates to
between 40 cents and $1 savings per square foot of electricity use (Yudelson 2008). These
savings come with an additional cost averaging between 1 and 2 % of capital costs, with a
relatively short payback period (averaging less than three years). To quantify these savings in
energy costs, an “80,000 square foot building would save between $32,000 and $80,000 per year,
year after year, at today’s prices (Yudelson 2008)”.

55
Another advantage of building Green is an overall reduction in operational and
maintenance (O&M) costs. According to Jerry Yudelson, Chair of the 2008 Greenbuild
International Conference and Expo:
“…More than 120 studies have documented that energy-saving buildings that are commissioned properly at 50 cents to $1 per square foot of initial cost (equal to one year of savings) show additional operational savings of 10 to 15 % … (and) tend to be much easier to operate and maintain” (Yudelson 2008).
These savings in O&M costs are a result of comprehensive functional testing of all energy-using
systems prior to occupancy. Additionally, these testing measures identify potential problems
prior to final turnover. As a result of the energy savings and lower O&M costs the overall value
of the building increases (Yudelson 2008). To illustrate this principal let’s consider a 75,000
square foot commercial building that saves $37,500 per year. With a capitalization rate of 6 %
the building would gain $625,000 in value as a result of Green practices (Yudelson 2008). If a
builder/developer were to act as the owner for their first NZEC, renting out the units, one could
imagine the amount of savings to be had based upon the figures above.
Tax benefits offer further incentive to build Green. Some states, such as Oregon and
New York, and Florida offer state tax credits. Other states, like Nevada, offer property and sales
tax abatements for building Green. On top of these state tax credits, the federal government can
help offset the initial Green investment with their own tax credits (Yudelson 2008). For
example, Oregon’s tax credit is dependent on two variables; building area and Leadership in
Energy and Environmental Design (LEED) certification level. A 100,000 square foot, Platinum
Level, building in Oregon will receive a net-present value tax credit of about $2 per square foot
(Yudelson 2008). In Nevada, if your building achieves LEED Silver level you are allotted a
property tax abatement of up to 50 % for a period up to 10 years. Assuming the property tax is 1
% of value, the abatement could be worth up to 5 % of the building cost. This would be much

56
less than the cost to achieve LEED silver certification (Yudelson 2008). In 2005 the Federal
Government passed the Energy Policy Act which offers two major tax incentives for Green
buildings. According to Yudelson, “a tax credit of 30 % on both solar thermal and electric
systems and a tax deduction of up to $1.80 per square foot for projects that reduce energy … by
50 % compared to 2001 baselines (Yudelson 2008).” As illustrated, the economical arguments
for sustainability in the built environment are plentiful. The above examples demonstrate only a
few areas where building Green makes green.
The built environment exists in many scales, ranging from the individual residence to the
roads which stitch states and countries together. The next section will documented the business
case for sustainability in the built environment through a variety of these scales. The review
examined case studies which demonstrated the benefits discussed above at the scale of: the
material supplier, individual residence, and corporate level.
Material suppliers are the backbone to the Green building movement. Without
sustainably produced/oriented materials and equipment the notion of a Green building would
remain a mere concept. The exponential increase in sustainable material suppliers and options is
evidence of the profitability of being labeled Green. While the amount of green washing on the
market can be nauseating, two companies who continue to set the industry standard are Steelcase
Furniture and Interface Carpet. Steelcase’s director of global environmental performance, David
Rinard, summarizes the company’s outlook on their responsibility as a material supplier; “If we
buy a raw resource and don’t turn it into product, we have an opportunity to improve (Quinn
2007). In 2004 Steelcase received the first Cradle-to-Cradle (C2C) certification for office
furniture with its Think Chair (Quinn 2007). Since then the company has continued to pursue
production facilities. Steelcase built the first LEED-certified manufacturing plant and got eight
57
of its global manufacturing operation ISO 14001 certified. These efforts have resulted in
reductions in a variety of eco-metrics. The primary benefits’ resulting from Steelcase’s Green
efforts is increased marketability, and a well justified premium on their products. Interface
Carpets has set the steep goal of becoming a zero-impact organization by the year 2020 (Hilgers
2008). The company made this transition, after inquiries about the sustainable nature of their
product from the sales floor made their way to Ray Anderson, CEO. Anderson’s perspective
was, “That piece of business was slipping away … our customers care, so we have to care
(Hilgers 2008).” Interface has strived to create new and innovative way to recycle carpet nylon.
Sabi, one of the company’s carpet lines boasts 51 % recycled content, while Terratex is made of
100 % recycled or renewable fibers. By recycling rather than wasting, Interface has saved $372
million in waste reduction alone (Hilgers 2008). Anderson contributes his company’s success to
their 100 % buy in to sustainable practices; “No amount of advertising could have brought us this
much goodwill … I have never known a more powerful differentiator than sustainability (Hilgers
2008).” Next, the review will examine the business case for sustainability at the scale of the
private residence.
Building Green at the scale of a private residence is likely the most difficult scenario to
sell. Homeowners lack the capital of large corporations, and might not live in the same residence
long enough to fully capitalize on any energy saving systems. However, homeowners are
typically more receptive of, and subject to the same benefits discussed above. A shining
example of the potential for savings in a residence is the Z6 house in Santa Monica, CA. The Z6
house served as a prototype for LEED for Homes v.1 and ended up achieving Platinum level
certification (Building Green 2007). Z6 stands for the, “six zeros,” or the design goal for the
house: zero waste, zero energy, zero water, zero carbon, zero emissions, and zero ignorance
58
(Building Green 2007). Financially, it is pretty clear how achieving the six zeros would benefit a
homeowner. Highlights of the home include: a 3500 gallon cistern, a 2.4 KW photovoltaic array
w/ battery storage, LED lighting, Pre-manufactured and assembled onsite, and an indoor garden
(Building Green 2007). These systems work together to make the z6 home 80 % more energy
efficient than a conventional comparable home, all the while producing 75 % less construction
waste (Hanes 2007). It is clear that the z6 home will benefit from a higher resale value, lower
operating cost, longer life span, multiple tax breaks, and unparalleled energy cost savings. These
savings and benefits, realized at the scale of an individual home, are exponentially increased at
the scale of a community.
Paul Hawken, often described as the father of sustainability, generalized the hurdles
which plague all corporations:
“Business has three basic issues to face: what it takes, what it makes and what it wastes. First, business takes too much from the environment and does so in a harmful way. Second, the products it makes require excessive amounts of energy, toxins and pollutants; and finally, the method of manufacture and the very products themselves produce extraordinary waste and cause harm to present and future generations of all species, including humans” (Freese 2007).
By reducing impacts in these three areas companies can reap the economic benefits discussed.
A prime example for the business case of sustainability in the built environment of corporations
involves Ford Motor Company. The architect in charge of the renovation of Ford’s WWII era
River Rouge Factory was William McDonough. McDonough says, “The key to getting
businesses to go green is to make the sustainable technology so profitable that the const-
conscious executives can’t afford not to change (Fainelli 2001). The centerpiece of his overhaul
at the factory was a 454,000 square foot green roof, complete with native foliage. This simple
gesture resulted in a savings of nearly $35 million worth of stormwater treatment per year
(Fainelli 2001).
59
DuPont CEO, Chad Holliday, “believes sustainability is good for business to the tune of
$6 billion (Johnson 2006).” DuPont plans on achieving this through sustainable market
offerings, but primarily through revamping industrial processes, Greening production facilities,
and converting their global fleet of automobiles to the most efficient system available by 2015
(Johnson 2006).
Armstrong World Industries, Inc. is a global leader in the design and manufacture of
floors, ceilings, and cabinets for residential and commercial buildings (Eberly 2007). Armstrong
takes pride in its environmental position highlighted by eco-friendly product offerings and
multiple corporate sustainability programs. In 2006 Armstrong made the decision to revamp
their corporate headquarters in Lancaster, Pennsylvania according to LEED EB standards. In the
end, Armstrong achieved a LEED EB Platinum level, making their headquarters one of only five
LEED EB Platinum buildings (2007 statistic) (Eberly 2007). The original building was designed
and built in 1998 with extensive Green methodologies which helped to keep costs of LEED EB
renovation down. In the end the total out of pocket cost to bring the headquarters up to Platinum
levels was $138,000 (Eberly 2007). From these efforts Armstrong was able to: save about
$25,000 annually in energy costs, save $4,400 annually on cleaning and maintenance products,
and save 380,000 gal of water annually to name only a few of the economic benefits (Eberly
2007).
The review has examined on a broad scale the economic benefits resulting from Green
building practices: reduced energy costs, reduced O&M costs, tax breaks, and increased building
value and marketability. All of these benefits are directly applicable to the builders/developers
who pursue NZEC. The review has demonstrated how said benefits manifest themselves at the
scale of the material supplier, the residence, and the corporation. The business case for

60
sustainability in the built environment is clear, building Green makes green. However, it is the
additional concerns (social and environmental) linked with these economic benefits which are
difficult to identify and quantify. The next step in the overall sustainable development
movement is to build the business case for social and environmental consideration by all
businesses. The successful business of the future will be one which address all three issues of
sustainability on equal terms, and does so while generating a profit. Furthermore, the ideal
vehicle for builders/developers to achieve these lofty conditions is the NZEC concept.
61
CHAPTER 3 METHODOLOGY
This chapter outlined the process which was followed to address the thesis statement.
This thesis examined the feasibility of developing net-zero energy communities in hot and humid
climates. Feasibility was determined against the calculated average single-family new home cost
per square foot to construct in Gainesville, Florida. Additionally, this study focused on the
problem statement from the perspective of the builder/developer. Accordingly, the advantages to
the builder/developer were identified. A detailed synopsis of the analytical steps taken follows.
Step 1: Literature Review
A literature review was conducted and focused heavily on the DOE Building Technology
(BT) and Building America (BA) programs. Within these programs the review identified the
current state of energy efficient home design and examined the future goals of the program;
essentially the objectives which must be met if the program is to achieve its intention of NZEHs
by 2020. Furthermore, the literature review examined technologies outside the scope of BA
which could be implemented to increase the energy efficiency in homes.
Step 2: Determine Gainesville’s Baseline Cost/SF
The next step determined the baseline cost per square foot for a new single-family home
built in a community of Gainesville, Florida. Seide (2009) reports that the average price per sf
for new construction of single-family homes in Gainesville is currently $147. To validate this
figure, this work calculated its own baseline cost from readily available information. When
determining the baseline cost per square foot BA partner homes were separated from
conventional single-family homes built in communities. The results indicate that the BA
builders/developers are able to deliver a higher performing home at the same cost per square
foot, on average. The conventional homes cost per square foot to construct was calculated
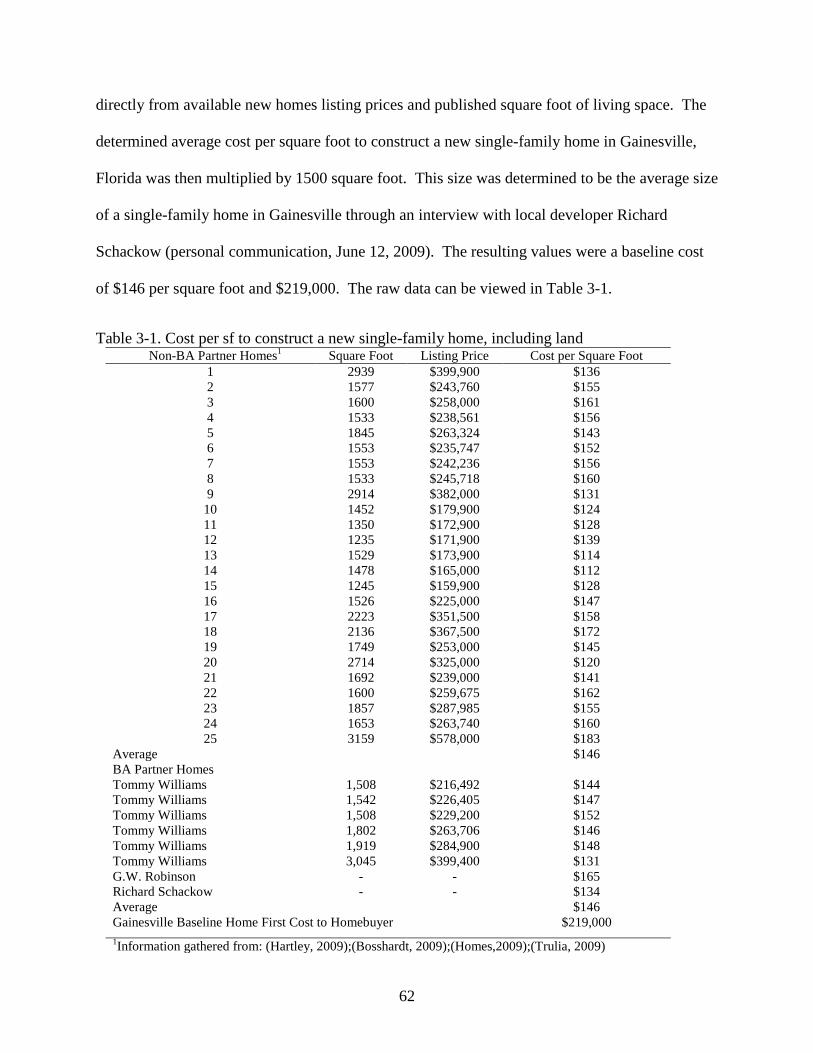
62
directly from available new homes listing prices and published square foot of living space. The
determined average cost per square foot to construct a new single-family home in Gainesville,
Florida was then multiplied by 1500 square foot. This size was determined to be the average size
of a single-family home in Gainesville through an interview with local developer Richard
Schackow (personal communication, June 12, 2009). The resulting values were a baseline cost
of $146 per square foot and $219,000. The raw data can be viewed in Table 3-1.
Table 3-1. Cost per sf to construct a new single-family home, including land Non-BA Partner Homes1 Square Foot Listing Price Cost per Square Foot
1 2939 $399,900 $136 2 1577 $243,760 $155 3 1600 $258,000 $161 4 1533 $238,561 $156 5 1845 $263,324 $143 6 1553 $235,747 $152 7 1553 $242,236 $156 8 1533 $245,718 $160 9 2914 $382,000 $131
10 1452 $179,900 $124 11 1350 $172,900 $128 12 1235 $171,900 $139 13 1529 $173,900 $114 14 1478 $165,000 $112 15 1245 $159,900 $128 16 1526 $225,000 $147 17 2223 $351,500 $158 18 2136 $367,500 $172 19 1749 $253,000 $145 20 2714 $325,000 $120 21 1692 $239,000 $141 22 1600 $259,675 $162 23 1857 $287,985 $155 24 1653 $263,740 $160 25 3159 $578,000 $183
Average $146 BA Partner Homes Tommy Williams 1,508 $216,492 $144 Tommy Williams 1,542 $226,405 $147 Tommy Williams 1,508 $229,200 $152 Tommy Williams 1,802 $263,706 $146 Tommy Williams 1,919 $284,900 $148 Tommy Williams 3,045 $399,400 $131 G.W. Robinson - - $165 Richard Schackow - - $134 Average $146 Gainesville Baseline Home First Cost to Homebuyer $219,000 1Information gathered from: (Hartley, 2009);(Bosshardt, 2009);(Homes,2009);(Trulia, 2009)

63
Step 3: Identify the Builder/Developers Advantages & Goals
This work then identified the builders/developers advantages and subsequent goals of
building energy efficient homes. The builder/developer goals were identified through
correspondence and interviews with local builders/developers of energy efficient communities,
and a BA case study of local builder G.W. Robinson Builders (McIlvaine et al. 2008).
Builder/Developer Advantages
In today’s lean economy it is imperative that a builder/developer maintain a competitive
advantage in the marketplace. As the societal buy-in of a sustainable lifestyle grows, many
consumers are demanding more from themselves and the things they purchase. The single most
significant purchase for any individual, their home, is no exception. Consumers are demanding
higher efficiency, a healthier indoor environment, and less environmental impact; all the while
maintaining conventional aesthetics and cost. Consequently, many of today’s leading
builders/developers have identified energy efficient, sustainable homes and communities as the
key to the future success of their business. There are documented advantages to developing
sustainable, energy efficient communities. To begin with, energy efficient communities enjoy
fast tracked permitting and approvals from local and state governments. In Delaware, if a
builder/developer conforms to the new Super Green program for the development of land and
infrastructure (read community) they can shave up to two years off the average planned unit
development application process (Binsacca 2009). Due to the often repetitive, prescriptive
nature of residential communities the builder/developer has a unique ability to control the
economies of scale for materials and labor. By replicating only a few home styles, the
builder/developer eliminates the learning curve associated with unique homes and is able to buy
materials in bulk at lower costs. Green builder/developer CJ Crowell supports this notion by

64
saying, “We’ll certainly be able to lower hard costs with the type of home and the volume we’re
building” (Binsacca 2009, p. 2). Furthermore, builders/developers of green communities benefit
from a better public image. Another major advantage for builders/developers is greater
marketability and higher than average unit sales. G.W. Robinson of Gainesville, Florida is a BA
partner and regularly advertises the fact. G.W. Robinson has been building energy efficient
homes in the area since 2000 with a sales price range of $300,000 up to $1,000,000; averaging
$165 per square foot (McIlvaine et al. 2008). The local market has responded to the extra efforts
of the builder as G.W. Robinson enjoys stronger sales in their CobbleField development at a
lower comparable cost to the homeowner. Additionally, the builder/developer enjoyed higher
than average home sales at the beginning of the residential market downturn in 2006. G.W.
Robinson closed 91 homes in 2005 and 96 in the tough market of 2006 (McIlvaine et al. 2008).
The builder/developer planned the CobbleField development in Gainesville to BA Best Practices
standards. The community was one of the first to achieve a 40 % reduction in average energy
consumption at very low incremental cost to the homeowner, acting as a pilot community for the
2010 BA Best Practices (McIlvaine et al. 2008).
Builder/Developer Goals
The overall goal of any builder/developer is not so complicated to define. Ultimately, the
builder/developer is in the business to make money. The advantages outlined above make a
compelling argument for building the first NZEC. Additionally, it has been demonstrated that
building green makes green. However, the risk accompanied with the additional costs and
relative novelty of the concept is significant. Consequently, it is likely that anyone who invests
in the development of the first true NZEC will expect a higher than average return on
investment. This fact represents a major hurdle for the financial feasibility of NZECs. However,
as local developer Richard Schakow pointed out in an interview, “it is very important to consider

65
the culture of the area which you build” (personal communication, June 12, 2009). Schackow
highlighted the areas desire and acceptance of energy efficient homes, concluding that it could
have a significant impact on the feasibility of NZECs regardless of incremental cost.
Step 4: Energy-10 Development
This work then identified/quantified the modeling and building parameters for Energy-
10. Energy-10 is an energy modeling software created by the National Renewable Energy
Laboratory (NREL) and funded by the U.S. DOE. The software is exclusively distributed
through the Sustainable Buildings Industry Council (SBIC). The version used for this thesis was
v1.8 which includes the ability to accurately size and model PV and Solar DHW systems. The
validity of any energy outputs is a direct reflection of the accuracy of information inputted.
Subsequently, a significant amount of time and energy was devoted to identifying a scientific
framework for modeling the homes and converting the system values to their appropriate
metrics.
Load Profiles
The BA 2008 Benchmark (Hendron 2008) was consulted to develop the appropriate load
profiles for each of the Energy-10 internal gains. These internal gain load profiles define, on a
24 hr timescale, the %age of peak energy consumption for a given domestic system. There are a
total of five profiles, each of which has two operating modes; workday and non-workday. The
five profiles which were defined relate to internal lights, external lights, people number, hot
water, and other (MELs). For the sake of this work, a typical work week of 9-5, Monday
through Friday was assumed. Energy-10 does not allow for as detailed a modeling scenario as
the BA 2008 Benchmark outlines. Areas which Energy-10 is lacking are the modeling of
individual major appliances and detailed domestic hot water usage. Additionally, the metric for
which these systems are measured is difficult to quantify accurately. The unit used in Energy-10
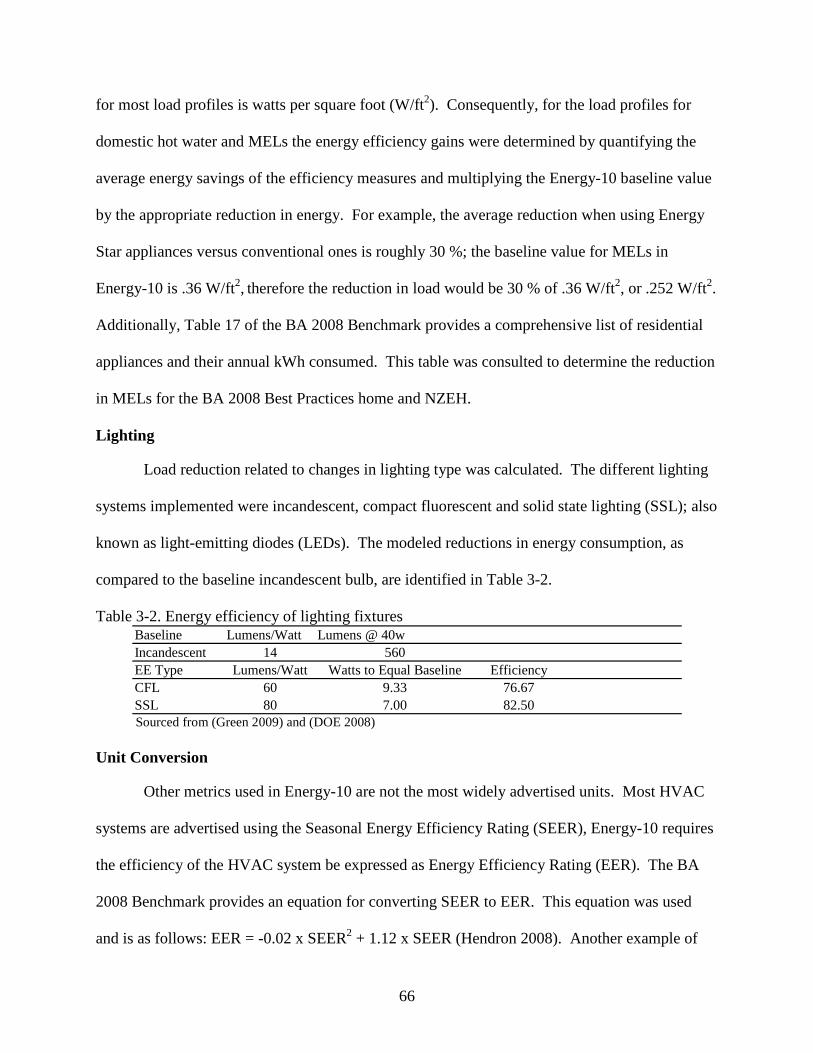
66
for most load profiles is watts per square foot (W/ft2). Consequently, for the load profiles for
domestic hot water and MELs the energy efficiency gains were determined by quantifying the
average energy savings of the efficiency measures and multiplying the Energy-10 baseline value
by the appropriate reduction in energy. For example, the average reduction when using Energy
Star appliances versus conventional ones is roughly 30 %; the baseline value for MELs in
Energy-10 is .36 W/ft2, therefore the reduction in load would be 30 % of .36 W/ft2, or .252 W/ft2.
Additionally, Table 17 of the BA 2008 Benchmark provides a comprehensive list of residential
appliances and their annual kWh consumed. This table was consulted to determine the reduction
in MELs for the BA 2008 Best Practices home and NZEH.
Lighting
Load reduction related to changes in lighting type was calculated. The different lighting
systems implemented were incandescent, compact fluorescent and solid state lighting (SSL); also
known as light-emitting diodes (LEDs). The modeled reductions in energy consumption, as
compared to the baseline incandescent bulb, are identified in Table 3-2.
Table 3-2. Energy efficiency of lighting fixtures Baseline Lumens/Watt Lumens @ 40wIncandescent 14 560EE Type Lumens/Watt Watts to Equal Baseline EfficiencyCFL 60 9.33 76.67SSL 80 7.00 82.50
Sourced from (Green 2009) and (DOE 2008) Unit Conversion
Other metrics used in Energy-10 are not the most widely advertised units. Most HVAC
systems are advertised using the Seasonal Energy Efficiency Rating (SEER), Energy-10 requires
the efficiency of the HVAC system be expressed as Energy Efficiency Rating (EER). The BA
2008 Benchmark provides an equation for converting SEER to EER. This equation was used
and is as follows: EER = -0.02 x SEER2 + 1.12 x SEER (Hendron 2008). Another example of
67
metric mismatching relates to the tightness of the building. The metric used to determine the
tightness of homes is Air Changes per Hour at 50 Pascal’s (ACH50). This test is performed after
a residence is built and is commonly referred to as blower door testing. Energy-10 addresses
infiltration with the Air Changes per Hour (ACH) metric. The values used for the Energy-10
models were derived from two sources; the Gainesville Baseline was assigned an ACH50 value
of 6 and the BA Best Practices a value of 4.5 (McIlvaine et al. 2008); the NZEH homes
infiltration value was determined to be ACH50 of 2 (Icynene 2008). The significant reduction in
ACH50 is consequence of the Icynene wall insulation system employed. Icynene is a water
based, spray on open cell foam insulation. It has the unique ability to expand within the wall
cavity creating the tightest of envelopes. As discussed, the ACH50 values were converted to
ACH so they could be accurately calculated in Energy-10. The conversion factor for ACH50 to
ACH used was: ACH = ACH50/20 (Home Energy 2009).
Operating Conditions
Operating conditions for the energy models were derived from BA 2008 Benchmark
guidelines. The thermostat set point was compliant with the American Society of Heating,
Refrigeration, and Air-Conditioning Engineers (ASHRAE) Standard 55-1992. The BA
Benchmark identifies these values as 76 degrees Fahrenheit for cooling and 71 degrees
Fahrenheit for heating with no setup/setback period. In the case of the NZEH a setup/setback
was used. The number of occupants was determined using the equation: Number of occupants =
0.5 x Number of Bedrooms +1.5 (Hendron 2008).
Step 5: Develop the Gainesville Baseline Home in Energy-10
This work then developed the Gainesville baseline home in Energy-10. The Gainesville
baseline home has been modeled to closely match the typified construction materials and
methods used in the average home in the study area. The inputs were derived from a
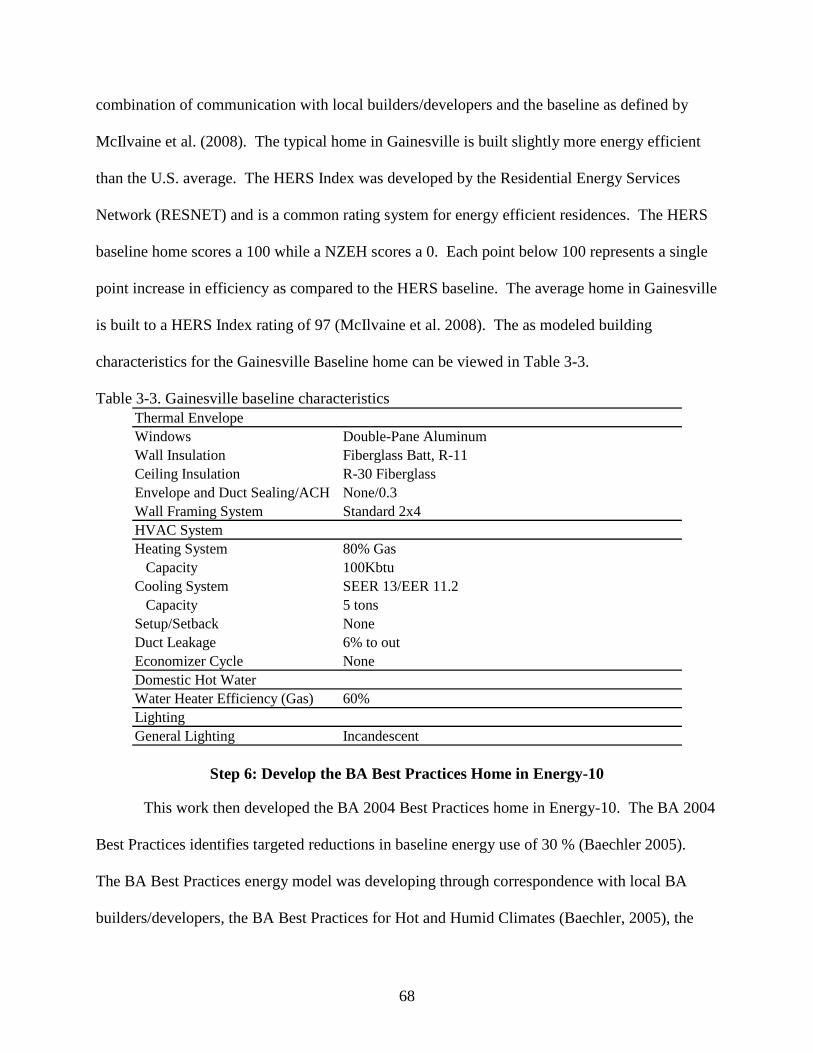
68
combination of communication with local builders/developers and the baseline as defined by
McIlvaine et al. (2008). The typical home in Gainesville is built slightly more energy efficient
than the U.S. average. The HERS Index was developed by the Residential Energy Services
Network (RESNET) and is a common rating system for energy efficient residences. The HERS
baseline home scores a 100 while a NZEH scores a 0. Each point below 100 represents a single
point increase in efficiency as compared to the HERS baseline. The average home in Gainesville
is built to a HERS Index rating of 97 (McIlvaine et al. 2008). The as modeled building
characteristics for the Gainesville Baseline home can be viewed in Table 3-3.
Table 3-3. Gainesville baseline characteristics Thermal EnvelopeWindows Double-Pane AluminumWall Insulation Fiberglass Batt, R-11Ceiling Insulation R-30 FiberglassEnvelope and Duct Sealing/ACH None/0.3Wall Framing System Standard 2x4HVAC SystemHeating System 80% Gas Capacity 100KbtuCooling System SEER 13/EER 11.2 Capacity 5 tonsSetup/Setback NoneDuct Leakage 6% to outEconomizer Cycle NoneDomestic Hot WaterWater Heater Efficiency (Gas) 60%LightingGeneral Lighting Incandescent
Step 6: Develop the BA Best Practices Home in Energy-10
This work then developed the BA 2004 Best Practices home in Energy-10. The BA 2004
Best Practices identifies targeted reductions in baseline energy use of 30 % (Baechler 2005).
The BA Best Practices energy model was developing through correspondence with local BA
builders/developers, the BA Best Practices for Hot and Humid Climates (Baechler, 2005), the

69
BA 2008 Benchmark (Hendron 2008), the BT overview (DOE 2008), and the case study by
McIlvaine et al. (2008). The Energy-10 inputs for the BA Best Practices energy model can be
viewed in Table 3-4.
Table 3-4. BA best practices characteristics Thermal EnvelopeWindows Double-Pane Vinyl Low EWall Insulation Fiberglass Batt, R-13Ceiling Insulation R-30 FiberglassEnvelope and Duct Sealing/ACH Mastic and Caulk/0.2Wall Framing System Standard 2x4HVAC SystemHeating System 93% Gas Capacity 60KbtuCooling System SEER 14/EER 11.8 Capacity 3.5 tonsSetup/Setback NoneDuct Leakage 4% to outEconomizer Cycle NoneDomestic Hot WaterWater Heater Efficiency (Gas) 83% tanklessLightingGeneral Lighting Full CFL
Step 7: Develop the NZEH in Energy-10
This work then developed the NZEH in Energy-10. The NZEH was developed to the
future goals of the BA program. Thus, the energy model was designed to achieve a 70 %
reduction in baseline energy use. The PV system was sized to accommodate the excess energy
consumed, the residual 30 %, with PVWATTS v1 software. In addition to the future goals of the
BA program, correspondence with local Near-Zero Energy Home developer Richard Schackow
and the associated Florida Solar Energy Center (FSEC 2009) case study of the home aided in
identifying the Energy-10 inputs. Sizing of the solar thermal DHW (SDHW) system was
performed in Energy-10 using their automated EE strategies. The specified target fraction of hot
water load to be met by the SDHW system was set at 80 %. A reduction of 50 % in MELs was
applied based on the replacement of all applicable appliances with Energy Star rated

70
replacements, removal of a clothes dryer, and assumed occupant commitment to an energy
efficient lifestyle. An automated lighting system was applied via the EE strategies in Energy-10.
Subsequently, daylighting evaluation was considered in the energy modeling of the NZEH. The
Energy-10 inputs for the NZEH can be viewed in Table 3-5.
Table 3-5. NZEH characteristics Thermal EnvelopeWindows Double-Pane Vinyl Low EWall Insulation Icynene 5.5" R-23Ceiling Insulation R-60 FiberglassEnvelope and Duct Sealing/ACH Mastic and Caulk/0.1Wall Framing System 2 x 6 @ 24" O.C.HVAC SystemHeating System 95% Gas Capacity 12KbtuCooling System SEER 19/EER 14.1 Capacity 2 tonsSetup/Setback Yes, 66° F and 81° FDuct Leakage 2% to outEconomizer Cycle NoneDomestic Hot WaterWater Heater Efficiency (Gas) 80% Solar Thermal DHWLightingGeneral Lighting Full SSL (LED)Automated Lighting Controls Yes, Perimeter RoomsAppliancesEnergy Star Appliances Yes, All ApplicablePhotovoltaic System7 kW DC, Installed, $8k per kW Yes
Step 8: Determine Averages Annual Energy Consumption
This work then determined each energy models average annual onsite energy
consumption. Each energy model was run four times, once for each cardinal direction. The
average for each of the schemes was calculated. The average for each respective scheme is the
number which the baseline and subsequent energy reductions were calculated from/against. In
the case of the NZEH the onsite PV system was sized accordingly using PVWATTS v1. The
system inputs for the PVWATTS v1 PV simulations can be viewed in Table 3-6. Once the

71
necessary array size was determined, the array was simulated in all four cardinal directions. The
average of the four values was calculated and used. These measures were implemented to
address the issue of non- ideal building orientation in communities. Each of the energy efficient
schemes, BA Best Practices and NZEH, were evaluated against the Gainesville Baseline.
Graphical, as well as written parameter, analysis was conducted to confirm the targeted energy
reductions were met with the employed energy efficient improvements.
Table 3-6. PVWATTS v1 inputs
City: JacksonvilleState: FL Latitude: 30.50° NLongitude: 81.70° WElevation: 9 m
DC Rating: 7.0 kWDC to AC Derate Factor: 0.75AC Rating: 5.2 kWArray Type: Fixed Tilt Array Tilt: 30.0°Array Azimuth: Varies
Cost of Electricity: 12.0 ¢/kWh
Station Identification
PV System Specifications
Energy Specifications
Step 9: Quantify the Incremental Costs
This work then identified the incremental cost of the energy efficient schemes.
Incremental cost information was gathered in a variety of ways. Information regarding the
incremental cost for the BA Best Practices was primarily sourced from McIlvaine et al. (2008).
Any cost information which was to still be determined was done so using RS Means Costworks.
Costworks is an online version of the RS Means Construction Cost Data book. The NZEH
incremental costs were primarily sourced from the FSEC report (2009). Furthermore some of
the newer efficiency measure costs, like the Icynene insulation, were sourced directly from the
products respective retailers through personal communications. Each incremental cost was
72
converted to the subsequent amortized annual cost to the homeowner and incremental cost per
square foot to construct. Builder/developer markup of 10 % was factored in. The overall
incremental cost, amortized annual cost, and cost per square foot to construct to the
builder/developer and homebuyer was determined.
Step 10: Determine Feasibility
This work then determined feasibility of the NZEC concept from the perspective of the
builder/developer. Feasibility was determined based on cost per square foot to construct to the
homebuyer, and whether or not the respective figures were within the acceptable market range.
The analysis was conducted in two stages; the first considering the raw cost to the homebuyer,
the second stage accounting for state and federal rebates available to new single-family
homebuyers. Limitations to the applicability of the rebates and incentives were discussed. A
summary was provided, conclusions formed, limitations discussed, and recommendations made.
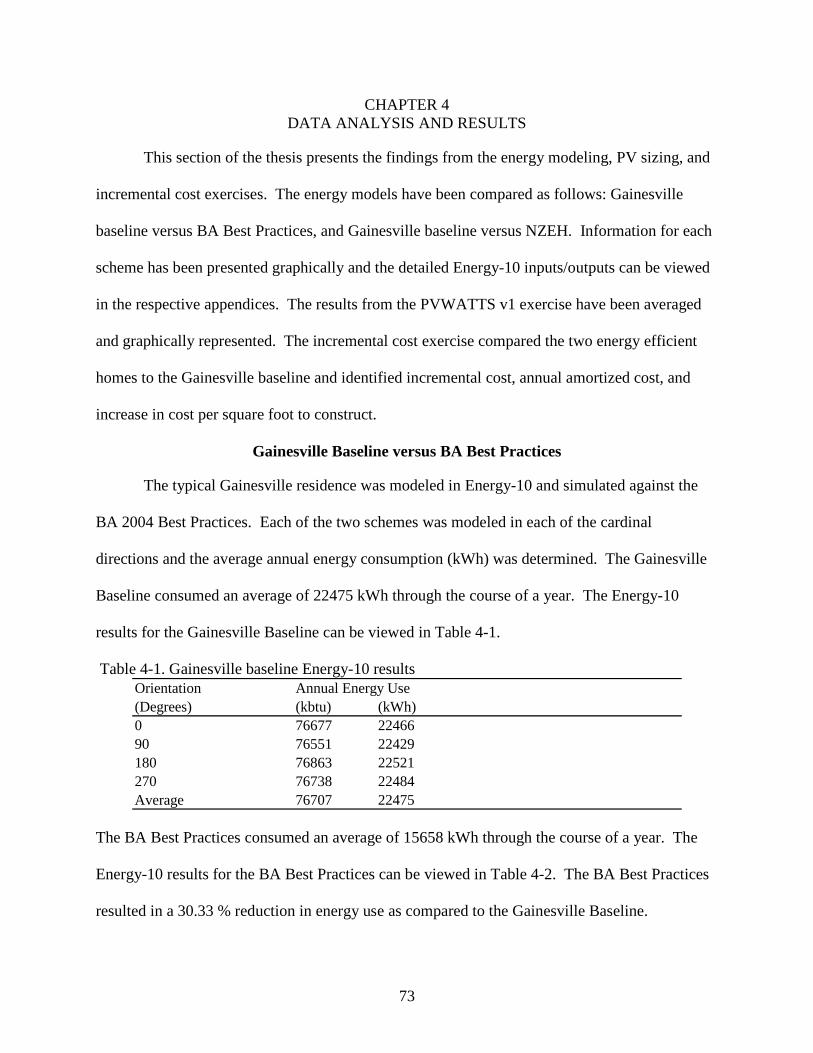
73
CHAPTER 4 DATA ANALYSIS AND RESULTS
This section of the thesis presents the findings from the energy modeling, PV sizing, and
incremental cost exercises. The energy models have been compared as follows: Gainesville
baseline versus BA Best Practices, and Gainesville baseline versus NZEH. Information for each
scheme has been presented graphically and the detailed Energy-10 inputs/outputs can be viewed
in the respective appendices. The results from the PVWATTS v1 exercise have been averaged
and graphically represented. The incremental cost exercise compared the two energy efficient
homes to the Gainesville baseline and identified incremental cost, annual amortized cost, and
increase in cost per square foot to construct.
Gainesville Baseline versus BA Best Practices
The typical Gainesville residence was modeled in Energy-10 and simulated against the
BA 2004 Best Practices. Each of the two schemes was modeled in each of the cardinal
directions and the average annual energy consumption (kWh) was determined. The Gainesville
Baseline consumed an average of 22475 kWh through the course of a year. The Energy-10
results for the Gainesville Baseline can be viewed in Table 4-1.
Table 4-1. Gainesville baseline Energy-10 results Orientation(Degrees) (kbtu) (kWh)0 76677 2246690 76551 22429180 76863 22521270 76738 22484Average 76707 22475
Annual Energy Use
The BA Best Practices consumed an average of 15658 kWh through the course of a year. The
Energy-10 results for the BA Best Practices can be viewed in Table 4-2. The BA Best Practices
resulted in a 30.33 % reduction in energy use as compared to the Gainesville Baseline.
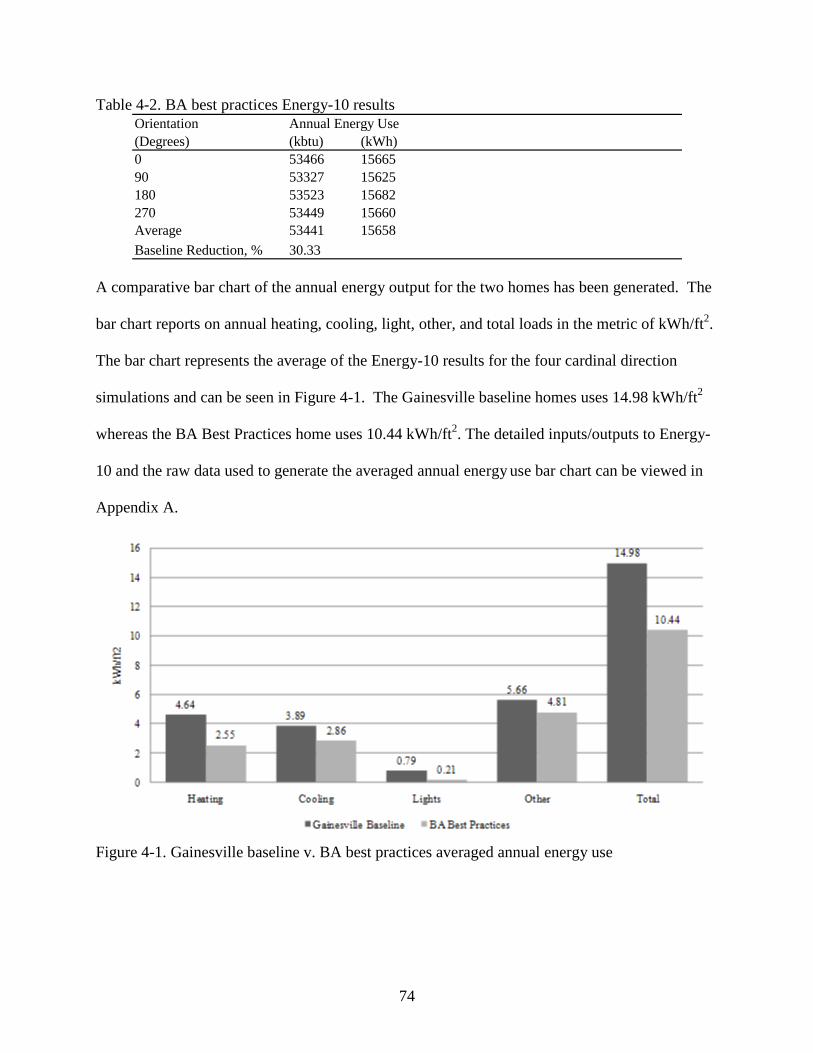
74
Table 4-2. BA best practices Energy-10 results Orientation(Degrees) (kbtu) (kWh)0 53466 1566590 53327 15625180 53523 15682270 53449 15660Average 53441 15658Baseline Reduction, %
Annual Energy Use
30.33
A comparative bar chart of the annual energy output for the two homes has been generated. The
bar chart reports on annual heating, cooling, light, other, and total loads in the metric of kWh/ft2.
The bar chart represents the average of the Energy-10 results for the four cardinal direction
simulations and can be seen in Figure 4-1. The Gainesville baseline homes uses 14.98 kWh/ft2
whereas the BA Best Practices home uses 10.44 kWh/ft2. The detailed inputs/outputs to Energy-
10 and the raw data used to generate the averaged annual energy use bar chart can be viewed in
Appendix A.
Figure 4-1. Gainesville baseline v. BA best practices averaged annual energy use
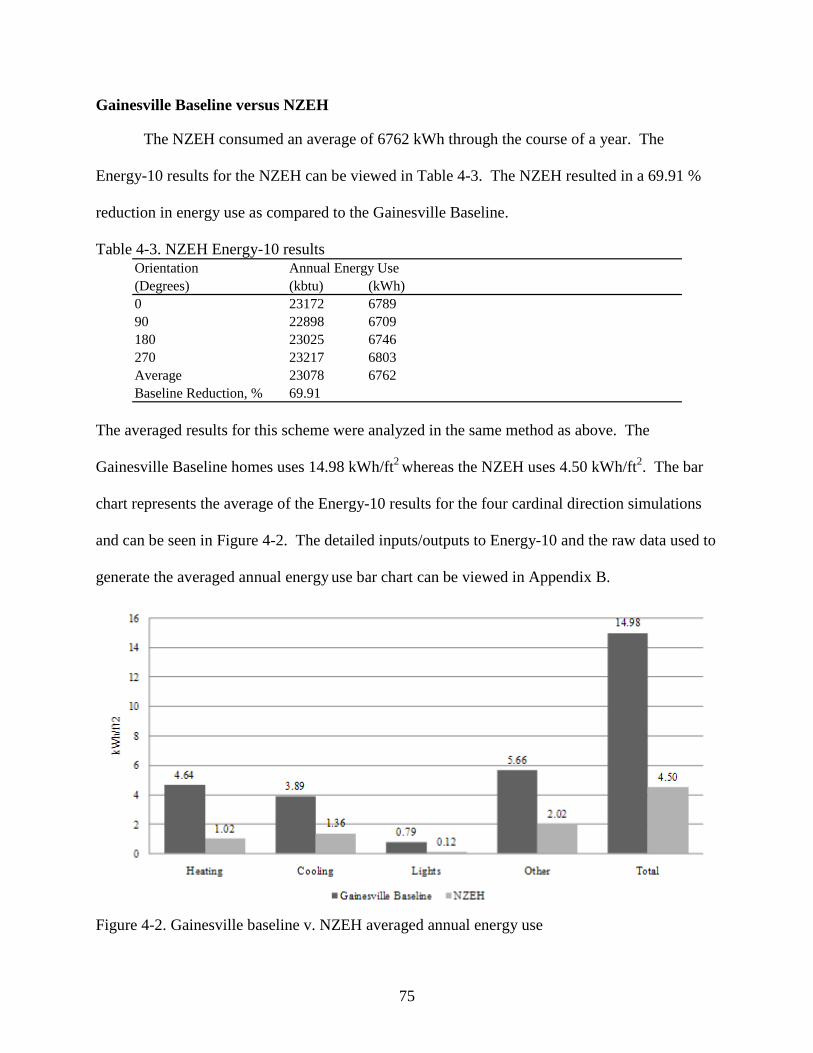
75
Gainesville Baseline versus NZEH
The NZEH consumed an average of 6762 kWh through the course of a year. The
Energy-10 results for the NZEH can be viewed in Table 4-3. The NZEH resulted in a 69.91 %
reduction in energy use as compared to the Gainesville Baseline.
Table 4-3. NZEH Energy-10 results Orientation(Degrees) (kbtu) (kWh)0 23172 678990 22898 6709180 23025 6746270 23217 6803Average 23078 6762Baseline Reduction, %
Annual Energy Use
69.91
The averaged results for this scheme were analyzed in the same method as above. The
Gainesville Baseline homes uses 14.98 kWh/ft2 whereas the NZEH uses 4.50 kWh/ft2. The bar
chart represents the average of the Energy-10 results for the four cardinal direction simulations
and can be seen in Figure 4-2. The detailed inputs/outputs to Energy-10 and the raw data used to
generate the averaged annual energy use bar chart can be viewed in Appendix B.
Figure 4-2. Gainesville baseline v. NZEH averaged annual energy use

76
Photovoltaic Sizing
As indicated above, the NZEH reduced the averaged annual energy consumption to 6762
kWh per year. The PV array for the NZEH was designed in PVWATTS v1 to accommodate this
yearly load. The array was simulated in all four cardinal directions and the averaged annual
energy production can be viewed in Table 4-4. The PV array was determined to have a
generating capacity of 7 kW DC and produces an averaged value of 7236 kWh per year.
Subsequently, the PV array will generate an averaged excess of 474 kWh per year. The detailed
simulation results from PVWATTS v1 can be viewed in Appendix C.
Table 4-4. Averaged PVWATTS v1 Simulation Data, 7 kW DC Month (kWh/m2/day) (kWh) ($)1 2.81 411 49.352 3.19 429 51.483 4.34 647 77.614 5.47 780 93.635 5.74 826 99.066 5.58 773 92.737 5.42 771 92.498 5.02 714 85.629 4.36 600 71.9410 3.64 518 62.1311 3.02 416 49.9212 2.45 353 42.3Year 4.25 7236 868.26
BA Best Practices and NZEH Incremental Costs
The incremental cost exercise identified the incremental cost, amortized annual cost, and
increase in cost to construct per square foot; comparing the Gainesville Baseline to the BA Best
Practices and the NZEH. The cost exercise generated the respective differences in cost for the
builder/developer. These raw builder/developer costs were then converted to the homebuyer
costs via a 10 % markup. Additionally, the cost exercise provided the respective cost increases
with and without accounting for rebates and incentives.

77
BA Best Practices
When comparing the Gainesville Baseline to the BA Best Practices the raw cost to the
builder/developer was as follows: a total incremental cost of $620, an amortized annual cost
increase of $49.56, and an increase in cost per square foot to construct of $0.41. The final cost
per square foot to construct for the builder was $133.14. The first cost to the homebuyer was as
follows: an increase in incremental costs of $682.00, an increase in amortized annual cost of
$54.52, and an increase in cost per square foot to construct of $0.45. The final cost per square
foot to construct to the homebuyer was $146.46.
When factoring in the applicable rebates and incentives the costs were as follows: a
decrease in incremental costs of $8,492.52, a decrease in amortized annual cost of $677.96, and a
decrease in cost per square foot to construct of $5.66. The first cost to the homebuyer for the
Gainesville Baseline home is $219,000 while the first cost for the BA Best Practices is
$219,686.50. The final cost to the homebuyer, including all rebates and incentives, for the
Gainesville Baseline home is $211,000 while the final cost for the BA Best Practices is
$211,193.98. The final cost per square foot to construct the Gainesville Baseline home was
$140.67 while the final cost per square foot to construct the BA Best Practices home was
$140.80. The detailed results of the cost exercise can be viewed in Appendix D.
NZEH
When comparing the Gainesville Baseline to the NZEH the raw cost to the
builder/developer was as follows: a total incremental cost of $73,357.60, an amortized annual
cost increase of $5862.84, and an increase in cost per square foot to construct of $48.91. The
final cost per square foot to construct for the builder was $181.64. It is important to note that
these figures represent a 70 % reduction in energy consumption and do account for the
photovoltaic array. Local developer Richard Schackow explained that when the

78
builder/developer is responsible for installing the PV array, both the builder/developer and the
homeowner are unable to receive the rebates and incentives (Schackow, personal communication
June 15, 2009). Subsequently, the first cost to the homebuyer including the PV array was as
follows: an increase in incremental costs of $80,693.36, an increase in amortized annual cost of
$6,449.12, and an increase in cost per square foot to construct of $53.80. The final cost per
square foot to construct the NZEH with PV array to the homebuyer was $199.80.
When assuming the home qualified for the rebates and incentives the costs were as
follows: an increase in incremental costs of $31,556.44, an increase in amortized annual cost of
$2,526.20, and an increase in cost per square foot to construct of $21.04. The first cost to the
homebuyer for the NZEH with PV array was $299,697.86. The final cost to the homebuyer,
including all rebates and incentives, for the NZEH with PV array is $250,560.94. The final cost
per square foot to construct the NZEH with PV array was $167.04. The detailed results of the
cost exercise can be viewed in Appendix E.
Gainesville Baseline, BA Best Practices, NZEH Comparison
Comparisons between the three homes incremental costs were generated. The
comparisons fall into two categories; builder/developer costs and homebuyer costs.
Builder/Developer Costs
There are two metrics which the builder/developer costs have been compared upon;
incremental cost and cost per square foot to construct. Figure 4-3 shows the incremental cost to
the builder/developer for each of the modeled homes. It is important to note that these
incremental costs for the NZEH include the PV array unadjusted cost. If the builder/developer
installs the PV array then the full cost is transferred to the homebuyer as the builder/developer is
unable to capitalize on the rebates and incentives. The Gainesville Baseline has no value as it is
the value being compared against.

79
Figure 4-3. Builder/developer incremental costs The cost per square foot to construct for each of the homes can be viewed in Figure 4-4. Again,
it is important to note that in the case of the NZEH this value includes the PV array raw costs.
132.73 133.14
181.64
0
20
40
60
80
100
120
140
160
180
200
Cos
t/SF
Gainesville Baseline BA Best Practices NZEH
Figure 4-4. Builder/developer cost per sf to construct
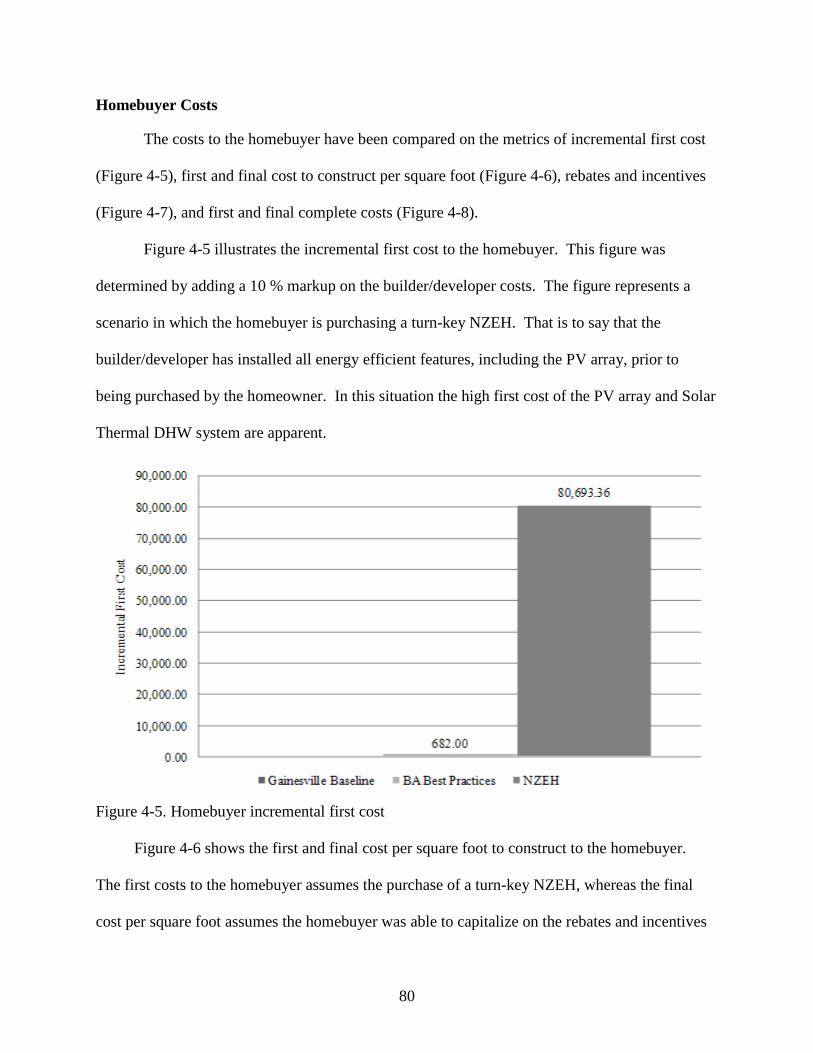
80
Homebuyer Costs
The costs to the homebuyer have been compared on the metrics of incremental first cost
(Figure 4-5), first and final cost to construct per square foot (Figure 4-6), rebates and incentives
(Figure 4-7), and first and final complete costs (Figure 4-8).
Figure 4-5 illustrates the incremental first cost to the homebuyer. This figure was
determined by adding a 10 % markup on the builder/developer costs. The figure represents a
scenario in which the homebuyer is purchasing a turn-key NZEH. That is to say that the
builder/developer has installed all energy efficient features, including the PV array, prior to
being purchased by the homeowner. In this situation the high first cost of the PV array and Solar
Thermal DHW system are apparent.
Figure 4-5. Homebuyer incremental first cost
Figure 4-6 shows the first and final cost per square foot to construct to the homebuyer.
The first costs to the homebuyer assumes the purchase of a turn-key NZEH, whereas the final
cost per square foot assumes the homebuyer was able to capitalize on the rebates and incentives
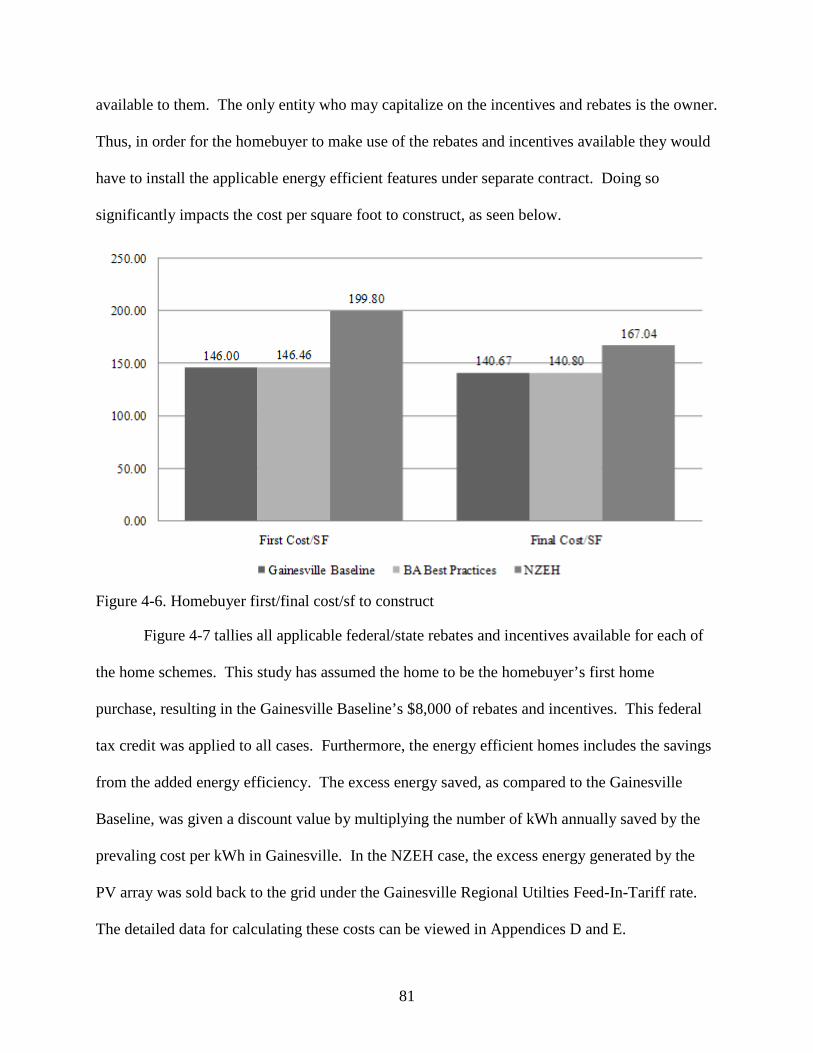
81
available to them. The only entity who may capitalize on the incentives and rebates is the owner.
Thus, in order for the homebuyer to make use of the rebates and incentives available they would
have to install the applicable energy efficient features under separate contract. Doing so
significantly impacts the cost per square foot to construct, as seen below.
Figure 4-6. Homebuyer first/final cost/sf to construct
Figure 4-7 tallies all applicable federal/state rebates and incentives available for each of
the home schemes. This study has assumed the home to be the homebuyer’s first home
purchase, resulting in the Gainesville Baseline’s $8,000 of rebates and incentives. This federal
tax credit was applied to all cases. Furthermore, the energy efficient homes includes the savings
from the added energy efficiency. The excess energy saved, as compared to the Gainesville
Baseline, was given a discount value by multiplying the number of kWh annually saved by the
prevaling cost per kWh in Gainesville. In the NZEH case, the excess energy generated by the
PV array was sold back to the grid under the Gainesville Regional Utilties Feed-In-Tariff rate.
The detailed data for calculating these costs can be viewed in Appendices D and E.
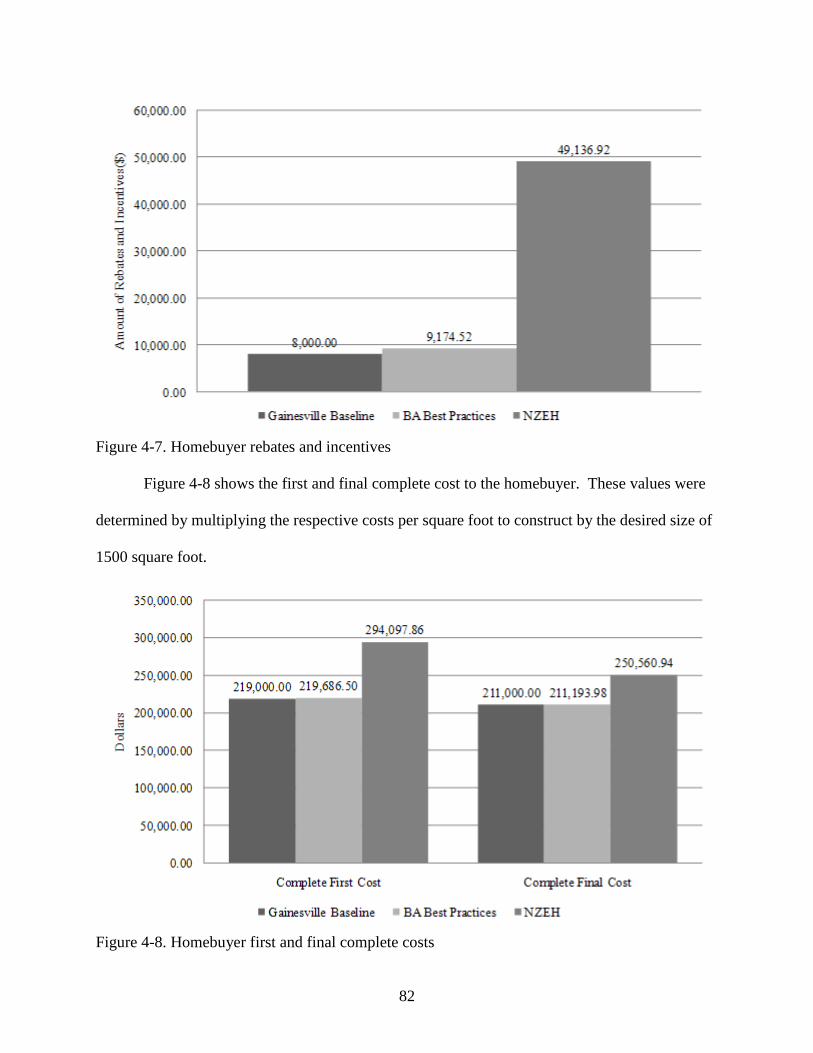
82
Figure 4-7. Homebuyer rebates and incentives
Figure 4-8 shows the first and final complete cost to the homebuyer. These values were
determined by multiplying the respective costs per square foot to construct by the desired size of
1500 square foot.
Figure 4-8. Homebuyer first and final complete costs

83
CHAPTER 5 SUMMARY, CONCLUSIONS, LIMITATIONS, AND RECOMMENDATIONS
Summary
This thesis has presented an overview of the past and present trends in energy efficient
home design. The work focused on the U.S. Department of Energy Building Technologies (BT)
and Building America (BA) programs. As stated, the BT programs overarching goal is to obtain
net-zero energy commercial buildings by 2025 and net-zero energy homes (NZEH) by 2020.
While the author acknowledged the challenge put forth by the BA program, this thesis aimed to
determine the feasibility of designing and building multiple NZEHs to create a net-zero energy
community (NZEC) in hot and humid climates. The specific location for which feasibility was
concluded is Gainesville, Florida. Gainesville was chosen for its demonstrated acceptance of
energy efficient homes and large number of BA partner builders/developers and subsequent
projects. This feasibility analysis focused on the problem statement from the perspective of the
builder/developer; ultimately can they gain an advantage in the marketplace by developing these
NZEHs and NZECs and still be able to sell them at a competitive, profitable rate. To determine
the prevailing cost per square foot to construct a new single-family home in a community of
Gainesville a market analysis was conducted. The results of the market analysis identified the
target cost of $146 per square foot to construct the new single-family homes. Furthermore, the
market analysis studied prevailing BA partner builders/developers in the area and found that
their price per square foot to construct was identical to the non BA homes. These
builders/developers have demonstrated the ability to provide, at minimum, a home which is 30 %
more efficient at no incremental cost to the homebuyer. Consequently, this thesis identified the
greater marketability and subsequent higher sales of the BA homes, as compared to a typical
Gainesville home.
84
The next phase of this work developed energy models, using the National Renewable
Energy Laboratory (NREL) Energy-10 software, which represent the typical Gainesville home, a
home built to the BA 2004 Best Practices standards, and a NZEH in the area. The reason for
developing and testing the BA 2004 Best Practices home was to validate that the program works.
The BA 2004 Best Practices identifies the means and methods to reduce energy consumption
from the baseline by 30 %. The result of the Energy-10 simulations was an averaged reduction
of about 30 %, proving that the program works from an energy perspective. Subsequently, the
NZEH was developed to future BA standards; which would result in a 70 % reduction in energy
consumption and 30 % production of energy onsite. However, the caveat of the BA program is
that the energy goals must be met at little to no incremental cost to the homebuyer.
Accordingly, the thesis then identified the incremental costs for each of the modeled
energy efficient homes. The added energy efficient features were broken down line by line and
evaluated based on incremental cost, annual amortized cost, and increase in cost per square foot
to construct. These costs were tallied and separated into the cost to the builders/developers and
cost to the homeowner; the difference being a 10 % markup by the builder/developer to the
homeowner.
Conclusions
As mentioned above, the BA 2004 Best Practices home was evaluated to determine the
effectiveness of the BA publications. The BA 2004 Best Practices manual provides the means
and methods to reduce energy consumption in a residence by 30 % with little to no incremental
cost. Incremental cost for the BA Best Practices home was determined to be $0.46 per square
foot to construct without rebates and incentives. After accounting for these savings, the BA Best
Practices home had an incremental cost per square foot to construct of $0.13. The calculated
costs and modeled energy savings confirm the validity of the BA program and Best Practices

85
publications. Moreover, this conclusion helps validate the future studies and publications of the
program by demonstrating their effectiveness. Feasibility of NZEHs and the NZEC concept will
now be discussed.
This thesis approached testing the feasibility of NZEHs and NZECs from the perspective
of the builder/developer. By approaching the problem in this manner feasibility is influenced by
more than the final cost per square foot to construct. While this metric is the primary
determining factor, a builder/developer will consider outside metrics when deciding whether or
not to pursue these advanced home concepts. Therefore, feasibility has been discussed in two
sections. First, this work has evaluated feasibility based on cost per square foot to construct the
single-family home. Cost before rebates and incentives has been evaluated as well as cost
analysis which factors in rebates and incentives; limitations relating to these savings will be
discussed. Second, this work attempted to examine feasibility from a more holistic perspective.
This analysis discussed the difficult to quantify benefits of building NZEHs and NZECs. Due to
the lack of information, the latter feasibility examination was included in the limitations section
to follow.
Financial Feasibility Analysis
First Cost Analysis
This work has documented the incremental costs of building a single-family home in a
hot and humid climate to meet the BA standards of a NZEH. BA defines a NZEH as a reduction
in baseline energy consumption of 70 % and onsite production of the excess energy used. The
incremental cost to the builder/developer to construct a home that results in a 70 % reduction in
energy is $11.57 per square foot. Factoring in the onsite photovoltaic (PV) system, the price is
increased by another $37.33. The final cost to the builder/developer to construct a NZEH is
$181.64 per square foot. Accounting for the typical builder/developer markup of 10 %, the price
86
per square foot which the builder/developer is able to market the home at is $199.80. The
market analysis for Gainesville identified an average cost per square foot to construct a new
single-family home of $146.00. Comparing the NZEH cost to the Gainesville average and BA
Best Practices, the NZEH and NZEC concept is not financially feasible at this time. The NZEH
is roughly 36 % more expensive than the Gainesville Baseline and the BA Best Practices. The
author acknowledged the fact that a premium product is often accompanied by a premium price,
the price differential is simply too significant for community scaled implementation of such a
home. However, the cost is not so high that a builder/developer may be able to implement a few
specifically targeted NZECs and be met with great success. Finding the ideal location for these
communities would require additional research.
Final Cost Analysis
Currently, significant reductions in the cost of many of the energy efficient systems
implemented can be had through federal/state rebates and other utility provider incentives.
When factoring in all applicable rebates and incentives the cost per square foot to construct the
NZEH reduces to $167.04. This cost is $26.37, or roughly 15 % greater than the reduced
Gainesville Baseline home cost per square foot to construct. Considering that many homes,
including BA partner G.W. Robinson, in communities of Gainesville sell for $165 per square
foot the reduced final price for the NZEH is feasible. A major caveat of the rebates and
incentives is that the builder/developer is not entitled to any of the savings. Subsequently, there
is no financial incentive for a builder/developer to build a turn-key NZEH. The homeowner is
the entity who can capitalize on the rebates and incentives. A shift in the politics relating to the
rebates and incentives is necessary for builders/developers to buy into the NZEH and NZEC
concept.

87
Net-Zero Energy Ready Communities
A slight twist on the concept of the NZEC could ensure its feasibility today.
Builders/developers could construct homes within the communities to achieve the BA identified
70 % energy reduction and require the homebuyer to install a PV array resulting in a minimum
of 30 % additional onsite energy within a certain timeframe. These homes would be marketed as
net-zero energy ready (NZER) and placed within net-zero energy ready communities. There are
several advantages to this proposal. First, builders/developers are able to build a home to a
HERS Index of 30 (70 % reduction) at a cost to construct per square foot of $144.30 and sell it to
a homebuyer at $158.73 per square foot. While the price increase over the baseline is not
negligible, it is reasonable and below the mentioned common price of $165 per square foot in the
area. Second, the builder/developer could tailor the lots and layout of the community to amplify
the energy savings of the employed systems. This thesis averaged the energy models results and
PV analysis from the four cardinal directions. While the energy models did not vary greatly, the
output of the PV system fluctuated significantly, correlating to exposure direction. Panels which
were modeled exposed to the South averaged roughly 60 % higher output than panels exposed to
the West. Currently, lot premiums are attached to over-sized and waterfront lots. In a NZER
community the builder/developer would be able to offer premium lots based on orientation. The
lots with a Southern exposed roof would require a smaller PV array to supplement the homes
energy use, and thus lower overall cost to the homebuyer installing the PV array. Finally, the
builder/developer could install a supplemental PV array within the community to aide in
community wide energy consumption. Ideally, this would be placed on the builder/developer
owned clubhouse; doing so would allow the builder/developer to take advantage of the
applicable rebates and incentives as they are the owner. If they builder/developer would
88
demonstrate this level of commitment to the success of the NZEC concept, they would likely
benefit from a greatly improved image and pride in ownership as well.
Limitations
This thesis was limited by a few factors. First, the metrics by which holistic feasibility
could be concluded upon are difficult to identify and quantify. Second, this work was unable to
attain quantifiable reductions in the associated cost/time reductions for developing repetitive
NZEHs to create NZECs. Third, this thesis has examined feasibility based in first cost only. The
work has not considered operation and maintenance cost, or examined feasibility from a life
cycle cost perspective. Finally, Energy-10 was discovered to have some limitations which would
have impacted the PV array sizing and ultimately feasibility itself.
Holistic Feasibility Analysis
A holistic approach toward analyzing feasibility of NZEHs and NZECs in hot and humid
climates could aide in validating the increase in cost per square foot to construct. To reiterate,
the main goal of the builder/developer is to make money. Therefore, so long as the units are
selling, regardless of price, the project is feasible to the builder/developer. For the purpose of
this thesis, the holistic feasibility analysis has been conducted examining benefits to the
builder/developer related to cost, company image, and culture of the project site.
Company image can have a significant impact on the public acceptance of said
company’s product. Consequently, by making the conscious decision to build highly energy
efficient communities, such as NZECs, the builder/developer will benefit from improved public
acceptance and perceived image. This cost is difficult to quantify but has an obvious impact on
marketability. Whether or not this improved image will be beneficial is largely dependent upon
the local culture. There are nodes throughout the United States which are more receptive to
environmentally friendly energy efficient buildings. In these areas consumers are more willing

89
to pay the premium associated with NZEHs and NZECs. The location of this feasibility analysis
represents a prime example of such a culture. As identified by Gainesville developer Richard
Schackow, Gainesville is quite accepting of energy efficient homes and communities. The level
of acceptance is difficult to quantify and requires further research. However, this work
concluded that given the culture and demonstrated historical buy-in of energy-efficient trends in
Gainesville that NZEHs, NZECs, and NZER Communities are all currently feasible.
Quantifying Material and Time Reductions when Developing NZECs
As described, the repetitive nature of building and developing communities often yields the
builder/developer reductions in the prices of materials and labor. In the beginning there is a
learning curve for workers and suppliers, however this learning curve reduces with each
successfully completed residence. Additionally, the homes are very similar, requiring many of
the same materials in known quantities. This fact allows builders/developers to order bulk
quantities of materials when erecting multiple homes in different phases of construction. It
proved very difficult to find quantifications of said reductions in time and capital. If this work
would have been able to include these savings, the feasibility of the concepts presented could
have been significantly impacted by including these discounts.
Energy-10 Limitations
Energy-10 proved to be an easy to use and effective means to model the associated energy
models. However, during the exercise some short comings of the software were discovered. The
most significant hindrance of the software was the inability to model a Solar Thermal Desiccant
Cooling System (SDCS). The literature review identified a SDCS as a means to significantly
reduce the cooling load of the residence. However, the only options for modeling HVAC
equipment were conventional varieties. Another limitation of Energy-10 identified was the
material library for assemblies. This shortcoming became apparent when attempting to model
90
the ICYNENE wall system in the NZEH. While it is possible to create your own materials and
assemblies, it requires a fair amount of technical data and expertise not commonly available to
the average user. If the next version of the software were to include these abilities the software’s
validity would be significantly improved.
Recommendations for Future Research
Several recommendations for future research have been identified. First, one of the most
valuable metrics which requires quantification is how much of a premium homebuyers are
willing to pay to own a NZEH. This information becomes even more valuable when the target
population of said research is within the area the NZEH or NZEC will be implemented in.
Second, research identifying the goals and expectations of builder/developers will prove to be
invaluable. Third, quantification of additional design fees, and subsequent additional time
allotted, is needed to accurately represent the incremental cost of NZEHs and NZECs. Fourth,
research into the development of prefabricated, modular NZEHs as a means to reduce
construction duration/cost and increase tightness/quality would prove valuable. Fifth, life cycle
costing and analysis exercises should be conducted to test the true viability of Solid State
Lighting. Additionally, the information generated from this research should be used to test
feasibility of the concepts from a life cycle cost perspective. Finally, configuration of the NZEH
envelope should be heavily studied to identify the lowest incremental cost systems which yield
the greatest performance increase. Specifically insulated slabs, which the DOE BT program has
identified as an area in which energy efficient developments are needed.
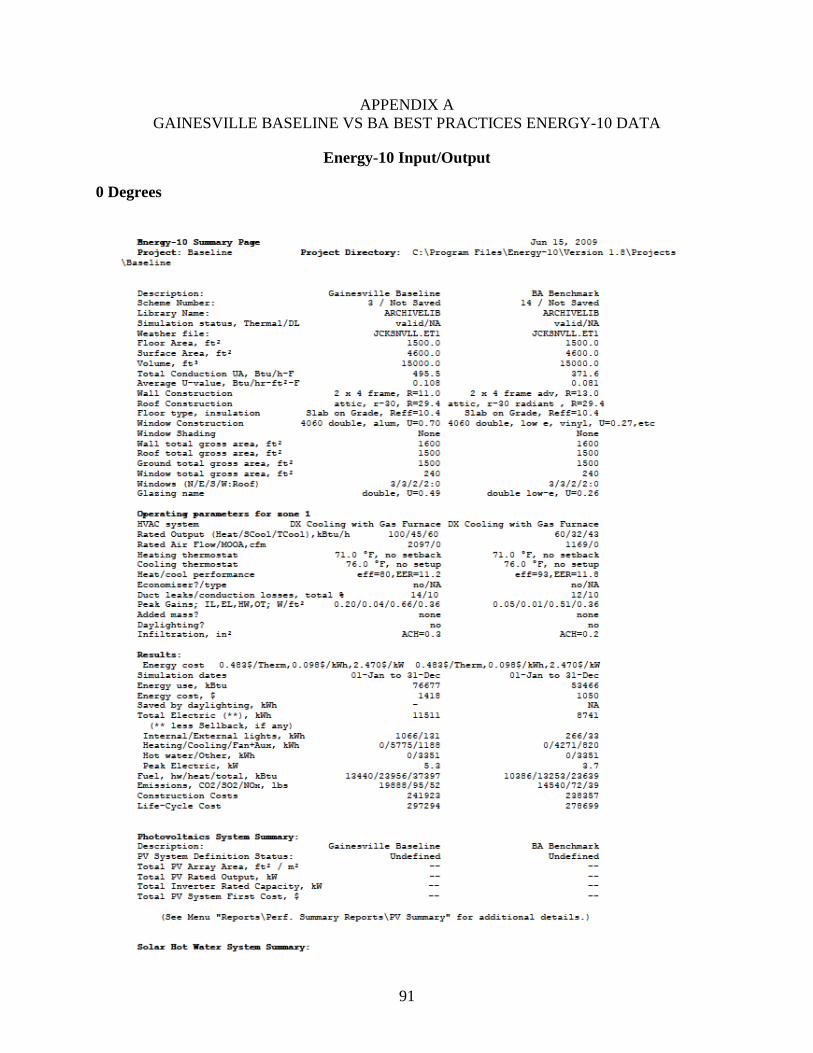
91
APPENDIX A GAINESVILLE BASELINE VS BA BEST PRACTICES ENERGY-10 DATA
Energy-10 Input/Output
0 Degrees
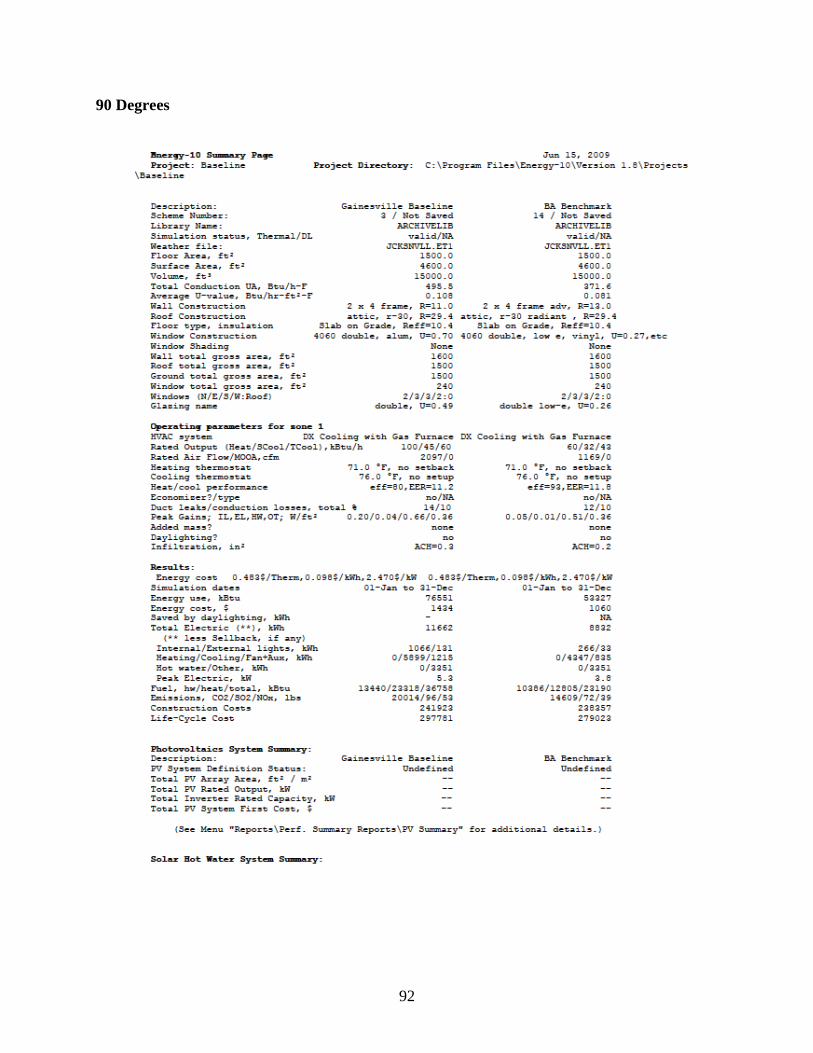
92
90 Degrees

93
180 Degrees

94
270 Degrees

95
Example Comparative Bar Chart

96
APPENDIX B GAINESVILLE BASELINE VS NZEH ENERGY-10 DATA
Energy-10 Input/Output
0 Degrees

97
90 Degrees

98
180 Degrees

99
270 Degrees

100
Example Comparative Bar Chat

101
APPENDIX C PV WATTS DATA
Solar Radiation AC Energy Energy Value Solar Radiation AC Energy Energy ValueMonth (kWh/m2/day) (kWh) ($) Month (kWh/m2/day) (kWh) ($)
1 4.27 661 79.32 1 2.86 429 51.482 4.3 599 71.88 2 3.32 453 54.363 5.41 822 98.64 3 4.43 663 79.564 6.1 878 105.36 4 5.49 778 93.365 5.84 839 100.68 5 5.75 824 98.886 5.52 762 91.44 6 5.57 767 92.047 5.45 776 93.12 7 5.27 743 89.168 5.38 768 92.16 8 4.97 704 84.489 5.14 718 86.16 9 4.36 603 72.36
10 4.81 706 84.72 10 3.63 521 62.5211 4.5 652 78.24 11 3.08 427 51.2412 3.76 577 69.24 12 2.41 348 41.76
Year 5.04 8759 1051.08 Year 4.27 7259 871.08
Solar Radiation AC Energy Energy Value Solar Radiation AC Energy Energy ValueMonth (kWh/m2/day) (kWh) ($) Month (kWh/m2/day) (kWh) ($)
1 1.26 133 15.96 1 2.83 422 50.642 1.97 231 27.72 2 3.17 433 51.963 3.14 442 53.04 3 4.38 660 79.24 4.7 665 79.8 4 5.59 800 965 5.52 803 96.36 5 5.85 836 100.326 5.57 780 93.6 6 5.67 782 93.847 5.31 762 91.44 7 5.64 802 96.248 4.58 652 78.24 8 5.16 730 87.69 3.47 464 55.68 9 4.45 613 73.56
10 2.36 303 36.36 10 3.74 541 64.9211 1.46 153 18.36 11 3.05 432 51.8412 1.1 110 13.2 12 2.54 375 45
Year 3.38 5498 659.76 Year 4.35 7425 891
Average
Month (kWh/m2/day) (kWh) ($)
1 2.81 411 49.352 3.19 429 51.483 4.34 647 77.614 5.47 780 93.635 5.74 826 99.066 5.58 773 92.737 5.42 771 92.498 5.02 714 85.629 4.36 600 71.94
10 3.64 518 62.1311 3.02 416 49.9212 2.45 353 42.3
Year 4.25 7236 868.26
7 kW Array - Southern Orientation 7 kW Array - Western Orientation
7 kW Array - Northern Orientation 7 kW Array - Eastern Orientation
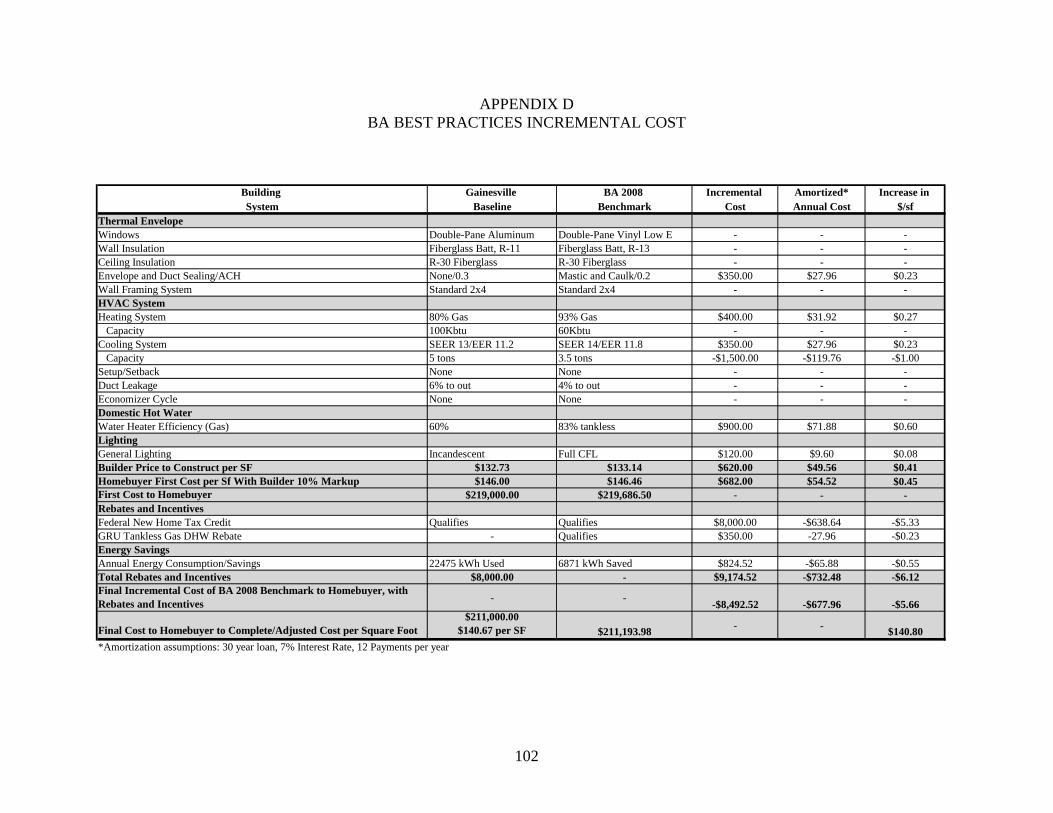
102
APPENDIX D BA BEST PRACTICES INCREMENTAL COST
Building Gainesville BA 2008 Incremental Amortized* Increase in System Baseline Benchmark Cost Annual Cost $/sf
Thermal EnvelopeWindows Double-Pane Aluminum Double-Pane Vinyl Low E - - -Wall Insulation Fiberglass Batt, R-11 Fiberglass Batt, R-13 - - -Ceiling Insulation R-30 Fiberglass R-30 Fiberglass - - -Envelope and Duct Sealing/ACH None/0.3 Mastic and Caulk/0.2 $350.00 $27.96 $0.23Wall Framing System Standard 2x4 Standard 2x4 - - -HVAC SystemHeating System 80% Gas 93% Gas $400.00 $31.92 $0.27 Capacity 100Kbtu 60Kbtu - - -Cooling System SEER 13/EER 11.2 SEER 14/EER 11.8 $350.00 $27.96 $0.23 Capacity 5 tons 3.5 tons -$1,500.00 -$119.76 -$1.00Setup/Setback None None - - -Duct Leakage 6% to out 4% to out - - -Economizer Cycle None None - - -Domestic Hot WaterWater Heater Efficiency (Gas) 60% 83% tankless $900.00 $71.88 $0.60LightingGeneral Lighting Incandescent Full CFL $120.00 $9.60 $0.08Builder Price to Construct per SF $132.73 $133.14 $620.00 $49.56 $0.41Homebuyer First Cost per Sf With Builder 10% Markup $146.00 $146.46 $682.00 $54.52 $0.45First Cost to Homebuyer $219,000.00 $219,686.50 - - -Rebates and IncentivesFederal New Home Tax Credit Qualifies Qualifies $8,000.00 -$638.64 -$5.33GRU Tankless Gas DHW Rebate - Qualifies $350.00 -27.96 -$0.23Energy SavingsAnnual Energy Consumption/Savings 22475 kWh Used 6871 kWh Saved $824.52 -$65.88 -$0.55Total Rebates and Incentives $8,000.00 - $9,174.52 -$732.48 -$6.12Final Incremental Cost of BA 2008 Benchmark to Homebuyer, with Rebates and Incentives - - -$8,492.52 -$677.96 -$5.66
Final Cost to Homebuyer to Complete/Adjusted Cost per Square Foot$211,000.00
$140.67 per SF $211,193.98 - - $140.80*Amortization assumptions: 30 year loan, 7% Interest Rate, 12 Payments per year
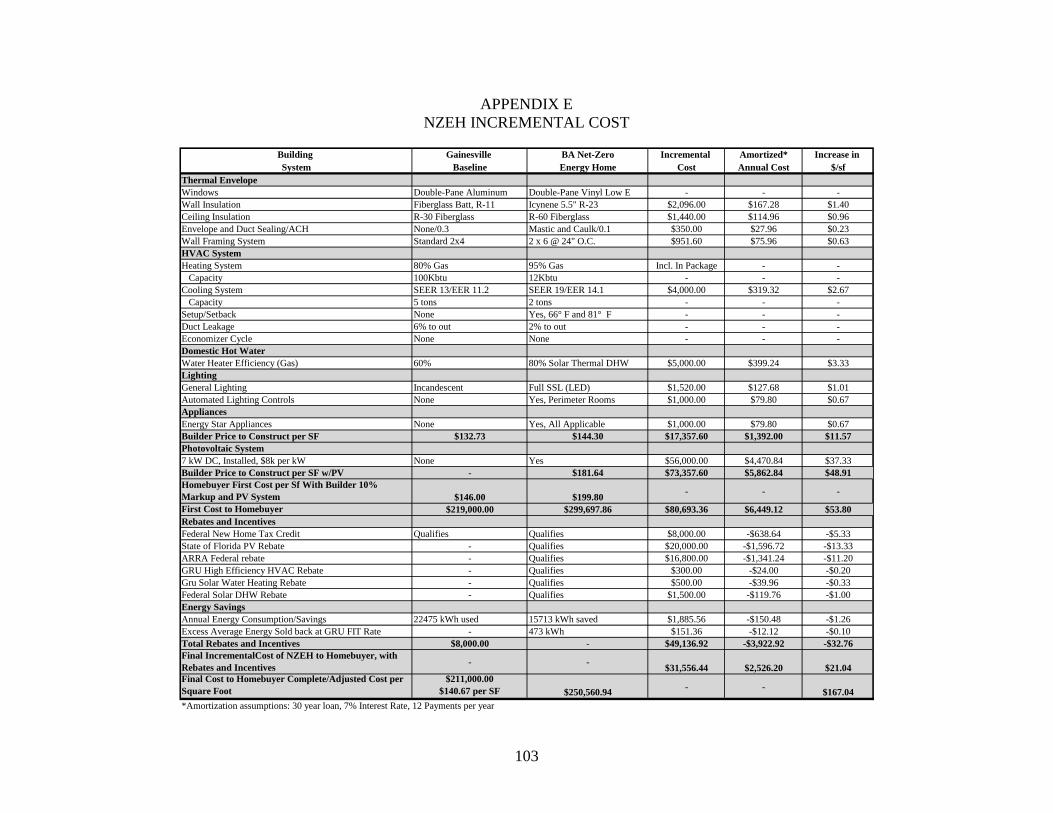
103
APPENDIX E NZEH INCREMENTAL COST
Building Gainesville BA Net-Zero Incremental Amortized* Increase in System Baseline Energy Home Cost Annual Cost $/sf
Thermal EnvelopeWindows Double-Pane Aluminum Double-Pane Vinyl Low E - - -Wall Insulation Fiberglass Batt, R-11 Icynene 5.5" R-23 $2,096.00 $167.28 $1.40Ceiling Insulation R-30 Fiberglass R-60 Fiberglass $1,440.00 $114.96 $0.96Envelope and Duct Sealing/ACH None/0.3 Mastic and Caulk/0.1 $350.00 $27.96 $0.23Wall Framing System Standard 2x4 2 x 6 @ 24" O.C. $951.60 $75.96 $0.63HVAC SystemHeating System 80% Gas 95% Gas Incl. In Package - - Capacity 100Kbtu 12Kbtu - - -Cooling System SEER 13/EER 11.2 SEER 19/EER 14.1 $4,000.00 $319.32 $2.67 Capacity 5 tons 2 tons - - -Setup/Setback None Yes, 66° F and 81° F - - -Duct Leakage 6% to out 2% to out - - -Economizer Cycle None None - - -Domestic Hot WaterWater Heater Efficiency (Gas) 60% 80% Solar Thermal DHW $5,000.00 $399.24 $3.33LightingGeneral Lighting Incandescent Full SSL (LED) $1,520.00 $127.68 $1.01Automated Lighting Controls None Yes, Perimeter Rooms $1,000.00 $79.80 $0.67AppliancesEnergy Star Appliances None Yes, All Applicable $1,000.00 $79.80 $0.67Builder Price to Construct per SF $132.73 $144.30 $17,357.60 $1,392.00 $11.57Photovoltaic System7 kW DC, Installed, $8k per kW None Yes $56,000.00 $4,470.84 $37.33Builder Price to Construct per SF w/PV - $181.64 $73,357.60 $5,862.84 $48.91Homebuyer First Cost per Sf With Builder 10% Markup and PV System $146.00 $199.80 - - -
First Cost to Homebuyer $219,000.00 $299,697.86 $80,693.36 $6,449.12 $53.80Rebates and IncentivesFederal New Home Tax Credit Qualifies Qualifies $8,000.00 -$638.64 -$5.33State of Florida PV Rebate - Qualifies $20,000.00 -$1,596.72 -$13.33ARRA Federal rebate - Qualifies $16,800.00 -$1,341.24 -$11.20GRU High Efficiency HVAC Rebate - Qualifies $300.00 -$24.00 -$0.20Gru Solar Water Heating Rebate - Qualifies $500.00 -$39.96 -$0.33Federal Solar DHW Rebate - Qualifies $1,500.00 -$119.76 -$1.00Energy SavingsAnnual Energy Consumption/Savings 22475 kWh used 15713 kWh saved $1,885.56 -$150.48 -$1.26Excess Average Energy Sold back at GRU FIT Rate - 473 kWh $151.36 -$12.12 -$0.10Total Rebates and Incentives $8,000.00 - $49,136.92 -$3,922.92 -$32.76Final IncrementalCost of NZEH to Homebuyer, with Rebates and Incentives - - $31,556.44 $2,526.20 $21.04Final Cost to Homebuyer Complete/Adjusted Cost per Square Foot
$211,000.00 $140.67 per SF $250,560.94 - - $167.04
*Amortization assumptions: 30 year loan, 7% Interest Rate, 12 Payments per year

104
LIST OF REFERENCES
Allproducts. (2009). Image Retrieved on May 30, 2009, from: http://www.allproducts.com/environment/booster/Product-200899102124-2.jpg Armistead, T. (2009). Distributed Generation: Everybody’s in Business. Engineering News- Record, June 1, 2009. Baechler, M. Love, P. (2005). Building America Best Practices Series: Volume 1. DOE. Washington, D.C. Balcomb, J.D. (1984). Passive solar research and practice. Energy and Buildings 7: p. 281-295. Balcomb, J.D. (1986). Conservation and solar guidelines. Passive Solar Journal 3: p. 221-248. Barkaszi, S. Dunlop, J. (2001). Discussion of Strategies for Mounting Photovoltaic Arrays on Rooftops in Proceedings of Solar Forum 2001 Solar Energy: The Power to Choose. Washington, D.C. Bent, D. (2008, August 23). Sustainability as core business strategy. New Strait Times, pp. 60. Biaou, A. Bernier, M. (2008). Achieving total domestic hot water production with renewable energy. Building and Environment 43, p. 651-660. Binsacca, R. (2009). Raising the Bar; Green communities are providing builders and developers with attractive economies of scale and marketing advantages. Retreived on June 14, 2009 from: http://www.ecohomemagazine.com/green-building/green-communities- provide-attractive-economies-of-scale-marketing-advantages.aspx BuildingGreen.com. (2007). Z6 House – High Performance Building Case Study. Retrieved May 28, 2009 from: http://www.buildinggreen.com.lp.hscl.ufl.edu/hpb/overview Eberly, D. A. (2008). LEED EB Case Study: Achieving Platinum and the Energy Star Label for Corporate Headquarters. Energy Engineering, 105(3), 23-37. Energy Information Administration (EIA). (2003). Arizona Case Study. Retrieved on May 21, 2009, from: http://www.repp.org/articles/static/1/binaries/Arizona%20Case%20Study.pdf Engebretson, C.D. (1964). The Use of Solar Energy for Space Heating-M.I.T. Solar House IV, in: Proceedings of the UN Conference on New Sources of Energy, vol 5. Fainelli, M. (2001). Making the business case for going green. Christian Science Monitor, 93(27), 17-19.
105
Feyka, S. Vafai, K. (2007). An investigation of a falling film desiccant dehumidification/regeneration cooling system. Heat Transfer Engineering, 28(2): 163- 172. Fischer, J., Finnell, J. (2007). Energy and Buildings. Energy Series #9. Freese, W. (2007). The Business Case for Sustainability. New Directions for Institutional Research, 134(Summer 2007), 27-35. FSEC. (2009). Preliminary Performance Evaluation of a Near Zero Energy Home in Gainesville, Florida. Retrieved on May 10, 2009 from: http://www.fsec.ucf.edu/en/publications/pdf/FSEC-CR-1792-09.pdf GLSL, Green Life Smart Life. (2009). The Cost of PV…Is There a Payback? Retrieved on June 3, 2009 from: http://greenlifesmartlife.wordpress.com/2009/02/11/the-cost-of-pvis-there- a-payback/ Goetzberger, A. (2005). Crystalline Silicon Solar Cells. Retrieved on May 26, 2009 from: http://users.ictp.trieste.it/~smr1679/Goetzberger_2.pdf Green. (2009). LED Retrofits for Conventional Light Bulbs. Retrieved on June 14, 2009 from: http://www.greenandmore.com/LED-conventional-incandescent-retrofit-lamps.html Haggard, J. Young, W. (2006). Functional Disaster Resistant Buildings. Florida Solar Energy Center. Cocoa, FL. Halliday, S. Beggs, CB. Sleigh, PA. (2000). The Potential for Solar Desiccant Cooling in the UK. Dublin. Hanes, T. (2007, July 7). First platinum house in U.S. certified last year. The Toronto Star, pp. H14. Hendron. R. (2008). Building America Research Benchmark Definition. Retrieved on May 22, 2009 from: http://apps1.eere.energy.gov/buildings/publications/pdfs/building_america/44816.pdf Hilgers, L. (2008, October 6). Interface sets the pace for going green. Plastics News. Home Energy. (2009). Infiltartion: Just ACH50 Divided by 20. Retrieved June, 14 2009, from: http://www.homeenergy.org/archive/hem.dis.anl.gov/eehem/94/940111.html Icynene. (2008). ICYNENE LD-R-50 and LEED for Homes. Retrieved on June 11, 2009, from: http://www.icynene.com/assets/documents/pdfs/ICYNENE-LD-R-50-and-LEED-for- Homes-FINAL.pdf
106
Johnson, J. (2006, October 23). DuPont’s Focus; reducing emissions, conserving water part of company’s mission. Waste News. Kalogirou, S. (2009). Thermal performance, economic and environmental life cycle analysis of thermosiphon solar water heaters. Solar Energy 83, p. 39-48. Kibert, C. J. (2002). Policy instruments for a sustainable built environment. Retrieved May 15, 2009, from: http://www.law.fsu.edu/journals/landuse/vol17_2/kibert.pdf. Mago, J. Chamra, L. Steele, G. (2006). A simulation model for the performance of a hybrid liquid desiccant system during cooling and dehumidification. International Journal of Energy Research, 30-51:66. McIlvaine, J. Chandra, S. Fonorow, K. (2008). 40% Community Case Study – G.W. Robinson Builders. DOE BA Program. Midwest Renewable Energy Association (MWRA). (2009). Solar Domestic Hot Water; Midwest Renewable Energy Association Fact Sheet. Retrieved on May 24, 2009, from: http://www.the-mrea.org/download/SolarHotWaterFactSheet.pdf North Carolina Solar Center (NCSC). (2002). Passive and Active Solar Domestic Hot Water Systems. Raleigh, N.C. Palmiter, L. (1981). Optimum conservation for northwest homes, in: Proceedings of the 6th
National Passive Solar Conference. Portland, OR. Palmiter, L., Hanford, J. (1985). Measured performance of three superinsulated homes in Montana, in Conservation in Buildings: A Northwest Perspective. National Center for Appropriate Technology. Butte, MT. Parker, D. 2009. Very low energy homes in the United States: Perspectives on performance from measured data. Energy and Buildings 41: p. 512-520. Parker, D., Dunlop, J. (1994). Solar photovoltaic air conditioning of residential buildings, in: Proceedings of the 1994 Summer Study on Energy Efficiency in Buildings. Quinn, Barbara, (2007, November 12). The business case for sustainable thinking. Pollution Engineering. REW. (2008). NREL sets thin film record. Retrieved on May 30, 2009 from: http://www.renewableenergyworld.com/rea/news/article/2008/03/nrel-sets-thin-film- record-51958 Seidi, K. (2009). Longleaf: Gainesville Real Estate Report. Retreived on June 12, 2009 from: http://www.we-promise.com/blog/?p=405
107
SERI. (1984). Passive Solar Performance Summary of 1982-1983 Class B Results. SERI/SP- 271-2362. Golden, CO. Solair. (2009). Desiccant Cooling Systems. Retrieved on May 22, 2009 from: http://www.solair-project.eu/146.0.html Solarbuzz. (2009). Solar Cell Technologies. Retrieved on June 1, 2009 from: http://www.solarbuzz.com/Technologies.htm Toolbase Services. (2009). Desiccant Cooling. Retrieved on May 24, 2009 from: http://www.toolbase.org/Technology-Inventory/HVAC/desiccant-cooling U.S. Department of Energy. (2008). Building Technologies Program: Planned Program Activities for 2008-2012. Energy Efficiency and Renewable Energy. Washington, D.C. U.S. Department of Energy. (2009a). Whole-House Approach Benefits Builders, Buyers , and the Environment. Building America Program. Washington, D.C. U.S. Department of Energy. (2009b). About Building America. Retrieved on May 19, 2009 from: http://www1.eere.energy.gov/buildings/building_america/about.html U.S. Department of Energy. (2009c). Building America Puts Residential Research Results To Work. Building America Program. Washington, D.C. U.S. Department of Energy. (2009d). Publications. Retrieved on May 17, 2009 from: http://www1.eere.energy.gov/buildings/building_america/publications.html U.S. Department of Energy. (2009e). Glossary of LED Terms. Retireved on May 18, 2009 from: http://www1.eere.energy.gov/buildings/ssl/terms.html WBCSD. (2002). The Business Case for Sustainable Development: Making a difference toward the Johannesburg Summit 2002 and Beyond. Switzerland. Yudelson, J. (2008). The Business Case for Green; with multiple benefits, green buildings make good business sense. HPAC Engineering, 80(3), 7-8.
108
BIOGRAPHICAL SKETCH
Robert Lamb graduated from Mariner High School (Cape Coral, Florida) in 2003 with
honors. From there he attended the University of Florida pursuing an undergraduate degree in
architecture. Throughout those four rigorous years, he learned a tremendous amount regarding
design. Robert received his bachelor’s degree in 2007, graduating Magna cum Laude. There is
nothing in this world he would trade those four years for; however, when the time came to
pursue graduate studies Robert made the switch to the M.E. Rinker Sr. School of Building
Construction at the University of Florida. He maintains an immense appreciation for the process,
subjectivity, and results of design, but he realized that he was not going to be the next great
architect and left it at that.
During his time in design Robert Lamb became intrigued by the emerging sustainable
building movement. Throughout his graduate studies, he has focused on the, “Green,” building
movement and how it is reshaping our built environment. Consequently, Robert obtained his
United States Green Building Council Leadership in Energy & Environmental Design
Accredited Professional credential (LEED AP) in 2009. Robert has obtained his Master of
Science in Building Construction with a concentration in sustainable construction. He hopes to
implement his passion for sustainable building and design in the construction industry
throughout his career, all the while advocating up-and-coming sustainable construction means
and methods. Robert aspires to one day return to the University of Florida for his doctorate
degree and the opportunity to profess at the college level.