analysis of migration scenarios from synchronous - aalto-yliopisto
TRANSCRIPT

Aalto University
School of Electrical Engineering
Department of Communications and Networking
Joona Mikola
Analysis of Migration Scenarios from Synchronous to
Packet Transmission in an Operator Network
Master‟s Thesis
Helsinki, May 30, 2012
Supervisor: Professor Raimo Kantola
Instructor: Seppo Kuusisto M.Sc

I
Abstract
AALTO UNIVERSITY ABSTRACT OF THE SCHOOL OF ELECTRICAL ENGINEERING MASTER‟S THESIS
Author: Joona Mikola
Title: Analysis of Migration Scenarios from Synchronous to Packet
Transmission in an Operator Network
Date: 30.05.2012 Language: English Number of pages: 8+71
Department of Communications and Networking
Professorship: Networking Technology Code: S-38
Supervisor: Prof. Raimo Kantola
Instructor: M.Sc Seppo Kuusisto
The evolution of telecommunication networks has led to a situation where the
usage of traditional fixed telecom services has been replaced with wireless and
IP-based solutions. Network operators have identified this trend and have started
to migrate their networks towards IP based Next Generation Network.
Network migration is a complicated process and requires a lot of different
analyses. Migration needs to be optimized so that the maximum revenue is
obtained during a transition process while at the same time customer satisfaction
is maintained. This thesis describes how analyses help to manage and predict
migration process effectively. Two separate analysis solutions are presented: A
tool to predict the development of customer amounts and a tool that helps to
obtain the most optimal migration order.
The overall benefits of these tools will become evident in the future when the
migration has progressed further but the first obtained results are encouraging.
During the implementation of the analyses it was identified that a more evolved
analysis platform is needed to replace Microsoft Excel currently in use.
Keywords: TDM, NGN, migration, analysis

II
Tiivistelmä
AALTO YLIOPISTO DIPLOMITYÖN
SÄHKÖTEKNIIKAN KORKEAKOULU TIIVISTELMÄ
Tekijä: Joona Mikola
Otsikko: Migraatioskenaarioiden analysointi operaattoriverkon migraatiossa
synkronisesta pakettipohjaiseen tiedonsiirtoon
Päivämäärä: 30.05.2012 Kieli: Englanti Sivumäärä: 8+71
Tietoliikenne- ja Tietoverkkotekniikan laitos
Professuuri: Tietoverkkotekniikka Koodi: S-38
Valvoja: Prof. Raimo Kantola
Ohjaaja: DI Seppo Kuusisto
Tietoliikenneverkkojen kehitys on johtanut tilanteeseen, jossa kiinteän verkon
teleliikennepalvelujen käyttöä on korvattu langattomilla ja IP-pohjaisilla
ratkaisuilla. Verkko-operaattorit ovat tunnistaneet tämän kasvavan trendin ja
ovat alkaneet muuttamaan verkkojaan IP-pohjaiseen seuraavan polven
verkkoon.
Verkkomigraatio on monimutkainen prosessi ja se vaatii paljon analyysityötä
tuekseen. Migraatio täytyy optimoida niin, että saavutetaan maksimaalinen
liikevaihto siirtymävaiheen aikana ja samalla ylläpidetään myös
asiakastyytyväisyyttä. Tämä työ tutkii miten analyysejä hyödynnetään
migraation hallinnassa ja ennustamisessa. Työssä esitellään kaksi eri
esimerkkiä analyyseistä: Analyysiratkaisu, jolla kyetään ennustamaan
liittymämäärien muutosta, sekä analyysi, jota hyödynnetään optimaalisen
migraatiojärjestyksen määrittelyssä.
Näistä analyyseistä saatava kokonaishyöty selviää vasta, kun projekti on
edennyt hieman pidemmälle, mutta alustavat tulokset ovat rohkaisevia.
Analyysejä implementoitaessa tunnistettiin tarve paremmalla
analyysityökalulle tällä hetkellä käytössä olevan Microsoft Excelin tilalle.
Avainsanat: TDM, NGN, migraatio, analyysi

III
Acknowledgements
I would like to thank my instructor Seppo Kuusisto for the support. In addition, I would like to
thank Risto Kuitunen from TeliaSonera for providing necessary information for my thesis. I
would also like to thank Raimo Kantola from Aalto University as well as my family for their
support during the writing process.
Helsinki 30.5.2012
Joona Mikola

IV
Table of Contents
Abstract .............................................................................................................................................. I
Tiivistelmä ........................................................................................................................................II
Acknowledgements ........................................................................................................................ III
Table of Contents ........................................................................................................................... IV
List of Figures and Tables ............................................................................................................. VI
List of Abbreviations ....................................................................................................................VII
1. Introduction .................................................................................................................................. 1
2. Network overview ........................................................................................................................ 3
2.1 Circuit-switched Networks vs. Packet-switched Networks ................................................ 3
2.2 Public Switched Telephone Network ................................................................................... 5
2.3 Integrated Services Digital Network .................................................................................... 6
2.4 Next Generation Network ..................................................................................................... 7
3. Technologies used in Networks ................................................................................................ 10
3.1 Time Division Multiplexing................................................................................................ 10
3.2 Plesiochronous Digital Hierarchy ....................................................................................... 13
3.3 Synchronous Digital Hierarchy........................................................................................... 15
3.3.1 STM-1 Frame................................................................................................................ 16
3.3.2 SDH Network Elements ............................................................................................... 18
3.4 TCP/IP .................................................................................................................................. 19
3.5 Metro Ethernet ..................................................................................................................... 22
3.6 Wavelength Division Multiplexing .................................................................................... 26
3.7 TDM over Packet ................................................................................................................. 26
4. Migrated Services and Their Replacements ............................................................................. 29
4.1 TDM Network Services....................................................................................................... 29
4.1.1 Plain Old Telephone Service ....................................................................................... 29

V
4.1.2 Other uses for POTS .................................................................................................... 31
4.2 NGN Services ...................................................................................................................... 32
4.2.1 Voice over IP ................................................................................................................ 32
4.2.1 Session Initiation Protocol ........................................................................................... 34
4.2.3 IPTV .............................................................................................................................. 35
4.2.4 Other NGN services ..................................................................................................... 37
4.3 Wireless replacement solutions........................................................................................... 38
5. Migration to NGN ...................................................................................................................... 40
5.1 Reasons for Network Migration ......................................................................................... 40
5.2 Different ways to migrate products .................................................................................... 44
5.2.1 Natural Migration ......................................................................................................... 44
5.2.2 Active Migration........................................................................................................... 44
5.2.3 Emulation and packing ................................................................................................. 45
6. Migration analyses ..................................................................................................................... 47
6.1 Overview of a Migration Planning Process ....................................................................... 47
6.2 Choosing the right migration Strategy ............................................................................... 50
6.3 The Practical Migration Example ....................................................................................... 52
7. Example Case 1: An Analysis Tool to Predict and Manage Future Migration Amounts ..... 55
7.1 General Description of the Tool and How It Was Built .................................................... 55
7.2 Usage in Migration Management ....................................................................................... 59
8. Example Case 2: Determining the Optimal Migration Targets............................................... 62
8.1 Network Operators Point of View ...................................................................................... 62
8.2 Service Operations Point of View and Identifying the Targets ........................................ 64
9. Conclusions ................................................................................................................................ 67
References....................................................................................................................................... 69

VI
List of Figures and Tables
Figure 1 Circuit-Switched Network ................................................................................................4
Figure 2 Packet-Switched Network.................................................................................................4
Figure 3 Traditional networks .........................................................................................................7
Figure 4 NGN Layers .......................................................................................................................8
Figure 5 TDM system ....................................................................................................................10
Figure 6 PCM system .....................................................................................................................12
Figure 7 PDH multiplexing and de-multiplexing .........................................................................14
Figure 8 STM-1 Frame Structure ..................................................................................................16
Figure 9 Terminal- and Add/Drop multiplexers ...........................................................................18
Figure 10 SDH Digital Cross-connect ..........................................................................................19
Figure 11 OSI and TCP/IP reference models ...............................................................................20
Figure 12 IP packet encapsulation ................................................................................................21
Figure 13 The Growth of Ethernet Ports.......................................................................................23
Figure 14 Metro Ethernet Network ...............................................................................................24
Figure 15 TDMoP ..........................................................................................................................27
Figure 16 IPTV subscribers ...........................................................................................................36
Figure 17 The amount of Fixed- and mobile telephone subscriptions [31-32] ..........................40
Figure 18 Change in traffic volumes [34] .....................................................................................42
Figure 19 Concentrator Packing ....................................................................................................46
Figure 20 Migration Planning Process ..........................................................................................48
Figure 21 Different Migration Strategies [Adopted from 37] .....................................................51
Figure 22 Network view ................................................................................................................53
Table 1 PDH Hierarchy levels and Data Rates ............................................................................13 Table 2 SDH hierarchy levels and data rates ................................................................................16
Table 4 IPTV subscriptions top 10 countries ...............................................................................36 Table 5 Product x subscriptions ....................................................................................................57 Table 6 Distribution of replacement solution ...............................................................................58
Table 7 ARPUs of examined products ..........................................................................................60 Table 8 Business analysis ..............................................................................................................64

VII
List of Abbreviations
AAA Advanced Access Architecture
ADM Add/Drop Multiplexers
ANSI American National Standards Institute
ARPU Average Revenue per User
AU Administrative Unit
BRI Basic Rate Interface
CAPEX Capital Expenditure
CESoPSN Structure – Aware Time Division Multiplexed (TDM) Circuit Emulation
Service over Packet Switched Network
CLASS Custom Local Area Signalling Services
CSMA/CD Carrier Sense Multiple Access/Collision Detection
CWDM Coarse Wavelength Division Multiplexing
DWDM Dense Wavelength Division Multiplexing
DXC Digital Cross Connect
ED Emulation Device
FDM Frequency Division Multiplexing
GMPLS Generalized MPLS
HDTV High Definition Television
IP Internet Protocol
IPTV IP Television
ISDN Integrated Services Digital Network
ITU-T International Telecommunication Union Telecommunication Standardization
Sector
LAN Local Area Network
MAN Metropolitan Area Network
MEF Metro Ethernet Forum
MPLS Multiprotocol Label Switching
MSOH Multiplex Section Overhead
NGN Next Generation Network

VIII
OPEX Operational Expenditure
OSI Open Systems Interconnection
PCM Pulse Code Modulation
PDH Plesiochronous Digital Hierarchy
POTS Plain Old Telephone Service
PRI Primary Rate Interface
PSTN Public Switched Telephone Network
PW Pseudowire
PWE3 Pseudowire Emulation Edge to Edge
QoS Quality of Service
RSOH Regeneration Section Overhead
SAToP Structure-agnostic transport of TDM over Packet
SDH Synchronous Digital Hierarchy
SIP Session Initiation Protocol
STM Synchronous Transport Module
TCP Transmission Control Protocol
TDM Time Division Multiplexing
TDMoP TDM over Packet
TM Terminal Multiplexer
UDP User Datagram Protocol
VC Virtual Container
VoIP Voice over IP
VPN Virtual Private Network
WAN Wide Area Network
WDM Wavelength Division Multiplexing

1
1. Introduction
Telecommunication networks have evolved rapidly during the years. Especially the
performance of mobile networks has improved and at the same time bandwidth demands are
continuously increasing. Network provider‟s goal is to maintain necessary revenue growth that
is required to sustain operator profitability in an increasingly competitive market environment.
In order to achieve these goals the operators need to modernize their networks to enable new
services and reduce costs.
Traditionally operators have two fixed network platforms working in parallel. One is a TDM-
based circuit-switched legacy network used to provide traditional telecom services like
telephony and fax. The other network in use is a packet-switched network used for the
Internet. Today it is also possible to deploy telephony services over the packet network. It is
easy to understand that maintaining two parallel platforms that offer similar services is not
economically sensible. That is why network operators are transforming their networks from
TDM to All-IP Next Generation Network (NGN). Shifting to one-platform NGN reduces costs
and simplifies network maintenance. The new network makes it also possible to implement
more advanced services that will attract customers.
Transformation from TDM to IP can be done in different ways. Some customers naturally
adopt new products but usually this natural churn is happening too slowly from the operator‟s
point of view. Some customers must be actively migrated. This process requires extensive
customer analysis and interaction which creates additional costs. Network emulation is a
technique that is used to simulate the functions of the TDM-network in an IP-network. This
can be done with specific emulation devices (ED) so that a connection is migrated to packet
without customers noticing any difference. Network emulation requires investments in EDs so
it is more economically sensible to deploy it in areas that have more connections.

2
Determining the suitable migration amounts and methods requires extensive analysis work and
a lot of co-operation between the network- and service operator. A network operator has
different preferences about migration targets than a service operator. This thesis describes
different analyses needed to maintain the most optimal migration process. Mainly the analyses
are needed to determine the yearly amounts of active migration and how that affects in
emulation amounts and vice versa. In addition to that analyses are needed to determine yearly
migration targets. That is also examined in this thesis. The goal is to achieve the most cost
efficient migration process while maintaining maximum customer satisfaction.
This thesis is divided in nine chapters. The second chapter focuses on different networks. The
main aspects of traditional and next generation networks are presented. The third chapter
focuses on the theoretical background. The most essential technologies used in traditional and
future IP-networks are also explained. This chapter should be helpful for people who have no
background knowledge in telecommunications. Different services provided by networks are
examined in the fourth chapter
The reasons and motivation for network migration are examined more thoroughly in the fifth
chapter. The chapter describes different migration methods that can be used to optimize the
technology change. The sixth chapter describes the different analyses required for migration
planning. An overview of migration analysis and planning process is given and different
migration strategies are examined. The seventh chapter focuses on an analysis tool used to
predict and optimize yearly migration amounts while the sixth chapter describes an analysis
process of how yearly migration targets are chosen.
Another case example is presented in the eight chapter: an example of how yearly migration
targets are determined. The ninth and the final chapter shortly summarize the thesis.
Conclusions about the usefulness of analyses and how the migration could be improved are
given.

3
2. Network overview
The second chapter focuses on different kinds of networks. The differences between circuit
and packet switched networks are examined. The characteristics of the circuit-switched legacy
and packet-switched Next generation networks are also examined. This chapter provides a
useful insight of the environment network migration functions in.
2.1 Circuit-switched Networks vs. Packet-switched Networks
Traditional telephone networks are circuit switched. In circuit switching a dedicated channel is
reserved for each telephone call. This channel remains open and active during the whole call
and it cannot be used by any other data or phone calls. Usually the calls are routed through
several switches that hold switching state for the call. The entire data is routed along the same
path. The dedicated circuit offers several advantages. There is no interference, connections
have a low delay and there is no need for channel sharing. The disadvantage of circuit
switching is that it is not very efficient for short flows or bursty traffic. For example during a
telephone call there are some silent moments when neither person is speaking. During this
only a very small amount or no useful data is transmitted along the circuit. The resources
remain still reserved even though no data is sent which leads to a less than optimal operation.

4
Figure 1 Circuit-Switched Network
.
In packet switching the data is broken into small packets that are sent into a network. These
packets travel in the network trying to find the best possible route to the destination. When
sending a packet a specific header containing information about its destination is added to the
packet. This header may also have sequence numbers and information about how many
packets were sent. This information enables the destination side to put the packets in the
correct order and to find out if packets are missing. If a packet doesn‟t reach its destination the
destination host can request the missing packet to be resent.
Figure 2 Packet-Switched Network

5
Packet switching allows better utilization of bandwidth compared to circuit switching. For
most of the traffic there is no need for reserved channels. Data is sent to a network when there
is something to send and during the silent periods the bandwidth is available to other users.
Packet switched networks are also cheaper and easier to expand. The disadvantages of packet
switching are potential packet losses and increased delays when there are lots of users in the
network. Because of the possibility of packets arriving out of order, packet switching is not a
very suitable solution for some data streams like real-time video. [1]
2.2 Public Switched Telephone Network
Traditional telephone networks are circuit switched. Telephone networks that have public
access are generally called Public Switched Telephone Networks (PSTN). The PSTN consist
of copper wires and optical fibres interconnected with different switches and exchanges. At
the beginning of the PSTN these switches were manually operated but today these manual
switches have been replaced by automatic electronic switches. PSTN is a global network
which is divided to smaller networks managed by different operators. These networks need to
interconnect so that their subscribers can call to subscribers using other networks.
Traditionally the PSTNs are based on TDM technology and use digital signalling. PCM is the
method used in converting an analogue signal to digital format. TDM and PCM are examined
in the next chapter. Current signalling technology in use is called Signalling System No. 7
(SS7). SS7 is an out-of-band signalling method which enables the implementing of more
advanced services.
PSTN‟s main function is to switch voice calls. It is not very suitable for data transmission
because data has different characteristics compared to voice. Data has, for example, a variable
use of the bandwidth and the need for higher transmission speeds. PSTN has also issues
concerning its flexibility. It is built on an infrastructure whereby only the vendors of the
equipment develop the applications for said equipment. At the same time deregulation has

6
increased competition and that has encouraged operators to develop new services and
applications. For that purpose a more open infrastructure, by which many vendors can provide
and develop applications is needed. [2]
2.3 Integrated Services Digital Network
Integrated Services Digital Network (ISDN) is a design for a completely digital network.
While PSTN uses digitalized switches, it doesn‟t offer the end-to-end digital connections
provided by ISDN. ISDN is a circuit-switched network system that mainly uses the same
switches and exchanges with PSTN. ISDN can also provide access to packet networks. The
main advantage of ISDN is its ability to handle different types of information, like data, audio
and video. It also provides a single interface for all devices, such as telephones, fax machines
and computers.
ISDN has two different user interfaces:
Basic Rate Interface (BRI)
Primary Rate Interface (PRI)
BRI is a 144kbps service that is separated in three channels. There are two 64kbps bearer
channels, also known as B-channels, and one 16kbps data channel, also known as D-channel.
The B-channels are used to transmit the actual data, while the confusingly named D-channel
transmits different signalling and control information. The PRI is transmitted over an E1-
carrier that has the 2048kbps transmission rate. In ISDN PRI this 2048kbps channel is divided
to 30 64kbps B-channels, one 64kbps D-channel and one 64kbps channel used for timing and
alarms. BRI is the most appropriate for individual use and for small businesses, while PRI is
mostly used only by businesses.

7
Generally ISDN can be considered to be a more evolved version of PSTN. The end-to-end
digital connection enables better quality and higher transmission speeds. One of the ISDNs
biggest attractions was its data transmission capabilities, which were more evolved, compared
to those of PSTN. For example, ISDN offered higher data rates and made it possible to access
Internet while the telephone was in use. Today in data transmission the ISDN has been mostly
superseded by broadband Internet that offers much higher rates and lower prices. [3]
2.4 Next Generation Network
The Next Generation Network (NGN) is a quite broad term. It is used to describe the
architectural change in telecommunications networks and it consists of multiple technologies
and protocols. ITU-T has created several documents where NGN characteristics are described.
The fundamental principles of the NGN are documented in ITU-T recommendation Y.2001
[4]
Figure 3 Traditional networks

8
NGN is a packet-based network, so it is ideal for data transmission. The main motivation for
NGN is the convergence of different services and networks. Data, voice and video can all be
transmitted in the same network. In NGN the service and transport levels are separated, which
means that the services are independent of transport details. This enables the service provider
to implement new services simply by defining them in the service layer, without consideration
for the underlying transport layer.
Figure 4 NGN Layers
Additional flexibility is obtained by the ability to use the services provided by NGN from
different access networks. One key requirement of NGN is to provide broadband capabilities
with end-to-end QoS and transparency. NGN must also be able to support different legacy
networks. This can be achieved with emulation, for example. Emulation is discussed later on
in this thesis.

9
Commonly the NGNs are built around the IP-protocol and that is why the term “all IP-
network” is often used around NGN. IP is the widely accepted standard for which most of the
new applications are built. This enables easier integration and interoperability between the
applications within networks. [5]

10
3. Technologies used in Networks
There are different networks and many different technologies are used in them. This chapter
focuses on these different network technologies. The services provided in the network depend
heavily on underlying technology so that is why it is important to have understanding about
that. This chapter provides about both the technologies working on older platform and newer
technologies used in the NGN.
3.1 Time Division Multiplexing
In circuit switched networks multiple transmissions need to be transferred along the same
transmission medium. Time Division Multiplexing (TDM) is used in circuit switched
networks to achieve this. TDM is a technique where the time domain is divided in slots and
these slots are allocated to different sub-channels. TDM allows multiple users to transmit data
on the same transmission medium. During the time slot the full bandwidth of the channel is
reserved to the sub-channel occupying the slot. One TDM frame consists of one timeslot per
sub-channel plus synchronization and signalling channels. TDM is widely deployed in
traditional PSTN transmission protocols, PDH and SDH, which are discussed later in this
chapter.
Figure 5 TDM system

11
The basic idea of TDM is presented in figure 5. Six different channels arrive to the multiplexer
where they are buffered. The buffer length is equal to the length of one time slot. These
buffers are then sequentially scanned so that a multiplexed data stream is formed. The de-
multiplexer receives the data stream, separates the data back to their channels and outputs it to
the correct lines.
TDM is mainly used in PSTN to multiplex digital signals. Pulse Code Modulation (PCM) is a
method where analogue signal is coded in digital format. The main idea of the PCM is to
sample the analogue signal at regular intervals and then quantize values to the nearest digital
value. In telephony each sample is represented with 8 bits, so there are 28
= 256 possible
quantization values.
In order to obtain the necessary quality for the signal, samples must be made frequently
enough. The required sampling rate for telephone calls can be derived from Nyquist Sampling
Law [6], which states that the minimum sampling rate should be twice the maximum
frequency of the signal so that the full information in the signal can be preserved. In telephony
the voice signal range is between 300-3400Hz, so the minimum sampling rate should be
6800Hz, but for practical reasons an 8000Hz sampling rate is used.
When the signals have been converted to digital format, TDM can be used to obtain larger
aggregate data streams. Currently the International Telecommunications Union (ITU) has two
standardized versions of PCM multiplexing [7]:
The 30-channel E-carrier, which is used in Europe, Asia and on international links
The 24-channel T-carrier, which is used in America and Japan.
Here we focus more on the European version. In the 30-channel multiplexing standard, the
transmission channel is represented as a time frame split in 32 time slots. The timeslots are
numbered from 0 to 31. The 8000Hz sampling rate means that the samples are taken every

12
125µs. That is also the size of the TDM time frame, while the size of the time slot is 125µs /
32 = 3.9µs.
Figure 6 PCM system
Only 30 channels from the available 32 are used to transmit speech. The channel occupying
the time slot 0 (TS0) is used to indicate the start of the frame. At the sending end, a special 8-
bit pattern called frame alignment pattern is inserted into the TS0. This pattern is used to
identify the start of the frame. At the receiving end two-frames worth of bits are picked and
the first 8 bits are checked. If the frame alignment pattern is not detected, the inspected area is
shifted by one bit and the check is redone. This process is repeated until the frame alignment
pattern is recognized. Traditionally the channel in TS16 was used to transmit signalling
information related to call control. That left channels 1-15 and 17-31 to be used in speech
transmission. If each sample is represented with 8 bits and the sampling rate is 8 kHz, the
transmission speed of a single slot is:
8 kHz * 8 bit = 64kbps
From the equation above the transmission speed C of the whole system of 32 slots can easily
be calculated:
C = 32 * 64kbps = 2048kbps.
The more popular form for C is simply to abbreviate it to „2Mbps‟. Traditionally circuit
switched digital telecommunications networks are built on these 2Mbps connections. In
addition to speech they can be used to transmit data.

13
TDM has been the leading multiplexing technology for about 30 years. Before TDM,
Frequency Division Multiplexing (FDM) was dominant. The idea of FDM is to divide the
bandwidth available into smaller parts. Each transmitting signal was attached to a certain part
of the bandwidth so that multiple users could deploy the same transmission medium. FDM
was eventually largely replaced by TDM systems that had better support for data and digital
transmission. [8-9]
3.2 Plesiochronous Digital Hierarchy
Plesiochronous Digital Hierarchy (PDH) was the first internationally standardised form of
digital higher-order multiplexing. There are both European and American standards for PDH
but here we focus on the European version. The word plesiochorous comes from the Greek
language and roughly translates to “almost synchronous”. PDH has been mostly replaced,
especially in core networks, by SDH and other more advanced technologies, but in access
networks there are still noticeable amounts of PDH-devices. In Europe PDH-systems are
based on the 30-channel PCM-multiplexing standard discussed earlier. The basic transfer rate
of PDH is therefore 2Mbps, with 30 64kbps channels used to transmit speech and two 64kbps
channels for synchronization and signalling. Alternatively the bandwidth can be used for other
purposes, for example data transfer. This first level PDH hierarchy is known as E1. Different
PDH hierarchy levels are presented in Table 1.
Table 1 PDH Hierarchy levels and Data Rates
Class No. of 64 Kbit/s Channels Actual capacity Mbit/s Nominal Capacity Mbit/s
E1 30 2.048 2
E2 120 8.448 8
E3 480 34.368 34
E4 1920 139.264 140
E5 7680 564.148 565

14
As can be seen in Table 1, there are five different PDH hierarchy levels, each with roughly 4
times higher transmission rate than the previous level. So four 2Mbps E1s are multiplexed to
form the E2 channel with a transmission rate of 8.448Mbps, four E2s for the E3 with a
transmission rate of roughly 34Mbps and so on.
PDH‟s almost synchronous nature means that different parts of the PDH system are operating
on slightly varying rates. That leads to a need to add justification and stuffing bits for each
multiplexing session. For example if we simply multiplex four 2.048Mbps E1s to E2, the E2
transmission rate should be 4 * 2.048Mbps = 8.192Mbps. The deviation from the calculated
E2 capacity (8.448Mbps) results from the addition of stuffing and justification bits.
PDH‟s multiplexing and hierarchy levels make it a rather cumbersome technology. The
existence of justification bits requires a step-by-step de-multiplexing process within the PDH-
systems. For example, in order to extract a 2Mbps E1 block from the 140Mbps E4, each stage
of de-multiplexing must be performed. At first E4 must be de-multiplexed to four E3s, then
these to E2s, and finally E2s to E1s. It is easy to understand that this is quite an inflexible
solution, which requires a huge number of devices.
Figure 7 PDH multiplexing and de-multiplexing

15
Another problem is that PDH doesn‟t have a standardised control mechanism, which means
that it can differ between manufacturers. There are some spare overhead bits that are being
used for management, but they have limited bandwidth and are hard to locate in a 140 Mbps
stream without the cumbersome de-multiplexing. Optical interfaces are also not standardized
in PDH. These are just a couple of reasons why the more flexible SDH technology was
developed. [10]
3.3 Synchronous Digital Hierarchy
The growth of network traffic and problems with PDH lead to the need for developing a new
transmission technology. For this purpose the Synchronous Digital Hierarchy (SDH) was
created. SHD was standardised by ITU and it is used globally, excluding North America. In
North America a technology called SONET, which is quite similar to SDH, is used. Actually
the American National Standards Institute (ANSI) developed SONET before SDH at the
beginning of the 1980‟s. SDH, which is strongly based on SONET but adapted to European
networks, was developed by ITU-T by the end of the 1980‟s.
The transmission data streams of SDH are called Synchronous Transport Modules (STM). The
first SDH hierarchy level is called STM-1 and its transmission rate is 155.52Mbps. SDH
hierarchy levels and their transmission rates are presented in Table 2. From the table it can
easily be seen that the transmission rates of each SDH level are exact multiples of STM-1‟s
155.52Mbps data rate.

16
Table 2 SDH hierarchy levels and data rates
Class Actual Capacity Mbit/s
STM-1 155.52
STM-4 622.08
STM-16 2488.32
STM-64 9953.28
3.3.1 STM-1 Frame
The main transport element of the SDH networks is the STM-1, so it is good to examine it
more closely.
Figure 8 STM-1 Frame Structure

17
The structure of the STM-1 frame can be seen in Figure 8. The STM-1 frame is a matrix with
9 rows and 270 columns of bytes. Each frame is repeated 8000 times in a second, so the
transmission rate is:
(9*270*8) bits * 8000/s = 155.52Mbps.
The SDH network must be capable of transmitting PDH data, so for that reason specific
containers have been defined in the SDH standard that can carry this data. PDH streams from
E1 to E4 are synchronized and then packed in these containers. The path overhead (POH)
which contains control and supervisory information, is added to the beginning of the
container. The sum of the container and POH is called a virtual container (VC). VC-4 is used
for 140Mbps E4 and VC-3 for E3, while VC-12 is used for 2 Mbps E1. VCs can be packed
into larger VCs so that VC-4 can consist of three VC-3s or 63 VC-12s. From Figure 8 the
payload of STM-1 frame can be calculated:
(9*260*8) * 8000 = 149.76Mbps
The result indicates that STM-1 frame can carry one VC-4 or three VC-3s. In addition to
payload, the STM-1 frame has two main fields: AU (administrative unit) pointer and section
overhead (SOH). AU pointer is used to specify where the payload starts. SOH has two fields:
multiplexer section overhead (MSOH) and repeater section overhead RSOH. Both contain
different control and frame synchronization information. RSOH is used by all network
elements while MSOH is accessible to every element, other than regenerators.
SDH network is divided into sections and paths. The physical network is divided into two
sections called repeater section (RS) and multiplexing section (MS), while the logical network
is divided in lower and higher-order paths. The section indicates the distance between two
network elements and the path tells us the distance between the points where VC is formed
and terminated. If VC is formed by multiplexing smaller VCs, it corresponds to a higher-order
path and if VC carries non-multiplexed flow it belongs to a lower-order path.

18
3.3.2 SDH Network Elements
Different kinds of network elements are used in SDH networks. These are regenerators,
terminal- and add/drop multiplexers (ADM) and digital cross connects. Different systems
make the SDH much more flexible than the PDH. Terminal multiplexers (TM) are located at
the end points of the SDH network and are used to multiplex and de-multiplex PDH and SDH
streams from STM-n frames. For example with TM, 63 E1 streams can be extracted from one
STM-1 frame. An ADM is a multiplexer that can add or drop single streams from STM-n.
Figure 9 Terminal- and Add/Drop multiplexers
Digital cross-connect (DXC) devices are used to rearrange different SDH connections. They
can transmit information within the SDH network and different lower-level bit streams can be
attached straight to them. With DXC the connection is set up and released by the network
operator. Generally DXCs are the largest and the most expensive SDH-elements.

19
Figure 10 SDH Digital Cross-connect
Regenerators are the least complicated elements and they are simply used to regenerate the
line signal in order to maintain acceptable signal strength. [8,10]
3.4 TCP/IP
The Internet Protocol Suite, more commonly known as TCP/IP is a set of different protocols,
applications and network media used in the Internet and similar networks. It is the most
commonly used protocol in networks today and also the majority of the traffic in next
generation networks is based on TCP/IP. Two of the most popular protocols of the set are
Transmission Control Protocol (TCP) and Internet Protocol (IP), hence the name TCP/IP.
Other protocols of this suite are for example ICMP, ARP and UDP, while the example
applications are TELNET and FTP. The Open Systems Interconnection model (OSI model) is
another way to describe network technologies and like OSI model, TCP/IP also uses different
layers of functionality. The layer architectures of OSI and TCP/IP model can be seen in Figure
11.

20
Figure 11 OSI and TCP/IP reference models
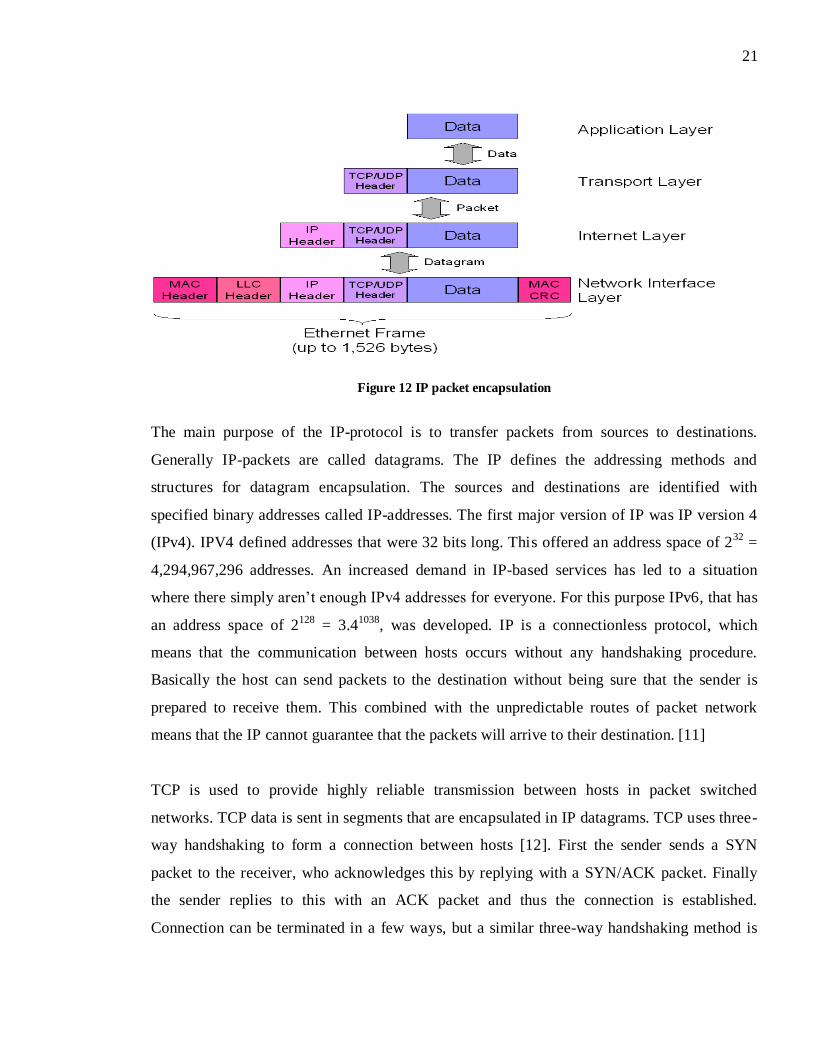
As can be seen in Figure 11, the TCP/IP model has four layers. The application layer contains
direct interaction with programs and it includes commonly known protocols such as HTTP for
web browsing and SMTP for e-mail. The transport layer is responsible of transporting data
between the application layer and the Internet. The most common transport layer protocols are
TCP and UDP. On the Internet layer IP-protocol receives packets from the transport layer,
adds data header including sending and receiving computer addresses and passes these
datagrams to the network interface. The network interface then sends these packets over the
network. Today the most important network interface layer protocol is called Ethernet, which
will be discussed later in this thesis. The basic idea of the TCP/IP architecture is that the data
is packed in packets and each packet must be processed by each layer. At each processing step
a different layer header containing different control and routing information is added to the
packet. This is called packet encapsulation. Figure 12 describes a typical encapsulation case in
TCP/IP, where data IP packet is sent to the Ethernet network using TCP.
21
Figure 12 IP packet encapsulation
The main purpose of the IP-protocol is to transfer packets from sources to destinations.
Generally IP-packets are called datagrams. The IP defines the addressing methods and
structures for datagram encapsulation. The sources and destinations are identified with
specified binary addresses called IP-addresses. The first major version of IP was IP version 4
(IPv4). IPV4 defined addresses that were 32 bits long. This offered an address space of 232
=
4,294,967,296 addresses. An increased demand in IP-based services has led to a situation
where there simply aren‟t enough IPv4 addresses for everyone. For this purpose IPv6, that has
an address space of 2128
= 3.41038
, was developed. IP is a connectionless protocol, which
means that the communication between hosts occurs without any handshaking procedure.
Basically the host can send packets to the destination without being sure that the sender is
prepared to receive them. This combined with the unpredictable routes of packet network
means that the IP cannot guarantee that the packets will arrive to their destination. [11]
TCP is used to provide highly reliable transmission between hosts in packet switched
networks. TCP data is sent in segments that are encapsulated in IP datagrams. TCP uses three-
way handshaking to form a connection between hosts [12]. First the sender sends a SYN
packet to the receiver, who acknowledges this by replying with a SYN/ACK packet. Finally
the sender replies to this with an ACK packet and thus the connection is established.
Connection can be terminated in a few ways, but a similar three-way handshaking method is

22
considered to be most common. TCP makes sure that the data is received in the right order by
attaching a sequence number to each transmitted octet. Damaged segments can be identified
with a checksum that has been added to them. In the original version of TCP, reliability is
achieved by requesting an ACK packet from the receiver for every packet sent. If this
acknowledgment is not received within the timeout interval, the data is retransmitted. This can
lead to an inefficient performance when multiple packets are lost from one window of data. In
the cumulative acknowledgement, implemented in the original version, only a single lost
packet in a window can be identified per round trip time. TCP Selective Acknowledgment
Options that was introduced in 1996 is used to counter this problem. It allows the receiving
end to acknowledge correctly received discontinuous block of packets. Flow Control and
Congestion Control are other TCP mechanisms used to counter the problems of cumulative
acknowledgements. [12-13]
UDP is a transport layer protocol, which enables applications to send data to each other
without any communications set-ups or path reservations. That means that UDP does not
provide the reliable transport TCP does. For that reason UDP is also much more of a light-
weight protocol. It is suitable for use for example in transmitting voice in an IP network,
because the three-way handshaking used in TCP would cause delays that would then hinder
voice communication. [14]
3.5 Metro Ethernet
Metro Ethernet is an Ethernet based network that covers metropolitan areas. More generally
Metro Ethernet is commonly used in access networks, so basically they are built between core
networks and customer premises. It can also be used to bridge or connect to separate enterprise
Local Area Networks (LANs).
Ethernet was developed in the beginning of the 1970‟s and it is one of the first packet-based
transmission technologies. Ethernet includes many different standards and it is constantly

23
evolving. Traditional Ethernet was based on idea where computers attached to network would
use the same transmission medium. That enabled multiple users to send packets at the same
time, and because of the shared medium, that lead to packet collisions. There is a technique
called Carrier Sense Multiple Access/Collision Detect (CSMA/CD) that is used to handle
these collisions appropriately. Today the Ethernet standards support full-duplex, which means
that a network node can transmit and receive data simultaneously. Full-duplex and different
switches have made CSMA/CD obsolete. Until recently the highest data rate supported by the
Ethernet was 10 Gbit/s, but today the possible transmission rates of the Ethernet are 40 Gbit/s
and 100 Gbit/s, which are much higher rates compared to the ones provided by traditional
TDM technologies. The Ethernet‟s lower prices and a larger number of vendors have also
made it the dominant LAN technology over Token Ring [15-16]
Figure 13 The Growth of Ethernet Ports
Metro Ethernet Forum (MEF) is a non-profit organization that is dedicated to accelerating the
adoption of carrier-class Ethernet networks and services. The main idea of a Carrier Ethernet
Service is that the network operator can provide Ethernet for a customer as a service.
Traditional Ethernet was designed for LANs, so Carrier Ethernet can be considered to be an
24
extension to Ethernet that is deployed in wide area networks (WANs) and in metropolitan area
networks (MANs). The MEF has defined service attributes and parameters for successful
implementation of Ethernet services in WANs and MANs. Three different types of services
that can be delivered through Metro Ethernet have been identified [17]:
The point-to-point service called E-Line
The multipoint-to-multipoint service called E-Lan
The Rooted-Multipoint Ethernet Virtual Connection for multicast domains called E-
TREE
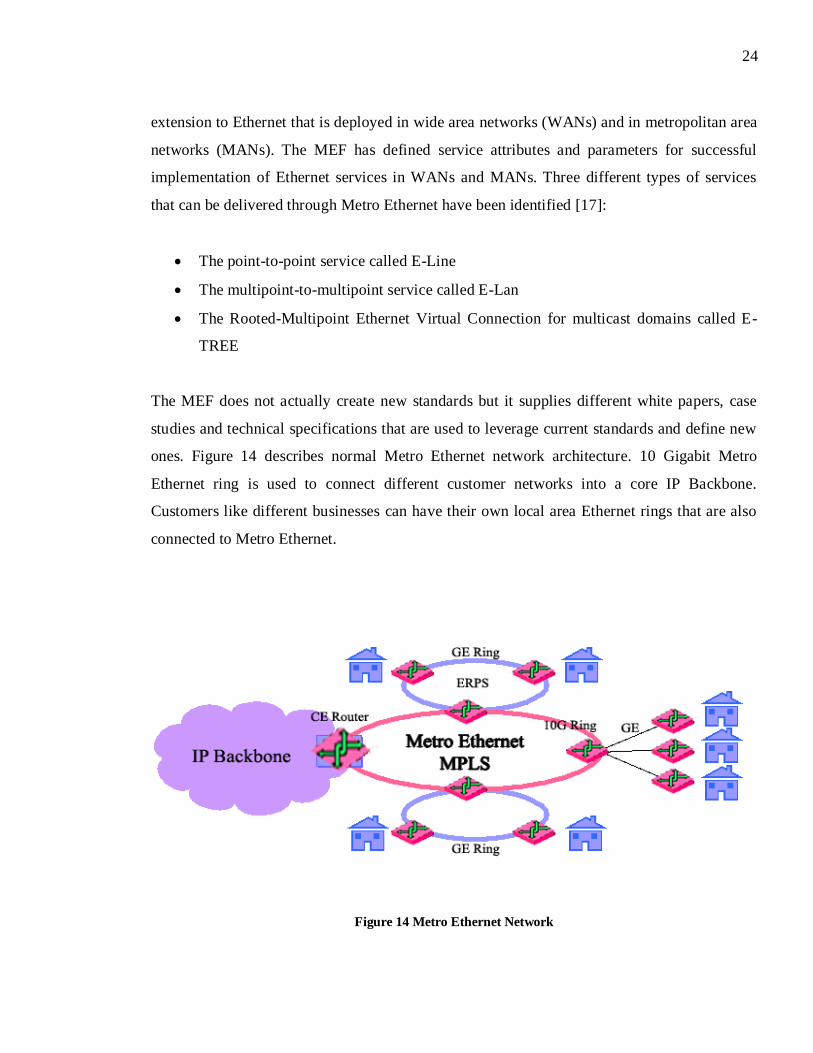
The MEF does not actually create new standards but it supplies different white papers, case
studies and technical specifications that are used to leverage current standards and define new
ones. Figure 14 describes normal Metro Ethernet network architecture. 10 Gigabit Metro
Ethernet ring is used to connect different customer networks into a core IP Backbone.
Customers like different businesses can have their own local area Ethernet rings that are also
connected to Metro Ethernet.
Figure 14 Metro Ethernet Network

25
Traditionally TDM-based technologies like SDH and PDH have been used in metropolitan
area networks. They are replaced by Ethernet because it offers much lower operational and
capital expenditures (OPEX and CAPEX). One important reason is also that packet based
traffic has overtaken all other traffic types. The main problems in Metro Ethernet networks are
that they are not as reliable as SDH networks and they can‟t offer as good end-to-end Quality
of Service (QoS) guarantees. To target these issues Metro Ethernet usually uses IP and
Multiprotocol Label Switching (MPLS)
The main function of MPLS is to route packets in networks. It supports many different
transmission protocols like ATM, Frame Relay and IP. In MPLS a label is attached to the
packets. This label has information of the next destination router of the packet, and when a
packet arrives to the router a new label indicating the next destination is added to replace the
old one. The original motivation behind MPLS was to make routers faster. It was observed
that the usage of labels enables routers to make routing decisions at a much faster rate,
because they only have to analyse the next destination of the packet, rather than perform a
complex route lookup based on the destination IP address. Later this advantage has been found
to be rather marginal.
MPLS offers advanced traffic engineering capabilities. Labels can have different priority
levels, which makes SDH-like QoS guarantees possible. This enables managing traffic
characteristics, such as who can send data, where to and what kind of data can be sent. More
importantly MPLS is totally independent of different link- and network technologies and that
allows the integration of networks with different technologies. In Metro Ethernet different
services have to be provisioned and monitored over different kinds of data and switches.
Generalized MPLS (GMPLS) is an extension of MPLS that works as a control plane in Metro
Ethernet managing mixed data and switches. [18, 26]

26
3.6 Wavelength Division Multiplexing
When traffic in the networks started to increase, new techniques to support higher
transmission capacities were needed. Wavelength Division Multiplexing (WDM) is a
technique that allows a number of channels to be sent on a single optical fibre by using
different wavelengths. WDM allows both uni- and bi-directional transmission. One downside
of WDM is that it is end-to-end technology, which means that if the fibre capacity is wanted to
be utilized in the middle of the fibre, WDM devices need to be installed there. That makes it
quite expensive to implement WDM in rural regions.
There are two different versions of WDM: Coarse Wavelength Division Multiplexing
(CWDM) and Dense Wavelength Division Multiplexing (DWDM). CWDM was originally
developed during the 1980‟s but it has been modified since then. Currently CWDM has a
channel spacing of 20nm and it uses wavelengths from 1270nm to 1610nm. DWDM was
developed in the early 1990‟s. The channel spacing in DWDM can be as small as 0,8nm and it
operates around 1550nm band. DWDM can transmit over 100 different channels on one fibre,
while with CWDM there are approximately 18 channels available. DWDM has a much higher
capacity and a bigger range than CWDM, but it is also more expensive and requires more
complex technology. For these reasons the use of DWDM limits to core networks and long-
distance connections. [19-20]
3.7 TDM over Packet
TDM over Packet (TDMoP) describes technologies that are used to emulate circuit switched
traffic like TDM E1s or STM-1s in packet network. The underlying packet network may be
based on, for example, Ethernet, MPLS or IP technology. TDMoP is an especially important

27
technology in network migration. With TDMoP virtual TDM connections are created through
the packet network. These connections are called pseudowires (PW). Figure 15 describes a
basic setup of TDMoP. Customer Edge (CE) devices CE1 and CE2 are TDM network
elements. The Provider Edge (PE) devices PE1 and PE2 are converters that convert circuit -
switched traffic to packet-switched traffic.
Figure 15 TDMoP
The simplest way to implement TDMoP is to encapsulate a E1 frame in a IP-packet by adding
appropriate header to the frame. TCP/IP would provide a reliable way for encapsulation but it
is not useful on voice transmissions because TCP resends packets that didn‟t reach the
destination. This can lead to a situation where the voice packets could arrive out of order. That
is why Real-time Transport Protocol (RTP) is more preferable in voice transmission.
Encapsulation adds a lot of overhead to the TDM traffic but that can be handled with header
compression and with the grouping of frames.
One of the main problems in TDMoP is how to obtain acceptable synchronization between
PW endpoints. A good solution is to use a separate TDM-based synchronization network.
Other options are to use GPS or to calculate synchronization information from delays between
network nodes.

28
TDMoP related standardization is done in multiple organizations but mainly in ITU-T and in
IETF (Internet Engineering Task Force). The IETF has set up a specific Pseudowire Emulation
Edge to Edge (PWE3) group for developing the architecture for service provider edge-to-edge
PWs and gathering information about different encapsulation techniques. A couple of common
TDMoP technologies implemented in networks are:
Structure-agnostic transport of TDM over Packet (SAToP).
Structure-aware Time Division Multiplexed (TDM) Circuit Emulation Service over
Packet Switched Network (CESoPSN).
SAToP protocol is used in multiplexing TDM streams like STM-1 over packet network. The
protocol disregards structures imposed on streams like the standard TDM framing. SAToP is
an ideal solution for networks where the packet network doesn‟t need to interpret the TDM
data or to participate in TDM signalling. It is often used to transmit 2G data from mobile base
stations to the network. CESoPSN is a quite similar protocol to SAToP. It is used to transmit
structured TDM data over packet network. It also improves the resilience of the circuit-
switched part of the network to effects of loss of packets occurring in the packet-switched
network. With CESoPSN it is also possible to separate for example 64 kbit/s channels from
the E1 frame. [21-22]

29
4. Migrated Services and Their Replacements
The users of the network services do not need to know what the underlying technology, in
which the service is built, is. Different networks and technologies make it possible to provide
different services. This chapter describes the most common services offered in PSTN and in
NGN. The information about different services is useful in migration management, because it
helps in determining suitable replacing solutions.
4.1 TDM Network Services
The TDM network services focused mainly on voice transmission. When the technology
evolved, many additional features were implemented in these services. Technology evolution
also made it possible to develop different usage purposes for the traditional telephone
subscription.
4.1.1 Plain Old Telephone Service
Traditional telephone service is based on a bi-directional audio channel with a frequency range
between 300–3400Hz. This allows telephone calls where both participants can speak
simultaneously. More commonly this service is called Plain Old Telephone Service (POTS).
Other basic POTS attributes are: call progressing tones, like a dial tone, and a ringing signal
and emergency number service (for example 112 in Finland). The arrival of electronic
switches in PSTN enabled including many additional services to POTS. These features can be
divided into two categories: Customer Calling Features and Custom Local Area Signalling
Services (CLASS).

30
For example the following services can be categorized as Customer Calling Features:
Call waiting
Call forwarding
Conference Calling
Call waiting is used to notify users, who are already engaged in a call, that they are receiving
an incoming call. Call forwarding, like its name implies, is used to forward calls to a different
destination. Conference calling, also known as three-way calling, enables multiple persons to
participate in a telephone conversation.
Custom calling features work basically on every phone. CLASS features on the other hand
require SS7 features in order to work. A few of the more popular CLASS Display Features are
listed below [23]:
Caller ID
Call Blocking
Call Return
Caller ID enables the calling party‟s number to be displayed at the receiving end. This requires
a device that is able to read the out-of-band signalling information that contains the number.
Call blocking allows users to specify certain numbers from which he doesn‟t want to receive
calls. These callers receive a message that their call is not accepted, while the receiving end
doesn‟t get any indication of the call. Call return is used to return a call to the most recent
caller. This returning call can be queued if the original caller is currently busy.
ISDN offers a similar service to POTS, but with some advantages. Many of the calling
features were at first only available to ISDN based telephones, but today, when the technology
has evolved, they are also possible to be implemented in PSTN. The existence of two B-
channels offers the possibility to perform simultaneous functions. The user can, for example,

31
use one 64kbps channel for Internet connection and at the same time another 64kbps channel
for speech. Overall the digital technology is considered to offer higher reliability and better
sound quality.
4.1.2 Other uses for POTS
PSTN and ISDN telephone services can be used in many purposes other than speech. One of
the more traditional uses is to utilize POTS to access Internet. A modem is used to convert IP
packets into audio frequency signals. Dial-up requires no additional hardware for the
telephone network to provide this service, thus making it the most widely available form of
Internet access. The downside of the dial-up Internet is the low transfer speed: the typical
maximum transfer speed of most modern modems is 56kbit/s, which is a much lower rate than
broadband Internet can offer.
Telephone subscription can be also used as a fax service. This can be done by connecting a
telephone number to a printer or fax machine.
Other possible usage purposes of a telephone subscription are listed below:
Alerting service (for example fire and burglar alarm)
Payment terminal
Traffic cameras
Elevator phones
Milking robots
As can be seen from the examples above, the range of potential solutions is quite wide. The
purpose for which the telephone subscription is implemented can be an important factor when
determining a replacing solution for service migration.

32
4.2 NGN Services
The convergence of different networks in NGN also enables the convergence of different
services. Triple play is the term used in telecommunications market for describing the
combined offering of three services: Television, Telephony (IP-based) and Internet. NGN
enables the offering of triple-play services over the same broadband connection. It is estimated
that currently over 80% of the revenue of incumbent operators is obtained through traditional
voice [24]. The rise of IP-telephony has increased the vulnerability of operators, and that has
encouraged them to offer bundled services including IP-telephony. Some operators have also
planned offering a quadruple-play bundle that would include mobile voice and data in addition
to normal triple play services. [25]
4.2.1 Voice over IP
Voice over IP (VoIP) is a technique for sending real-time, full-duplex voice over the Internet
or intranet. It is a digital packet based technique. In VoIP the analogue voice signal is
digitalized, encoded and then segmented into frames that are then stored into voice packets.
These packets are then sent to the network and on their way to the destination they can travel
through multiple switches and routers.
VoIP has several different advantages compared to the standard telephone services. Most of
these advantages arise from the fact that VoIP operates on top of a packet switched network
while the traditional POTS is deployed in the circuit switched PSTN. As discussed earlier, the
packet network allows better utilization of bandwidth, because it is in use only when
something is transmitted. Therefore more calls can be carried over a single link. VoIP also
creates cost savings that are obtained mostly from the better bandwidth utilization. Another
factor for creating cost savings is that VoIP requires fewer long-distance trunks between

33
switches. That enables the billing to be based on the transmitted data instead of the distance
used in the traditional service. VoIP also offers similar calling features as in POTS, like caller
ID and call forwarding. These can be implemented at minimal extra cost. It is also possible to
use an IP phone to call and receive calls from the PSTN. This can be achieved with adapters
that translate IP addresses to phone numbers and vice versa.
The disadvantages of VoIP include packet loss and delay. Packets arrive to routers from many
different sources and they are all queued for transmission over an outgoing link in the router.
When the queue is full, the arriving packet is lost in the router, because there is no place left
for it. When a lot of people are using the Internet at the same time, routers can become
congested so that packet loss occurs. Packet losses can severely damage the quality of the
voice signal. Several approaches for dealing with this problem have been presented [26]:
Upgrading the network
Silence Substitution – Substitute silence in the place of a missing packet(s)
Noise Substitution – Substitute white background noise in the place of a lost packet(s)
Repetition of Packets – The last correctly received packet is replayed in the place of a
lost packet
Interpolation of Packets
Frame Interleaving
Forward Error Correction – Packets are redundantly transmitted, so that a lost packet
can be reconstructed from the subsequent packet
Transmitting voice in a packet network has some differences compared to data transmission.
Data is considered to be delay tolerant but loss sensitive, while voice tolerates loss but is delay
sensitive. That is why UDP is used to transport voice packets instead of the more traditional

34
TCP. There are many different sources contributing to the overall delay of the VoIP
transmission. Couple of examples are listed below:
Queuing delay, which occurs in different switches and routers where voice packets are
queued behind each other to be transmitted over the same outgoing link
Propagation delay occurs in a link and is the time signals require travelling from one
point in space to another.
To summarize the VoIP, it can be said to offer the efficiency of packet-switched networks and
at the same time it rivals the voice quality of circuit-switched networks. It creates cost savings
for users and operators. One of the main reasons why VoIP hasn‟t been popular with
telecommunication operators is the operator‟s need to maintain a healthy revenue flow
obtained from the circuit-switched voice traffic. However, the rapid decrease of the PSTN
revenues has increased the offering of VoIP. There are also companies, like Skype, who offer
free VoIP calls between users. Operators need to address this situation by developing
additional features and reliability to VoIP that customers would be willing to pay for. [27]
4.2.1 Session Initiation Protocol
NGN services use many different application layer protocols. Sessions Initiation Protocol
(SIP) is one of the most important protocols and it is used in many NGN services. That is why
a short introduction to SIP is provided.
SIP is a signalling protocol used in creating, modifying and terminating multimedia sessions
where data is exchanged between participants. It is also used to invite participants to already
existing sessions. Good examples of a session are a VoIP call or a video conference over IP.
SIP itself doesn‟t carry any media data but it allows media to be added or removed from the

35
existing session. It is an application level protocol that runs on any transport protocol. Like
HTTP, SIP also uses text-based messages. These messages are divided in two categories:
request from a client to a server, or a response from a server to a client.
The five different functionalities provided by SIP are listed below [28]:
1. User Location: Determines the end system that is going to be used in a communication.
2. User Availability: Determines the willingness of the called party to engage in
communications.
3. User Capabilities: Determination of media parameters to be used.
4. Session Setup: Establishment of session parameters at both the called and the calling
party.
5. Session Management: Transfer and termination of sessions, modifying session
parameters and invoking services.
4.2.3 IPTV
IPTV is considered to be one of the main drivers of NGN deployment. It is a new potential
source of revenue for telecom operators. IPTV in itself is not a replacement solution to any
particular NGN service, but because of its importance a short overview of its characteristics is
provided.
IPTV is primarily implemented by coding picture frames to IP packets and then multicasting
them in the network. At the transport layer IPTV uses UDP instead of TCP. The reason for
this is the same as with VoIP: to reduce delays. IPTV requires a broadband connection in
order to work properly. For example a High Definition Television (HDTV) approximately
requires a 20 Mbps connection per channel and in times of channel changes about 40
Mbps/channel is required for two channel streams. In the last few years the broadband Internet

36
has become more widely available and the number of IPTV subscribers is growing steadily as
well. In 2009, estimation was that by the year 2013 there would be 115.6 million IPTV
subscribers [29].
Figure 16 IPTV subscribers
Based on the data dated 2010, Europe has the largest IPTV subscriber base, but in other
countries, especially in China and the USA, the subscription amounts have grown rapidly. In
China the subscriptions have doubled during just one year [30].
Table 3 IPTV subscriptions top 10 countries
Country 2009Q1 2010Q1
France 7 066 000 9 018 305
USA 4 171 850 6 071 898
China 2 850 000 5 750 000
South Korea 1 450 407 2 576 663
Japan 1 340 608 1 861 127
Germany 740 000 1 522 500
Hong Kong 1 140 000 1 165 000
Russia 700 000 1 117 900
Italy 790 000 825 000
Spain 711 390 825 000

37
IPTV has many advanced services and features compared to the traditional cable or terrestrial
TV. One interesting feature is time shifting, that allows users to replay, pause, and rewind TV
broadcasts. Other important feature is the Video on Demand (VOD) service, which allows
users to browse and access different videos on the Internet.
4.2.4 Other NGN services
In addition to VoIP and IPTV, NGN provides multiple different services. The actual service
portfolio depends on the service provider, and this can vary in different countries or areas.
One good example of an NGN service is the CStream service provided by TeliaSonera in
Finland. CStream offers a two-way messaging channel for different information. The
messaging channels supported are listed below:
SMS
Fax
Voice Message
To transmit information with this service, the user sends a text file containing the message
they want to send and an identification number of the receiving end (for example a phone
number, a fax number or an e-mail address). CStream then modifies this text file to the desired
format (SMS, fax page or voice message with text to speech technique) and sends it to the
receiver. The service has a web-based application where the received messages can be viewed.

38
CStream is a useful service in migration, because it can be used to replace traditional fax
services. It also enables businesses to manage their different messaging channels from the
same portal.
Before the implementation of NGN, the businesses handled their inner communications with
telephone switches. Typical products that operators offered to customers were 2 Mbps E1-
lines with ISDN PRI interface. This central line was then used to handle the company‟s
telephone calls. TeliaSonera offers a service called Sonera Office Communications to replace
2 Mbps E1s used by businesses. Sonera Office Communications offers a common platform for
all real-time messaging like voice calls, meetings, content sharing and instant messaging.
VoIP is used to provide voice calls in this service. There are also additional features, like
information about users present in the network. The Sonera Office Communications service
can be used with computers, laptops or with certain mobile devices.
These were just a few examples of different services enabled by the emergence of NGN. There
is a constant process going on to create new services and further improve the existing
products.
4.3 Wireless replacement solutions
This thesis mainly focuses on how the TDM network services are migrated into the fixed IP-
network. There are also situations in which a sufficient IP-product is not available, for
example when the whole wire network is replaced. In some cases it is more cost efficient and
practical to replace a TDM service with a wireless solution. That is why a short introduction of
different wireless services, used in replacing TDM services, is provided.
Probably the simplest example is to provide a traditional mobile phone subscription to replace
the POTS connection. Mobile phones have acceptable voice quality and provide additional
mobility compared to the POTS. The downside of this solution is that customers need to

39
change their telephone numbers because of the different numbering schemes between fixed-
and mobile networks.
TeliaSonera has implemented a service called Home Number, where the connection is based
on a mobile technology, but customers can still have their old telephone number. Basically
every Home Number subscription really has a mobile number but a network server converts it
to a traditional telephone number. Customers can use this subscription with a mobile phone or
with a phone that resembles a traditional landline phone. The drawback of this solution is that
it isn‟t suitable for all of the services the POTS were able to provide. For example a fax
service or a payment terminal can‟t be implemented with Home Number.
TeliaSonera has also developed a wireless replacement for telephone switches. Sonera Mobile
Centrex service offers a similar service to the traditional TDM switches. The only difference is
that it is implemented in a wireless environment. Between 5 and 200 mobile subscriptions can
be connected to the Mobile Centrex.

40
5. Migration to NGN
This chapter examines different reasons that why network migration must be done. The
reasons range from the decreased usage of traditional telephone services to increased usage of
data services. Migration can be done in different ways and these rely heavily on each other.
These different implementations are also described in this chapter.
5.1 Reasons for Network Migration
The network examined in this thesis was originally built to accommodate more than one
million telephone customers. During the last two decades, the mobile technology has evolved
rapidly, and that has led to a decrease in the usage of traditional telephone networks. Because
of that, the utilization levels of TDM equipment, like concentrators and switches, have also
decreased. That has led to decreasing profits.
Figure 17 The amount of Fixed- and mobile telephone subscriptions [31-32]
01 000 0002 000 0003 000 0004 000 0005 000 0006 000 0007 000 0008 000 0009 000 000
10 000 000
Jan
uar
y-Ju
ne
July
-Dec
embe
r
Jan
uar
y-Ju
ne
July
-Dec
embe
r
Jan
uar
y-Ju
ne
July
-Dec
embe
r
Jan
uary
-Ju
ne
July
-Dec
embe
r
Jan
uary
-Ju
ne
July
-Dec
embe
r
Jan
uary
-Ju
ne
20062006200720072008200820092009201020102011
Sub
scri
pti
on
s
Mobile Subscriptions
Fixed TelephoneSubscriptions

41
Natural churn away from the traditional voice services is continuing, so today the utilization
rate of some concentrators is as low as 1%. It is estimated that with natural churn the
migration from TDM to IP would be completed in approximately 2030. It is easy to
understand that maintaining a network part with a utilization rate of 1% isn‟t economically
viable. That is why the telecom operators must participate actively in order to speed up the
network migration.
Finland is a very sparsely populated country. Population density is only 16 persons per km2,
which is the third-lowest population density of any European country. The population is also
distributed very unevenly, with the majority of population concentrated on the south-western
coastal areas [33]. Because of this uneven distribution, it isn‟t always economically sensible to
maintain fixed copper lines in the more sparsely populated regions. The data has to travel long
distances along the wires, which leads to an increased signal attenuation and decreasing data
rates. In these more rural areas wireless networks can be deployed to offer a service similar to
copper lines. The GSM coverage in Finland is close to 100%, so the traditional telephone
services can be replaced by similar mobile services almost everywhere. The third generation
(3G) mobile network, which can offer data rates of up to 6 Mbps, is constantly expanded and
it can be used to replace ADSL-connections. There is also a possibility to replace fixed-line
wires used in ADSL-connections with a satellite based service.
Removal of the fixed network in rural regions also creates different cost benefits. There are
hundreds of thousands of poles in Finland to which these copper wires are attached. These air-
cables are very vulnerable against different environmental conditions, like heavy snow or
falling trees. Repairing of the damages caused by the bad weather can be quite difficult and
expensive, because the repairing teams have to travel long distances and the wires go through
difficult terrain. The poles also suffer and rot during the years. On average, the poles must be
changed every 40 years, and replacing all the poles would be a massive investment. Today,
when the wireless networks offer practically equal service levels compared to the wired
networks, it is no longer profitable to invest in the new poles replacing the old ones.

42
In more densely populated regions where the majority of cables have been dug into the
ground, it is more practical to replace PDH and SDH connections with switching and routing
equipment enabled to handle the packet traffic. Traditionally the major part of the traffic in the
networks has been voice. The voice traffic has also created the majority of profits for network
operators. In the 1990‟s when the Internet became more popular, the amount of data traffic in
the network started to increase exponentially and this trend is still continuing today. This is
happening around the world. For example, Figure 18 shows how the amount of network
traffic has grown in North America and how it is predicted to grow in the next few years.
Figure 18 Change in traffic volumes [34]
In Figure 18 it can be seen that the traffic from the different fibre-based advanced access
architecture (AAA) lines is the main source of traffic increase. The yellow-blue line indicates
growth of the High-speed (H-S) access lines like xDSL and Cable Modems. The growth in
there is much more moderate compared to the AAA traffic. Figure 18 indicates that Internet

43
traffic from mobile devices surpasses the traffic amount of the H-S lines in 2015. The Dial-Up
Access Traffic continues to remain close to zero. There have been many other studies that
have predicted similar increase in the Internet traffic. For example a recent Cisco white paper
[35] indicated that the global IP-traffic has increased eightfold between the years 2005 and
2010 and the prediction is that the annual growth rate of IP traffic from 2010 to 2015 is going
to be 32%.
TDM-based services like PDH and SDH were originally designed to transmit voice. SDH
especially has been improved to also transfer data, but still the Ethernet based solutions offer
lower costs and better performance. This is why network operators have built a separate
network for data in parallel with the traditional TDM network. Both networks create discrete
maintenance and monitoring costs. NGN provides technological improvements that allow
convergence of different networks, so that voice, data and video can all be transferred on the
same platform. Combining of the separate networks reduces the capital and operative expenses
that were related to the maintaining and managing of the different networks. NGN makes it
possible to deploy new more advanced services like video conferencing and Virtual Private
Networks (VPNs), which allow organizations to combine their existing private networks with
the portions of PSTN. These new services help network operators to create more profit to
compensate for the decrease of profits in the traditional voice. They can also be implemented
quite rapidly, which reduces the time to market and the life-cycle costs of offering new
services [36].
The different network element providers have also recognized the changing environment.
Most of the manufacturers are planning to or have already stopped the manufacturing of TDM
network elements. This has led to a situation where it is hard to find enough spare parts to
maintain the TDM network. The vendor specific support for the TDM devices also isn‟t
always available anymore. In Finland there is a situation where the majority of the current
network engineers are approaching retirement in the next few years. Today the education
focuses on packet-based networks, so TDM knowledge is slowly beginning to disappear.

44
5.2 Different ways to migrate products
5.2.1 Natural Migration
In this context natural migration is used to describe a situation where customers independently
terminate their fixed-line telephone subscriptions. In an ideal situation they would also
subscribe to a new IP-based service, even though today people generally only have a mobile
telephone subscription. The good thing about natural migration is that it doesn‟t require any
investments from the network operator. Operators can still encourage natural migration with
different marketing campaigns and price reductions. The problem with natural migration is
that it is difficult to control and predict. It also happens randomly around the network, so that
in the end multiple network areas could exist, where only a few customers remain. A
spreadsheet tool presented in Chapter 7 was developed to help with predicting natural
migration. When considering the economic aspects and availability of spare parts, natural
migration is happening too slowly.
5.2.2 Active Migration
Targets of active migration are to maintain a high customer satisfaction level and to migrate
their TDM based solutions to IP or wireless solutions. In active customer migration each
customer within a target area is contacted and notified about the network migration. Contact
persons assigned to the migration project then interact with a customer to find the best
possible solution to migrate the customer‟s connections. When doing an active migration a
detailed analysis about the customers and their subscriptions are needed. These analyses and
customer contacts generate additional expenses and create the need of personnel dedicated to
the project. That is why active migration focuses on network areas with a small amount of
customers. It is preferable to maintain the yearly active migration rate at the same level, so that

45
the same experienced personnel can handle the contacting-replacement-dismantling process
during the whole project. If the active migration levels suddenly increase, new employees
need to be hired and trained. This can cause problems if the migration amounts return back to
the previous level. The active customer migration levels can be controlled with emulation.
5.2.3 Emulation and packing
A technique where TDM-traffic is transmitted through the IP-network is called network
emulation. In emulation the end points of the data traffic use TDM, while in the middle of the
connection the data stream is converted to packet format. This way services that rely on TDM
or services that do not yet have a replacement solution can be migrated. Emulation also frees a
lot of different PDH and SDH transmission systems, because only the TDM devices at the end
points must remain in operation. Emulation can be done in different ways. One common
solution is to use the TDMoP technology. Using the TDMoP requires investments in the
emulation devices. Some TDM network devices can be connected straight to the IP core
network. However, this requires a bit of configuration on the network side, and that creates
additional costs.
Because of the additional device investments and configuration costs, emulation is usually
implemented in network areas that have more customers. These areas still usually create
revenue, so it is economically sensible to keep maintaining the TDM-network. Even in these
denser parts of the network the natural churn is decreasing the subscription rates. This
development should be carefully monitored, because some emulated areas can be transformed
to potential candidates for active migration. This then frees emulation devices that can be
deployed in some other part of the network.
The original TDM network in Finland was built to accommodate more than one million
telephone subscriptions. Today there is a significantly smaller amount of active subscriptions
and this has led to a situation where there is redundant capacity on some network sites.

46
Figure 19 Concentrator Packing
For example, on a site there can be three telephone concentrators each of which can handle
500 connections but each only has 150 active connections. In this situation, concentrators can
be packed so that all 450 connections go through a single concentrator. That makes the other
two concentrators redundant, so they can be dismantled to free up resources.

47
6. Migration analyses
Migration analyses are a key factor in migration projects. Analyses are used to optimize the
migration process to create cost savings and maintain customer satisfaction. This chapter
describes how these kinds of analyses can be formed. Another point that greatly affects the
migration project is the migration strategy. This chapter shows a few different strategy
scenarios and analyses the pros and cons of each approach. Finally an example of a practical
migration problem is presented.
6.1 Overview of a Migration Planning Process
An ideal migration project should be performed so that it would cause a minimum amount of
disturbance to the customers. For this purpose natural migration is the ideal way, but from the
migration‟s point of view it is going on too slowly. That is why thorough analysis and
monitoring processes are needed so that the migration is implemented as smoothly and
efficiently as possible.
In migration analyses there are different points of view that need to be taken into account. The
network side of the organization usually has its own preferences about the dismantling order
and timetables, and these can often conflict with those of the business side. The network
operator‟s main motivation for the migration order is to maintain sufficient storages of spare
parts and make sure that the TDM network remains operational during the transition process.
At the same time the business side wants to uphold the customer satisfaction, especially with
the key customers that bring in a lot of revenue. The product management also has its own
opinions about the migration schedule. It mainly depends on the release schedules of the
replacing products. Different analyses are needed in order to reach a solution that satisfies all

48
participants. An example of an analysis that takes different needs into account is presented in
Chapter 8.
In Figure 20 the key parts of the migration planning process are described. The first part of the
process is to obtain the necessary data from the different databases. This can be roughly
divided in the network data that describes the network topology and gives information about
different network devices, and the customer data where information about the customer types
and products are found.
Figure 20 Migration Planning Process
The data is obtained from different databases that are built on different platforms and are not
interconnected. That is why the data can be in different forms and qualities depending on
where it is located and who has modified it. For example, in network data every connection
has a starting point and an ending point. Let us assume that the network operator‟s policy is to
always consider a concentrator to be the starting point of a connection. This is a general
working model, but still there are some network configurators that during the years have set
the concentrator to the ending point of a connection. This then lead to a situation where these
connections are hard to identify, especially when analysing tens of thousands of connections.

49
That is why the data amount needs to be validated and modified, so that it is in an easily
interpretable and high quality format, before it can be used in analyses. Data validation is a
major cost contributor in the network migration. The amount of corrupted data needs to be
identified and its effect on the migration examined. During the planning process, the migration
management needs to decide about the scope of data validation:
If no data validation is done beforehand, there is no upfront cost, but the costs during
the migration would probably be higher because the decisions made could be based on
corrupted data.
If complete validation is done, all costs are upfront, which could become too
expensive, but at the same time the migration costs would be much lower. [37]
The analysis process is used to determine the migration order, i.e. which products and
subscriptions are migrated and when. When the migration is started there isn‟t necessarily a
replacement product available for some old platform services. Definition of a replacement
product is the key to successful migration for each customer. Examples of a situation into
which product migration can enter are:
One IP-service is used to replace three TDM-services, or alternatively an existing IP-
service can only partly replace some TDM-services. These cases must be identified
and if there isn‟t a satisfactory solution available, the dismantling order must be
changed.
A customer can use their subscription to whatever purpose they want. For example the
traditional telephone subscription can be deployed in traffic cameras and milking
robots used on farms. This information can‟t always be easily found in the network
provider‟s databases, so customer interaction is needed. The availability of a replacing
solution could depend on what purpose the product is used for. Therefore this needs to
be identified in the analysis process.

50
The information about the customers is also an essential factor in the analyses. Generally the
business customers create more revenue compared to the consumer customers. Business
customers can also have multiple, sometimes hundreds of subscriptions around the country.
These cases require more time and effort compared to regular consumer customer
subscriptions. That is why these cases need to be identified early, so there is enough time to
perform the necessary actions. Some examples of the customer factors that need to be
considered in order to validate the migration opportunities are listed below:
Whole value of the customer (revenue)
Customer Solution and can it be replaced
Customer contract
The amount of customers in a network area
These factors are the basic building blocks in determining the optimal migration order. A
closer look into this process is provided in Chapter 8.
6.2 Choosing the right migration Strategy
The migration from PSTN to NGN is a long and complicated process. This section examines
different migration scenarios. The important thing is to understand that there is no single best
way for the migration to NGN, because of the different underlying conditions. For example,
the most suitable migration scenario could depend on the current network infrastructure and
service utilization rate. Arvind Kumar proposes three different types of migration scenarios in
his paper [38]. This model is presented in Figure 21. Other migration scenario models have
been also proposed [39-40].

51
Figure 21 Different Migration Strategies [Adopted from 37]
The first strategy describes an overlay migration scenario. In this scenario NGN and PSTN are
operated in parallel. The NGN usage is slowly increased as customers migrate away from
PSTN. Finally, when there are only a small amount of customers left in PSTN they are
migrated to NGN. The overlay strategy‟s advantage is that it allows a rapid implementation of
new services and minimizes the risk of disrupting the existing PSTN customers. The major
disadvantage of this strategy is that it doesn‟t reduce network costs because PSTN network
needs to be maintained and building a separate IP network is necessary.
The scenario on the right in Figure 21 describes a PSTN replacement scenario. In this scenario
a PSTN infrastructure is replaced with IP based equipment. During the transition period the
PSTN services are enabled in NGN through emulation. Just like in the overlay scenario, the
NGN usage increases as customers naturally migrate away from PSTN. At the same time
emulated connections can be dismantled. This scenario is usually preferred by incumbent
operators who have a large PSTN infrastructure. The biggest obstacle of this approach is

52
successfully managing all of the old platform connections and making sure they remain
operational during the transition period.
The third solution is a mixed scenario, where the network infrastructure is partially replaced.
Some of the PSTN connections are emulated while some are actively migrated to NGN. This
is also the strategy selected for the migration project presented in this thesis. The main idea of
this strategy is that profitable and otherwise critical PSTN connections are emulated while the
others are actively migrated. At the same time the natural migration increases the use of NGN
services. The main advantage of this approach is that it is optimal in obtaining maximum
customer satisfaction. New services are provided according to a customer‟s interest in them,
while at the same time support for the old platform services is provided until a suitable
replacement is developed. This scenario also allows taking the maximum advantage of old
TDM-devices by reusing them in different sites as the migration progresses. The major
disadvantage is that this approach requires a lot of management and optimization, which can
create additional risks.
6.3 The Practical Migration Example
During the first years of the migration project the easiest targets are identified and migrated. A
typical easy case is a telephone concentrator where there are approximately 10 POTS
subscriptions and a few or no ISDN subscriptions. From the transmission technology point of
view, the ISDN subscriptions don‟t differ from the POTS, but they can be considered more
complicated because they usually belong to businesses. Emulation isn‟t a cost-effective
solution because there are so few customers. The network view of the case is presented in
Figure 22.

53
Figure 22 Network view
Figure 22 describes different ways how a concentrator can be connected to the area and core
networks. When the concentrator is emptied of the customers, the transmission technology
connecting the concentrator to the area network can be dismantled. These individual cases do
not affect the area and core networks. In more complicated situations there are also 2 Mbps
company connections on the network site. These are also connected to the area network with
the same transmission technology as the concentrators, so the same emulation and product
migration possibilities still apply.
CORE AREA Copper 2M
Fiber (8V) DWD
SDXC SDXC
SDXC SDXC
SDXC
SDXC
DWD DWD
DWD
DWD DWD
PDH
PDH
ADM
ADM
ADM
ADM
DX Exchange
Radio link
ADM
DXX
SDH
1
2
ADM=Add drop multiplexer
SDXC=synchronous digital
cross-connect
ACCESS
CO
NC
EN
TR
AT
OR

54
A typical yearly migration target is a few hundred concentrators. That releases several
thousands of transmission technology devices. The key point is that by emptying a
concentrator, many other devices can also be dismantled. The decision of which concentrators
will be emptied requires analyses concerning the existing subscriptions and customers.

55
7. Example Case 1: An Analysis Tool to Predict and Manage Future Migration Amounts
During migration planning it is important to be able to predict and manage different migration
amounts. For that purpose a specific spreadsheet tool was created. This tool shows how fast
different TDM based products are migrated and how it affects revenues and costs. The tool
was built with Microsoft Excel, which was considered to offer the required attributes for this
purpose. The underlying principles and formulas behind the tool were quite simple to
implement, so any specific analysis program was not needed. This chapter describes the
building process of the tool and how it is used in migration management.
7.1 General Description of the Tool and How It Was Built
The first step in building of the tool was to determine different products to be analysed. In this
case the scope consisted of the majority of the TDM product portfolio. This includes basic
telephone subscriptions for consumers and businesses, ISDNs, 2 Mbps switches of different
technologies and wholesale products. To provide the necessary simplicity, each product is
examined on a separate sheet. A specific summarization sheet was created, where the different
key numbers are displayed for each product.
The next step was to obtain the current amounts of different product subscriptions. This
information lies around different databases, but they were quite easily gathered. When the
product amounts were obtained, different categories to represent where and how products are
migrated were created. After several trial versions the status description of the product was
divided in the following categories:

56
The amount of subscriptions of the product
The remaining TDM-base
The emulation base
Natural migration
Active migration
Yearly emulation
The tool follows and predicts how the amounts in these categories change during the lifetime
of the migration project. The categories can be examined on a yearly, quarterly or weekly
basis, depending on the migration task. The amount of subscriptions of the product simply
tells how many subscriptions are left of the product examined. It is a sum of the TDM base
and the emulation base. At the beginning of the product migration all of the examined
subscriptions are part of the TDM base, which means that they are built on top of TDM
technology. When the migration proceeds, some of the products are emulated to IP network,
so that during the migration the TDM-base is decreasing, while at the same the emulation base
is growing larger.
The first year‟s natural migration amount can be calculated, when the number of subscriptions
there were the year before is known. That can then be compared to the current amount to
obtain the decrement of subscriptions. This rate can be used to help predict future natural
migration numbers. Later on in the project it is important to remember that there is also a
churn away from the emulated base of the product. When the service is emulated, the
customer will not be influenced, so it doesn‟t affect their potential decision to terminate the
service. Total active migration and emulation rates are determined by migration management.
These rely heavily on the network operator‟s knowledge about the network quality, capacity
utilization and need for spare parts. As mentioned earlier, the active migration and emulation
complement each other. The network operator simply indicates how many network elements it
needs to dismantle, and then the migration management needs to decide how many of these
elements can be obtained from emulation and how many from active migration. These

57
numbers also depend on natural migration, so if the natural migration rate is higher than
expected, the emulation and active migration rates can be lower. Figure 23 describes the
simplified category overview of the tool. The amount of subscriptions, the TDM base and the
emulated base indicate the amounts at the end of the year. The migration amount shows how
many subscriptions are migrated during the year.
Table 4 Product x subscriptions
Product x subcriptions 31.12.2010:
200 2011 2012 2013 2014 2015
Product x subscriptions 160 128 102 82 66
TDM base 156 120 77 49 25
Emulation Base 4 8 25 33 40
Natural Migration Total 40 22 16 10 6
Natural Migration from the Emulated Base 0 1 1 3 3
Natural Migration from the TDM base 40 21 15 8 4
Yearly Emulation 4 5 18 10 10
Active Customer Migration 0 10 10 10 10
From Table 4 it can be seen that for product x the measurement period started at the end of the
year 2010 when there were 200 subscriptions. During the year 2011 40 subscriptions churned
away, while 4 were emulated. In 2012 the forecasted emulation is 5 subscriptions, but at the
end of the year 2012 the size of the emulated base is only 8, because it has been predicted that
one subscription from the emulated base churns away during the year. The goal for the
migration project is that when the project ends, the size of the TDM-base would be 0. After
that a new project plan and schedule need to be created for migrating the emulated base.
In addition to the information about how the subscriptions are migrated and how the migration
is estimated to proceed, it is important to know what happens to the customers who have been
actively or naturally migrated. Some customers may subscribe to a replacing IP-solution, some
may move to a similar wireless solution and some may choose not to have any replacement
product. In the building process of the tool, replacing solutions for every examined TDM
product have been determined. After that the amounts of every replacing solution were

58
obtained from databases and brought into the tool, so that the active and natural migrations‟
effects can be seen. This is especially useful after the first year of the project. Then the actual
amounts of replacing solutions are known, so that their percentile distribution can be
calculated and these percentages can be used to make forecasts for the following years. Table
5 describes this forecast process. It presents a replacing product distribution of the product x
studied in Table 4.
Table 5 Distribution of replacement solution
2011 2012 2013 2014 2015
Natural Migration Total 40 22 16 10 6
Distribution of replacement solutions
IP solution 1 5,0% 5,0% 5,0% 5,0% 5,0%
IP solution 2 42,5% 42,5% 42,5% 42,5% 42,5%
Mobile solution 22,5% 22,5% 22,5% 22,5% 22,5%
No replacement 30,0% 30,0% 30,0% 30,0% 30,0%
Amount of replacement solutions
IP solution 1 2 1 1 1 0
IP solution 2 17 9 7 4 3
Mobile solution 9 5 4 2 1
No replacement 12 7 5 3 2
At first the actual amounts of replacing solutions for the year 2011 are obtained in the
beginning of 2012. After that their distributions are calculated and the same distribution is
used to predict the future amounts. This forecast model can then be updated and re-evaluated
every time new information is received. One flaw of the tool can be found when looking at the
numbers of the year 2013. The forecasted natural migration is 16 subscriptions, but when
looking at the replacing solutions, their sum is 17. This small defect arises from the fact that
when talking about subscriptions, it is not sensible to add decimals to the numbers. Now when
the total amount is multiplied to the percentage values, there will be decimals that Excel

59
rounds up to the nearest number. That is why there is a possibility for this kind of errors, but it
shouldn‟t cause any significant problems in migration planning.
7.2 Usage in Migration Management
Knowledge of the migration amounts and product distributions have many uses in the
migration management. Perhaps the main advantage of the tool is that it allows the
management to visualize, how migration is progressing for each product and what needs to be
done in order to achieve the targeted goals. For example, when looking at the product x‟s
current migration forecast it indicates that at the end of the year 2015 there are still products in
a TDM base. Management can now then react to the situation in several possible ways:
One solution is to encourage natural migration with price changes and marketing
campaigns.
The active migration and emulation rates can possibly also be increased. They often
depend on other products, but this relation can be easily analysed with this tool,
because the related products are presented on separate sheets.
If none of the mentioned solutions are possible to implement, the final solution would
be to increase the project lifetime. The formulas used in the tool allow a possibility to
easily add additional columns in products.
One good usage of the tool is to use it to approximate yearly revenues. These approximations
can be done, when the Average Revenue per User (ARPU) for the examined products are
known. Different replacing solutions have different ARPUs and these also differ from the
ARPU of the TDM product. Table 6 presents the ARPUs related to the product x. As can be
seen, the tool offers a possibility to change ARPUs during the product lifetime, but to simplify

60
things in this example, the product x‟s ARPUs remain the same the whole time during the
project.
Table 6 ARPUs of examined products
ARPUs 2011 2012 2013 2014 2015
Product x 20 20 20 20 20
IP solution 1 10 10 10 10 10
IP solution 2 13 13 13 13 13
Mobile solution 15 15 15 15 15
With these numbers, the yearly revenue streams and their changes can be calculated.
This monitoring tool is also deployed in calculation of the costs related to active migration.
The employee cost of active migration can be roughly divided in four categories:
Customer contact
Customer analysis
Service disinstallation
Equipment dismantling
In active migration each customer must be contacted and analysed to find optimal solution,
which would benefit both parties most. When the solution is reached, the old services must be
disinstalled and after that the related equipment can be dismantled. A separate analysis has
been made of how much time approximately goes to each phase. Now when the average cost
per employee is known, the cost of dismantling a subscription can be calculated.
From the previous examples it can be seen that this kind of monitoring tool has many benefits.
The migration management needs to be aware of how migration is progressing and how it is

61
forecasted to proceed in the future. This information helps to identify different problem points
related to different products and gives additional time to manage them. One important feature
of the tool is that it is very flexible. Probably in the future new applications will be developed,
where the information provided by the tool is exploited

62
8. Example Case 2: Determining the Optimal Migration Targets
In the migration project, the main motivation comes from the network operators need to have
enough spare parts in order to maintain the TDM-network, during the evolution towards NGN.
A common case example is the dismantling of the telephone concentrators. Concentrators are
devices used to gather the subscriber lines and connect them to a local exchange. The most
typical migration case is a small network site where there are only PSTN customers. If the
concentrator is dismantled on the site, the PDH and SDH transmission systems can also be
dismantled. In this example it is examined how the yearly migrated concentrators are defined
and what kind of analyses are needed in identifying the targets.
The analysis process requires a combined effort and co-operation between the network- and
service operator. The planning process begins within the network operator. The network
informs the migration management of how many concentrators it needs to be dismantled in the
next year. The management must then use this as a starting point to define the potential
targets. This prioritization is done by giving the concentrators a specific prioritization order
based on different factors. Important thing is to understand that the described concentrator
dismantling project doesn‟t focus on a certain region or area but the target area is the whole
TDM network.
8.1 Network Operators Point of View
The network operator tries to determine in its analyses how many concentrators it needs to
dismantle in a year. These concentrators can be obtained with packing and with active
migration. The potential packing targets are all of the network sites that have more than one
concentrator. These sites are then analysed to see how many connections there are connected
to the concentrators. If the utilization rates of the concentrators are low enough they can be

63
packed. After the packing amounts are known, the rest of the target devices are emptied with
active migration.
The list of how many connections are connected to a concentrator is obtained from the
network operators databases. They have also some preferences about what devices should be
emptied. These preferences rely heavily on what is happening in the other parts of the
network. There are for example large telephone exchanges where multiple concentrators are
connected. When these kind of larger switches are replaced with an IP-solution, necessary
actions must be done with the concentrators. Some of the IP based switches like the Surpass
hiE9200 [41] also supports TDM switching but connecting concentrators to it still have costs.
Other solutions are emulation with the TDMoP, especially with larger concentrators, and
active migration with smaller concentrators. There are also concentrators from different
vendors in the network and not all will support emulation. These must be prioritised in active
migration.
The network operator wants also to analyse what kind of PDH and SDH devices can be
dismantled when the concentrator is emptied. Concentrators are connected to the area network
usually with PDH or SDH devices and these can be also dismantled when the concentrator is
empty. Some devices have less spare parts or vendor support available so these cases must be
taken into account when the network operator defines its preferred targets.
To summarize the network operator‟s point of view, it wants to prioritize the concentrators
connected to the exchanges, which are transformed to IP in the near future. Also the
concentrators that do not support emulation receive higher prioritizing order. In a typical
yearly scenario the network has defined that 300 concentrators need to be dismantled. 150 of
these can be obtained with packing so the rest are targeted to active migration. The network
then sends information about its preferred targets to the service operator for further analyses.
Even though the target amount for the service operator is 150 concentrators the prioritization
is done for larger amount, for example for 600 concentrators. This is done so that there would

64
be a buffer for the potential risk and show stoppers that could arise from the service operator‟s
analyses.
8.2 Service Operations Point of View and Identifying the Targets
The starting point for the service operator‟s analyses is to identify what customers and
products there are behind the 600 concentrator list obtained from the network side. The
customers are divided in the consumers and the businesses. The businesses are then classified
into three categories based on the contract values and the total amount of subscriptions. The
level 1 customer are considered to be the most valuable while the level 3 includes business
customers of lowest importance. After the classification is completed, a specific analysis for
the level 1 customers is done. This analysis examines how many subscriptions businesses have
in the target area of 600 concentrators and in how many different concentrators the company‟s
subscriptions are connected. The business group in which the company belong is also
examined. For example in Finland there are several small independent retail stores around the
country who belong to a same business group called Kesko. Sometimes the centralized
business group manages the subscriptions of each company belonging to this kind of group. A
small part of this analysis is presented on a Table 7 below.
Table 7 Business analysis
Company Name
Business Group Subscriptions Subscriptions on different sites
Company A Group A 12 2
Company B Group B 5 4
Company C Group C 13 1
Company D Group A 3 1
Company E Group E 8 2
Company F Group F 44 26
Company G Group G 9 3

65
When the analysis in the table 7 is formed, the next step is to analyse the contract situation of
the customers. If a customer has a fixed-term contract, the operator can‟t terminate it in a
middle of the contract period. The open ended contracts, on the other hand, offer a greater
possibility to offer customers new IP based replacements. From the Table 7 it can be seen that
the company F have a total of 44 subscriptions and these are connected to 26 different
concentrators around the country. Now if company F has a fixed term contract that runs for
example another four years, its subscriptions can‟t be migrated at the current time. For that
reason the whole set of 26 concentrators, where company F have subscriptions, are dropped
from the list of potential targets. After these 26 concentrators are removed from the list, the
analysis shown in the Table 7 needs to be updated. The reason for this is that some of the
remaining companies may also have subscriptions in the removed concentrators. For example
the company E originally had subscriptions on two different sites. Now if both of these sites
were in the set of 26 concentrators removed from the analysis, company E wouldn‟t have any
subscriptions at the target area. These kinds of updates were implemented manually in the
Microsoft Excel because a suitable formula was not found.
There are also other criteria of why some business subscriptions can‟t be migrated in the
current planning period. One simple reason is that some subscriptions still create a lot of
revenue. That is why the charging and billing information about each subscription is obtained
from the databases. These billing lines are then combined so that the total billing of each
concentrator is formed. The total income of the concentrator is then compared with different
costs created by the concentrator. This simple comparison helps to identify the concentrators
that are creating losses so that they can be prioritized in migration. The analysis process also
needs to take into account the total value of the customer. Some customers may have
subscriptions that do not create any profits for the operator but the total revenue obtained from
the customer is still highly profitable. In order to maintain customer satisfaction in these
situations, the less profitable subscriptions are left alone until a suitable package for the
customer is implemented.

66
The next step is to determine what kinds of devices there are on a concentrator area. For
example if there is already a TDMoP device on the same site as the concentrator, the
emulation solution can be implemented more easily and it would create less costs. If there is a
fibre connection to the analysed site, then a wide variety of IP-solutions is available to the
customers. The 3G or 4G availability on the target area is also examined. If the concentrator
area doesn‟t have necessary devices to provide the replacing solutions, the migration must be
performed on a later time. This depends on the investment schedule. In the analysis process, a
separate section needs to be created, where the release schedule of the replacing solution and
its availability are monitored.
The different factors described above are assessed and used to eliminate the targets from the
buffer of 600 concentrators. There are quite a lot of important customers in the network and
the business side of the operator can‟t eliminate them all from the list. That is why a specific
scoring mechanism was created to determine the most potential targets. In the final migration
list there are still over 150 concentrators. The reason for this is that during the migration new
information can arise, which could delay the migration in some areas. A lot of new
information about the situation is obtained during the active migration process when the
customers are contacted and their needs are identified.

67
9. Conclusions
This paper describes the different factors related to the service migration from the TDM based
networks to an all IP environment. When the migration project started, the amount of
customers connected to a device was the main driver in determining the yearly migration
targets. That lead to situations where there were many devices where most of the customers
were migrated successfully but one or two connections remained that couldn‟t be migrated.
These were the connections that belonged to some important corporation or connections that
were used in a service that didn‟t have suitable necessary replacing solution available. It was
understood that further analyses in identifying the potential targets were needed. The year
2011 was the first year when a comprehensive analysis was done and the results were
implemented in 2012.
The monitoring and predicting tool, described in chapter 7, main advantage has been in
providing information of what is happening in the network. This information is essential in
future planning and its overall use will be clarified in the future. The analysis process to
identify the most optimal migration targets has clearly improved the migration process. The
migration rate has significantly improved compared to the situation before the analysis
process. For example the concentrator dismantling rate was 21% below the forecast in 2011
but currently in 2012 when the target analyses were first time implemented, the current speed
is 30% above the forecasted rate. This clearly indicates that set goals can be achieved in 2012.
Service migration is a long-term project that will last many years. The analysis process was
started with a little or with zero previous experience. That is why it is predictable that the
process continues to improve during the project lifetime. This leads to a need to have
resources and employees dedicated to the project who knows what has been done before and
identify what needs to be improved.
The main concern for the future planning is the availably of software resources. At this point
Microsoft Excel is used to implement the analyses. It is predicted that the amount of yearly
migrated subscriptions grows larger later in this project and they also require more processing.

68
Storing of data is also a problem with Excel. In the present time Excel creates limits to the
scope of the analyses. For these reasons a separate, more advanced analysis tool will be
developed in the future to handle the growing data amounts. The data gathered for analyses
lies around separate different databases and could come in many forms. For example some
network device information is hugely different compared to the revenue information of
businesses. The ideal solution for the future is to determine a separate data model that contains
all the data required in migration analyses and have a tool able to process this data model. This
tool would also have a separate storage where the previous actions and results are recorded.
The design and planning of this analysis tool has already started when writing this thesis. The
goal is to have a tool that works as a migration database and at the same time has the sufficient
analysis capabilities. In an ideal situation this tool would replace Excel altogether in the near
future.

69
References
[1] P. Gnanasivam, Telecommunication Switching and Networks, New Age International
Publishers, 2006, ISBN: 81-224-2349-3
[2] Jonathan Davidson, Brian Gracely, James Peters, Overview of the PSTN and Comparisons
to Voice over IP, Cisco Press, 2001
[3] Gerald L. Hopkins, The ISDN Literacy Book, Addison Wesley, 1995
ISBN-13: 978-0201629798
[4] ITU-T, Recommendation Y.2001: General Overview of NGN, 2004
[5] Keith Knightson, Basic NGN Architecture Principles & Issues, ITU-T Workshop on NGN
(jointly organized with IETF) Geneva, 1-2 May 2005, 2005
[6] Roger L. Freeman, Telecommunication System Engineering, Wiley-Interscience, 2004,
ISBN 0-471-45133-9
[7] ITU-T, Recommendation G.704: Synchronous frame structures used at 1544, 6312, 2048,
8448 and 44 736 kbit/s hierarchical levels, ITU-T, 1998
[8] Valdar Andy, Understanding Telecommunications Networks, The Institution of
Engineering and Technology, London, United Kingdom, 2006, ISBN 0-86341-362-5
[9] Anttalainen Tarmo, Telecommunications Network Engineering, Artech House, 2003,
ISBN 1-58053-500-3
[10] Ericsson & Telia, Understanding Telecommunications 1, Studentlitteratur, 2001, ISBN
91-44-00212-2
[11] Lydia Partizale, David T Britt et al, TCP/IP Tutorial and Technical Overview 8th edition,
IBM, 2006
[12] Information Sciences Institute University of Southern California, Transmission Control
Protocol, RFC793, IETF, 1981
[13] J. Mahdavi, S. Floyd, A. Romanow, PSC, LBNL, M. Mathis, Sun Microsystems, TCP
Selective Acknowledgment Options, RFC2018, IETF, 1996
[14] T. Socolofsky & C Kale, A TCP/IP Tutorial, RFC1180, IETF, 1991
[15] Cisco, Business Case: Token Ring-to-Ethernet Migration, 2000

70
[16] Charles E. Spurgeon, Ethernet: The Definitive Guide, O'Reilly, 2000, ISBN: 978-1-
56592-660-8.
[17] Metro Ethernet Forum, Ethernet Services Definitions – Phase 2, 2008
URL: http://metroethernetforum.org/PDF_Documents/MEF6-1.pdf
[18] E. Rosen, A Viswanathan, R. Callon, Multiprotocol Label Switching Architecture,
RFC3031, IETF, 2001
[19] ITU-T, Recommendation G.694.1: Spectral grids for WDM applications: DWDM
frequency grid, 2002
[20] ITU-T, Recommendation G.694.2: Spectral grids for WDM applications: CWDM
Wavelength grid, 2003
[21] A. Vainshtein, YJ. Stein, Structure-Agnostic Time Division Multiplexing (TDM) over
Packet (SAToP), RFC4553, IETF, 2006
[22] A. Vainshtein, I. Sasson, E. Metz, T. Frost, P. Pate, Structure-Aware Time Division
Multiplexed (TDM) Circuit Emulation Service over Packet Switched Network (CESoPSN),
RFC5086, IETF, 2007
[23] Ismail Dalgic, Michael Borella, Rick Dean, Jacek Grabiec, Jerry Mahler, Guido Schuster,
and Ikhlaq Sidhu, True Number Portability and Advanced Call Screening in a SIP-Based IP
Telephony System, IEEE Communications Magazine, July 1999
[24] Vaiva Lazauskaite, Developments of Next Generation Networks (NGN): country case
studies, ITU, 2009
[25] Pekka Väisänen, Quadruple Play - Promise of Bundling, Aalto University
Telecommunications Forum, 2010
[26] Agbinya I. Johnson, IP Communications and Services for NGN, Auerbach Publications,
2010, ISBN: 978-1-4200-7090-3
[27] Nigel Seel, Business Strategies for the Next-Generation Network, Auerbach Publications,
2007, ISBN-13: 978-0-8493-8035-8
[28] J. Rosenberg, H. Schulzrinne, G. Camarillo, A. Johnston, J. Peterson, R. Sparks, M.
Handley, E. Schooler, SIP: Session Initiation Protocol, RFC 3261, IETF, 2002
[29] Randy Lawson, Internet TV Subscribers to Rise by More Than 50 Percent in 2009,
iSuppli, 2009, [referenced 18.3.2012]

71
[30] Broadband forum press release, Global Broadband Hits 484 Million Subscriber Mark as
More Than 14 Million Lines Are Added In Q1 2010, Broadband forum, 2010, [referenced
18.3.2012]
URL: http://www.broadband-forum.org/news/download/pressreleeases/2010/Q110stats.pdf
[31] Finnish Communications Regulatory Authority (FICORA), Half-year report of the
communications market 2011, 2011
[32] Finnish Communications Regulatory Authority (FICORA), Market Review 2007, 2007
[33] CIA, The World Factbook ISSN 1553-8133
[34] The Fiber Optic Association, How Fast Is Data Traffic Growing?, 2011
[35] Cisco, Cisco Visual Networking Index: Forecast and Methodology, 2010–2015, 2011
[36] K. Rezabeigi, A. Vafaei, N. Movahhedinia, A Web Services based Architecture for NGN
Services Delivery, World Academy of Science, Engineering and Technology 43 2008, 2008,
[37] David Mongeau & Govinda Rajan, Optimizing Costs of Migration to NGNs, Networks
2008 13th International Symposium 2 October 2008, 2008
[38] Arvind Kumar, Learning’s from NGN Migration Study Group, Workshop on NGN
Regulation and Migration Strategies New Delhi October 13 & 15 2010, 2010
[39] Ahmad A.Almughaless & Ali M Alsaih., Optimum Migration Scenario From PSTN to
NGN, Communication Systems, Networks and Applications (ICCSNA) 2010 Second
International Conference on, IEEE, 2010
[40] Chris De' Courey Bower, Wouter Franx & Manfred Hammer, Overlay NGN Migration
Approach to Deliver Multimedia Services, Telecommunications Network Strategy and
Planning Symposium. NETWORKS 2004, 11th International, 2004
[41] Nokia Siemens Networks, SURPASS hiE 9200 product flyer, NSN, 2008