analysis of impediments to fair housing...
TRANSCRIPT

ANALYSIS OF IMPEDIMENTS TO FAIR HOUSING CHOICE
for
SACRAMENTO HOUSING AND REDEVELOPMENT AGENCY
November 2011
Prepared by Steven J. Sacks, AI Consultant Under Contract to Project Sentinel
Redwood City, California

i
Table of Contents
Page No.
List of Figures . . . . . . . . . . . . . . . . . . . . . . . . . . . . . . . . . . . . . . . . . . . . . . . . . . . ii
Chapter 1: Introduction and Executive Summary . . . . . . . . . . . . . . . . . . . . . . . . 1
Chapter 2: Demographic Profile . . . . . . . . . . . . . . . . . . . . . . . . . . . . . . . . . . . . . 8
Chapter 3: Housing Profile . . . . . . . . . . . . . . . . . . . . . . . . . . . . . . . . . . . . . . . . . 19
Chapter 4: Affordability . . . . . . . . . . . . . . . . . . . . . . . . . . . . . . . . . . . . . . . . . . . 31
Chapter 5: Land Use and Zoning . . . . . . . . . . . . . . . . . . . . . . . . . . . . . . . . . . . . 41
Chapter 6: Mortgage Lending and Foreclosures . . . . . . . . . . . . . . . . . . . . . . . . . 52
Chapter 7: Fair Housing Enforcement and Education . . . . . . . . . . . . . . . . . . . . . 79
Chapter 8: Resource Management, SHRA Planning and Programs, and Fair Housing Choice . . . . . . . . . . . . . . . . . . . . . . . . . . . . . . . . . . . 100

ii
List of Figures
No. Title Page No.
2.1 Population by Race & Ethnicity - Sacramento County 9
2.2 Population by Race & Ethnicity - Sacramento City 10
2.3 Population by Race & Ethnicity – Folsom 11
2.4 Population by Race & Ethnicity – Galt 11
2.5 Median Age of Population by Area 12
2.6 Median Household Income by Area 13
2.7 Median Income by Race/Ethnicity - 2000 13
2.8 Percentage of Families in Poverty by Area 14
2.9 Families in Poverty by Race/Ethnicity - 2000 14
2.10 Percentage of Female-headed Families with Children in Poverty by Area 16
2.11 Percentage of Female-headed Families with Children in Poverty as a 16 Percentage of Total Family Population
3.1 Growth in Sacramento County Housing Stock 20
3.2 Percentage of Total Housing Stock by Type 21
3.3 Growth in Sacramento City Housing Stock 22
3.4 Growth in Folsom City Housing Stock 23
3.5 Growth in Galt City Housing Stock 24
3.6 Age of Housing 36
4.1 Housing by Tenure Type 32
4.2 Household Size by Race/Ethnicity - 2000 32
4.3 Tenure by Race/Ethnicity - 2000 33
4.4 Area Median Rents - 200/2007 34
4.5 Percentage of Cost Burdened Rental Households 34

iii
4.6 Median Rents by Unit Size - 2009 35
4.7 Median Home Values - 2000/2007 37
4.8 Owner-Occupied Units - 2000/2007 37
4.9 Percentage of Cost-Burdened Owner-Occupied Households 39
5.1 Key Zoning Code Provisions – Summary 44
6.1 Loan Denial Rates by Race/Ethnicity – Sacramento County – 2007 53
6.2 Loan Denial Rates by Neighborhood – Sacramento County – 2007 54
6.3 Loan Denial Rates by Race/Ethnicity – Sacramento County – 2006 55
6.4 Loan Denial Rates by Neighborhood – Sacramento County – 2006 55
6.5 High-Cost Lending by Race/Ethnicity – Sacramento County – 2007 56
6.6 High-Cost Lending by Race/Ethnicity – Sacramento County – 2006 57
6.7 High-Cost Lending by Neighborhood – Sacramento County – 2007 58
6.8 High-Cost Lending by Neighborhood – Sacramento County – 2006 58
6.9 Second Lien Loans by Race/Ethnicity & Income – Sacramento County – 59 2007
6.10 Second Lien Loans by Race/Ethnicity & Income – Sacramento County – 60
2006
6.11 Loan Denial Rates by Race/Ethnicity – Sacramento City – 2007 60
6.12 Loan Denial Rates by Neighborhood – Sacramento City – 2007 61
6.13 Loan Denial Rates by Race/Ethnicity – Sacramento City – 2006 61
6.14 Loan Denial Rates by Neighborhood – Sacramento City – 2006 62
6.15 High-Cost Lending by Race/Ethnicity – Sacramento City – 2007 63
6.16 High-Cost Lending by Race/Ethnicity – Sacramento City – 2006 63
6.17 High-Cost Lending by Neighborhood – Sacramento City – 2007 64
6.18 High-Cost Lending by Neighborhood – Sacramento City – 2006 64

iv
6.19 Second Lien Loans by Race/Ethnicity & Income – Sacramento City – 65 2007
6.20 Second Lien Loans by Race/Ethnicity & Income – Sacramento City – 65
2006
6.21 Growth in Borrower Distress – Sacramento City – 2007 – 2009 66
6.22 Loan Denial Rates by Race/Ethnicity – Folsom – 2007 67
6.23 Loan Denial Rates by Race/Ethnicity – Folsom – 2006 67
6.24 High-Cost Lending by Race/Ethnicity – Folsom – 2007 68
6.25 High-Cost Lending by Race/Ethnicity – Folsom – 2006 69
6.26 Loan Denial Rates by Race/Ethnicity – Galt – 2007 70
6.27 Loan Denial Rates by Race/Ethnicity – Galt – 2006 70
6.28 High-Cost Lending by Race/Ethnicity – Galt – 2007 71
6.29 High-Cost Lending by Race/Ethnicity – Galt – 2006 72
6.30 High-Cost Lending by Neighborhood – Galt – 2007 73
6.31 High-Cost Lending by Neighborhood – Galt – 2006 73
6.32 Second Lien Loans by Race/Ethnicity & Income – Galt – 2007 74
6.33 Second Lien Loans by Race/Ethnicity & Income – Galt – 2006 74
7.1 Human Rights Commission Complaint Intake: 2004 – 2008 85
7.2 Human Rights Commission Complaint Bases: 2004 – 2008 85
7.3 Human Rights Commission Complaint Outcomes: 2004 – 2008 86
7.4 Human Rights Commission Complaint Referrals: 2004 – 2008 86
7.5 Human Rights Commission Audits: 2004 – 2008 90
7.6 Human Rights Commission Educational & Training Events: 2004 – 2008 91
8.1 SHRA Supported Housing by Type: 2004 – 2008 101
8.2 SHRA Leveraging of Private Capital: 2004 – 2008 102

1
CHAPTER 1: INTRODUCTION AND EXECUTIVE SUMMARY
Introduction
Purpose and Scope of an Analysis of Impediments
An Analysis of Impediments to Fair Housing Choice (“AI”) is a broad spectrum review of private and public practices and policies which may impact people’s ability to choose housing in an environment free from discrimination.
The stated purpose of an AI is to increase housing choice, identify problems, and assemble fair housing information.1 The AI:
Serves as the substantive, logical basis for Fair Housing Planning.
Provides essential and detailed information to policy makers, administrative staff, housing providers, lenders and fair housing advocates.
Assists in building public support for fair housing efforts both within entitlement jurisdictions’ boundaries and beyond.
HUD requires entitlement jurisdictions to develop action plans to overcome the effects of
identified impediments to fair housing choice.2 Therefore, the AI is the necessary first step in the fair housing planning process.
HUD wants entitlement jurisdictions to become fully aware of the existence, nature, extent, and causes of all fair housing problems and the resources available to solve them. Without this information, an entitlement jurisdiction’s Fair Housing Plan (“FHP”) could fall short of measurable results. HUD’s goal in requiring the production of an AI is to conserve valuable energy and resources while producing efficient and effective fair housing services.
Information Gathering and Analysis
To assist policy makers, the AI consolidates fair housing information otherwise located in a variety of sources. It also brings together information not otherwise perceived as fair housing related.
This 2010 AI is both a review of previously identified Impediments to Fair Housing Choice in the jurisdictions administered by the Sacramento Housing and Redevelopment Agency (SHRA), and an examination of current conditions affecting fair housing choice and affordability. HUD defines fair housing impediments as:
1 Source: HUD Fair Housing Planning Guide, p. 2-4. 2 Source: HUD Fair Housing Planning Guide, p. 2-1.

2
Any actions, omissions, or decisions taken because of race, color, religion, sex, disability, familial status, or national origin which restrict housing choices or the availability of housing choices, or
Any actions, omissions, or decisions which have the effect of restricting housing choices or the availability of housing choices on the basis of race, color, religion, sex, disability, familial status, or national origin.
The information sought for conducting an AI includes the following:
Practices and procedures involving housing and housing-related activities.
Zoning and land use policies.
The nature and extent of fair housing complaints, lawsuits, or other data that may evidence achievement of fair housing choice.
Demographic patterns.
Home Mortgage Disclosure Act (“HMDA”) data.
Allegations of discrimination.
Patterns of occupancy in Section 8, public and assisted housing, and private rental housing.
This 2010 AI evaluates policies and practices of SHRA, nonprofit agencies, and private entities. In analyzing possible impediments, HUD also requests that entitlement jurisdictions review the number and types of housing discrimination complaints filed with the Department of Justice, HUD, and DFEH.
Assembling Data and Information
The production of this 2010 AI involved extensive data collection. HUD does not intend AIs to be the product of original research. Therefore, the AI consultant relied primarily on existing data throughout the report. Since local governments do not collect data in the same way, different data sources are sometimes used for similar information. To produce this 2010 AI, the consultant reviewed relevant demographic data to identify housing patterns and assess efforts to avoid segregation and isolation. We also analyzed land use and zoning for legality of terminology and fair housing practice. Land use and zoning were also reviewed to identify practices used to promote or inhibit development of affordable housing.

3
Executive Summary
Overview
In the six plus years since the last AI was completed the Sacramento region, like the rest of the central valley, California, and, indeed, the nation as a whole, has undergone profound changes in its overall economic picture, and its housing market in particular. These changes have so altered the housing climate that any assessment of how well SHRA, as a Community Development Block Grant administering agency, is meeting its fair housing obligations must turn, in large part, on an evaluation of that agency’s responsiveness to these new conditions.
SHRA is responsible for administration and oversight of CDBG programs for the unincorporated County of Sacramento, and the incorporated cities of Sacramento, Folsom,
Galt, and Isleton.3 This 2010 AI seeks to evaluate both the extent to which SHRA and the cities of Sacramento, Folsom, and Galt have addressed and resolved those Impediments to Fair Housing Choice identified in the 2004 AI, and the ways in which SHRA and the three cities have responded to the changed circumstances which have confronted them in the latter years of this decade.
As a threshold observation it can be fairly stated that SHRA has been, and remains, a highly progressive, innovative, creative, and responsive CDBG administering agency. Its staff is well trained, not only in governmental program direction, but in the complexities of large scale public-private financing and investment, underwriting, land use law, and many other areas of expertise. SHRA has proven itself capable, moreover, of rapidly responding to changed circumstances, both within specific programs, and in the broader context of widespread shifts in economic and housing market conditions. These characteristics have enabled the agency to stay focused and effective in difficult times, such as the present.
Impediments to Fair Housing Choice Identified in the 2004 AI
The 2004 AI identified two major Impediments to Fair Housing Choice encompassing the entire region covered by SHRA administration, along with a number of Impediments unique to the City of Folsom.4 These Impediments were:
3 Although an incorporated jurisdiction, Isleton is, in fact, an extremely small locality of a few hundred households,
located in the southwestern corner of the County. As such, the AI consultant has determined, in consultation with SHRA, not to engage in a separate assessment of this city as part of this AI.
4 The 2004 AI also concluded that numerous instances of non-compliance with the accessibility requirements of the Fair Housing Act within the region constituted a separate Impediment. It was beyond the scope of this AI to conduct a re-assessment of this issue, but it is noted that the HRC conducted audits relating to physical disability in 2007, and found a continuing high level of non-compliance at that time.

4
• Discriminatory and predatory mortgage lending practices, including targeting of sub-prime loans to minorities. The AI specifically recommended funding a government or social services agency to distribute educational materials to vulnerable groups;
• Weak Fair Housing Enforcement by the Human Rights/Fair Housing
Commission. The AI contained a series of recommendations to address this Impediment, including more timely and appropriate investigation of complaints, tracking and reporting the final outcome of complaint processing including relief obtained, and the publication of successful outcomes in order to educate the public and motivate compliance by the housing industry;
• In Folsom, (a) a continued shortage of affordable housing, (b) restrictive
Conditional Use Permit and parking requirements for group homes, and (c) a discriminatory definition of “family” in the zoning code. Folsom has modified its code to remove the second of these three factors, but current data suggests that affordable housing for low and moderate income families remains in very short supply, and the definition of “family” still needs to be amended or removed.
Principal Findings of this 2010 AI
To the extent that this AI focuses on the concept of wider housing “choice” for racial and ethnic minorities, particularly those at the lower end of the economic spectrum, the demographic, housing stock, and affordability data and other indicators reviewed in Chapters 2, 3 and 4 tell an interesting tale. Insofar as wider housing choice depends, first and foremost, on a household’s economic circumstances, the region’s continued high unemployment statistics can only be viewed as a barrier to achieving this objective. For this reason, the AI consultant believes that SHRA should reconsider its longstanding disinclination toward funding economic development activities (See Chapter 2).
From a pure supply and demand perspective, it would appear that there is more than enough housing stock in the region to meet the needs of the population as a whole. Increases in the overall supply of rental housing exceeded the growth in the rental population in recent years, while the availability of single-family and other forms of housing intended for owner occupants has skyrocketed as a result of the mortgage implosion and foreclosure crisis enveloping the region. As of 2009, vacancy rates were up significantly in both rental and owner occupied housing. Nevertheless, there remains reason for concern regarding the availability of housing stock for those at the bottom of the economic ladder, because the conventional housing stock of the region’s two Public Housing Authorities is slowly decreasing as that housing ages and falls into disrepair. From a racial/ethnic perspective, the AI consultant also noted a striking disparity in the level of participation of Hispanic households in all of the PHAs’ housing programs (See Chapter 3).

5
The overall ample supply of housing stock, however, appears to have had a much greater impact on the affordability of owner-occupied housing than it has on affordability in the rental market. Homeownership opportunities have increased dramatically throughout the Sacramento region as housing prices have dropped dramatically and interest rates have fallen to their lowest levels in decades. Today, virtually any moderate income household with sufficient funds to make a down payment and cover closing costs can afford to buy a home. Affordability in the areas rental markets, however, does not appear to have been affected by the general downturn in the single-family housing market or the economic recession. In fact, the data strongly suggests that, at least in the four jurisdictions covered by this AI, rents have continued to increase at a pace exceeding the growth in household income. This means that those at the lower end of the economic ladder are increasingly housing cost-burdened. Inasmuch as a larger percentage of minorities are lower income renter households, this finding should inform SHRA’s planning and development strategies for new rental housing (See Chapter 4).
The four jurisdictions’ zoning codes and the land use policies associated with them are generally progressive and non-discriminatory. All of the jurisdictions provide for “density bonuses” for developers of affordable units, and all except Galt also contain “inclusionary zoning” provisions. And, as the discussion in Chapter 5 makes clear, the County, Sacramento city and Folsom have each devised some innovative approaches/alternatives to meeting inclusionary housing objectives. The AI consultant’s review of Folsom’s zoning code, on the city’s website, indicated that the code’s discriminatory definition of “family,” first identified in the 2004 AI, does not appear to have been corrected or removed. If this is, in fact, the case, the city should act immediately to address this issue, as it constitutes a continuing Impediment to Fair Housing Choice. Additionally, in the view of the AI consultant, the secondary dwelling provisions of three of the codes contain unwarranted restrictions. Specifically, Sacramento County and Sacramento City both require an additional off-street parking space for every bedroom in a secondary unit; Sacramento City and Folsom require owner-occupancy in either the primary or secondary unit. Such restrictions can only serve to limit the number of such units which can be built, thus reducing their availability as a source of affordable housing (See Chapter 5).
The 2004 AI concluded that “weak fair housing enforcement” by the HRC constituted an Impediment. This 2010 AI has concluded that many of the complaint processing and other shortcomings identified in the 2004 AI, such as the agency’s ill conceived investigative methodology, diminishing enforcement referrals, and failure to track the results of referrals, remain unresolved. In addition, however, the AI consultant became aware of two other aspects of the HRC’s approach to enforcement which, taken together, constitute serious deficiency for any entity professing fair housing advocacy. First, HRC adheres to the view that it is prohibited under state law from seeking monetary relief for complainants in conciliation, even after it has made a finding that discrimination has
6
occurred. Second, the HRC routinely encourages the victims of housing discrimination to accept and sign conciliation agreements which do not provide them with appropriate relief, rather than referring such victims to HUD, the California Department of Fair Employment and Housing, or to private attorneys, any of which could obtain full relief for such complainants (See Chapter 7).
The AI consultant makes the following recommendation:
Take steps to remedy the deficiencies in the current SHRA-HRC relationship and Raise HRC performance to an acceptable level
With the shortcomings identified in the HRC’s fair housing enforcement effort, there are a number of reasons why continued SHRA support of the agency is justified. First, it seems likely that even without SHRA funding the HRC will continue in operation as the area’s primary, if not sole, fair housing enforcement entity. The agency has been around for a long time and its existence is known throughout the Sacramento region. Arguably, any SHRA efforts to establish or fund an alternative enforcement program could be viewed as creating unwarranted competition and a duplication of services, and thus counter-productive. Second, SHRA has made a very substantial financial investment in the HRC, totaling almost 2 million dollars over the last ten years. Third, The HRC has intelligent and dedicated staff in place with a clear willingness to put in the necessary work effort to achieve meaningful results. With appropriate initial and ongoing training, there is no reason to believe that this staff could not effectively investigate and resolve housing discrimination cases.
Summary
The AI consultant believes that SHRA is, unquestionably, a progressive and forward looking agency, capable of designing and implementing a wide variety of programs which, collectively, meet both the fundamental objectives of the Community Development Block Grant program, and the affirmatively furthering fair housing requirements which that program contains. Chapter 8 of this AI sets forth a description of (a) how SHRA has been structured and positioned to achieve maximum coordination of housing related programs across the region; (b) the degree to which the agency has successfully leveraged private capital in support of its housing objectives; and (c) the range of innovative programs and initiatives which SHRA has developed to meet specific needs and respond to new developments. One of the hallmarks of SHRA has been its ability to respond to changed circumstances quickly and effectively, even when that requires significant program modification. The mix of programs developed by SHRA under the NSP program is an excellent example of that capacity.
Equally important, SHRA has consistently demonstrated an awareness and sensitivity to the racial and ethnic consequences of its policies and programs. Many of the programs

7
described in Chapter 8 testify to this fact. Based on this track record, the AI consultant has no doubt that SHRA will meet the challenges posed by the Impediments and other concerns cited in this AI, while continuing to address the larger housing needs of the entire region in the current critically stressed economic climate.
Major Impediment to Fair Housing Choice
This 2010 AI has concluded that two major Impediments to Fair Housing Choice exist within the jurisdiction of SHRA. Both of these Impediments are, in essence, continuing in nature, having been first identified as Impediments in the 2004 AI, although the specific details attendant to each finding have changed in the intervening years.
The region’s ongoing foreclosure crisis, and the discriminatory subprime lending practices which precipitated it is considered to be a major fair housing impediment.
The data and literature referenced in Chapter 6 show that while the foreclosure crisis is unquestionably a calamity for the entire region, its impact has been disproportionately borne by the minority community, The concern expressed in the 2004 AI, which noted the increasing targeting of high cost loans to the minority community, proved sadly prophetic. Such lending increased exponentially in the mid-decade housing boom years between 2004 and 2006. The fact remains, however, that this Impediment was, and still is, almost entirely a product of private sector activity. And, while it is undoubtedly true that the absence and/or inadequacy of Federal and State laws and regulations, combined with lax oversight and enforcement, may have contributed to the crisis, local governments and their agencies, such as SHRA, bear little responsibility for the current dilemma.
That is not to say, however, that SHRA cannot play a significant role in working to address the Impediment. First and foremost, SHRA is the lead agency responsible for designing and implementing programs intended to ameliorate the crisis, using federal Neighborhood Stabilization Program funding, and such other resources as are or may become available to address this objective. In addition, SHRA is the agency primarily responsible for establishing and maintaining housing and mortgage counseling programs in the region, and for developing new homeownership initiatives.
Recommendation: The AI consultant believes that, inasmuch as the foreclosure crisis amounts to an Impediment to Fair Housing Choice, SHRA should routinely evaluate the racial/ethnic impact of the programs it designs and implements to address the crisis, and should, to the maximum extent permitted by law, seek to ensure that minorities receive the benefit of these initiatives to an extent commensurate with the impact the crisis has had on their communities.

8
CHAPTER 2. DEMOGRAPHIC PROFILE
Overview
Sacramento County was incorporated in 1850 as one of the original 27 counties of the State. It encompasses approximately 994 square miles in the middle of the 400 mile long Central Valley, California’s prime agricultural region. The County is bordered by Contra Costa and San Joaquin Counties to the south, Amador and El Dorado Counties to the east, Placer and Sutter Counties to the north, and Yolo and Solano Counties to the west.
The County’s largest city, Sacramento, is both the State Capital and the County seat. As a key government center, Sacramento is regarded as the center of decision-making in the State of California. The region’s leading institutions of higher learning, including California State University at Sacramento and the University of California – Davis, offer programs in business, law, medicine, and many other specialized disciplines. The Sacramento region also has five community colleges, several private institutions of higher education, and numerous vocational and training programs.
In addition to being a major government employer, the Sacramento region is home to high tech manufacturers, software developers, biotechnology research laboratories, food processors, medical equipment manufacturers, call centers, and distribution facilities. Throughout the first two-thirds of this decade, moreover, new housing construction has formed a major component of the region’s employment picture. Sacramento is also a major transportation hub, served by an air cargo airport, an international airport, a deep- water shipping port, two major interstate freeways, freight and passenger rail lines, and an extensive regional commuter bus and light rail system.
Between 2000 and 2010 the County’s population grew from 1,223,499 to 1,418,788, a 15.9% increase. Much of this growth was due to a migration from the Bay area by persons and households seeking more affordable single-family housing and wider job opportunities. Between 2007 and 20010 strong population growth continued throughout the County. This most recent period, however, has been markedly different from the era of growth which preceded it. A virtual implosion in the housing market in the past 3 years, and the deep economic recession which it engendered, has dramatically affected the economy of the State, with the Sacramento region and the entire Central Valley especially hard hit. The extent to which these circumstances have affected population trends is yet to be measured, but is likely to be significant.
Racial and ethnic data
Sacramento County
Sacramento County as a whole, and the three incorporated cities which are the principal focus of this report, each grew in population between 2007 and 2010. The racial and

9
ethnic composition of these jurisdictions, and the respective growth rates of the racial and ethnic groups, however, varied considerably.5
For all of Sacramento County, the population grew by approximately 82,000, a growth rate of 7.6% in this period. Essentially all of this growth, however, was attributable to increases in the County’s minority population. The County’s white non-Hispanic (hereinafter “white”) population actually declined by nearly 11,000, or 1.8%, and fell from 56.2% of the total in 2000 to a bare majority of 51.3% in 2007. At the same time, the County’s Hispanic, Asian, and Black populations all experienced dramatic growth. The Hispanic population rose from just under 179,000 to more than 235,000, a 31.6% growth rate, raising the Hispanic share of the County’s population from 16.6% to 20.3%. The Black population rose from 113,000 to 142,000, a 25.8% increase. And the Asian population increased from 119,000 to 174,000, a 46.4% growth rate. See Figure 2.1.
Sacramento County
2000
%
2010
%
Growth Rate
Total
1,078,444
100.00%
1,418,788
100.00%
31.50%
White
606,595
56.20%
887,564
62.50%
35.00%
Hispanic
178,953
16.60%
306,196
21.50%
71.30%
Asian
119,170
11.10%
241,160
16.90%
70.30%
Black
112,658
10.40%
178,580
10.40%
40.00% FIGURE 2.1
City of Sacramento
Data for the City of Sacramento demonstrates a pattern similar to that of the County. The City’s total population grew by approximately 44,000, or 10.9%, between 2000 and 2007. The white population, however, grew by only 4,000 (2.5%), and dropped from 40.5% to 37.5% of the total. The City’s Hispanic population rose from 88,000 to 111,000, a 25.8% growth rate; Asians increased from 68,000 to 95,000, a 40.3% growth rate; and Blacks rose from 63,000 to 71,000, a 12.6% increase. The combined share of the City’s population for these 3 minority groups thus rose from 53.7% in 2000 to 61.2% at the end of 2007. See Figure 2.2.
5 Except where expressly noted otherwise, all references to Sacramento County, or “the County,” and all County data
presented in the accompanying Figures, is exclusive of the cities of Citrus Heights and Elk Grove. These two incorporated cities are
outside SHRA’s oversight and administrative responsibilities in the Community Development Block Grant program.

10
Sacramento City
2000
%
2010
%
Growth Rate
Total
407,018
100.00%
466,488
100.00%
14.60%
White
164,974
40.50%
210,006
45.01%
27.30%
Hispanic
87,974
21.60%
125,276
26.90%
42.40%
Asian
67,635
16.60%
85,503
18.32%
26.20%
Black
62,968
15.50%
68,335
14.60%
8.50% FIGURE 2.2
City of Folsom
In Folsom the data tells a very different story. This city, just east of Sacramento, experienced a total population growth far in excess of what occurred in most other areas of the County. Folsom’s population jumped from just under 52,000 in 2000 to nearly 75,000 by the end of 2007, a huge 44.2% growth in 7 years.
Folsom is one of the region’s more affluent and expensive areas, and its population was, and remains, markedly whiter than the County as a whole. In 2000, 38,500 of the City’s population was white, a 74.2% share of the total. The white population rose to just over 52,000 by 2007. Although this figure constituted a slight decline in the white population’s share of the City total, it also amounted to a significant 35.4% growth rate in the white population. The City of Folsom’s white population increase of nearly 14,000 stands in stark contrast to the overall decline in the white population for the entire County during this same period.
At the same time, the City’s minority populations were also rising, albeit from much smaller base numbers. Thus, the City’s Hispanic population rose from 4,900 to 6,600 (a 33.8% growth rate); Blacks increased from 3,100 to 5,500 (78.2%); and Asians grew from just over 3,700 to over 9,900 (a whopping 166.4% growth rate). As a result, these 3 minority groups, which accounted for 22.7% of the City’s population in 2000, claimed a combined 29.5% share of the total by 2007.6 See Figure 2.3.
6 One fascinating aspect of Folsom’s population data is the distribution between males and females in the City. According to Census data, males comprise 57.4% of the population, while females are only 42.6%. It is suspected that this unusual differential is largely due to inclusion of the inmate population of Folsom State Prison in the Census data. That institution has approximately 7,000 male prisoners. Subtracting that figure from the total reported male population would result in a much more balanced male to female ratio for the City. Telephone Interview with Amy Feagens, Director, Folsom Housing and Redevelopment Agency, August 6, 2009. This is a question for which SHRA and City agencies should seek a clear answer. If the prison’s population is, in fact, counted in the Census data for the City, this has potential implications for all uses to which the City’s demographic data and statistics are applied, including, e.g., program eligibility, housing planning, and affordable housing targets.

11
Folsom
2000 % 2010 % Growth Rate
Total
51,884
100.0%
72,203
100.0%
39.20%
White
38,500
74.2%
53,627
69.7%
39.30%
Hispanic
4,914
9.5%
8,064
8.8%
64.10%
Asian
3,731
7.2%
9,000
13.3%
141.00%
Black
3,109
6.0%
4,140
7.4%
33.20% FIGURE 2.3
City of Galt
The City of Galt is located on State Highway 99 at the southern end of the County in a largely agricultural area. Its population is made up primarily of white and Hispanic
households. Between 2000 and 2005-2007 the City grew by 17%.7 Almost all of the growth, however, occurred in the Hispanic community. The white population is estimated to have risen by barely 200 persons, or just 1.7%. Hispanics, on the other hand, accounted for an increase in excess of 3,000, a 46.5% growth rate. Asians and Blacks constitute a much smaller percentage of Galt’s population than they do elsewhere
in the County. Asians account for 2.8%, and Blacks 2.3%, of the City’s total.8 See Figure 2.4.
Galt
2000 % 2010 % Growth Rate
Total
19,472
100.0%
23,647
100.0%
21.4
White
11,529
59.2%
15,639
51.5%
35.6
Hispanic
6,465
33.2%
10,113
41.6%
56.4
Asian
553
2.80%
815
2.8%
47.4
Black
225
1.2%
430
2.3%
91.1 FIGURE 2.4
7 The most current Census data for Galt comes from the Census Bureau’s American Community Survey (“ACS”) 3-year Estimate. This estimate is based on data collected between January 2005 and December 2007, and represents the average characteristics of the jurisdiction over the 3 year period. ACS’s 3-year estimates are based on a larger sample size than its 1-year estimates, but are, by definition, somewhat less current. ACS 1-year estimates are only available for geographic areas with populations over 65,000.
8 The City’s Black population, although still a very small component of the total, more than doubled in this period, from 225 to 504.,

12
Characteristics of the Population
Age
For the most part, the average age of Sacramento County residents closely mirrors national and State figures. The youngest populations live in Sacramento City and Galt, while the oldest population resides in Folsom. For the County as a whole and for each of the 3 incorporated jurisdictions the median age increased between 2000 and 2007, as was the case both nationally and in California.
The median age in Galt, however, is significantly younger than elsewhere in the County. This is likely due, in large part, to the City’s sizeable and growing Hispanic population. Hispanics typically have larger families and a high number of Hispanic youth would account for much of the age differential between Galt and the rest of the County. See Figure 2.5.9
Median Age
USA
California
Sacramento County
Sacramento City
Folsom
Galt
2000
35.3
33.3
33.8
32.8
35.9
30.6
2010
37.2
35.2
34.8
33
37.6
32.4 FIGURE 2.5
Income
Median household incomes varied widely throughout Sacramento County in 2000 and 2007. For the County as a whole median income in 2000 was slightly above the national figure, but well below that of the State. By 2007, the County’s figure was well above the national median, and was closer to, but still behind, the median for California.
Sacramento City and Galt, the incorporated jurisdictions with the largest percentage minority populations, had the lowest median household incomes. The City of Folsom, on the other hand, had a median income well in excess of both national and State figures.
All four jurisdictions, however, experienced significant growth in median household income between 2000 and 2007. Sacramento City, the jurisdiction with the lowest median household income, experienced the largest rate of increase, 34.6%. This growth rate in household income substantially exceeded the national and State growth rates (20.7% and 26.3%, respectively). The County as a whole saw a 30.1% growth in median
9 County data in Figure 2.5 is inclusive of Citrus Heights and Elk Grove.

13
household income, while the increases in Folsom and Galt were a more modest 19.5% and 23.1%. See Figure 2.6.10
Median
Household Income
USA
California Sacramento
County Sacramento
City
Folsom
2000
42,000
47,500
43,800
37,000
73,200
2009
52,175
60,392
56,799
50,381
92,427
Rate of Increase 2000 - 2009
24.20%
27.10%
29.60%
36.10%
26.20% FIGURE 2.6
Sources: U.S. Census 2009 American Community Survey 1-year estimate; ESRI, 2010 Note: Sac CMSA = Sacramento-Arden-Arcade-Roseville CMSA
Median income by racial and ethnic group, however, varied quite widely. As might be expected, white median household income was higher than the composite figure for each
area, with one exception.11 Blacks and Hispanics lagged behind, with median incomes well below the jurisdictional averages, especially in the County as a whole and in Sacramento city, where the majority of them resided.
2009 Median Income by
Race/Ethnic Group
Sacramento County
Sacramento City
Folsom
Galt
White 56799 54,254 90,090 63,370
Asian 62,128 53,402 95,506 44,079
Hispanic 47,331 44,831 104,698 51,281
Black 39,306 35,906 113,992 58,362
All Groups 56,799 50,381 92,427 57,511 FIGURE 2.7
10 County data in Figure 2.6 is inclusive of Citrus Heights and Elk Grove. The median household income for the County exclusive of these two cites is undoubtedly somewhat lower, inasmuch as the median for Elk Grove was substantially higher than that of the County as a whole in both 2000 and 2007.
11 In Folsom, the group with the highest median income in 2000 was Asians, at $89,500. Whites were slightly below the city-wide average of $73,200, at $71,700.

14
Families in Poverty
The persistence of a high level of poverty continues to present a challenge to all social service agencies in Sacramento County. Between 2000 and 2007 Census data suggests that modest progress was achieved in reducing the overall level of poverty in the County, with particularly good results reported for Sacramento City, SHRA covered jurisdiction with the highest poverty index. In 2000, 15.3% of all Sacramento City families were in poverty. By 2007 that percentage had decreased to 10.6%, a very substantial 30.7% improvement. While the City’s 10.6% poverty figure still exceeded the County’s overall percentage (9.1%) and that of the State (9.3%), the degree of improvement nevertheless represents a major accomplishment, and hopefully one that can be built upon.
Percentage of Families in Poverty
USA
California
Sacramento County
Sacramento City
Folsom
Galt
2000
9.2%
10.6%
10.30%
15.3%
2.6%
8.50%
2010
9.5%
13.20%
13.20%
16.50%
3.70%
11.20% Percentage of
Change
0.30%
2.60%
2.90%
1.2%
1.1%
2.70% FIGURE 2.8
The level of poverty in 2000, however, was much higher among racial and ethnic minorities than it was in general. Asians and Hispanics had approximately one and a half times the overall rate, while Blacks had almost double the county-wide percentage. Data on poverty by racial and ethnic groups was not available from Census for 2007,
Family Poverty Status by
Racial/Ethnic Group 2010 Census
Racial/Ethnic Group
Sacramento County
Folsom
Galt
Sacramento
White
10.4%
3.8%
7.8%
8.90%
Black
22.6%
7.7%
0.0%
20.20%
Asian 14.9% 1.7% 4.1% 12.80%
Hispanic 18.2% 3.8% 18.7% 15.50% FIGURE 2.9
It is likely to be the case in the immediate future, however, that the struggle with poverty will intensify. In an article published in 2004, Robert G. Mogull, California State

15
University, Sacramento, observed that poverty rates and numbers for Asians (including Pacific Islanders), Blacks, and Hispanics had “exploded” in the Sacramento region between 1969 and 1999. Among Asians, the rise in just 2 decades, from 1979-1999, “was
a phenomenal 474%.”12 Black poverty swelled 189% over 3 decades, and Hispanics experienced a numerical increase in persons in poverty of 299% between 1969 and 1999.13 Looking ahead, Mogull projected that poverty would increase overall in Sacramento County from 14.1% in 1999 to 16% in 2009, with Asian poverty actually decreasing 15% (from 29,000 to 25,000), while Blacks experienced a 9% increase, and Hispanics a 56% jump, from 37,000 to 59,000 people, or almost half of the total increase
in persons in poverty within the County, during this decade.14
The severe economic downturn and high unemployment rates of the past 3 years can only have served to worsen the circumstances of those families and households on the edge of financial distress. This fact represents a daunting challenge for County, city, and SHRA
officials going forward.15
Poverty in Female-Headed Families with Children
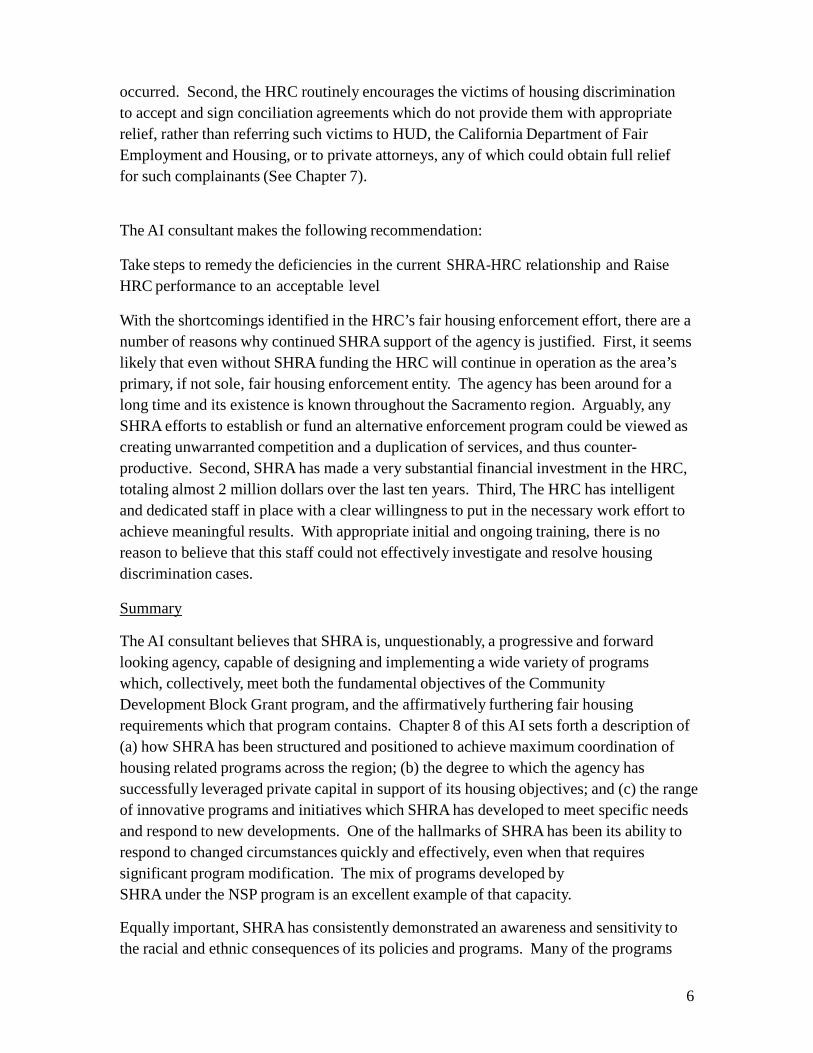
Perhaps the most distressing data regarding poverty in Sacramento County is that relating to female-headed families with children. This sub-group invariably comprises a disproportionate share of all families in poverty, for a number of reasons. Poorer women with minor children are far less likely to find gainful employment compatible with their child care responsibilities; adequate and affordable day-care facilities for poorer families are often lacking; home-bound women cannot readily participate in job training programs; etc.
Typically between a quarter and a third of all such families live below the poverty level. The data for Sacramento County follows this general pattern, although the figures do vary considerably by jurisdiction. One positive sign is the fact that for the County overall, and for Sacramento City, the percentage of female-headed families with children living in poverty did decline between 2000 and 2007. See Figure 2.1016.
12 Mogull, Robert G., County Poverty: The Case of Sacramento, Journal of Applied Business Research, Spring 2004, Vol. 20 Issue 2, pp. 51-62. Although Mogull predicted a decline in Asian poverty levels through the end of the decade, a separate study by researchers at Sacramento State University in 2006 found that Asian/Pacific Islander poverty in Sacramento City was twice the level in the rest of California, with one in four Asians/PIs in the City living in poverty. This study also found that the number of Asians in Sacramento receiving public assistance was three times higher than elsewhere in the State. Perhaps most compelling was the conclusion that this ethnic grouping constituted almost a fourth of all residents in Sacramento city, thus rendering the poverty data even more relevant and alarming. Fong, Timothy P., and Kim-Lu, Greg, Asian and Pacific Islander Americans in Sacramento: A Community Profile , 2000 and Beyond, May 2006.
13 Mogull, at 56-57. 14 Id., pp. 60-61 15 County data on the percentage of families in poverty also is inclusive of Citrus Heights and Elk Grove. The percentages
were lower in these two cities, and therefore it must be assumed marginally higher in the rest of the County. 16 Again, the County data in this Figure is inclusive of Citrus Heights and Elk Grove. And again, the percentages were lower in these two cities, meaning that the actual percentage for the rest of the County was somewhat higher.
16
Percentage of Female-headed Families with Children in
Poverty
USA
California
Sacramento County
Sacramento City
Folsom
Galt
2000
34.30%
32.50%
29.90%
35.00%
13.80%
2009
47.90%
40.10%
44.30%
47.80%
53.00%
38.20% Percentage of
Change 13.00%
7.60%
14.40%
12.80%
39.20%
FIGURE 2.10
Sacramento City experienced a significant decline, from 35% to 30.4%. Still, the fact remains that poverty in this sub-group is a largely intractable problem. Moreover, it appears from the Census data to be a growing problem, in that such families are not only a substantial, but an increasing, percentage of all families in both the County as a whole, and in Sacramento City. See Figure 2.11.
Female-headed Families with Children
as a Percentage of Total Family Population 2010Census
California
Sacramento County
Sacramento
Folsom
Galt
8.50%
9.10%
12.50%
2.70%
5.10% FIGURE 2.11
Employment
It would be difficult to overstate the dimensions of the unemployment crisis currently enveloping the Sacramento region. The raw numbers are daunting. For Sacramento County as a whole the U.S. Department of Labor placed the unemployment figure at 11.8% in June of 2009.17 This figure was up sharply, from 8.8%, just six months earlier. As a comparative measure of the impact which this level of unemployment must be having on the region’s economy, it is worth noting that at no time from the beginning of 1999 through June of 2008 did the unemployment figure for the County ever reach as high as 6.5%.
The data for the City of Sacramento is even more distressing. There the unemployment figure was estimated at 13.8% in June 2009, up from 10.4% six months earlier, and 8.4% in June 2008. By comparison, the June 2009 unemployment figures for Folsom appear
17 U.S. Department of Labor, Bureau of Labor Statistics (“BLS”), Local Area Unemployment Statistics (“LAUS”)
database, Sacramento County, August 1, 2009 (preliminary). BLS data covers the entire County, including Citrus Heights and Elk Grove.

17
moderate, at 5.4%. Still, even in this apparent bastion of economic security, this figure represents more than a doubling of the City’s historical unemployment rate, which averaged 2.6% or less annually from 2000 through 2007.
The relationship between the virtual collapses of the Sacramento region’s once expanding housing market and the area’s current unemployment crisis is starkly apparent from data on employment in the construction trades. The U.S. Department of Labor estimated that this one employment sector experienced a 23.1% decline in jobs in just one year, between
June 2008 and June 2009.18 And, from the peak of the housing construction boom in mid-2005 through June 2009, this one sector saw a job loss of over 30,000, from 76,500 down to just 45,000.19 This amounts to more than a 41% job loss in 4 years.
Additionally, it would appear that the true depth of the private sector unemployment problem facing the Sacramento region is, to a considerable extent, masked by the unusually high number of individuals employed in the public sector and health care fields. In the Sacramento-Arden/Arcade-Roseville region, with a civilian labor force of just over one million, employment in government alone accounts for 242,000 jobs, with an additional 103,000 positions in education, and health care. Together, these sectors account for 345,000 jobs, or more than a third of all employment in the area. While employment in these fields has remained stable (even growing slightly in the last year), the remainder of the private sector has absorbed the full brunt of the economic recession, with over 123,000 unemployed workers out of the remaining 714,000 in the labor pool, a staggering 17.2% private sector unemployment rate.20
Summary
Equal housing opportunity, fair housing choice, and wider housing affordability in a community obviously can never be properly evaluated without taking into account the overall economic and social conditions prevailing in that community. In the case of the Sacramento region, the demographic, poverty, and employment data summarized in this chapter strongly suggest that further progress on the fair housing/affordable housing front will be difficult if not impossible to achieve until the region’s economy, and particularly its employment picture, begins to recover.
From the standpoint of possible courses of action which SHRA might consider to address this issue the AI consultant offers the following single observation. Both SHRA’s long and short term planning documents seem to indicate that use of CDBG funds for programs designed to promote and/or stimulate employment and economic development has been constrained in recent years largely because “CDBG economic development
2009. 18 U.S. Department of Labor, BLS, “Economy at a Glance” Tables, Sacramento, Arden-Arcade, Roseville, August 18,
19 Id. 20 Id.
18
requirements are administratively and programmatically challenging, and therefore CDBG funds will be used as an economic tool on a relatively limited basis.”21
Without in any way suggesting that the administrative and programmatic limitations SHRA refers to are easily overcome, it is nevertheless clear that, in the past, and to some extent even today, some CDBG programs have served to promote employment and economic development, either on their own, or in tandem with other federal, state and local programs. Perhaps, given present economic realities, a reconsideration or course correction in thinking in this regard is in order at SHRA, so that CDBG resources can play a larger role in the area’s long-term economic recovery.
21 See, e.g., City of Sacramento, Consolidated Plan, 2008-2012, at 52.

19
CHAPTER 3. HOUSING PROFILE
Overview
Fair housing choice depends, as much as anything else, on the availability, and affordability, of all housing types in a region, for households and families of all sizes and income levels. The 2004 AI identified the shortage of affordable rental housing units, especially for larger low- income households, as a concern. That report also noted that while the Sacramento region generally offered relatively low-cost housing, not all groups benefitted, since much of the affordable housing was for sale, and was priced well beyond the means of most lower-income families.22
The entire Sacramento region has undergone a roller-coaster experience vis-a-vis housing in this decade. The early and middle years were marked by a tremendous upsurge in new single-family home construction, and a dramatic rise in the price of both new and re-sale homes, and rentals, throughout the region. On average, the value of single-family homes more than doubled in virtually all areas of the County, in the space of just five years. The mortgage market excesses which fueled much of this growth, however, also ultimately precipitated a national economic downturn and housing market collapse, both of which are still unfolding. No part of the country has been hit harder by these events than the central valley of California and the Sacramento region.
This chapter, and the next, will revisit these access and affordability issues; examine the overall growth in the housing stock throughout the unincorporated County and the cities of Sacramento, Folsom, and Galt since 2000; assess the impact of the City and County of Sacramento Public Housing Authorities; and attempt to consider, at least preliminarily, the impact of the current economic recession and escalating single-family housing crisis on the overall housing choice environment.
Housing Stock
Sacramento County
County-wide, total housing stock grew by between 10.2% and 11.3%, or approximately 45,000 housing units, in the period between 2000 and the end of 2007.23 The overwhelming majority of these new housing units were single-family dwellings. Increases in the number of housing units located in multiple-dwelling structures also occurred, but to a lesser extent, amounting to approximately 13,000 units. While the
22 2004 Analysis of Impediments to Fair Housing Choice (2004 AI), 2-1. 23 Much of the housing data in this chapter is drawn from two agency sources, the U.S. Census Bureau (“Census”), and the
California Department of Finance (“CDF”). While the estimates of the two agencies generally closely align, there are notable exceptions. These differences are pointed out in footnotes, as appropriate.

20
number of housing units in multiple-dwelling structures cannot be equated with the number of new rental units available on the housing market, since a significant percentage of such multiple-dwelling units likely are condominiums or cooperatives, it is fair to say that any growth in the rental housing market is largely subsumed in this 13,000 unit figure.24
Growth in Sacramento County
Housing Stock
U. S. Census
California Dept. of Finance
Type
2000
2005-2009
% Change
01/01/01
01/01/10
Single Family
288,800
391,958
35.70%
287,400
391,958
2-4 Units
32,900
37,052
12.60%
32,800
37,052
5 + Units
86,000
111,401
29.50%
87,000
111,401
Mobile Home
12,300
15,797
28.40%
13,300
15,797
Total
420,000
556,208
32.40%
420,300
556,953 FIGURE 3.1
Renter – Owner-occupied Comparison
In 2000, 172,200 rental households comprised 42.9% of all occupied housing units in the County. By 2007, 173,100 such households constituted 40.8% of all occupied units. The very modest growth in the total number of renter occupied units in the County would appear to suggest that the increase in the County’s multiple-dwelling housing stock during this period was more than sufficient to accommodate any increased demand for rental housing. On an across-the-board basis this may, to a certain extent, be true. It must also be noted, however, that the total number of renter occupied housing units in both 2000 and 2007 significantly exceeded the total number of housing units in multiple- dwelling buildings. Thus, in 2000 there were approximately 119,000 housing units in multiple-dwelling buildings. Even if all of these units were occupied as rentals (and, as noted above, this surely cannot be the case), a very sizeable segment of the County’s renter population (well in excess of 50,000 households) would have been leasing single- family properties. And, notwithstanding the increase in multiple dwelling units to
24 While the total estimated number of multiple-dwelling units in the County is close in both the Census and CDF reports, the two agencies do differ considerably on the size of the buildings in which those units are located. Census showed a dramatic (26.4%) growth in the number of units in buildings with 2-4 dwellings, and a much smaller (5%) growth in units in buildings with 5 or more dwellings. CDF, on the other hand, estimated virtually no growth in the number of units in structures with 2-4 dwellings, but a 14.9% growth rate in units located in buildings with 5 or more dwellings. Similar disparities exist in the two agencies’ respective estimates on this point for the cities of Sacramento, Folsom, and Galt. See Figures 3.2-3.5.

21
approximately 130,000 by 2007, a very sizeable segment of the County’s 173,000 rental households would still be forced to rent single-family homes as of that date. As will be discussed more fully in the next chapter on Affordability, a rental market which drives a substantial segment of the rental population into single-family housing has potentially serious implications for those at the lower end of the economic spectrum.
Percentage of Total Housing Stock
2010
County Sacramento Folsom Galt California
Single Family
70.40%
65.60%
74.10%
84.30%
58.10% Multi
Dwelling
26.60%
32.30%
22.30%
10.70%
41.90% FIGURE 3.2
It is also interesting to note the fact that while the County’s total housing stock grew by approximately 70,000 units between 2000 and 2007, the number of occupied housing
units in that period increased by less than 50,000.25 These figures are reflected in the County’s overall vacancy figures and percentages. In 2000, the County had 21,200 vacant units out of 474,800 total units, or a composite (rental and homeowner) vacancy rate of 4.5%. By 2007, the number of vacant units stood at 44,600 out of 548,000, or 8.1%. The rental vacancy rate had jumped from 4.8% to 8.8%. This data constitutes one indication of the widespread housing downturn, which began in earnest in 2007.26
City of Sacramento
The City of Sacramento, as might be expected, has the oldest housing stock in the County. Over 62% of the housing in the City was built before 1980. Insofar as the age of housing is an indicator of the need for rehabilitation and repair, this is an important statistic. The City also has, by far, the highest proportion of rental households in the region. Almost half (47.6%) of all households in Sacramento City are renters.
The City’s total housing stock increased at a somewhat faster rate than did that of the County as a whole between 2000 and 2007. As was the case elsewhere in the region, most of the growth in housing occurred in the single-family arena. Both Census and CDF reported an increase of approximately 18,000 single-family properties in the City, compared to between 7,400 (Census) and 9,200 (CDF) new units in multiple-dwelling
25 These figures, and the data in the rest of this paragraph, are inclusive of the cities of Citrus Heights and Elk Grove. 26 It has been pointed out that much of the boom in single-family housing in the first two-thirds of this decade was driven
by Bay Area investors, and that once the downturn began, many of them would be attempting to rent these properties, presumably at market rates, but also at generally affordable rents given the overall state of the housing market. Written comments of Geoffrey Ross, SHRA. This observation points to the obvious difficulty in accurately measuring housing choice and affordability in the current economic environment. It is entirely possible that many single-family properties, typically more expensive than apartments, are, in fact “affordable” to many moderate-income, and even some low-income, households.

22
buildings. This 2 to 1 ratio in favor of single-family new construction is strikingly inconsistent with the tenure data applicable to this City, where nearly half of all households remain renters. It is suggestive of both an ill-planned single-family housing boom and a gradual process of gentrification in this urban center.
It is also noteworthy that the approximate 16% growth in housing units of all types significantly outpaced the City’s 11% population growth. To the extent more new housing was built than was needed to accommodate the increase in population, a glut was likely created which, in today’s depressed housing market, undoubtedly contributes to the general devaluation of residential properties in the City.
Sacramento
City
U.S. Census
Calif. Dept. of Finance
Type
2000
2005-2009
% Change
01/01/01
01/01/10
Single Family
107,200
125,400
16.90%
108,500
127,660
2-4 Units
15,900
19,565
23.00%
15,900
16,277
5 + Units
37,200
42,323
13.70%
37,300
47,823
Mobile Home
3,400
3,367
-0.90%
3500
3,686
Total
163,600
190,672
16.50%
165,400
192,400 FIGURE 3.3
City of Folsom
Folsom, just east of Sacramento, is one of the County’s fastest growing and most affluent cities. Between 2000 and the end of 2007 the City’s housing stock increased by more than 8,000 units, while the population grew by approximately 23,000 (44.2%). As an affluent bedroom community, the vast majority of Folsom’s housing is single-family. The 2004 AI noted that there was a “significant imbalance between need and supply of very low and low income housing” in Folsom, and further observed that almost all of the City’s planned affordable housing was set aside for seniors housing, with almost no units
planned for low income families.27 This is still the case.
Limited progress appears to have been made since then. While still a very small component of the City’s overall housing stock, units in multiple-dwelling buildings have increased dramatically since 2000. Census estimated the increase at 2,500 units, or an
27 2004 AI, 10-8.

23
83% rise. CDF showed a similar increase from a slightly larger base, for a 64% jump. Virtually all of this housing, however, appears to be market rate. The City’s enactment of an inclusionary zoning provision in 2002 (see chapter 5) has the potential to spur development of some additional affordable units.
Folsom
U.S. Census
Calif. Dept. of Finance
Type
2000
2005-2009
% Change
01/01/01
01/01/10 Single Family
14,000
19,400
38.6%
14,800
19,100
2-4 Units
600
1,100
83.3%
600
816
5 + Units
2,400
4,400
83.3%
3,300
4,909
Mobile Home
900
900
0.0%
900
890
Total
17,900
25,900
44.7%
19,600
26,200
FIGURE 3.4
As a result of the statistically significant increase in multiple-dwelling units in Folsom since 2000, the percentages for single-family homes and owner-occupied units in the City both fell slightly between 2000 and 2007, bucking the trend elsewhere in the County. Nevertheless, the figure for both of these categories remained well over 70%.
Because of its incredibly rapid growth in the past two decades, Folsom also has one of the youngest housing stocks in the County. Only 14.6% of Folsom’s housing was built prior to 1980.
City of Galt
Galt is a small city at the southern boundary of the County straddling State Highway 99. Between 2000 and 2005-7, Census estimated that Galt’s population rose by slightly over 3,000, or 17%. During this period Census and CDF estimated an increase in the City’s single-family housing stock of approximately 1,100-1,200 units, bringing the total number of single-family dwellings in the City to between 6,300 and 6,400. By comparison, the total number of units estimated to exist in multiple-dwelling buildings was somewhere between 600 and 800.28
28 This is another example of where Census and CDF differed considerably. Census estimated an actual decline in the number of units in multiple-dwelling buildings in Galt between 2000 and the 2005-7 period. CDF, in contrast, estimated that the number rose by approximately 200 units, or 33%, between 01/01/01 and 01/01/08.

24
Galt
U.S. Census
Calif. Dept. of Finance
Type
2000
2005- 2009
% Change
01/01/01
01/01/10
Single Family
5,100
6,674
23.5%
5,300
6,500
2-4 Units
300
160
-33.3%
300
300
5 + Units
300
277
0.0%
300
500
Mobile Home
400
356
-25.0%
400
400
Total
6,200
7,100
14.5%
6,300
7,600
FIGURE 3.5
The data on Galt’s housing stock shows the City to be even more heavily tilted toward single-family dwellings, and homeownership, than is true for the far more affluent Folsom. Indeed, fully 88.5% of Galt’s housing is single-family (up from 83.3% in 2000), while barely 6.7% is comprised of units in multiple-dwelling buildings (down from 11% in 2000). Moreover, it would appear from the available data that, at least as of the 2005-7 period, virtually all of the single-family properties in Galt were owner-occupied. Only 16.4% of Galt households were renters (down from 20.5% in 2000).
When this housing data is compared to the demographic profile on Galt in Chapter 2, a red flag arises. As noted in Chapter 2, essentially all of Galt’s population increase since 2000 occurred in the Hispanic community. Thus, the seemingly inescapable supposition would be that Hispanic households constituted the overwhelming majority of Galt’s new homeowners during this period. Inasmuch as Galt is not an especially affluent community, and in light of the fact that data from a variety of sources documents the fact that minorities were overwhelmingly targeted for subprime loans in the region during this same time period, it would seem a worthwhile exercise for SHRA to closely examine the mortgage loan experiences of Galt’s Hispanic homeowners during the housing boom, and since the beginning of the housing downturn and foreclosure crisis.29
Age of the Housing Stock
The housing in the County as a whole and in the 3 cities of Sacramento, Folsom and Galt is younger, on average, than is the housing stock of California, and, with the exception of
29 It is, of course, entirely possible that a significant portion of the newly constructed housing in Galt was purchased by white Galt residents who were “moving up,” and who then sold their existing homes to Hispanics. But whether Hispanics were purchasing primarily re-sales, a mix of re-sales and new homes, or mostly newly constructed homes is less relevant than the fact that they were, in very large numbers, entering the mortgage market during a period which coincided with the widespread use of subprime loans and alternative mortgage products.

25
Sacramento city, the nation. Still, most of the housing in Sacramento city was constructed prior to 1980, and this constitutes a basis for vigilance, as age is typically a bellwether for necessary repairs and preventive maintenance.
Age of Housing Pre 1980 Construction
U.S.
59.8%
Sacramento County
56.4%
Folsom
44.00%
California
63.8%
Sacramento City
62.6%
Galt
30.80%
FIGURE 3.6
The Public Housing Authorities
There are two public housing authorities (“PHAs”) covering the jurisdictions which are the subject of this report, the Sacramento City PHA and the Sacramento County PHA. However, for all intents and purposes these two separate legal entities function as one; they are both administered under the overall direction of SHRA, they use the same waiting lists, and their conventional housing units, housing vouchers, and other programs are generally open to all income eligible residents of the County.
The PHA Housing Stock
As of January 2009, the County and City PHAs together administered 3,083 units of conventional public housing. This figure has been decreasing gradually throughout the
past four years. In January 2005 the total stood at 3,177.30
Most of the conventional housing units are 2 bedrooms or smaller. Out of a total of 3,077 units for which bedroom size was reported, 1,989, or 64.6%, were 2 bedrooms or smaller. In general terms, this means that the conventional public housing stock in the County offers even more limited affordable housing opportunities for eligible low and very low incomes families in need of larger units than is the case for all others in these income groupings.
Moreover, it would appear that with ever diminishing federal resources to support and maintain public housing, the conventional housing program is slated to shrink even more dramatically in the immediate future, particularly in the City of Sacramento. The City PHA reported to HUD that it planned to dispose of 509 units, comprising fully 25% of its
30 PHAs’ consolidated response to the AI questionnaire, question A-1, received July 30, 2009.

26
total housing stock, in the near term.31 In response to the AI consultant’s inquiry regarding this large projected loss of subsidized housing the PHA responded:
“Sacramento Housing and Redevelopment Agency (SHRA) had an Asset Repositioning Study performed in 2007. The study was a proactive strategy to align SHRA operations to the current funding environment. The goals of the restructuring and/or repositioning of SHRA public housing assets are to reduce dependency on federal public housing funding and eliminate ongoing operating and capital deficits. The proposed disposition recommends the commitment of these sites to project-based vouchers, as well as potentially utilizing 4% low- income housing tax credits for the renovation.”32
Thus not all of this housing is destined to disappear as affordable units. Some of it is intended to be sold to eligible public housing residents and other eligible low income households who meet the PHA’s homeownership program requirements. Much of it also appears to be targeted for conversion to affordable private non-profit rental housing using a combination of low income housing tax credits to help spur renovation, and project- based vouchers to help maintain occupancy.33
Based on the Asset Repositioning Study, SHRA and the PHAs have essentially concluded that the best way to preserve and maintain as much affordable housing as possible is to create a non-profit corporation, the Sacramento Housing Authority Repositioning Program, Inc. (“SHARP”), for the purpose of serving as the general partner in whatever other entity, or entities, ultimately assume ownership of the “repositioned” PHA assets. This restructuring will enable SHRA and the PHAs to include other private sector resources in the ownership, rehabilitation and renovation of the affected properties. The key to maintaining affordability, and making the entire project viable, lies in HUD approval of the PHA’s application for project-based vouchers. The plan is to replace, on a unit for unit basis, federal Annual Contributions Contract (“ACC”) support for conventional units with ACC financing for project-based vouchers. According to the PHA, the stream of income attached to the latter form of federal support is significantly greater than that under the conventional public housing program, thus enabling SHRA to preserve and maintain these housing assets.34
Assuming HUD approval of all, or most, of the PHA’s application for project-based vouchers, this plan may well prove to be the best, if not the only, way to preserve and maintain existing PHA housing as affordable units. Still, the PHA concedes that the plan
31 City PHA 2009 Annual Plan, HUD Form 50075. Only 8 units in the County PHA’s stock are earmarked for disposition. County PHA 2009 Annual Plan, HUD 50075.
32 PHAs’ consolidated response to the AI questionnaire, question A-9. 33 It is not clear from the PHA’s response whether this aspect of the “repositioning” plan (i.e., “project-based vouchers”)
entails a new infusion of vouchers from HUD, or a reallocation of existing vouchers. In either case, this would be a signal departure from the traditional concept of vouchers serving as an instrument for wider housing choice for recipients.
34 Interview with Nick Chhotu, Sacramento City PHA, August 21, 2009.

27
would, at best, retain only approximately 80% of the current units at rents affordable to very low income households, with the remaining 20% either being demolished or
converted to housing with rents closer to market rate housing.35
In addition, the authorities report that almost a third of all conventional public housing,
993 units, are in need of substantial rehabilitation.36 Of these, 854 are presently occupied. While there may be some overlap between these units and those earmarked for disposition, the plain fact is that with decreasing federal support the likelihood of the PHAs rehabilitating many of these units in the near future is slim, and many may become uninhabitable over time, further reducing the PHAs’ total housing stock.
Tenant-Based Vouchers
Essentially all of the tenant-based vouchers in the County come under the auspices of the
County PHA.37 The County PHA reported a steady, but marginal, increase in the number of vouchers in the program from January of 2004, when there were 10,842 vouchers available, to January 2008, when the figure stood at 11,243. The vast majority of all vouchers are currently being utilized within Sacramento City. As of the end of May, 2009, 8001 out of approximately 11,000 vouchers currently being used in rental units were in this one jurisdiction (73%). It may be that rents are most affordable in Sacramento City, so that voucher holders find it easier to locate units there. It also may be that this City, with its generally progressive outlook, has more landlords willing to accept voucher holders. Still, the disproportionate voucher utilization within the region is an interesting phenomenon, and something SHRA may want to look at more closely.
It is also interesting to note the number of vouchers currently being utilized in Galt and Folsom. The latter city, with a population of approximately 75,000 had a total of 36 vouchers in use. Galt, with less than a third of Folsom’s population, had 60 vouchers in use. The sharply higher market rents in Folsom undoubtedly make it virtually impossible for most voucher holders to find affordable units in that city.
Based on numbers alone, vouchers comprise the lion’s share of the public housing program in the affected jurisdictions. There are almost four times as many vouchers in the program as there are conventional units, and, as the preceding discussion makes clear, the trends point to a further widening of that gap.
A-1.
35 PHA’s response to AI questionnaire, question A-11. 36 PHAs’ response to AI questionnaire, question A-5. 37 The City PHA reported no vouchers prior to 2009; 5 were reported in 2009. PHA response to AI questionnaire, question

28
Waiting Lists
The waiting lists demonstrate the fact that the combined total of conventional housing units and vouchers presently available to the PHAs are wholly insufficient to accommodate the needs of the community. Currently, both waiting lists are closed, and have been for some time. There are 10,299 families on the conventional waiting list, and 10,405 families on the voucher waiting list.38
Interestingly, the PHAs do not follow a policy of ordering their waiting lists by date and time of application. Instead, a computerized lottery system is in place which randomly selects qualified applicants. This allows families who apply on the last day a waiting list is open the same opportunity to obtain housing as those who apply the first moment a wait list is opened. Standard HUD endorsed preferences for displacement are also utilized.39
Race and Ethnicity in the Public Housing Programs
In broad terms the racial and ethnic composition of the PHAs’ 2 primary housing programs (conventional housing and vouchers) appears to reflect the wide diversity of the low and very low income population in the region. There are, however, some intriguing anomalies across program lines.
Perhaps the most striking of these is the relative share of both of the PHA housing programs currently flowing to the Hispanic community. As the demographic data in chapter 2 makes clear, this ethnic group is the largest minority population in the subject jurisdictions. As of 2007, it constituted over 20% of the entire population. Yet, Hispanics comprise just 14% of conventional public housing residents, and only 11% of all voucher holders. By comparison, black households, which make up approximately 12% of the total population, constituted almost 50% of conventional public housing residents, and 44% of voucher holders.40 It is worth noting in this regard that the City of Sacramento PHA’s own estimate of housing need placed Hispanic and black families much closer, with black families in need numbering 10,090 and Hispanic families 9,470.41
Why, then, such a disparity in program participation between the two minority groups? No single answer leaps out. It may be that, to a certain extent, these PHA programs predate the surge in the Hispanic population of the past 2 decades, but were well known to, and used by, the black community from their inception. If that is so, blacks may have “filled up” both programs before Hispanics learned of the opportunities they offered. It is
38 PHA’s response to AI questionnaire, question C-1. Many families are on both waiting lists, so the total number is not the sum of the two lists.
39 PHA’s response to AI questionnaire, question C-3. 40 PHAs’ separate (by program) responses to AI questionnaire, question D-1. The Asian community’s participation in
PHA housing programs appears to be much more in line with its 15% share of the total population; Asians comprise 9% of public housing residents and 14.5% of voucher holders.
41 City PHA 2009 Annual Plan, HUD Form 50075, p. 7.

29
also possible that a language barrier remains a factor, notwithstanding the PHAs’ efforts to ensure that information about their programs is accessible in Spanish. Possibly, Hispanics are less inclined to participate in government subsidized housing programs. Whatever the cause, it would certainly seem that the Hispanic community is not receiving a share of the PHA housing commensurate with its relative level of need or percentage of the population. This is an issue SHRA and the PHAs will want to examine in closer detail.
The PHAs’ Homeownership and Family Self-Sufficiency Programs
Homeownership
The PHAs have adopted a public housing homeownership program to sell part of their inventory of single-family homes to public housing residents, voucher recipients, and other low-income households. The authorizing legislation for these programs allows the PHAs to provide seller financing to ensure the homes are affordable to low-income buyers (households cannot exceed 80% of the area median income). The approved level of seller financing under this program is between 50% (for PHA residents, voucher recipients, and Family Self-Sufficiency graduates) and 35% (for other low-income households) of the market value of the home. The loans are below market rate (3%) interest for 30 years. The PHAs are also authorized to adjust the sales price of the homes in order to make them affordable to low-income families. Participants in the program may also avail themselves of SHRA’s other homebuyer assistance programs.42
According to data provided by the PHAs, 116 households have made the transition to homeownership from public housing or section 8 vouchers since 2004.43 The PHAs further report that between 40 and 50 voucher recipients are using their vouchers to make mortgage payments as homeowners.44
Family Self-Sufficiency
Family Self-Sufficiency (“FSS”) is a HUD program that encourages communities to develop local strategies to help housing authority families obtain employment that will lead to economic independence and self-sufficiency. The PHAs work with welfare agencies, schools, businesses, and other local partners to develop a comprehensive program that gives participants the skills and experience to enable them to obtain employment that pays a living wage. Seminars include credit counseling, homeownership opportunities, and tax assistance. Since 2004 the PHAs report a total of
42 See, e.g., City of Sacramento, 2006 Consolidated Annual Performance and Evaluation Report (“CAPER”), p. 21. 43 PHA response to AI questionnaire, question B-7. 44 PHA responses to AI questionnaire, questions B-3 and B-7. It is not clear how many of these voucher holders are direct
participants in the PHA homeownership program; some may have secured financing and homeownership assistance independently, and purchased properties outside the PHA inventory.

30
502 participants in this program.45 The exact number of graduates, however, is unclear. SHRA’s Annual CAPERs for 2004, 2006, 2007 and 2008 reported 10, 5, 19, and 5 graduates, respectively. The 2005 CAPER, however, reported 113 graduates, exactly the same as the number of participants for that year. This is, in all likelihood, a typographical error, inasmuch as the program graduated between 5% and 20% of its participants in each the other 4 years. It is also not entirely clear what “graduation” means in the context of the FSS program. In 3 of the 5 years the number of graduates equated to the number of participants finding gainful employment. In 2004, however, graduates were described as “seeking employment.” In any case, it appears from the available data that the program has more appeal to voucher holders than public housing residents. In 2004 and 2005 (the only years for which the distribution was reported) 225 voucher holders participated in the FSS program compared to just 15 public housing residents.
Summary
The Sacramento region has experienced a true boom and bust cycle in housing in this decade. After six years of unprecedented growth and expansion, the single-family housing market has ground to a halt in the past three years. Vacancy rates throughout the region are up in both single-family and rental housing, suggesting that, at least in general, in the private market, the overall supply of housing is more than sufficient to accommodate the needs of the region’s population.
At the same time, the two Public Housing Authorities administered under SHRA auspices have demonstrated a genuine commitment to preserving as much of their affordable housing stock as possible, utilizing a number of particularly innovative ideas in pursuit of this goal, such as the “SHARP” initiative. Nevertheless, and notwithstanding their best efforts, both authorities are likely to lose a significant portion of their conventional units to age and disrepair in the near term. The PHA s also actively promote and participate in homeownership programs for PHA residents and voucher holders, as well as the Family Self Sufficiency program.
From a racial/ethnic perspective, the one issue which the AI consultant believes deserves further SHRA/PHA scrutiny is the disparity in participation by Hispanics in the PHAs’ housing programs. The continued shortage of affordable rental housing for families in Folsom also remains an unresolved concern, evidenced, in part, by the low level of voucher usage in that jurisdiction.
45 City of Sacramento, 2004-2008 CAPERs.

31
CHAPTER 4. AFFORDABILITY
Overview
As a threshold matter, it must be noted that the speed at which housing market conditions have changed in the Sacramento region during the past 2 years renders it extremely difficult to extrapolate from any trends which appeared in Census and other data sources pertaining to housing stock and housing affordability between 2000 and 2007. In some instances the recent downturn in the housing sector has dramatically altered the affordability outlook, particularly in the homeownership sphere. The relative affordability of single-family rentals likely has also increased. This chapter will attempt to portray current affordability issues relating to both home-ownership and rental housing, with the housing downturn of the past three years as the background overarching factor.
In the context of any analysis pertaining to fair housing choice, the question of affordability is directly tied to an examination of how housing costs are impacting those who fall within the protected classes covered by the federal Fair Housing Act, specifically, racial and ethnic minorities. Because minority groups, particularly Hispanics and Blacks, comprise a disproportionate percentage of very-low and low income households, and a much higher percentage of households in poverty, any lack of housing affordable to these income groups also disproportionately affects them, and limits their housing choices.
Tenure
As the preceding chapter makes clear, the Sacramento region generally, as well as the specific jurisdictions and unincorporated areas covered by SHRA, are heavily tilted in favor of single-family housing. As the percentages in Figure 3.2 in chapter 3 demonstrate, the County as a whole, and the cities of Sacramento, Folsom, and Galt all have two-thirds or more of their total housing stock in single-family dwellings. The percentages of owner-occupied households and renter-occupied households, however, do not precisely mirror the housing stock data. While owner-occupancy constituted the majority of all households in both 2000 and 2007, the percentage of renter-occupied housing was higher than the percentage of units in multiple-dwelling buildings, across the board. As noted in chapter 3, this means that a very considerable portion of the County’s rental households had to have been living in single-family dwellings.

32
Housing Tenure
Sacramento County
Sacramento
Folsom
Galt
2007 2010 2007 2010 2007 2010 2007 2010
Owner- Occupied
59%
57%
52%
49%
76%
70%
80%
74%
Renter- Occupied
40%
43%
48%
51%
24%
30%
20%
26% FIGURE 4.1
To the extent that there are an insufficient number of apartment units in multiple dwelling buildings or complexes (i.e., dwelling units constructed for use as rentals), competition for such units tends to drive up, and maintain, the rental cost of those units that do exist. For larger households and families in particular, a limited supply of 3 and 4 bedroom apartments will drive many such households into the single-family rental market. All else being equal, the average rent for single-family properties is likely to be higher than that for apartments with the same number of bedrooms, for at least three reasons. First, single-family homes are typically larger than the average 3 bedroom apartment; second, the cost of utilities is likely to be greater on a per unit basis, when compared to similarly sized units in multiple dwelling structures; and third, single-family properties typically offer more amenities (more and easier parking, yard space, etc.) and can command higher rents accordingly. Statistically, these cost factors are more likely to negatively impact Hispanic, Asian, and Black renters, who, on average, have larger households, and lower incomes (See, e.g., Figure 2.7 in Chapter 2)..
2000 Household Size by
Race/Ethnicity
County
Sacramento
Folsom
White
2.43
2.17
2.56
Hispanic
3.29
3.26
3.12
Asian
3.37
3.43
2.92
Black
2.76
2.72
2.29
All
2.46
2.57
2.61 FIGURE 4.2
Based on 2000 Census data, there were very considerable differences in the owner-to- renter occupancy ratios among the various racial and ethnic groups. White households

33
exceeded the County percentage for owner-occupied dwellings, with a 62.5% owner- occupancy rate. On the other end of the spectrum, however, a significant majority of Black households and a clear majority of Hispanic households were renters. More than 60% of Black households were renters, as were 51% of Hispanic households. These figures stand in stark comparison to the county-wide renter percentage of just 41.8%.
2000 Census Tenure Data byRace/ Ethnicity
(To the Nearest 100)
Sacramento County
Own/ Rent
Sacramento City
Own/ Rent
Folsom
Own/ Rent
Galt
Own
2,015
62.5%
487
53.9%
115
77.2%
36
White
Rent
1,210
37.5%
417
46.1%
34
22.8%
9
Own
258
49.0%
112
45.5%
6-
74.0%
11
Hispanic
Rent
268
51.0%
134
54.5%
2+
26.0%
3+ Own
229
67.9%
108
54.8%
8
67.0%
1
Asian Rent
167
32.1%
89
45.2%
4
33.0%
0
Own
166
39.8%
84
37.8%
2
67.0%
x
Black Rent
251
60.2%
138
62.2%
1
33.0%
x
Own
2,638
58.2%
774
50.1%
131
76.2%
47
Total Rent
1,898
41.8%
772
49.9%
41
23.8%
12
FIGURE 4.3
The much higher percentages of renter households among Blacks and Hispanics was undoubtedly related, in large part, to the lower average income levels of these minority groups. As the data in chapter 2 makes clear, median income for Blacks and Hispanics in 2000 was considerably below the county-wide and individual jurisdictional averages, while poverty rates were dramatically higher. In short, below average incomes dictate that a majority of Black and Hispanic households must reside in rental housing.
Rental Housing Cost
Throughout the period between 2000 and 2007, rents rose dramatically in the County and the 3 cities covered by this report. Median rents ranged from a low of $604 in Galt to a high of $933 in Folsom in 2000. By 2007, median rents exceeded $900 in each jurisdiction, and had reached $1,251 in Folsom.

34
Median Rent 2000 - 2009
2000
2007
2009
Sacramento County
$659
$936
$858
Sacramento City
$625
$923
$846
Folsom
$939
$1,251
$1,155
Galt
$604
$906
$1,011 FIGURE 4.4
It is important to note that, in each jurisdiction, these increases in average rents significantly exceeded the rise in median incomes during the same period. Thus, rents in the County rose 42%, while median income went up just 30.1%; in Sacramento City rents jumped 47.7%, compared to a 34.6% rise in median income; in Folsom rent increases outstripped income growth by 33.2% to 19.5%: and in Galt, where the virtual absence of new rental housing placed any available rental units at a premium, rents increased by more than twice the rise in median income, or 50% to 23.1%.
Numbers such as these guaranteed that rents would constitute a “cost burden” for an ever
increasing percentage of renter households.46 And, because minority households made up a disproportionate percentage of renter households at the lower end of the income strata, that burden necessarily fell disproportionately upon them.
Percentage of Rental
Housing Cost Burdened Households
2000 2007
Sacramento County
40.9%
52.2%
Sacramento City
42.5%
49.9%
Folsom
33.3%
44.9%
Galt
41.2%
N/A FIGURE 4.5
46 Census defines any household paying more than 30% of its income for housing as “cost burdened.”

35
The increase in the percentage of rental households that were cost-burdened by 2007 must
concern SHRA officials and other government policymakers in the region.47 If these trends continue, the Sacramento area, once considered a lower cost housing alternative to the expensive Bay area and coastal regions in the State, may lose its appeal to any newcomers lacking the wherewithal to immediately purchase a home.
The unanswered question in assessing rental housing affordability in the Sacramento region, however, is this: what impact, if any, has the mortgage meltdown and subsequent implosion in the single-family homeownership housing market in the past 3-4 years had on rental housing availability, and cost? Logic would seem to dictate that the dramatic slowdown in the economy and the ensuing high unemployment rate, combined with a glut of unsold new homes, foreclosed and vacant (or soon to be vacant) single-family properties, and a high number of single-family homeowners facing foreclosure or otherwise in financial distress, ought to equate with a significant decline in rents throughout the region. Yet, from the limited data that is available, this does not appear to be occurring.
Zilpy.com is a national on-line rental data tracking service which calculates average rents by jurisdiction. While Zilpy does not provide “median” rents for an entire market, it does track rental cost by size of unit. As of August 17, 2009, Zilpy reported the average rent on a 1 bedroom unit in Sacramento County at $700, a 2 bedroom was $875, and a 3 bedroom cost $1,250. Average rents for the cities of Sacramento, Folsom and Galt were reported as shown in Figure 4.6.
Median Rents by Unit Size
(August 2009 - Zilpy)
Studio 1 Bedroom 2 Bedroom 3 Bedroom 4 Bedroom
# Units Average Rent
# Units Average Rent
# Units
Average Rent
# Units
Average Rent
# Units
Sacramento City
628
$600
3,500
$725
6,000
$940
5,000
$1,200
1,500
Folsom 10 $1,048 211 $995 395 $1,125 438 $1,595 232
Galt 0 $0 0 $0 22 $895 89 $1,350 21 FIGURE 4.6
47 The percentage of renter households that were cost burdened in California, and nationally, was also quite high. California’s figure was 51%, and the national average was just over 45%. But, the economic impact of being rental cost- burdened in the Sacramento region is likely more severe than it is in California as a whole. This is because the income remaining available after rent for other necessities will normally be less in the Sacramento region than in more affluent communities. For example, a California household with a $4,000 monthly income paying $1,400 per month in rent would certainly meet the definition of cost-burdened (i.e., paying 35% of its monthly income for rent). This household, however, would still have $2,600 per month remaining for food, clothing, fuel, utilities, and all its other needs. A Sacramento city household of the same size with a $3,000 monthly income paying the same 35% of its income for rent ($1,050) would also be cost burdened, but this household would only have $1,950 remaining for all its other needs. The smaller a household’s total income is the greater the impact of being “cost burdened” by rent becomes.

36
The sampling data in Figure 4.6 strongly suggests that the number of 3 and 4 bedroom rental units in each city significantly exceeds the number of studio and 1 bedroom units. Thus, for example, the Zilpy data for Sacramento was based on a sample size of more than 6,500 3 and 4 bedroom units but only just over 4,000 studio and 1 bedroom units (in addition to over 6,000 2 bedroom units). Based on this, the median rent for the city as a whole almost certainly lies between the average rent quoted for a 2 and a 3 bedroom unit. In Sacramento City the $940 average rent on a 2 bedroom unit, by itself, exceeds the median rent Census reported for the City as a whole in 2007. In Folsom, even a slight adjustment upward from the 2 bedroom average of $1,125 (say, one-third of the difference between the 2 bedroom figure of $1,125 and the 3 bedroom figure of $1,595, or $150) would bring the median rent for Folsom as a whole over the figure reported by Census in 2007. And the figures for Galt, where rental units are scarce, point upward even more dramatically.
The key point here is that, at least as of August 2009, the Zilpy data would seem to strongly suggest, against all odds, that rental housing cost has proven impervious to the general economic downturn and homeownership/foreclosure crisis which has enveloped the region since 2007 (not to mention the 8.8% rental vacancy rate which Census reported for the County in 2007). Why this should be so is not at all clear. Part of the answer may lie in the fact that there are so many more rental households than traditional multiple-dwelling apartment units throughout the region. Where demand for a particular product remains high, even in an otherwise depressed economy, the price of that product may remain stable or even increase. It is further possible that the drop-off in homeownership occasioned by the foreclosure crisis has actually added a sizeable number of households to the rental market – former homeowner families now competing for rental units. Moreover, because single-family properties comprise a significant component of the rental market in the region, and command generally higher rents, it is also possible that this “higher end” rental housing is propping up rents overall.
It is beyond the scope of this report to identify a comprehensive explanation for this phenomenon. If, however, it is a fact that rents are remaining stable or even increasing in the current climate, this should be a matter of the greatest concern to HUD, SHRA, and all affected jurisdictions, as it is likely to bear heavily on the housing choice opportunities of very-low and low income minority households for the foreseeable future.
Homeownership Housing Cost
Affordability in this segment of the housing market is another matter entirely. In the first two-thirds of this decade home values rose astronomically throughout the region. Driven by households seeking to take advantage of the relatively low cost of housing in the Sacramento region, as compared to the Bay area and other parts of California, new home construction boomed, and housing prices began rising. Between 2000 and 2007 values had more than doubled in virtually all communities in the region.

37
Media Value Homes (Zillow)
2000
2007
% Change
2009
2011
Sacramento County
144
370
157%
199
171
Sacramento City
129
354
174%
192
160
Folsom
229
493
115%
346
313
Galt
135
362
168%
170
173
FIGURE 4.7
The growth in the number of owner-occupied dwellings in the areas covered by this report is reflected in Figure 4.8. More than 21,000 new homeowner households were established between 2000 and 2007 in the cities of Sacramento, Folsom, and Galt, and in the unincorporated areas of the County. Growth was greatest in Folsom, where homeownership increased by over 40%, but significant increases also occurred in the cities of Sacramento (15.2%) and Galt (18.5%).
Owner-Occupied
Units
2000
2007
Number of New Homeowners
Sacramento County
229,489
251,189
21,700
Sacramento City
77,514
89,275
11,761
Folsom
13,124
18,403
5,279
Galt
4,752
5,631
879 FIGURE 4.8
A great many of these new homeowners, clearly, financed their purchases with the more exotic and higher risk mortgage products that proliferated during this period. Adjustable rate mortgages, loans with little or no down payment, and a variety of subprime loans set the stage for the collapse in the housing market which began in 2007 and continues to the present. By August of 2009, home values had plummeted from their 2007 levels, falling more than 46% county-wide, 45.8% in Sacramento, 29.8% in Folsom, and 53% in Galt. See Figure 4.7. In a time span of barely 2 years, the average homeowner lost over $171,000 in equity county-wide, $162,000 in Sacramento, $147,000 in Folsom, and $192,000 in Galt.

38
For those who were already in their homes before the escalation in home prices began, the decline in values, while surely a severe disappointment, was purely a paper loss. But for the many thousands of new homeowners who had purchased at or near the peak in housing values in mid-decade, the losses were very real indeed, and catastrophic. Many of these households suddenly found they were committed to mortgages which exceeded the current value of their homes.
According to a recent CNN report, citing Zillow.com, more than 20% of American homeowners are in a position of negative equity, owing more on their mortgage than their home is currently worth. These homeowners are categorized as being “underwater.” The percentage of homeowners in the Sacramento region who are underwater is undoubtedly far higher. Although no direct data was cited for the Sacramento area, 2 neighboring cities in the central valley, Modesto and Stockton, were each reported to have over 50% of their homeowners underwater. Cities with high levels of homeowners underwater face a double-edged sword. First, homeowners with negative equity have fewer options if they incur financial shocks, such as divorce, job loss, or medical bills, making foreclosure more likely. Second, high levels of negative equity make it much harder for housing markets to revive, because it makes it harder to sell. Underwater homeowners either must bring cash to the table in order to pay off the balance owed on the loan not covered by the sales price, or they must get their lender to agree to a “short sale” and have the lender forgive the unpaid balance. This places additional downward pressure on area-
wide housing prices as defaults increase and add supply to the market.48
At the same time, it is worth noting that the dramatic decline in home values throughout the region has not appreciably affected the cost of maintaining homeownership for
existing homeowners.49 Census data shows that the percentage of homeowner households that were deemed to be “housing cost-burdened” rose even more rapidly than it did for renter households. Between 2000 and 2007 the percentage of homeowners with mortgages who were considered to be cost-burdened rose from 26.7% to 39.4% county- wide, a 47.6% increase in cost-burdened homeowner households. The percentages in Sacramento, Folsom, and Galt went from 28% to 40.9%, 27.4% to 35%, and 35.1% to 53.1%, respectively.50
48 CNNMoney.com, 20% of Homeowners Underwater, May 6, 2009. 49 Essentially the only households deriving a cost benefit from the decline are those who entered the market recently and
purchased homes at the newly depressed price levels. 50 The especially large increase in Galt is very likely tied to the fact that most of the growth in homeownership in Galt
between 2000 and 2007 was attributable to households in the Hispanic community, many of whom undoubtedly received higher cost loans. See chapters 3 and 6.

39
Percentage of Cost Burdened Owner-Occupied Households
2000 2007
Sacramento County
26.7%
39.4%
Sacramento City
28.0%
40.3%
Folsom
27.4%
35.0%
Galt
35.1%
53.1% FIGURE 4.9
New Homeownership Opportunities
If there is a silver lining to the homeownership crisis in the Sacramento region it may be this: many households which have previously been priced out of the homeownership market may now be able to afford a home and qualify for a mortgage. The price of new and existing properties has declined so precipitously that, even with tightened mortgage credit standards, many more moderate income households may find ownership opportunities.
The decline in prices also may make it possible for an increased number of low income families to gain entry into the homeownership arena, with the assistance of SHRA’s First Time Homeowner Assistance programs and ADDI, and/or with help from the PHAs’ homeownership initiatives. Additional help may come from the infusion of funds to address the foreclosure crisis under the federal Neighborhood Stabilization Program. SHRA has demonstrated that it is fully aware of these emerging opportunities. See chapter 8 for a fuller discussion of SHRA initiatives designed to address and, where possible, take advantage of, the changes in the region’s single-family housing arena.
The extent to which homeownership opportunities have recently increased is reflected in data from the California Association of Realtors (“CAR”). CAR’s information shows that, out of all households in the Sacramento region, 68% could afford to purchase a home in the second quarter of 2009. This figure was up from 51% one year earlier, and
just 22% in the second quarter of 2006, at the peak of the housing boom.51
The figures for first time homebuyer opportunities are even more impressive. CAR’s data on first time buyers seeking to purchase an entry level home shows that 67% of such buyers could afford a home in the second quarter of 2009. The minimum qualifying income for such buyers stood at just $39,900. Only one year earlier, barely 50% of such households could afford to enter the homeownership market, and they needed a minimum income of $60,000 to do so. And, at the peak of the market in mid-2006, barely 26% of
51 California Association of Realtors, Traditional Housing Affordability Index.

40
first time would-be purchasers could afford a home in the Sacramento region. The minimum qualifying income at that point was $93,000.52
Summary
Plainly, the issue of housing “affordability” in the Sacramento region is a mixed story. As a general observation, it would be fair to say that rental housing remains reasonably affordable for those household with incomes at or above the median income for the region, while homeownership has once again become affordable to a large segment of the population, due to dramatically falling prices.
The availability of rental housing affordable to very-low, low, and some moderate income households, however, especially those in need of larger units, remains a significant problem. The limited growth in larger apartments, the continued escalation of rents in the affected jurisdictions, and the fact that so many larger households must rent single-family houses, combine to make rent a financial burden for many of those at the bottom of the economic ladder. And, because racial and ethnic minorities constitute a disproportionate percentage of such households, this ongoing reality deserves the continued attention of SHRA as it plans and implements its housing development initiatives, while simultaneously working to meet the objectives of affirmatively furthering fair housing and providing fair housing choice throughout the region.
At the same time, given the overall state of the region’s economy and its housing market, it would seem unlikely that any significant increases in new rental housing will occur in the near term, at least in the private sector. At present, as noted, single-family homeownership opportunities abound in the region for those with moderate or higher incomes. But depressed conditions in the single-family housing sector also potentially present new, more affordable, rental opportunities. SHRA/PHA programs designed to make creative use of such properties and increase rental opportunities for larger lower income households thus may constitute a viable alternative to addressing rental cost burden for larger lower income households in the immediate future. As chapter 8 makes abundantly clear, SHRA has repeatedly demonstrated that it is fully capable of developing new and innovative approaches to meeting the region’s housing demands and responding to changed circumstances.
52 Id., First Time Buyer Housing Affordability Index.

41
CHAPTER 5. LAND USE AND ZONING
Overview
Public policy, expressed in the form of local zoning codes, can be employed as an instrument to prevent change and maintain a majority population’s concept of “neighborhood value.” When used in this way, zoning codes all too frequently operate as restrictive measures posing significant impediments to the housing opportunities of low and moderate-income households, minorities, and the disabled. On the other hand, used constructively, zoning codes and other land use policies can be an effective tool in efforts to provide affordable housing, desegregate communities, and remove impediments to fair housing choice.
Public policy regarding present and future land use can also affect housing opportunities. Planning and implementation pertaining to extensions of infrastructure necessary to support housing development, and annexation of areas outside current city boundaries, can have a profound effect on the future development of a community’s housing stock. This 2010 AI examines both the current state of the County and City zoning codes and pertinent aspects of SHRA’s current land use policies and future plans.
In evaluating the zoning ordinances of the County, and the cities of Sacramento, Folsom, and Galt, four areas with particular importance from a fair housing choice perspective are emphasized. These are the presence or absence of provisions addressing (a) “inclusionary zoning;” (b) “density bonuses;” and (c) secondary dwelling units, along with the specific parking requirements established by each jurisdiction, both generally, and in relation to secondary dwelling units in particular.
Inclusionary zoning
Inclusionary zoning is a device that ensures that people of very-low, low, and moderate income can afford a percentage of newly constructed housing units, which must be set aside as below market rate housing. The presence or absence of inclusionary zoning can significantly impact the housing choice opportunities of minorities, the disabled and lower income families. Inclusionary zoning ordinances typically mandate that a specific percentage of newly developed housing be reserved, for an extended period of time (20- 30 years) for lower income residents at below market rents or sale prices. These units are usually administered by the jurisdiction in a “below market rate” housing program. If and when the current occupant moves, the unit itself is retained in the program.
Highly successful inclusionary zoning ordinances have been in force throughout California for over 30 years. They provide two major benefits. First, they serve to increase the overall supply of affordable housing. Second, they promote income diversity in a community, by dispersing low and moderate income households throughout a jurisdiction’s new residential areas, rather than concentrating them in “slum area.”

42
Inclusionary zoning is a major tool in providing affordable housing, creating racially and ethnically diverse neighborhoods, and removing impediments to fair housing choice.
It must be noted here, however, that a recent judicial development in California potentially calls into question the continued legality of many local inclusionary zoning
ordinances. In Palmer /Sixth Street Properties L.P. v. City of Los Angeles,53 the California Court of Appeals held that the City of Los Angeles’ inclusionary zoning requirements applicable to rental housing violated the Costa-Hawkins Act, the state law governing rent control. That law established an owner’s right to set initial rent levels for his units, and the court found that the City’s affordable housing requirement was “clearly
hostile” to that right.54 County and City Attorneys and SHRA legal staff will want to closely monitor future developments pertaining to this important area of the law.
Density Bonuses
Density bonuses are a zoning device that encourages developers to construct affordable housing in exchange for a relaxation on the allowable number of units which can be built on a particular site. State mandated formulas are applied to developments and grant a housing developer a density bonus of 25% more units if the developer agrees to build either 10% of the project’s total units for very-low incomes households, 20% for low income households, or 50% for seniors. In addition, a supplemental bonus can be granted if a development exceeds the above stated minimum requirements or provides a percentage of units for large families or the disabled. Potential incentives for developers include reductions in setback, lot size, open space, and parking requirements, waiver of fees, and increases in building height limits.
Secondary Dwelling Units
After declaring what it called “second units” a valuable form of housing in California, the state legislature revised the state’s zoning statutes to encourage the development of these accessory dwellings. The 2003 law allows local governments to enact zoning ordinances that mirror state law, but if the locality fails to act, then local governments must use state- established criteria to approve or deny secondary unit applications. The statute exempts secondary units from local growth controls and state environmental reviews.
While the state wishes to encourage second dwelling units, it recognizes that certain limits should apply, so the statute does place some restrictions on these units. The law also allows localities to establish certain restrictions, so long as they are not “so arbitrary, excessive, or burdensome so as to unreasonably restrict the ability of homeowners to
53 175 Cal.App. 4th 1396 (2009). 54 The potential for jurisdictions to promote below market rate rental housing may not be completely lost, however. The
court in Palmer also noted that Costa-Hawkins restrictions would not apply to rental housing where (1) the developer received either direct financial assistance or any incentive of the type specified in density bonus ordinances, and (2) the developer contractually agreed to limit rents on below market rate units.

43
create second units….”55 The statute also allows local governments to prohibit secondary unit development in certain zones, but only if they adopt formal written findings that such development will have an adverse impact on the health, safety, and welfare of the community. The local body should also try to mitigate any adverse impacts prior to the adoption of the findings.
Findings from the 2004 Analysis of Impediments The last Analysis of Impediments (“2004 AI”) identified a number of specific impediments to fair housing choice in the City of Folsom’s zoning code. First, the report observed that Folsom’s definition of “family” was inconsistent with state law, in that it limited to 5 the maximum number of unrelated persons living together as a single housekeeping unit. In addition, the 2004 AI noted that Folsom required a Conditional Use Permit for group homes of 6 or fewer individuals, and imposed restrictive parking regulations on such group homes. Each of these requirements was also identified as discriminatory and an impediment to fair housing choice.
While it would appear that Folsom has since removed all references to group homes, and
special parking restrictions on them, from the code,56 the restrictive definition of “family”
remains unchanged.57 Thus, it would seem that the code as presently constructed would exclude group homes of six unrelated individuals from all residentially zoned districts. If this is, in fact, the case it constitutes a continuing impediment to fair housing choice for the handicapped, and needs to be addressed.
The Individual Zoning Codes
Sacramento County and the 3 incorporated cities of Sacramento, Folsom, and Galt each provide for density bonuses, and secondary dwelling units. All jurisdictions except Galt also have an inclusionary zoning provision. See Figure 5.1.
55 California Government Code section 65852.150. 56 See, 2005 Sacramento County CAPER, p.6. 57 Folsom Zoning Code, Section 17.02.180.

44
Jurisdiction
Inclusionary Zoning Provision
Density Bonus Provision
Secondary Dwelling
Occupancy Restrictions
Secondary Dwelling Parking
Restrictions
Sacramento County
YES
YES
NO
YES - 1 space per
bedroom
Sacramento City
YES
YES
YES - Owner must
occupy 1 unit
YES - 1 space per
bedroom
City of Folsom
YES
YES
YES - Owner must
occupy 1 unit
NO - 1 space per unit
City of Galt
NO
YES
NO
NO - 1 space per unit FIGURE 5.1
Sacramento County
Inclusionary Zoning
The inclusionary zoning component for the County actually appears in a separate section of the the County Code (not the zoning code) at Title 22, Land Development, Chapter 22.35, Affordable Housing. Seemingly modeled on the earlier Sacramento city inclusionary provisions, the County’s program is exceedingly detailed, and provides a wide range of options by which developers can meet their affordable housing obligations.
The fundamental requirement is that projects consisting of 5 or more dwellings must construct not less than 15% of the units as affordable. The County breaks down affordability into three sub-components; housing affordable to low, very-low, and extremely-low income households. The base formula then calls for dividing the 15% minimum into three minimum set-asides, 6% for low income, 6% for very-low income, and 3% for extremely low-income.
The County, however, offers developers a host of alternatives to meet their affordable housing obligations. These options can be summarized as a combination of land transfers to SHRA, along with the payment of either or both “in lieu of” and “affordability” fees to SHRA, for placement into funds administered by SHRA to build affordable housing. The land “dedicated” can be either at the same site as the market rate project, or, where no suitable land exists at the project site, in another qualifying location. Under the County code, rental units built as affordable must remain affordable for 55 years, while those sold must remain so for 30 years. The code also requires that affordable housing either be constructed by the developer concurrent with the development of the market rate units, or that the developer ensure that no conditions exist which would

45
impede SHRA from concurrently building affordable housing on land dedicated by the developer.
Density Bonuses
The County’s density bonus provision grants developers the right to construct at least 25% more units on a site than would normally be permitted under existing zoning criteria.58 In exchange, the developer agrees to provide either 20% of the units as affordable to low income households, 10% affordable to very-low income households, or 100% seniors housing.59 The County provides that density bonuses may be combined with other incentives, including reductions in minimum lot sizes or dimensions, outdoor living space, on-site parking, and building separation requirements, along with waiver, deferral or reduction of fees and permitting requirements.
Secondary Dwelling Units
The County code refers to secondary dwelling units as “residential accessory dwellings.”60
The County’s treatment of such dwellings is not as progressive as might be either expected or desired from the standpoint of increased housing choice and affordability. There are at least three aspects of the code which reduce the potential effectiveness of secondary units in the unincorporated County.
First, the code requires that “any lot considered for an accessory dwelling unit shall
provide 5,200 square feet net lot area per dwelling unit.”61 (Emphasis added.) If the requirement means what it says, the minimum lot size for any lot with an accessory dwelling would be 10,400 square feet (5,200 square feet for the primary dwelling and 5,200 for the accessory dwelling). This is an unnecessarily high standard which will preclude many homeowners from adding such units. Second, the code restricts the maximum habitable floor area of any accessory unit to 400 square feet, an exceptionally small size. While larger areas (up to 1,200 square feet) “may be considered via the use permit process” there is no reason to assume such applications will be routinely approved. And third, the code requires one additional off street parking space for every bedroom in the accessory unit. Once again, this standard appears unduly restrictive, and is likely to further discourage homeowners from investing in this potentially significant source of affordable housing.
58 Zoning Code of Sacramento County, Title I, Chapter 10, Article 10. 59 The definition of low income used in this section is 60% rather than 80% of median income. 60 Zoning Code of Sacramento County, Title I, Chapter 25, Article 1. 61 Zoning Code of Sacramento County, Title III, Chapter 5, Article 6.

46
City of Sacramento
Inclusionary Zoning
Sacramento City was the first of SHRA covered jurisdictions to adopt an inclusionary
zoning ordinance.62 Sacramento’s provisions are similar to those later adopted and expanded upon by the County, although the City’s range of developer alternatives for meeting the affordable housing obligation, and its formulas for calculating distribution of affordable units by income range, are noticeably less complex. The City’s provisions offer developers the opportunity to construct affordable units required as a result of single family development at an alternative site within the same new growth area. As is the case in the County, developers also may “dedicate,” or transfer, land to SHRA in whole or partial fulfillment of their affordable housing obligations. The City, however, makes no provision for the collection of fees to offset a developer’s affordable housing new construction obligations. Other minor differences – the City exempts housing developments with 9 or fewer units while the County only exempts projects with less than 5 units; and, the city requires that affordable rental units remain so for 30 years, as compared to the County’s 55 year standard.
Density Bonuses
The City’s density bonus provisions are virtually identical to those of the County. As in the County, the definition of low income is 60% of median income. Both the City and County codes stipulate that where a developer requests less than the 25% increase in allowable units, no reduction in the number of required affordable units will be made; where, on the other hand, a developer exceeds the required number of affordable units the affected jurisdiction may, but is not obligated to, grant additional incentives.
Secondary Dwelling Units
Sacramento City’s provisions governing secondary dwelling units are, like the County’s, seemingly more restrictive than necessary. While such units are permitted in all residential zones, the code mandates that the maximum size of detached secondary units is limited to 850 square feet, while that of attached units cannot exceed 30% of the
primary dwelling’s floor area.63 These limitations are, moreover, not subject to modification through use permitting or variances. Additionally, the city code requires that where secondary dwellings are constructed, one of the two units on the property must be owner-occupied.64 And, like the County, the city’s code requires one additional
62 City of Sacramento Zoning Code, Title 17, Div. VI, Section 17.190. 63 City of Sacramento Zoning Code, Title 17, Div. II, Table 17.24.020A, Section 17.24.050, footnote 30.a.iv.(a). 64 City of Sacramento Zoning Code, Title 17, Div. II, Section 17.50.050, footnote 30.a.iii.

47
parking space per secondary unit bedroom.65 The code’s prohibition on absentee owner’s adding secondary units on their property runs counter to affordable housing objectives. If an owner is free to rent a primary residence there is no obvious and convincing reason why that same owner should be unable to provide additional rental housing on the same lot in the form of a secondary unit. Particularly in the current economic climate, such a restriction appears unnecessary and should be reconsidered.
City of Folsom
Inclusionary Zoning
Folsom’s zoning code includes an inclusionary zoning chapter.66 Like the inclusionary zoning provisions in the County and Sacramento city codes, Folsom basically requires that a minimum 15% of new housing construction be set aside for low and very-low income households. Folsom exempts from this requirement projects of fewer than 10
dwelling units.67 And, as is the case in the County and Sacramento city, Folsom makes provision for alternative means by which developers can satisfy their affordable housing obligations, including off-site construction of affordable units, dedication of suitable land to the city or city approved affordable housing developers, acquisition and conversion of existing market rate housing (with or without rehabilitation), or a combination of these.
A number of features in Folsom’s inclusionary zoning provision are, however, markedly different than anything in the County or Sacramento city codes, and deserve further comment. One such feature is the specific language pertaining to “Land Dedication.” This section states that a developer may dedicate sufficient land within the city to meet the required number of affordable units “provided that… the site is restricted for affordable
housing.”68 The implication here is that a developer can, in effect, transfer the construction of affordable housing to an area of affordable housing concentration. If the quoted language means what it appears to say, such an outcome would undermine one of the basic objectives of inclusionary zoning, which is to create a dispersal of affordable housing throughout a community.
Folsom’s code also expressly endorses the use of “accessory dwellings,” or secondary dwelling units, as a means of satisfying a developer’s inclusionary housing obligations, particularly where the project is exclusively single-family in nature. The code provides that such accessory dwellings may be used to satisfy the developer’s entire inclusionary zoning obligation in projects of fewer than 40 single-family homes, and may constitute
65 City of Sacramento Zoning Code, Title 17, Div. II, Section 17.50.050, footnote 30.a.vi. 66 Folsom Zoning Code, Title 17, Chapter 17.104. 67 Folsom Zoning Code, Title 17, Section 17.104.030. The code, however, also exempts from its inclusionary
requirements any “parcels covered by development agreements which legally restrict the imposing of this chapter…” See Section 17.104.080. The exact meaning of this language is not clear. It would seem to suggest that private development agreements could effectively block application of this chapter to specific parcels.
68 Folsom Zoning Code, Title 17, Section 17.104.060.

48
up to 50% of the inclusionary obligation in single-family developments of more than 40 units. While the use of secondary dwellings as a source of affordable housing is, in principle, an excellent idea, as this chapter makes clear, its specific application in this context could be problematic for at least 2 reasons. First, it will make single-family homeowners affordable housing landlords by fiat. Deed restrictions, necessary to ensure continued secondary unit rental affordability for 30 years, may make those lots containing such units more difficult to market and/or resell, or, more likely, may result in future homeowner efforts to overturn the affordability restrictions. Second, such units, especially if they comprise 50-100% of the developer’s affordable housing obligation, will inevitably define the character of the neighborhood, with essentially all affordable households comprising a distinct subpopulation of renters in an otherwise market rate homeownership environment. Again, this result is contrary to one of the basic goals of inclusionary zoning, which is to integrate and blend affordable housing into a community as unobtrusively as possible. For these reasons, Folsom’s past, current, and future experience using accessory dwelling units to fulfill affordable housing objectives deserves close monitoring.69
Density Bonuses
Folsom’s density bonus provisions, while similar in character to those of the County and Sacramento city, are available to developers proposing a considerably smaller number of affordable units. Specifically, in Folsom, a developer can obtain density increases starting at 20% by agreeing to provide either 10% of total units for low income households or 5% of total units for very-low income households.70 These percentages are basically half of what the County and City of Sacramento require before they will consider granting density increases and other incentives. The code does provide, however, that where developers exceed the low and very-low income thresholds, the density bonuses may also be increased, up to a maximum of 35%.
One interesting alternative in Folsom’s density bonus chapter which does not appear in either the County or Sacramento city codes is a provision allowing for developer land
dedication in lieu of construction of affordable units.71 Where developers donate a parcel equal to at least 10% of the area of the proposed project, a density bonus of at least 15% is also available. This provision is similar to the alternatives provided in the inclusionary zoning provisions of the County and Sacrament city codes.
69 It is interesting to note that while Folsom’s inclusionary zoning chapter refers to “accessory dwellings,” the code
elsewhere refers to such units as “second dwelling units.” See Folsom Zoning Code, Chapter 17.105. It is not clear whether the city intended to create a distinction or merely inadvertently used different language to describe the same type of housing in different chapters of the code.
70 Folsom Zoning Code, Title 17, Chapter 17.102, Section 17.102.030. Alternatively, the developer can agree to provide 50% of the units for “qualifying residents” (seniors).
71 Id.

49
Secondary Dwelling Units
Folsom’s zoning code permits second dwelling units in all single-family zoned districts. In general, the Folsom code is considerably more flexible than the corresponding County and Sacramento city provisions. Folsom permits such units on lots as small as 6,000 square feet. Maximum dwelling size is generally permitted up to 1,200 square feet for detached second units, and 30% of the living area of the primary dwelling (up to 1,200 square feet) for attached second units. With respect to parking, Folsom is quite progressive, requiring “no more than 1 off-street parking space per unit.”72
The only aspect of Folsom’s second dwelling unit provisions subject to further scrutiny is the code’s insistence on owner-occupancy of either the primary or secondary dwelling units. As noted earlier, this is a restriction that diminishes the opportunity of absentee owners to maximize the income-producing capacity of their properties, thus limiting the extent to which such units are added to the affordable housing stock.
City of Galt
Inclusionary zoning
Galt has no inclusionary zoning provision in its code. While this is arguably a shortcoming, in light of the Palmer decision discussed earlier, and because the actual impact of the absence of such a provision is mitigated by both the city’s small size and primarily single-family housing stock, not one needing attention at present. Very little in the way of significant new rental construction is on the horizon for Galt in the near term.
Density Bonuses
The Galt zoning code does provide for density bonuses.73 The code expressly relies on the provisions and standards set forth in the State legislation mandating such provisions, and sets forth no minimum number of units, required percentages of affordable units, or other numerical calculations or percentage driven formulas. A written regulatory agreement between the city and the applicant is required.
Secondary Dwelling Units
Galt’s provisions regarding secondary dwelling units are, perhaps, overall, the least restrictive of the four jurisdictions under review.74 Minimum lot size is a reasonable 6,500 square feet. Total floor area, as in Folsom, is a maximum of 1,200 square feet for detached units and 30% of the primary dwelling where attached. Finally, as in Folsom,
72 Folsom Zoning Code, Section 17.105.060. 73 Galt Zoning Code, Title 18, Chapter 18.20, Section 18.20.025. 74 Galt Zoning Code, Title 18, Chapter 18.28.

50
only one additional off-street parking space per unit is mandated. There is no owner- occupancy requirement in Galt’s secondary dwelling unit provisions.
Reasonable Accommodation and Zoning
Fair housing laws and subsequent federal and state legislation require all cities and counties to further housing opportunities by identifying and removing constraints to the development of housing for individuals with disabilities, including local land use and zoning barriers, and to also provide reasonable accommodations as one method of advancing equal access to housing. These fair housing laws require that cities and counties provide flexibility or even waive certain requirements when it is necessary to eliminate barriers to housing opportunities for people with disabilities. An example of such a request might be to place a ramp in a front yard to provide access from the street to the front door.
The California Attorney General, in a letter to the City of Los Angeles in May 2001, stated that local governments have an affirmative duty under fair housing laws to provide reasonable accommodations, and “[i]t is becoming increasingly important that a process be made available for handling such requests that operates promptly and efficiently.” He advised jurisdictions not to use existing variance or conditional use permit processes because they do not provide the correct standard for making fair housing determinations and because the public process used in making entitlement determinations fosters opposition to much needed housing for individuals with disabilities. In response to the attorney general’s letter, many cities throughout the state are adopting fair housing reasonable accommodations procedures as one way of addressing barriers in land use and zoning regulations and procedures.
At the AI consultant’s request, HUD has provided the following example of a reasonable accommodation policy. A simple-to-use form should be developed for use with it. To the extent that they are not already doing so, each of the jurisdictions should consider adopting a reasonable accommodation policy which should be circulated to government agencies, social service organizations, and housing providers that serve persons with disabilities. The policy should also be prominently displayed in appropriate places such as on city and County websites.
Summary
Generally speaking, all four jurisdictions covered by this AI have progressive non- discriminatory zoning codes. All four codes provide density bonuses for affordable housing providers, and all but Galt’s contain inclusionary zoning provisions.
In addition, each of the jurisdiction’s codes addresses the issue of secondary dwelling units on single-family lots. With respect to such units, however, the AI consultant believes that the codes of three of the jurisdictions are too restrictive, thereby

51
unnecessarily limiting the extent to which such units can serve as a source of affordable housing. In Sacramento City and Folsom, the codes require that a secondary dwelling unit can be constructed only where the property owner resides in either the primary or secondary unit. In Sacramento County and Sacramento City such units require an additional off-street parking place for every bedroom in the secondary unit. The AI consultant can see no obvious reason for either of these requirements. If an absentee owner can successfully manage and maintain a single-family property without living there, there is no reason to assume that same owner cannot also manage two units on the same lot. In the current housing market, an absentee owner’s ability to build and rent such a unit could, in fact, spell the difference between keeping the property a viable part of the tax base and seeing it move toward foreclosure. There is also no compelling reason for the requirement of an additional off-street parking space for each bedroom in a secondary unit. Such a requirement must make construction of such units impractical or impossible on many lots. Considering the fact that many lower income families with minor children, particularly female-headed households, could potentially occupy such units, and that such households will frequently own, at most, one vehicle, this requirement seems excessive. The AI consultant therefore believes the affected jurisdictions should reconsider both of these provisions.
Finally, with respect to the City of Folsom, the AI consultant’s 2009 review indicated that a restrictive definition of “family” identified in the 2004 AI remains unchanged. If this is, in fact, the case, the code would exclude group homes of six unrelated individuals from all residentially zoned districts, which would constitute a continuing Impediment to Fair Housing Choice for the handicapped. Folsom should review its code and change it if necessary to address this point.

52
CHAPTER 6 . MORTGAGE LENDING AND FORECLOSURES
Overview
This chapter examines home mortgage lending trends in the Sacramento region in recent years. Specifically, Home Mortgage Disclosure Act (HMDA) data are analyzed for 2007 (the most recent year for which such data are available) and 2006 for area mortgage lending trends. It should be noted that 2007 data were impacted by the beginning of the housing crisis that continues to sweep the county and the nation. The 2007 data thus reflects the tightening of credit standards which has persisted to the present time. On the other hand, it is generally thought that 2006 was the last year of high-volume lending before the crisis hit. Thus the 2006 data is emblematic of the robust and riskier credit practices that accompanied the housing boom in mid-decade. Additionally, to a more limited extent, this chapter reviews delinquency and foreclosure data from 2007 through 2009, using Lender Processing Services (LPS) Applied Analytics, Federal Reserve Bank of San Francisco (FRBSF) Community Development Analysis for the City of Sacramento, and includes observations from a number of studies on the impact of the foreclosure crisis on racial and ethnic minorities in California.
Home mortgage lending has long held importance as a primary way for Americans to build wealth. Home equity affords families the opportunity to start a business, send a child to college, make needed home repairs that enhance the value of the home, or create intergenerational wealth. Entering into a home loan is often the most expensive transaction most Americans will experience. As such, policymakers have long sought to ensure that the benefits of homeownership flow equally to all members of society. However, the trends identified in this chapter point to a substantial degree of racial and ethnic inequality in access to mortgage loans, type of loan product offered, and, ultimately, rates of foreclosure.
It is important to note at the outset, however, that this chapter can, at best, only serve to highlight certain racial and ethnic patterns observable from the available data. Conclusions as to causal factors are more difficult to draw. To begin with, HMDA data are subject to certain limitations, including that lenders are not required to report key underwriting criteria, such as debt-to-income and loan-to-value ratios, or credit score information, factors that almost certainly would help to explain at least some of these disparities. One factor that unquestionably determines why some borrowers are denied for home loans, or placed in higher cost loan products, is income. As one might expect, low- and moderate-income borrowers, across all jurisdictions, were somewhat more likely to be denied for home loans in the Sacramento region in 2007 and 2006. And, because a higher percentage of minorities are in the lower income strata, this factor also undoubtedly contributed to the observable racial and ethnic disparities in denial rates and placement in high cost loans. Nevertheless, nationally, more than one study has shown

53
that even where income is held constant across racial and ethnic groups, minorities experience both higher denial rates and a greater share of subprime/high cost loans.75
Congress passed the Act to help identify potentially discriminatory lending patterns. This chapter summarizes and analyzes mortgage lending data for four areas in the Sacramento region: the County of Sacramento as a whole, and the three cities of Sacramento, Folsom, and Galt. Home loan data analysis focuses on conventional home loans on single family dwellings (1-4 units) to owner-occupants.
Lending
Sacramento County
Denial rates in Sacramento County
One measure of fair lending performance is the extent to which certain borrowers are denied for home loans as compared to non-Hispanic White home loan applicants. In 2007, non-Hispanic White home loan applicants were least likely to be denied for home loans, with a denial rate of 24.6%. In contrast, Black and Hispanic (Latino) home loan applicants had denial rates of 40.2% and 38.3%, respectively.
FIGURE 6.1
75 See, e.g., National Community Reinvestment Coalition, Income No Shield Against Racial Differences in Lending II, A comparison of High-cost Lending in America’s Metropolitan and Rural Areas, July 2008; Joint Report of the National Council of Negro Women and National Community Reinvestment Coalition, Income No Shield, Part III, Assessing the Double Burden: Examining Racial and Gender Disparities in Mortgage Lending, June 2009 (Income No Shield III).

54
Similar patterns were present when looking at denial rates in Sacramento County’s neighborhoods of color as compared to communities where more of the residents where non-Hispanic White residents. Applications for home loans from neighborhoods where over 50 percent of the residents were people of color were 1.5 times more likely to be denied than applications from neighborhoods where less than 20 percent of the residents were people of color.
Denial Rates by Neighborhood Minority Concentration: Sacramento County 2007
40.0%
35.0%
30.0%
25.0%
20.0%
15.0%
10.0%
5.0%
0.0% 10-19.9% 20-49.9% 50-79.9%
Series1 23.9% 29.3% 36.1%
FIGURE 6.2
These patterns were generally true, though less pronounced, in 2006, when loan volumes were high and lenders were less likely to deny home loan applications, including many instances in which borrowers arguably should not have received a loan.

55
Denial Rate in Sacramento County 2006
35.0%
30.0%
25.0%
20.0%
15.0%
10.0%
5.0%
0.0% American Indian Asian African American Native Hawaiian/PI Latino White Non Hispanic
Series1 29.1% 22.9% 30.1% 28.6% 27.1% 19.3%
FIGURE 6.3
Denial Rates by Neighborhood Minority Concentration: Sacramento County 2007
40.0%
35.0%
30.0%
25.0%
20.0%
15.0%
10.0%
5.0%
0.0% 10-19.9% 20-49.9% 50-79.9%
Series1 23.9% 29.3% 36.1%
FIGURE 6.4

76 Income No Shield III, at p.3.
56
Higher-cost lending in Sacramento County
Borrowers of color in Sacramento County were generally more likely to receive higher- cost loans than non-Hispanic White borrowers. “In theory, high-cost loans compensate lenders for the added risk of lending to borrowers with imperfect credit histories. However, racial/ethnic disparities in lending (even when controlling for gender and income levels) suggests that more minorities are receiving high-cost loans than is justified based on creditworthiness. Previous studies conducted by NCRC and others suggest that minorities are, in fact, receiving a disproportionately large amount of high- cost loans, after controlling for creditworthiness and other housing market factors.”76
In 2007, Black borrowers in the County were over 2.5 times more likely to receive higher-cost loans as non-Hispanic White borrowers. And in 2006, Blacks were over twice as likely as non-Hispanic White borrowers to get higher-cost home loans. The disparity for Hispanic (Latino) borrowers was about as great in both years.
FIGURE 6.5
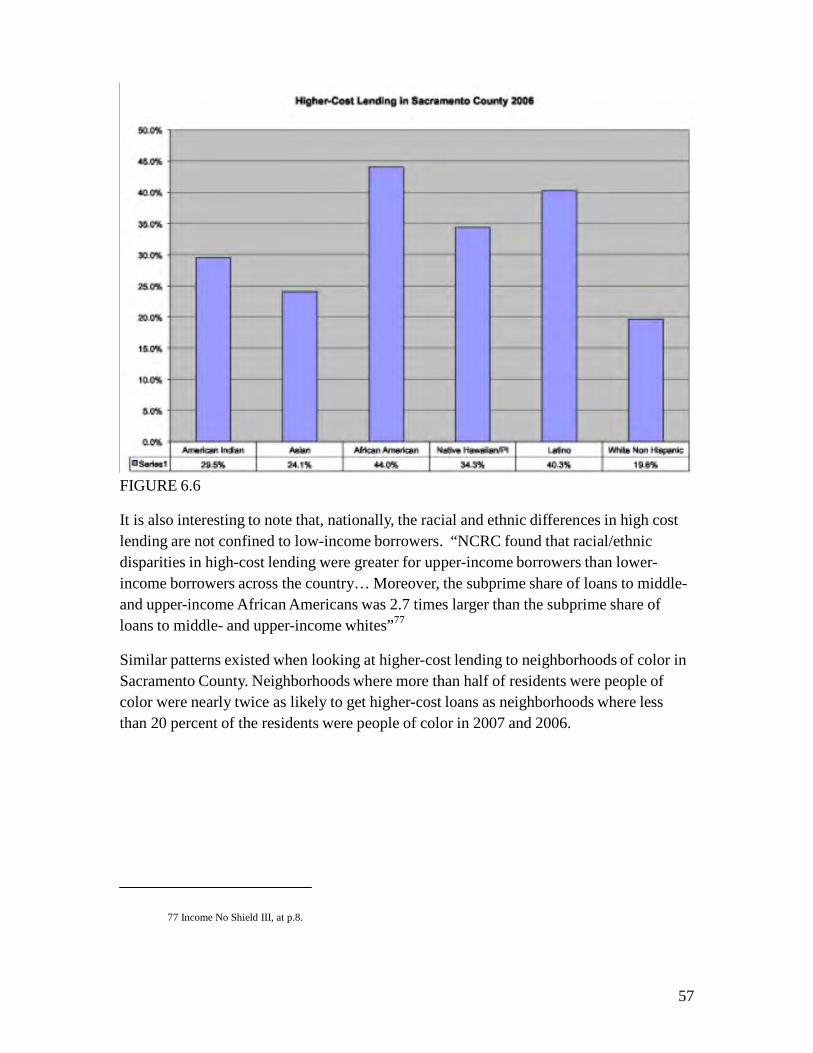
77 Income No Shield III, at p.8.
57
FIGURE 6.6
It is also interesting to note that, nationally, the racial and ethnic differences in high cost lending are not confined to low-income borrowers. “NCRC found that racial/ethnic disparities in high-cost lending were greater for upper-income borrowers than lower- income borrowers across the country… Moreover, the subprime share of loans to middle- and upper-income African Americans was 2.7 times larger than the subprime share of loans to middle- and upper-income whites”77
Similar patterns existed when looking at higher-cost lending to neighborhoods of color in Sacramento County. Neighborhoods where more than half of residents were people of color were nearly twice as likely to get higher-cost loans as neighborhoods where less than 20 percent of the residents were people of color in 2007 and 2006.

58
Higher Cost Lending by Neighborhood Minority Concentration: Sacramento County 2007
25.0%
20.0%
15.0%
10.0%
5.0%
0.0% 10-19.9% 20-49.9% 50-79.9%
Series1 10.0% 13.1% 19.7%
FIGURE 6.7
Higher Cost Lending by Neighborhood Minority Concentration: Sacramento County 2006
40.0%
35.0%
30.0%
25.0%
20.0%
15.0%
10.0%
5.0%
0.0% 10-19.9% 20-49.9% 50-79.9%
Series1 18.2% 25.4% 34.7%
FIGURE 6.8

59
Second Lien Loans
The extent of second lien loans may also indicate potential problems for homeowners in Sacramento County, as these loans frequently result in added stress for certain borrowers in a declining housing market. And borrowers with second lien loans who are struggling to make payments and attempting to negotiate with loan servicers for mortgage modifications are currently facing greater difficulties negotiating workouts, as servicers are more reluctant to work out loan modifications where there are second liens.
In fact, Sacramento County had a large number of second lien loans in 2007, and many of these loans were high cost loans, again, disproportionately so for people and neighborhoods of color. There were 10,953 subordinate lien loans originated in the County in 2007. While only 14 percent of first lien loans were higher-cost, nearly 19 percent of subordinate lien loans fell into this category.
Ethnicity/Income
Total Number of Loans
Number of Higher-Cost Loans
American Indian 118 41Asian 995 188African American 586 222Native Hawaiian/Pacific Islander 202 53Latino 1,279 389White Non-Hispanic 5,542 806
Low-Income 160 8Moderate-Income 951 102Middle-Income 2,799 498Upper-Income 6,849 1,322FIGURE 6.9
In 2006, the volume of subordinate lien loans was much greater. A total of 24,466 subordinate lien loans were made, and a whopping 37.1 percent of these loans were higher-cost loans.
Higher-Cost Second Lien Loans by Borrower Ethnicity and Income in 2006
Ethnicity/Income
Total Number of Loans
Number of Higher-Cost Loans
American Indian 301 123Asian 2,308 1,007African American 1,931 1,181Native Hawaiian/Pacific Islander 557 301Latino 3,878 2,258White Non-Hispanic 10,136 2,835

60
Low-Income 299 33Moderate-Income 1,584 280Middle-Income 5,836 1,896
Upper-Income
15,780
6,174
FIGURE 6.10
Sacramento City
Denial rates in Sacramento City
In 2007, non-Hispanic White home loan applicants in Sacramento city were least likely to be denied for home loans, with a denial rate of 25.5 percent. In contrast, Black and Hispanic home loan applicants encountered denial rates of 44.3% and 39.2%, respectively.
FIGURE 6.11
Similar patterns were present when looking at denial rates in the City of Sacramento’s neighborhoods of color as compared to communities where more of the residents were non-Hispanic White residents in 2007. Applications for home loans from neighborhoods where more than 50 percent of the residents were people of color were nearly 1.5 times more likely to be denied than those from neighborhoods where less than 20 percent of the residents were people of color.

61
Denial Rates by Neighborhood Minority Concentration: City of Sacramento 2007
40.0%
35.0%
30.0%
25.0%
20.0%
15.0%
10.0%
5.0%
0.0% 10-19.9% 20-49.9% 50-79.9%
Series1 24.4% 30.6% 36.3%
FIGURE 6.12
Similar patterns prevailed in 2006, although loan volumes were much higher, and lenders were less likely to deny home loan applications, preferring to market high cost loans to presumably riskier borrowers.
Denial Rate in the City of Sacramento 2006
35.0%
30.0%
25.0%
20.0%
15.0%
10.0%
5.0%
0.0% American Indian Asian African American Native Hawaiian/PI Latino White Non Hispanic
Series1 30.6% 24.0% 30.2% 28.9% 27.5% 19.9%
FIGURE 6.13

62
Denial Rates by Neighborhood Minority Concentration: City of Sacramento 2006
30.0%
25.0%
20.0%
15.0%
10.0%
5.0%
0.0% 10-19.9% 20-49.9% 50-79.9%
Series1 19.2% 23.4% 27.4%
FIGURE 6.14
Higher-cost lending in Sacramento City
Another potential measure of fair lending performance is the extent to which higher-cost, or subprime, loans were distributed across racial and ethnic populations. This analysis shows that borrowers of color in the City of Sacramento were generally far more likely to receive higher-cost loans than non-Hispanic White borrowers. In 2007 and 2006, Black and Hispanic borrowers in the City of Sacramento were more than twice as likely to receive higher-cost loans as non-Hispanic White borrowers.

63
FIGURE 6.15
FIGURE 6.16

64
Similar patterns existed when looking at higher-cost lending in neighborhoods of color in the City of Sacramento. Neighborhoods where more than half of residents were people of color were nearly twice as likely to get higher-cost loans as neighborhoods where less than 20 percent of the residents were people of color.
Higher Cost Lending by Neighborhood Minority Concentration: City of Sacramento 2007
25.0%
20.0%
15.0%
10.0%
5.0%
0.0%
10-19.9% 20-49.9% 50-79.9%
Series1 10.8% 14.0% 20.5%
FIGURE 6.17
Higher Cost Lending by Neighborhood Minority Concentration: City of Sacramento 2006
40.0%
35.0%
30.0%
25.0%
20.0%
15.0%
10.0%
5.0%
0.0% 10-19.9% 20-49.9% 50-79.9%
Series1 18.9% 27.0% 35.4%
FIGURE 6.18

65
Second lien loans in Sacramento City
The City of Sacramento had a large number of second lien loans in 2007, and, as in the County as a whole, many of these loans were higher-cost loans, disproportionately so for people and neighborhoods of color. There were 7,492 subordinate lien loans originated in the City of Sacramento. While only about 15 percent of first lien loans were higher-cost, more than 19 percent of these subordinate lien loans were higher-cost.
Higher-Cost Second Lien Loans by Borrower Ethnicity and Income in 2007
Ethnicity/Income
Total Number of Loans
Number of Higher-Cost Loans
American Indian 79 28Asian 664 132African American 435 169Native Hawaiian/Pacific Islander 120 25Latino 939 288White Non-Hispanic 3,780 566
Low-Income 131 7Moderate-Income 745 85Middle-Income 2,071 393Upper-Income 4,423 889
FIGURE 6.19
And, as might be expected due to the overall higher volume in mortgage lending in 2006, the number of subordinate lien loans in that year was much greater. A total of 16,905 subordinate lien loans were made in the city in 2006, and 39 percent of them were higher- cost loans.
Higher-Cost Second Lien Loans by Borrower Ethnicity and Income in 2006
Ethnicity/Income
Total Number of Loans
Number of Higher-Cost Loans
American Indian 205 90Asian 1,477 678African American 1,416 908Native Hawaiian/Pacific Islander 368 208Latino 2,847 1,696White Non-Hispanic 6,981 2,000
Low-Income 231 27Moderate-Income 1,250 236Middle-Income 4,436 1,565Upper-Income 10,371 4,312
FIGURE 6.20

66
Distressed homeowners in the City of Sacramento
It has been well documented that the City of Sacramento has been particularly hard hit by delinquencies and foreclosures. LPS Applied Analytics data provided and analyzed by FRBSF confirms that the City of Sacramento has had record foreclosure activity. The data show more than a threefold increase in the number of seriously delinquent loans (between 60- and 90-days delinquent), from 2055 in 2007 to 6393 in 2009, and a corresponding, but even greater, increase in foreclosures, from 2139 in 2007 to 4966 in 2009. Since this dataset represents a sample of loans originated, the data should be looked at for trends, here an increase in distressed loans, and not necessarily as a measure of absolute numbers of distressed loans. Additionally, it should be noted that the apparent leveling off of foreclosure numbers in the chart may be somewhat misleading, reflecting the inability or unwillingness of loan servicers to process the large number of prospective foreclosures in the pipeline at the same pace as in earlier years, due to higher volume and new government requirements.78
FIGURE 6.21
City of Folsom
Denial rates in Folsom
In 2007 and 2006, non-Hispanic White home loan applicants were least likely to be denied for home loans, with denial rates of 15 and 12.9 percent. In contrast, Black home loan applicants experienced denial rates of 35.3 and 30 percent. The denial rates for
78 There is good reason to believe that the true numbers may be much higher. That is because California’s SB 1137 went into effect in the fall of 2008, and was largely credited with lowering the number of foreclosure filings in California in the months immediately after its enactment, because the measure required, amongst other things, that loan servicers arrange a pre-foreclosure meeting with borrowers before beginning the foreclosure process. Several news articles and press releases from foreclosure data providers noted that the effect of SB 1137 was to reduce the number of foreclosure filings in late 2008 and early 2009.

67
Hispanics in both years, although still markedly higher than for non Hispanic whites, were considerably lower than elsewhere in the County.
FIGURE 6.22
FIGURE 6.23

68
Higher-cost lending in the City of Folsom
Borrowers of color in the City of Folsom were generally more likely to receive higher- cost loans than non-Hispanic White borrowers in the city. In 2007, Black borrowers in the City of Folsom were more than 2.5 times as likely to receive higher-cost loans as non- Hispanic White borrowers. And in 2006, they were more than twice as likely as non- Hispanic White borrowers to get higher-cost home loans.
FIGURE 6.24

69
FIGURE 6.25
Second Lien Loans in Folsom
Although a higher percentage of Black and Hispanic borrowers taking out second lien loans in 2006 were placed in high cost loans than were non-Hispanic white borrowers (and the same was true for Hispanics in 2007), the actual number of Black and Hispanic borrowers in both years was relatively low, with white and Asian borrowers comprised the overwhelming number of such loans. It is, thus, difficult to draw meaningful conclusions based on the size of the affected populations.
City of Galt
Denial rates in Galt
As mentioned above, denial rates across racial and ethnic populations can be used to measure fair lending performance. In 2007, non-Hispanic White home loan applicants in the City of Galt were least likely to be denied for home loans, with a denial rate of 25%. In contrast, Black and Hispanic home loan applicants experienced denial rates of 40% and 37.5%, respectively. These patterns were also evident in 2006, though less pronounced, with the denial rates being highest for Blacks at 35.3 percent.

70
FIGURE 6.26
FIGURE 6.27

71
It is interesting to note that Galt showed considerably less difference in denial rates by racial or ethnic neighborhood composition. In fact, in both 2006 and 2007, the denial rates were virtually the same for neighborhoods with less than a 20% minority population, and those areas which were over 50% minority.
Higher-cost lending in Galt
Borrowers of color in the City of Galt were generally more likely to receive higher cost loans than non-Hispanic White borrowers. In 2007, for example, Hispanic borrowers in the City of Galt were nearly three times as likely to receive higher-cost loans as non- Hispanic White borrowers, while the City’s few Black borrowers were roughly twice as likely to receive such loans. And, in 2006, Hispanic and Black borrowers were twice as likely as non-Hispanic White borrowers to get higher-cost home loans.
FIGURE 6.28
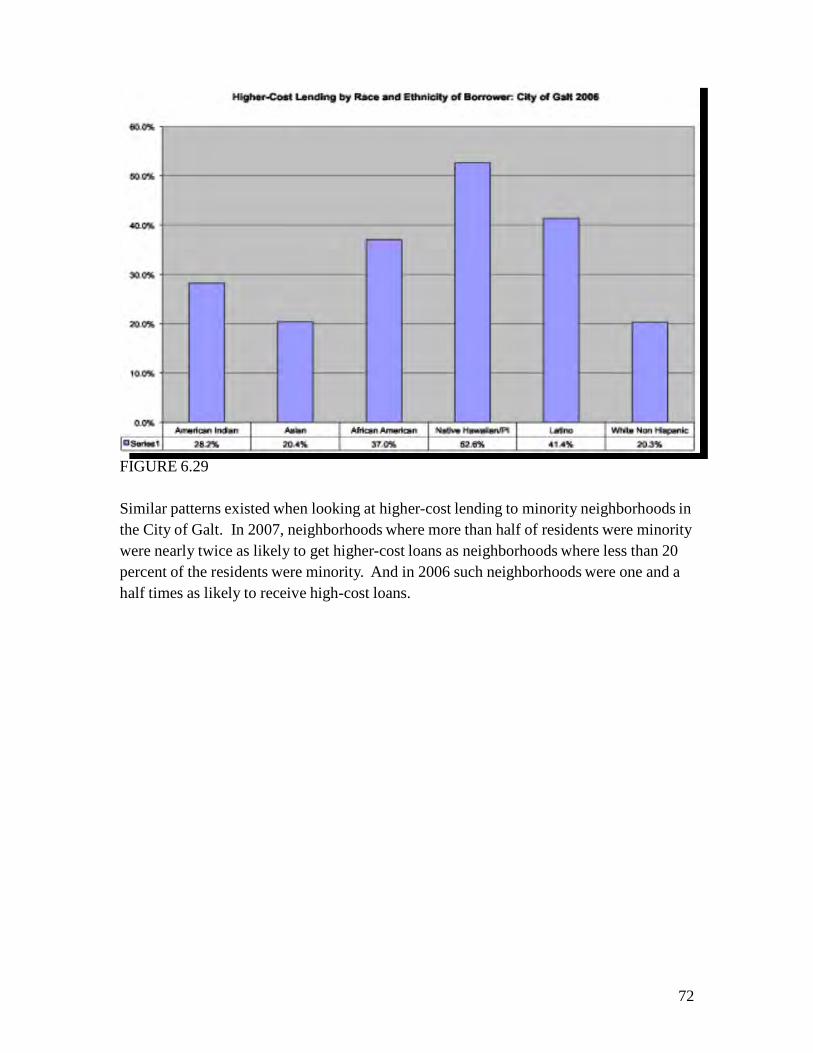
72
FIGURE 6.29
Similar patterns existed when looking at higher-cost lending to minority neighborhoods in the City of Galt. In 2007, neighborhoods where more than half of residents were minority were nearly twice as likely to get higher-cost loans as neighborhoods where less than 20 percent of the residents were minority. And in 2006 such neighborhoods were one and a half times as likely to receive high-cost loans.

73
FIGURE 6.30
Higher Cost Lending by Neighborhood Minority Concentration: Galt City 2006
40.0%
35.0%
30.0%
25.0%
20.0%
15.0%
10.0%
5.0%
0.0% 10-19.9% 20-49.9% 50-79.9%
Series1 24.3% 28.0% 35.0%
FIGURE 6.31

74
Second lien loans in Galt
The extent of high cost second lien loans may also indicate potential problems for homeowners in the City of Galt. In fact, given its small size, the City of Galt had a substantial number of second lien loans in 2007 (332), and an even greater number in 2006 (676). In 2007 20% were high cost, while in 2006 more than 36% fell in this category. Among Hispanics, by far the city’s largest minority group, the percentage in high cost second lien loans was two and a half times that for white borrowers, reaching 60% of all second lien loans to Hispanics in 2006.
Higher-Cost Second Lien Loans by Borrower Ethnicity and Income in 2007
Ethnicity/Income
Total Number of Loans
Number of Higher- Cost Loans
American Indian 9 2Asian 5 2African American 3 2Native Hawaiian/Pacific Islander 6 3Latino 71 26White Non Hispanic 174 23
Low-Income 3 0Moderate-Income 14 0Middle-Income 72 16Upper-Income 234 41
FIGURE 6.32
Higher-Cost Second Lien by Borrower Ethnicity and Income in 2006
Ethnicity/Income
Total Number of Loans
Number of Higher- Cost Loans
American Indian 11 2Asian 19 9African American 31 12Native Hawaiian/Pacific Islander 10 3Latino 180 108White Non Hispanic 285 72Low Income 4 0Moderate Income 20 4Middle Income 121 34Upper Income 506 189FIGURE 6.33

75
Distressed homeowners in the City of Galt
With a population of less than 30,000, Federal Reserve Board sample data showed that the City of Galt had 271 loans that were seriously delinquent in the first half of 2009. That is nearly ten percent of the 2,777 total loans in the FRB sample.
Foreclosures
From 2008 through the first half of 2009, more than 23,000 families lost their homes to
foreclosure in Sacramento County.79 Thousands more have experienced delinquencies and/or defaults and are at risk of foreclosure. Moreover, in many parts of the Sacramento region the volume of second lien lending in mid-decade was comparable to or greater than the volume of first lien lending, suggesting that many homeowners had little remaining equity when the foreclosure crisis started. As property values have declined dramatically in the Sacramento region over the past couple of years, it follows that many homeowners are currently “upside down” in their mortgages – owing far more than their
properties are now worth.80 Being upside down, and/or the mere presence of a second mortgage, greatly limits the workout options with servicers in the event of mortgage default. There can be little doubt that the depth and duration of the foreclosure crisis constitute the greatest threat to the Sacramento region’s long-term economic well being since the Great Depression.
A recently completed study conducted by the Center for Responsible Lending81 (“CRL”) on foreclosures in California provides overwhelming support for concluding that (a) the foreclosure crisis had its genesis in the abusive lending practices concentrated in the subprime and Alt-A mortgage markets; (b) the Sacramento region lies at the center of the foreclosure storm engulfing the State; and (c) the impact of the crisis is being, and will continue to be, disproportionately borne by the minority community, largely as a result of the extent to which high cost mortgage lending was targeted to that community during the mid-decade housing boom years.
Notwithstanding the comparative economic security the Sacramento region enjoys due to the large percentage of its workforce which is in the public/governmental sector, the area’s “foreclosure density” (its share of housing units experiencing foreclosure) stood at 9.7%, among the top ten California MSAs in this category between September 2006 and November 2009. Moreover, the Sacramento region was in a virtual tie for third place with the San Francisco/Oakland/Fremont MSA for the highest volume of foreclosures
79 www.dqnews.com 80 See additional discussion on this point in Chapter 4, Affordability. 81 Center for Responsible Lending, Dreams Deferred: Impacts and Characteristics of the California Foreclosure Crisis, August 2010 (Dreams Deferred Report).

76
during the same period, at just over 69,000.82 The vast majority of these foreclosures were on loans originated between 2004 and 2007, the period during which high-risk loan products were aggressively created, marketed, and sold.
The CRL report’s “key findings” include the following:
• The concentration of foreclosures is highest in the Central Valley;
• Most foreclosures have been on properties that were typically valued significantly
below area median values at the time of loan origination; and,
• Hispanic and black borrowers have experienced foreclosure rates 2.3 and 1.9 times
that of white borrowers, respectively. Almost half (48%) of all foreclosures in
California in recent years have been on properties owned by Hispanics.83
From an AI perspective, this latter finding is highly significant. The state-wide demographic data is compelling. Hispanics, representing 32.1% of California’s adult population and just 21.7% of the State’s homeowners, comprised 48.2% of those in foreclosure. Black borrowers also experienced disproportionate foreclosure rates, comprising 7.6% of all foreclosures on just 5.7% of all loans. The CRL report notes that this pattern persists even when controlling for loan amount.84 Given the racial and ethnic disparities in high cost lending cited earlier for the region’s four jurisdictions, it stands to reason that borrowers of color have disproportionately borne the brunt of the foreclosure crisis in the Sacramento region.
Another dimension of the foreclosure crisis is the increasing prevalence of mortgage relief scams throughout the state. “As an increasing number of homeowners fall towards foreclosure and in desperation seek any sign of hope, they are easy prey for predatory scam artists who promise to modify home loans – for a fee. These businesses, often the same ones that put borrowers into unaffordable loans in the first place, cannot guarantee
any result and often fail to deliver.”85 The CRC report notes that these entities are aggressively advertising on radio, television, and in print media, promising borrowers far more than they typically provide in the way of results. CRC’s survey of legitimate non- profit housing counselors across the state indicates that these fee charging entities make
82 Id., at pp. 9, 12. The foreclosure densities of three nearby MSAs, Modesto, Merced, and Stockton, stood at 16.1%, 16.0% and 15.8%, respectively.
83 Id., at p. 2. 84 Id., at pp. 14-15. 85 California Reinvestment Coalition, The Ongoing Chasm Between Word and Deeds V – Abusive Practices Continue to Harm Families and Communities in California, 2009 (CRC report), at p. 21.

77
their own work considerably more difficult, due to families being told one thing by the for-profit entities and then being advised to act in a completely different way by the non-
profit counselors.86
Finally, it must be noted that the impact of the foreclosure crisis is not confined solely to homeowners and mortgage borrowers. In a large and growing number of cases, households renting in single-family and other properties undergoing foreclosure have been forced from their residences by banks or other creditors taking ownership of the subject property. Frequently, these tenants are unaware of their rights, and often fail to get back their security deposit and any pro rata share of rents already paid.87 Typically, the first evidence these tenants have of a problem is when their water or electricity is cut off. Loopholes in tenant protection laws and lax enforcement frequently leave these households without effective recourse. It has been estimated that as much as one-third of all residential units in foreclosure in California are operating as rentals at the time of
foreclosure.88
Summary
Based on the limited data from 2006 and 2007 examined in this chapter, disparities clearly existed in the extension of credit to White and minority applicants across the region. Applicants of color had much higher denial rates than White applicants. Specifically, Blacks and Hispanics were generally one and a half to two times as likely to be denied a loan as White applicants across the Sacramento region.
Disparities also existed in the cost of credit that was extended to White and minority applicants. Minority borrowers were significantly more likely to be placed in high-cost, or subprime, loans than were White borrowers. And, high-cost lending was roughly twice as prevalent in high-concentration minority neighborhoods as in low-concentration minority neighborhoods. While not all subprime lending is abusive, abusive lending does occur primarily in the subprime market. Thus, it is impossible to avoid the conclusion that, at least in large part, unwarranted subprime lending has been the driving force behind the large number of minority borrowers who have already experienced, or are currently facing foreclosure, and the concomitant loss of wealth in minority communities. As such, it must be concluded that the foreclosure crisis constitutes not only the greatest threat to the economic stability and security of the Sacramento region as a whole, but also an ongoing Impediment to Fair Housing Choice.
86 Id., at p. 23. 87 Id., at p. 26. 88 Id.

78
The extent to which local government bears responsibility for creating these conditions is difficult to assess. It has been observed that, historically speaking, neither the higher conventional loan denial rates experienced by minority borrowers and neighborhoods, nor the clear targeting of minority borrowers and neighborhoods for high cost subprime
loans, came about suddenly, by accident, or without governmental involvement.89 For the most part, however, a more protective Federal and State legislative scheme, including steps such as strengthening the Home Mortgage Disclosure and Community Reinvestment Acts, and enacting meaningful anti-predatory lending laws, is widely viewed by both consumer and civil rights advocates as the best means of addressing both the causes and consequences of this crisis within the minority community, going forward.
In the immediate future, local government will have its hands full trying to ameliorate the worst aspects of the foreclosure crisis within the region, by working to stabilize hard hit neighborhoods and providing new homeownership and rental opportunities. As Chapter 8 in this AI documents, SHRA is already working with all the resources available to it to devise appropriate programmatic responses to the current homeownership and foreclosure crisis. SHRA has consistently demonstrated that it has the capacity to respond to new or changed circumstances, and design programs to meet specific problems.
Inasmuch as this AI deems the foreclosure crisis (and the high cost mortgage lending practices which precipitated it) an Impediment to Fair Housing Choice, it is recommended, quite simply, that SHRA take steps to ensure that the racial and ethnic implications and impacts of each of the programs it develops in response to the foreclosure crisis remain at the forefront of its thinking as it conceptualizes, designs, and implements those programs.90
89 Throughout the Sacramento region, both phenomena have been tied to the region’s long history of racially/ethnically motivated governmental redevelopment policies and practices, in concert with private lender redlining and disinvestment. As Professor Jesus Hernandez of the University of California, Davis pointed out in testimony presented to the National Commission on Fair Housing and Equal Opportunity in September 2008:
In Sacramento, four key practices established the racial geography that now defines the metropolitan area: the explicit use of racially restrictive covenants, the informal enforcement of those covenants, central city urban renewal programs, and mortgage redlining. Preliminary observations suggest that subprime loan activity is highly concentrated in neighborhoods with high ratios of non-whites resulting from longstanding practices of housing segregation in the city. . . These observations suggest that there is a tendency to racialize the flow of housing finance capital and that housing finance capital flows are geographically related to historically racialized housing policies.
Hernandez, Jesus, Connecting Segregation to Contemporary Housing Credit Practices and Foreclosures: A Case Study of Sacramento, written testimony submitted to the National Commission on Fair Housing and Equal Opportunity, September 9, 2008.
90 Such an approach is wholly consistent with the outlook from Washington. HUD Secretary Shaun Donovan recently commented that the mortgage crisis has had a disparate impact on minority groups, and stated “if we have modifications that are not implemented effectively in the minority communities, we are not going to solve this crisis.” Brian Collins, “Obama Reaches Out to Minorities” National Mortgage News, June 15, 2009, as reported in CRC Report at p. 20.

79
CHAPTER 7. FAIR HOUSING ENFORCEMENT AND EDUCATION
Overview
This chapter assesses SHRA’s fair housing program since 2004. For at least the last decade, SHRA has sought to ensure fair housing education and enforcement primarily through annual contracts with the Sacramento Regional Human Rights/Fair Housing Commission (“HRC” or “the agency”). It is important to note in this regard that the last AI, completed in November 2004, concluded that “weak fair housing enforcement constitutes an impediment to fair housing choice in the Sacramento region.”91 Since that report was issued much work has taken place to remedy the identified problems.
At the outset, however, it must first be noted that one critical element in the HRC’s approach to its fair housing enforcement mission, was only uncovered during the course
of this current AI review.92 It is, and apparently always has been, the HRC’s position that, as a local governmentally chartered entity, it is prohibited under California law from
seeking monetary damages for complainants in mediation or conciliation.93 HRC legal staff maintained in their interviews with the AI consultants that the agency has conducted considerable legal research on this point. It is well established that, in California, under State law, fair housing enforcement proceedings on behalf of a complainant are reserved to the State agency, the California Department of Fair Employment and Housing (“DFEH”). Local civil rights agencies, such as the HRC, do exist, however, and it is less clear what relief they may seek on behalf of complainants in the course of voluntary conciliation negotiations.
Compounding the negative impact on complainants of the HRC’s legal position on this point are two additional factors. First, as a matter of policy, the HRC only enters into conciliation after it has completed an investigation and concluded that there is evidence of discrimination. This means that in virtually every case which the HRC conciliated, there existed a high likelihood that complainant(s) would have been entitled to, and
would have received, monetary damages had the case proceeded to enforcement.94
Second, as the data provided by the HRC demonstrates, the agency routinely elects to conciliate such cases rather than refer them to Federal or State agencies, or to the private bar, entities whose involvement could make whole the victims of housing discrimination.
91 2004 AI, at 7-6. 92 During the course of the last AI review, the AI consultant was unable to obtain information on final case resolutions due
to the HRC’s assertion that the content of those settlements were strictly confidential. November 2004 AI at 7-3. Thus, the complete absence of monetary relief in such settlements remained shielded from scrutiny at that time.
93 HRC uses the term “conciliation” to describe complaints settled telephonically, and “mediation” to describe those complaints resolved in direct meetings between the parties. For the purpose of brevity this report uses the term conciliation to cover all such HRC housing discrimination complaint settlements.
94 Many civil rights agencies offer the parties an opportunity to resolve a complaint at the outset (i.e., before an investigation is commenced). In such instances of pre-investigative settlement it is impossible to predict the likelihood that a complainant would ultimately prevail, and, thus, such complaints are often settled with less relief for complainants. As noted, however, pre-investigative conciliation is not the practice at the HRC.

80
In short, the combined effect of the HRC’s legal position that it is barred from seeking monetary damages for complainants after finding evidence of discrimination, and the agency’s predilection for conciliating such cases rather than referring them for enforcement, standing alone, constitutes an impediment to fair housing of such a magnitude as to render SHRA – HRC relationship and current fair housing program fundamentally flawed.
Methodology
The review of the HRC commenced with an examination of the contract between SHRA and the HRC, and the monthly and annual reports sent from HRC to SHRA pursuant thereto. In addition, the AI consultant prepared an in-depth questionnaire seeking additional information and data from the agency. The HRC responded promptly, and, for the most part, thoroughly, to this request for additional data and material. Finally, a two- day on-site visit was conducted at the offices of the HRC in late October 2009, during which interviews were held with the agency staff currently (and, in one case, previously) responsible for fair housing activity95 and the agency Director, and a sampling of housing discrimination case files were reviewed.
Commission Structure
Mission
As stated in HRC literature and the agency’s website, “The Regional Human Rights/Fair Housing Commission is a joint powers authority created for the purpose of promoting harmony amongst the diverse populations that comprise the Greater Sacramento Region.”
The mission of the HRC is to, “… seek to eradicate discriminatory housing practices, educate the public and rental housing industry on fair housing laws, improve landlord- tenant relationships through information and conciliation services, and otherwise promote tolerance of the diverse cultures, mores, lifestyles, and beliefs of the peoples of this community in order to achieve and maintain harmony and realize equal opportunity.” The HRC’s landlord-tenant activities comprise a major component of the agency’s overall staffing and other resources. In addition, with funding support from the Superior Court of Sacramento County, HRC also maintains advisory clinics and mediation services at the courthouse for both small claims and unlawful detainer (eviction) matters. HRC staff
attorneys and law students staff these programs.96
The stated purpose of the HRC’s fair housing program is to “further fair housing choice for protected classes under the Fair Housing Act in the County of Sacramento and the
area. 95 The interviews also included a staff member previously assigned fair housing duties who is now working in another
96 Source: www.hrfh.org

81
cities of Sacramento, Folsom, Isleton and Galt. Services are provided to all classes of persons protected under the Fair housing Act without regard to income.”
Fair Housing Funding
According to the HRC response to the AI questionnaire, HRC had a total funding level from 2004 through 2008 as follows: 2004 - $717,962; 2005 - $799,793; 2006 – $913,410; 2007 - $927,667; and 2008 - $873,579. Of these totals, SHRA provided $180,442, $181,648, 186,400, $185,806, and $186,806, respectively, for fair housing activities.97
Some additional funding for fair housing services may be provided by jurisdictions not covered by SHRA contract, such as Elk Grove and Citrus Heights. It would appear that while SHRA funding has consistently comprised approximately 20-25% of HRC’s overall funding, it constitutes a significantly higher component of the agency’s fair housing budget.
Fair Housing Staffing
The HRC’s response to the AI questionnaire stated that the equivalent of 1.20 full-time
and 1.25 part-time employees were devoted to fair housing activity.98 Attorneys are the assigned staff working on fair housing, along with occasional assistance from (generally unpaid) legal interns with oversight and guidance from the agency Director.
Staff Training
HRC fair housing staff interviewed for this AI indicated that they were aware of various fair housing training opportunities from HUD, DFEH, the National Fair Housing Alliance, and John Marshall Law School. One HRC staff attorney had received training from Legal Services of Northern California. All those interviewed were open to participating in any of the other options, including their own Sacramento County District Attorney’s Office..or Sacramento City Attorney’s Office..
The agency’s annual contracts with SHRA call for ongoing staff training “offered by organizations recognized for their expertise in fair housing education.” The contracts specifically mention the National Fair Housing Alliance and the U.S. Department of Housing and Urban Development as examples of such organizations. The staff of any fair housing organization will benefit at any point in time from training offered by any of the groups mentioned here above.
Findings and Recommendations from the 2004 AI
The 2004 assessment of the HRC concluded that “while [the agency had] well educated, capable staff, the number of hours dedicated to fair housing is well below that which the allocated funds are intended. There is no literature descriptive of the protected groups
97 HRC response to AI questionnaire, questions A.1 – A.3. 98 Question A.4 actually asked for the total number of full and part time employees at the agency. The agency’s response, however, appears to indicate a number reflective of the staffing time devoted solely to fair housing.

82
and no plans for the development of such literature.”99 In addition, the 2004 AI observed that the agency’s limited existing literature on fair housing was available exclusively in English, notwithstanding the multi-lingual nature of the Sacramento region and the ready availability of foreign language fair housing material “from HUD and from numerous fair
housing organizations in California and across the country.”100 The AI further noted that
“[t]here has been an intentional avoidance to seek publicity of any settled complaints.”101
The AI also found that “most of the investigations had ill-conceived tests or incomplete
interviews.”102 Finally, the AI concluded that too many complaints were not investigated in a timely manner, and that the agency failed to follow-up on the few complaints referred to outside enforcement agencies or the private bar.
The 2004 AI recommendations to address these shortcomings included the following specific actions:
• Institution of a comprehensive outreach and education campaign targeting
residents with limited English and other minority groups;
• Investigation of fair housing complaints using testing, document review, and
witness interviews in a timely manner;
• Tracking and reporting of final resolution of all complaints by location and
protected status. This includes all monetary settlements resulting from litigation as well as agreements negotiated by staff or through mediation services (emphasis added);
• Adoption of a policy that publicizes successful fair housing litigation; and
• Provide for at least two full-time staff dedicated to fair housing and provide
immediate, hands-on supervision to the fair housing staff who conduct investigations.
SHRA’s Response to the 2004 AI
SHRA appears to have taken the findings from the 2004 AI seriously. The annual contracts with the HRC were modified in a number of respects in an attempt to improve the HRC’s performance. Specifically, the post-2004 contracts included a new section on “Basic Performance Standards” designed to ensure higher investigative quality and timeliness, as well as additions to the Outreach and Education section of the contract
99 2004 AI at 7-5. 100 2004 AI at 7-3. 101 2004 AI at 7-5. 102 Id.

83
pertaining to workshop attendance, public service announcements, and publications of articles and brochures. In addition, the post-2004 contracts added a new section on “Testing of Fair Housing Complaints.”
Monthly Reporting
Under the current contract, the information required in the HRC’s monthly reports to SHRA includes case summaries for all cases opened, closed, or remaining active during the reporting period, including information on the complainant’s protected class status, the nature of the allegation, the type and degree of fact finding and investigation, and, most importantly, the final disposition of the case – specifically, if conciliated or mediated, or referred for outside enforcement, the “results.” The contract’s training requirement calls for staff to receive training from “organizations recognized for their expertise in fair housing education,” including but not limited to the National Fair Housing Alliance, HUD, the San Diego Fair Housing Council, and the Western Center for Law and Poverty. The provision also calls for routine networking with other fair housing organizations and agencies via meetings and conferences. Unfortunately, although well- intended, both of these contractual provisions appear to have missed the mark in important respects.
It would appear from the contract requirement calling for reporting the “results” of settled cases that SHRA should have been able to identify, over time, the complete absence of monetary relief for complainants in the agency’s conciliation agreements. In fairness to SHRA personnel responsible for monitoring HRC activity, however, such an observation would have required SHRA staff familiarity with typical fair housing case settlements and fair housing law – and it would have required that SHRA staff reviewing the monthly reports identify something that was missing from the report, rather than a problem with the information that was provided. Unfortunately, the contract language does not explicitly call for reporting monetary relief to complainants, a requirement which, had it existed, would have immediately alerted SHRA reviewer(s) to the fact that no such relief was being reported because it was not being sought. Failure to explicitly include such a reporting requirement in the post-2004 contracts with HRC was, in hindsight, a major oversight, particularly in light of the highlighted recommendation in the 2004 AI noted above.103
Staff Training
With respect to HRC staff training, the contract language leaves to the HRC the key decisions as to which organization(s) will be utilized to train staff, and how frequently such training will occur. Given the extent of the investigative weaknesses identified in
103 Presumably, given the HRC’s legal position regarding its inability to seek monetary relief for complainants, any attempt by SHRA to include such a reporting requirement in the post-2004 contracts would have led HRC to inform SHRA of the agency’s perceived constraints in this regard.

84
the 2004 AI, the post-2004 contracts should have, in hindsight, identified specific investigative training programs which HRC staff had to attend, established the frequency of such training, and included an annual reporting requirement so that SHRA could monitor the HRC’s compliance with the staff training requirement. Where new fair housing staff was hired, such training should have been mandated within a fixed time frame. It is suggested that future contracts provide more specific language or numerical goals to ensure that such training occurs.
Confidentiality
One other aspect of the post-2004 SHRA-HRC contracts deserves mention here. The 2004 AI observed that the HRC’s mandate with “client confidentiality” was preventing it from publicizing the results of its successful conciliation agreements, and recommended that this policy immediately be changed so that the benefits of widespread dissemination
of successful settlement terms could be achieved.104 The educational value of publicizing settlement terms to the general public, and the corresponding deterrent effect on the housing industry, is an important component of effective fair housing enforcement.
This AI finding and recommendation, however, SHRA contracts with HRC after 2004 failed to address this issue. Indeed, if anything, the post-2004 contracts appear to tacitly endorse the HRC’s position regarding confidentiality by stating, in the new contract section entitled Basic Performance Standards, that “all pertinent information will be reported monthly (see reporting requirement section) unless there is access to information limited by a confidentiality clause.” Emphasis added. It is not entirely clear what circumstances, and information, the highlighted language is intended to encompass. Certainly, as the governmental entity funding the HRC’s fair housing program, SHRA should at all times have complete access to everything in the HRC’s case files. If, on occasion, the parties themselves (i.e., the complainant and the respondent) agree to include a confidentiality provision as part of a settlement, SHRA, like the HRC itself, presumably would be bound by same, but under no circumstances should SHRA ever be
barred from access to the details of the settlement.105
HRC Housing Discrimination Complaint Processing: 2004-2008
Complaint totals and bases
According to the HRC response to the AI questionnaire, the agency received and processed 102, 100, 102, 103 and 103 housing discrimination complaints, respectively,
104 The 2004 AI used the term “successful litigation,” but the full text of the report makes it clear that this recommendation was plainly intended this to encompass any means by which a successful outcome was achieved.
105 It is oftentimes the case that a respondent will seek to condition settlement on the basis of confidentiality. Complainants will rarely seek confidentiality for their own sake, but they may sometimes agree to it where they are otherwise satisfied with the terms of settlement offered or accepted by respondent.

85
between 2004 and 2008.106 The vast majority of these 510 complaints alleged discrimination based on race or national origin (185), physical or mental disability (175), or familial status (78).
Year Number of Complaints 2004 102 2005 100 2006 102 2007 103 2008 103
FIGURE 7.1
Protected Class 2004 2005 2006 2007 2008 Race 38 35 32 28 28National Origin 2 6 8 6 2Physical & Mental Disability
30
34
29
40
42
Familial Status 11 17 17 19 14Gender 1 2 5 3 6Religion 1 1 2 0 1Age 2 2 2 2 4Marital Status 2 1 2 1 0Sexual Orientation 2 2 0 2 2Source of Income 0 0 5 2 4 FIGURE 7.2
Complaint resolutions
The Commission reported that of the 510 complaints which it processed over this five year period, it successfully conciliated a total of 96. An additional 19 complaints were reported as “withdrawn,” and 60 complaints were listed as “referred,” either to HUD, DFEH, or the private bar.107
106 The high degree of consistency between contract goals and performance within fair housing agencies is commonly due to combining bona fide complaints and audits, which can be initiated by staff.
107 In reviewing the agency’s response to the questionnaire the AI consultant noted a disparity between the number of “referrals” reported for 2004 (47) and those from 2005-2008 (13). This was called to the attention of HRC staff on the first day of the on-site visit. The following day, HRC staff attorney informed the consultants that the majority of the referrals in 2004 were not made following HRC findings of evidence of discrimination, but, rather, were made at the request of complainants either prior to completion of investigation or after a finding of no cause/insufficient evidence. According to HRC staff, the data from 2005-2008 reflects only referrals of complaints where evidence of discrimination was found following a completed investigation.

86
2004 2005 2006 2007 2008 Withdrawn 7 4 2 6Conciliated/Mediated 27 12 17 18 22Referred 47 4 3 5 1
FIGURE 7.3
Referral 2004 2005 2006 2007 2008 To HUD 0 0 1 0 0To DFEH 28 3 2 0 0To Private Attorney 19 1 0 5 1FIGURE 7.4
Complainant Awareness of HRC Settlement Policy and Practice
The agency’s annual contracts with SHRA, under the heading Options and Referrals for Complainants, state:
The Commission shall provide the full range of options available to the bona fide complainant immediately after receiving the complaint and again after the fact finding investigation. These options include:
1. Mediation where the parties meet with a facilitator to develop a mutually
acceptable solution to the discriminatory act; 2. Conciliation where the parties negotiate a settlement over the telephone; 3. Referral to HUD for enforcement action; 4. Referral to the state DFEH for enforcement action; 5. Referral to local public interest law firms.
These options shall be fully explained and provided in writing to the complainant; the case file shall reflect the option selected by the complainant.
In addition, the contracts require that a Client Satisfaction Survey be provided to every complainant upon closure of a case, “assessing the level of satisfaction with the fair housing services rendered.” These forms are to become a part of the case file and
submitted with the monthly reports to SHRA.108
Immediately upon learning of HRC’s policy of never seeking monetary relief for complainants, the AI consultants asked HRC staff whether this specific policy was routinely reported and explained to complainants. One staff attorney asserted that it
was.109 Nevertheless, nothing in the written material describing enforcement options which HRC provided to the consultants, and which it routinely provides to complainants,
108 The overwhelming majority of closed case files reviewed by the AI consultant did not include a completed Client Satisfaction Survey. This is not to suggest that the agency did not routinely provide complainants with the form. Response rates to such follow-up surveys are frequently poor, and it would be difficult to ascribe meaning or motive to their absence.
109 On-site interview with HRC staff, October 21, 2009.

87
contains any such explanation. If complainants are ever informed that HRC will never seek money damages on their behalf, it does not appear from either the consultants’ review of the HRC’s literature, or anything in the case files which were examined, that this crucial fact is documented in writing. In fact, most of the case files reviewed in which conciliation was achieved contained a letter to complainant(s) basically encouraging them to come forward and accept the terms of the settlement proposed by the HRC, although in numerous instances, these settlements offered little or no relief of any kind for the complainant, but only prospective changes in respondent’s rules, regulations, and policies, and agreement by respondents to attend fair housing training. Moreover, in none of the complaint files reviewed by the AI consultants was there a recommendation from the HRC to a complainant that they would be better served by having their complaint referred to HUD, DFEH, or a private attorney.110
The HRC’s Fair Housing Handbook, and its other literature, asserts that the agency is “authorized to enforce state and federal fair housing laws.” Nothing in the agency’s written material even hints at the barrier to monetary relief by which HRC asserts it is
legally bound.111 There is, thus, no reason for a complainant to believe anything other than that the agency will do everything possible to protect their rights and make them whole. Given the fact that the HRC only engages in conciliation after concluding that there is evidence that discrimination has occurred, the agency’s failure to routinely refer many, if not most, of those complainants whose cases appeared meritorious to outside enforcement entities suggests a profound insensitivity to the psychic injuries victims of housing discrimination incur. It is difficult to avoid the conclusion that in those cases where evidence of discrimination was found, the HRC preferred to obtain credit for a “successful” conciliation rather than ensure that complainants were fully compensated for their injury.
Other complaint processing shortcomings
The AI consultants asked HRC to make available a sample of closed case files from each year between 2005 and 2008, as well as a separate sampling of what HRC believed to be its “best work.” During the course of their two-day on-site visit the consultants reviewed
a portion of these files.112 The review determined that many of the case processing problems identified in the 2004 AI remain unresolved.
110 In light of the few cases actually referred to DFEH, HUD, and the private bar between 2005 and 2008, it would be useful to know if these cases had any common characteristics, whether the referral occurred as a result of independent complainant action or HRC recommendation, and what the outcome was of each referral.
111 If anything, HRC’s complaint intake process would appear to give complainants the impression that the agency can seek to recover monetary damages. Question 17 on the HRC’s pre-complaint questionnaire asks complainants how they have been injured, and the form expressly includes a box to check if the complainant believes they were injured “economically.”
112 It was impossible to review all, or even a majority, of the files HRC made available in the allotted time, particularly inasmuch as other issues arose requiring extended consultation with SHRA staff during the course of the on-site visit. Because of this, the AI consultants devoted more than half of their review time to those files which HRC characterized as its “best work.”

88
Testing
Review of the case files, along with the data which HRC provided to the AI consultants, indicated that HRC frequently elected to investigate complaints using testing when that was clearly not the appropriate investigative methodology. To a great extent, this appears to have been driven by the agency’s desire to comply with its commitment to using testing, as mandated by the HRC-SHRA annual contracts. Those contracts not only call for HRC to utilize testing “in any bona fide complaint initiated by a complainant alleging denial of available housing based on a protected class . . . within 48 hours of intake,” a fact pattern where testing would normally make good sense, but go on to require that HRC should “include timely testing of at least 75% of all bona fide complaints, including those bona fide complaints initiated by a complainant who is a current tenant alleging discrimination.”
In the AI consultant’s assessment, these latter quoted contractual requirements, newly added in the post-2004 contracts, created a situation in which the HRC found itself regularly trying to pound a square block into a round hole. By demanding, in advance, that a fixed percentage of complaints be tested, without knowing the nature of the complaint allegations that HRC would be receiving, this contract provision inadvertently created a formula for failure. Additionally, specifically requiring testing the majority of complaints filed by current tenants alleging discrimination was another major mistake. Most often, complaints filed by current tenants, as opposed to complaints initiated by individuals seeking housing, are far more difficult to test, because such cases typically involve allegations of differential terms and conditions of tenancy, denials of requested reasonable accommodations or modifications, harassment, or eviction. These types of allegations do not readily lend themselves to any form of investigative testing, and thus are normally investigated through on-site surveys, interviews with other tenants and/or witnesses, review of published management policies and procedures, and examination of management personnel.
The negative impact of the HRC’s misdirected reliance on testing can be further inferred from the complaint data the agency provided.113 Of the 408 complaints taken in by HRC between 2005 and 2008, only 70 (17%) contained allegations of refusal to rent or sell.114
During this same period the agency received a combined total of 397 allegations covering
Nevertheless, the existence of significant investigative shortcomings in virtually all the files which were reviewed strongly suggests that the HRC’s housing discrimination investigative processes needs to seek expert supervision and additional training.
113 HRC response to AI questionnaire, question B.5. 114 The HRC data on types of discrimination alleged for 2004 only reported 28 allegations, although the agency stated that
it received 102 complaints. No explanation was given as to why the allegations in the remaining complaints were unavailable. Only 2 of the 28 allegations reported for 2004 involved refusal to rent.

89
differential terms and conditions, harassment, denial of reasonable accommodations/modifications, and discriminatory eviction.115
SHRA-HRC contracts also contain a provision calling for the agency to “develop the protocol for testing in consultation with the Department of Housing and Urban Development.” Nothing in the material HRC provided the AI consultant suggests that such consultation occurred, or, if it did, that there was any meaningful follow-up. Presumably, if HRC had sought ongoing assistance from HUD, or any other public or private agency experienced in conducting fair housing complaint investigation, a much more carefully targeted testing protocol would have emerged at the agency.
Other Investigation Related Issues
In a number of the complaint files reviewed it was noted that during the course of investigation the HRC interviewed witnesses who not only corroborated the complainant’s allegations, but who also either stated that they themselves had experienced similar discriminatory treatment, or knew of others who had. In such situations it is standard practice for an enforcement agency to aggressively seek out and take complaints from these newly identified potential discrimination victims and/or to enlarge the complaint into a systemic investigation. In the cases the AI consultants examined HRC did neither.
In a similar vein, some of the case files reflected other possible acts of discrimination not alleged in the original complaint. In these circumstances, the files demonstrated that the HRC typically failed to take a broader approach to the investigation by amending the original complaint to add additional allegations. Other files indicted that the HRC conciliated some cases without resolving all the allegations contained in the original complaint.
Timeliness of case processing also appears to be a continuing problem. It appears that this is often the result of delays associated with attempts to set up tests on cases which would be better investigated using other investigative techniques.
An addendum to this chapter contains descriptions of a number of complaints which serve as examples of some of these ongoing complaint processing problems.
Audits
Pursuant to its annual contracts with SHRA, the HRC is directed to conduct “audit” testing in any year in which the agency receives program income from housing
115 The total number of allegations exceeds the number of complaints because some complaints allege discrimination on more than one basis.

90
discrimination complaint conciliations,116 or from other sources. The size and scope of the audit is to be dictated by the amount of such program income as is available. Audits were, in fact, conducted in every year between 2004 and 2008. Typically, it would appear that the agency targeted one or two types of discrimination against a particular protected class in any given year. The results of the agency’s audits are reflected in Figure 7.5. In those instances where HRC audits showed evidence of discrimination, the agency typically required the respondent to attend fair housing training conducted by HRC staff, and, where appropriate, to modify their rules, policies, and practices.
Year Basis of Audit Results (rate of discrimination) 2008 Race (African American)
Display of HUD Fair Housing Poster 22/100 (22%)
55/100 (55%) failure to display poster 2007 Physical Disability (persons who use
wheelchairs and service animals) 34/100 (34%)
2006 Families with Children 12/105 (11%) 2005 Mental Disability (persons with
companion animals) 49/100 (49%)
2004 Sexual Orientation 16 of 100 (16%) FIGURE 7.5
Outreach and Education
This is an area in which the HRC appears to have made a substantial amount of progress since the last AI. The agency has expanded its efforts in both written educational materials and direct contact with the community.
The 2004 Analysis stated that “outreach and education should be carried out in such a manner that it is responsive to and reflective of the community. For Sacramento that means, at a minimum, distribution of large quantities of multi-lingual literature and the
introduction of fair housing services to a wide spectrum of social service agencies.”117
The 2004 AI reported, however, that the agency had “no literature descriptive of the
protected groups and no plans for the development of such literature.”118 The report also stated that “[w]hile the Commission does work with a wide variety of agencies, they have no written material in languages other than English. The only written fair housing material available from the Commission is the Fair Housing Handbook. Of the handbook’s fifty-six pages, five pages are devoted to fair housing.”119
116 Although the HRC does not seek or obtain monetary relief for complainants, it routinely does negotiate payments from respondent to the agency, as part of its conciliation agreements. Frequently these payments are structured as compensation to the agency for mandated training provided to the respondent as part of the conciliation agreement.
117 2004 AI at 7-5 118 Id.. 119 2004 AI at 7-3.
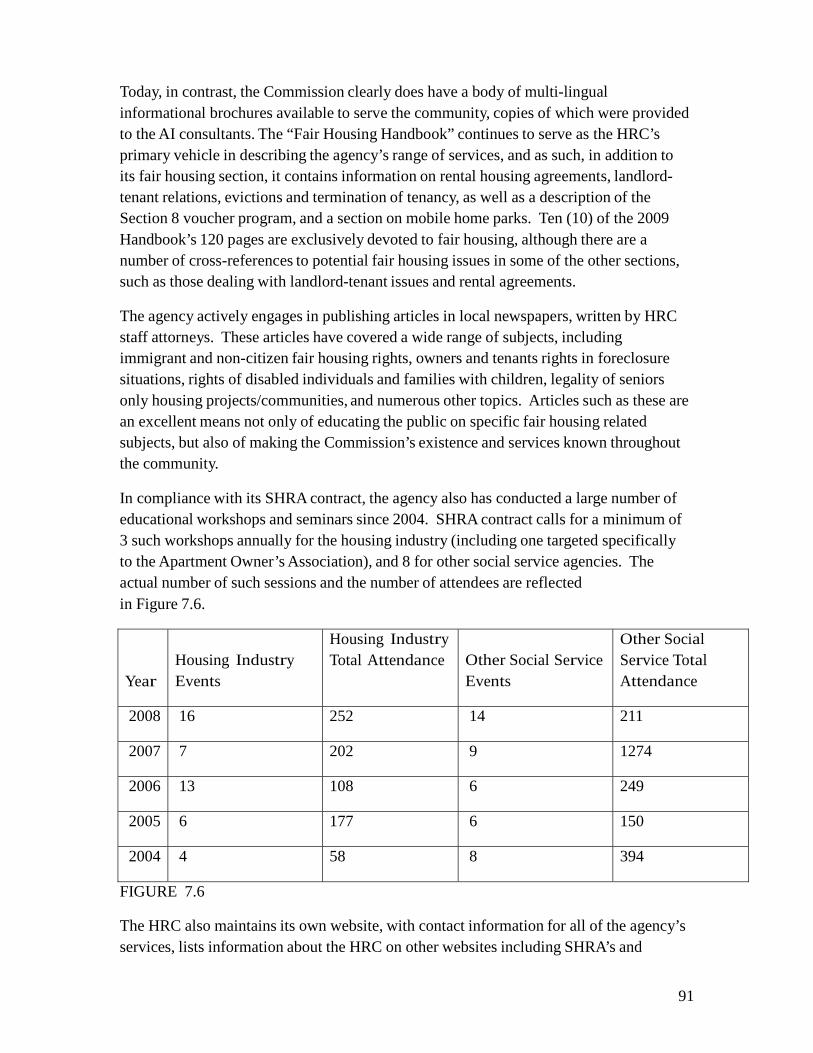
91
Today, in contrast, the Commission clearly does have a body of multi-lingual informational brochures available to serve the community, copies of which were provided to the AI consultants. The “Fair Housing Handbook” continues to serve as the HRC’s primary vehicle in describing the agency’s range of services, and as such, in addition to its fair housing section, it contains information on rental housing agreements, landlord- tenant relations, evictions and termination of tenancy, as well as a description of the Section 8 voucher program, and a section on mobile home parks. Ten (10) of the 2009 Handbook’s 120 pages are exclusively devoted to fair housing, although there are a number of cross-references to potential fair housing issues in some of the other sections, such as those dealing with landlord-tenant issues and rental agreements.
The agency actively engages in publishing articles in local newspapers, written by HRC staff attorneys. These articles have covered a wide range of subjects, including immigrant and non-citizen fair housing rights, owners and tenants rights in foreclosure situations, rights of disabled individuals and families with children, legality of seniors only housing projects/communities, and numerous other topics. Articles such as these are an excellent means not only of educating the public on specific fair housing related subjects, but also of making the Commission’s existence and services known throughout the community.
In compliance with its SHRA contract, the agency also has conducted a large number of educational workshops and seminars since 2004. SHRA contract calls for a minimum of 3 such workshops annually for the housing industry (including one targeted specifically to the Apartment Owner’s Association), and 8 for other social service agencies. The actual number of such sessions and the number of attendees are reflected in Figure 7.6.
Year
Housing Industry Events
Housing Industry Total Attendance
Other Social Service Events
Other Social Service Total Attendance
2008 16 252 14 211
2007 7 202 9 1274
2006 13 108 6 249
2005 6 177 6 150
2004 4 58 8 394
FIGURE 7.6
The HRC also maintains its own website, with contact information for all of the agency’s services, lists information about the HRC on other websites including SHRA’s and

92
Volunteer Match, appears on local news programs, and sponsors radio and TV public service announcements.
One area in which the HRC has made a particularly useful contribution is in the development and distribution of specialized packets, or kits, which can be utilized both by handicapped home-seekers or tenants, and by landlords, in making, accepting, and processing requests for reasonable accommodations and reasonable modifications. These materials serve not only as a means of expediting such requests and avoiding potential discrimination issues, but also as a front line mechanism for educating the housing industry on its obligation to grant such requests under fair housing law.
Summary
Six years ago the 2004 AI concluded that weak fair housing enforcement by the HRC, the agency funded by SHRA in order to satisfy its CDBG fair housing requirement, actually amounted to an Impediment to Fair Housing Choice.
In the area of community outreach and education the HRC clearly has improved its performance since the last AI. The agency has increased the number of formal training workshops which it holds annually (generally exceeding SHRA contract requirement), actively engaged in publishing newspaper articles on a wide range of fair housing topics, produced fair housing brochures in numerous languages other than English, and maintained its exposure on its own website and those of other entities, such as SHRA.
Assisting victims of housing discrimination to obtain relief still needs improvement. On- going training from experts in the field is available and should be accessed. Complaint investigations need to be responsive to the specific circumstances of each case and not a blanket dictate for just one method of investigation. The private bar, HUD and DFEH should be used for referring cases that need or warrant further enforcement.
The 2004 AI made recommendations designed to address most of these deficiencies, and SHRA modified its annual contracts with HRC in certain respects in an attempt to rectify at least some of the problems. Unfortunately, the contracts’ training requirement failed to achieve the desired results, the monthly reporting requirement overlooked perhaps the most crucial aspect of complaint results – monetary relief obtained in conciliation, and the contracts remained silent regarding the benefit to routinely publicize the content of case settlements.
Finally, overarching all of these concerns, is the HRC’s mandate that it is legally prohibited from seeking any type of monetary relief for those complainants whose cases the HRC found were meritorious, combined with the agency’s clear preference for conciliating such cases rather than referring them to outside enforcement agencies or to

93
the private bar, through whose efforts the victims of discrimination could have sought compensation for their injuries.
Recommendations
Nothing in the CDBG program expressly requires entitlement jurisdictions to establish, or
provide support to existing, governmental fair housing enforcement agencies.120 Block grant recipients can chose from a wide range of activities to meet their CDBG fair housing obligations, including, but not limited to, affirmative marketing programs, community-wide educational efforts, and a variety of working relationships with private non-profit fair housing agencies, legal clinics, or the private bar.
Where, however, an entitlement jurisdiction elects to meet its fair housing obligation by funding a governmental fair housing enforcement entity, the funding jurisdiction has a fundamental responsibility to ensure that that entity is, in fact, furthering the cause of fair housing. The operative question is what to do prospectively. The AI consultant makes the following recommendation:
Take steps to remedy the deficiencies in the current SHRA-HRC relationship and Raise HRC performance to an acceptable level
Notwithstanding the shortcomings identified in the HRC’s fair housing enforcement effort, there are a number of reasons why continued SHRA support of the agency is justified. First, it seems likely that even without SHRA funding the HRC will continue in operation as the area’s primary, if not sole, fair housing enforcement entity. The agency has been around for a long time and its existence is known throughout the Sacramento region. Arguably, any SHRA efforts to establish or fund an alternative enforcement program could be viewed as creating unwarranted competition and a duplication of services, and thus counter-productive. Second, SHRA has made a very substantial financial investment in the HRC, totaling almost 2 million dollars over the last ten years. Third, The HRC has intelligent and dedicated staff in place with a clear willingness to put in the necessary work effort to achieve meaningful results. With appropriate initial and ongoing training, there is no reason to believe that this staff could not effectively investigate and resolve housing discrimination cases.
If SHRA does determine to continue its relationship with the HRC, a number of critical questions must be answered, and a number of issues must be comprehensively addressed.
120 Indeed, senior staff from SHRA pointed out that SHRA had, in fact, gone well beyond what was required of it by CDBG regulations in attempting to support a full-scale fair housing enforcement program for the Sacramento region over the past decade. Conference call with SHRA senior staff, June 14, 2010. Their point is well taken. Whatever other conclusions the shortcomings in this chapter point to, it should not be overlooked that SHRA has made a commendable commitment to fair housing enforcement during this era.

94
Monetary Compensation for Complainants – SHRA legal staff, under the guidance of its General Counsel, should ascertain whether or not the HRC’s assertion that California law prohibits it, as a government agency, from obtaining monetary relief for complainants in conciliation is correct. In answering this critical legal question, SHRA should (a) review
all of the legal research which the HRC has already done on this question,121 (b) independently research relevant State statutory and regulatory authority, case law, and interpretive opinions from the Attorney General and/or the DFEH General Counsel, and (c) contact other local governmental fair housing enforcement agencies, such as the San Francisco Human Rights Commission, to obtain their views on the question and assess what needs to happen to allow the HRC to help secure full remedies.
If, after thorough examination, the position of the HRC that it cannot negotiate monetary relief for complainants in conciliation is confirmed, all future contracts between SHRA and the HRC should require:
(1) that every complainant be informed, in writing, both at the time of filing a
complaint and again after a finding of evidence of discrimination and prior to the commencement of any HRC conciliation effort, that (a) the HRC is not empowered to obtain money damages for the complainant; (b) the complainant has the option to have their complaint referred to HUD, DFEH or to a private attorney, any of which can seek such damages; and (c) the HRC will assist the complainant in selecting an appropriate enforcement agency or attorney if they wish to pursue the complaint and seek damages;
(2) that no HRC conciliation agreement be executed closing a complaint file without
the written consent of the complainant, acknowledging the terms of the agreement, and expressly waiving the opportunity to have the file referred to HUD, DFEH, or private counsel, and any right to compensatory damages.
Alternatively, if SHRA’s research demonstrates that the HRC’s legal position on damages is incorrect, and the agency does have the power to negotiate conciliation agreements containing monetary compensation for complainants, all future contracts should require:
(1) that the HRC fully assess, at the time of intake and throughout the course of the
investigation, the out-of-pocket and psychic injuries and damages sustained by the complainant, and keep a separate record of same. This assessment should be required whether or not the complainant identified economic injury on the agency’s pre-complaint questionnaire; and
121 HRC staff attorney stated to the AI consultants during the course of the on-site visit that the agency had a file drawer full of legal research on this specific question.

95
(2) that every conciliation agreement negotiated by the HRC following a finding of evidence of discrimination contain appropriate monetary damages for the complainant in addition to any other relief or remedial provisions, unless the complainant expressly waives the right to such damages in writing.
Confidentiality of Conciliation Agreements –
(1) SHRA should condition any future funding of the HRC on the agency’s
immediate abandonment of its long-standing policy of maintaining absolute confidentiality regarding the parties to, and terms of, all HRC negotiated conciliation agreements. Future contracts between SHRA and the HRC should require that, absent extraordinary circumstances, the contents of all agency negotiated settlements will be treated as public information, and will be subject to publication at the discretion of the HRC, SHRA, or either party.
(2) In the event that a respondent, a complainant, or both request confidentiality as a
conciliation condition, and the HRC believes it is in the public interest to accede to such a request, the agency should be required to submit such a request to SHRA along with an explanation of the reasons confidentiality is deemed appropriate or acceptable. No conciliation agreement containing a confidentiality provision should be executed without the prior written approval of SHRA.
Testing –
(1) All future contracts should be modified to remove any commitment to testing
a specific number or percentage of all complaints received. An appropriate investigative strategy should be required for every complaint. The investigation should be based solely on the allegations in the complaint, the type of discrimination alleged, and the specific facts and circumstances pertaining to each complainant.
(2) SHRA should immediately commence a comprehensive review of the HRC’s
existing complaint investigation processes and protocols, with particular focus on the agency’s testing protocols, the adequacy of the pool of experienced testers, the timeliness of testing from complaint intake through inception and completion of testing, and the quality of agency oversight and guidance.
(3) Following completion of the above-referenced review, SHRA should require
the HRC to revise its complaint investigation program in consultation with HUD and/or the entity chosen to conduct the testing review.

96
Fair Housing Staff Training –
(1) Training: In the first new contract year, fair housing training of HRC staff should be intensive, and conducted in-house for all staff with any role in, or level of responsibility for, the intake, investigation, referral, and/or settlement of housing discrimination complaints. Comprehensive in-house training should likewise be required in all future contracts for any new staff hired in subsequent years who have not previously received such training. SHRA should identify one or more specific training resources which the HRC must use in conducting such in-house training.
The staff training requirements in all future contracts after the first year should specifically identify those off-site investigative and legal training forum(s) and programs SHRA expects HRC staff to attend, and the number of staff expected to attend each. Additional training should be at the HRC’s discretion All off-site fair housing training completed by HRC staff should be reported to SHRA in the month such training is completed.
Tracking and Reporting Results of Referred Complaints – Future SHRA-HRC contracts should require that in all instances where the HRC completes an investigation and finds evidence of discrimination, and the agency thereafter refers the case to HUD, DFEH, or the private bar for further enforcement action, the HRC will maintain an open record of the complaint, monitor the case to final disposition, and report the case outcome to SHRA when it becomes available, as part of its monthly reporting.
* * * * * * * * * * *
A D D E N D U M

97
HRC Case Allegation HRC Investigation Issue
07-H-037
Gender:(Sexual Harassment) (In Place Tenant)
Disability:(Deposit charged for a Companion Animal)
Testing and over the phone conversations with witnesses.
Written accommodation request sent requesting deposit be refunded since animal is not a pet.
-Should not test, survey and witness statements are appropriate.
-A witness should have become a co-complainant and case should have been referred to an enforcement entity.
-No Conciliation Agreement in case file.
-No follow through with confirmation that manager out and no longer bothering complainant.
06-H-011
Race (In place tenant)
Testing
A survey should have taken place; the complainant was rented to by this manager which typically means testing will not yield results. Survey may then warrant individual witness statements and possibly new bonafide complainants.
07-H-100
Disability (Reasonable Accommodation to stabilize tenancy. (In Place Tenant)
Doctor’s note requested and received by HRC. HRC decided to close the case and not write a reasonable accommodation letter.
-Once support letter from doctor was received, the HRC should have formally requested the reasonable accommodation. Part of the accommodation should have outlined a long term action plan to ensure behavior would not happen again. There is nothing noted in the file as to why the HRC decided not to write the accommodation. A review of the doctors’ note occurred and was sufficient to use.
- Complainant had to seek help from another agency. Notes document that the Complainant did not understand why her case was closed.

98
06-H-016
Complainant phoned requesting a reasonable accommodation for a parking space in which she can use her walker. Another reasonable accommodation request for a companion animal requested. (In Place Tenant)
Reasonable accommodation request for parking space and companion animal made by HRC in addition to testing for acceptance of companion animal even though they have a no pets policy.
-Complainant clearly stated that owner trying to offer as a remedy a common disabled parking space in which others park there. HRC did not advise the owner that this is not an acceptable reasonable accommodation and closed the case as conciliated.
07-H-010
Familial Status: refusal to rent (Prospective Tenant)
Testing. Testing revealed a 2 bedroom would not be rented to a mother with two children.
-HRC negotiated a training with owner for $250.
-Complainant received nothing even though denied the opportunity. File was not filed with an enforcement agency for next steps.
07-H-023
Disability: Reasonable Accommodation for an assigned parking space. (In Place Tenant)
Reasonable Accommodation request made by HRC.
-Reasonable Accommodation granted, but complainant had been requesting the reserved parking space for 4 years previous to reporting to HRC. Other forms of relief should have been sought.
07-H-024
Disability: Reasonable Accommodation for a companion animal. (In Place Tenant)
Testing and Reasonable Accommodation request by HRC.
-No written evidence of conciliation agreement which is standard for HRC reasonable accommodation requests.
-No training for owner
07-H-043
Familial Status: Restrictive Pool Rules (In Place Tenant)
HRC spoke to housing provider surrounding discriminatory pool rules.
-File notes state successful conciliation but no documentation in file of housing provider agreeing to change policies.
-Surveying should have taken place.
07-H-059
Disability: Reasonable Accommodation for a companion animal. Additionally, housing
Testing for disability discrimination to determine if housing provider would allow companion animal.
-HRC should have requested support letter from physician for reasonable modification and once received moved forward with reasonable

99
provider refused request
for grab bars to be installed in bathroom. (In Place Tenant)
No documentation in file of reasonable modification request made by HRC for grab bars.
modification request.
-No documentation of reasonable accommodation for companion animal granted via HRCs standard reasonable accommodation/modification form.
100
CHAPTER 8. RESOURCE MANAGEMENT, SHRA PLANNING AND PROGRAMS, AND FAIR HOUSING CHOICE
Overview
A meaningful assessment of how well any jurisdiction is doing in eliminating Impediments to Fair Housing Choice and affirmatively furthering fair housing must include a review of all the financial resources which have been and are available to it, and how those resources have been integrated and distributed, particularly with regard to meeting the housing needs of moderate, low, and very low-income persons and underserved populations. SHRA is not only a recipient of CDBG funds; it also actively participates in the Federal HOME program, receives funding from the state under the CalHOME and BEGIN programs, which assist in rehabilitation and first time homebuyer programs, and has access to local Redevelopment Agency set-asides, which support a variety of housing objectives.
In this regard, and as an overarching observation, it can be stated unequivocally that SHRA’s housing planners and managers have been keenly aware of the circumstances confronting them in recent years, and have been aggressive and innovative in their efforts to address the housing needs of the residents of the City and County of Sacramento. Working with limited, and sometimes diminishing, levels of financial resources, SHRA has, to a remarkable degree, managed to successfully coordinate and integrate activities across agency and program lines in order not only to accomplish many of the specific housing related objectives set forth in SHRA’s Consolidated Plans, but often to exceed them. The dimensions of the economic and housing crises currently facing the region should not obscure these tangible accomplishments.
This chapter will briefly review some of SHRA’s accomplishments over the past 5 years, with specific emphasis on how they relate to increasing both the supply of affordable housing, and the locational housing opportunities, for the region’s low and moderate income residents.
Institutional Structure
SHRA is a Joint Powers Authority created as a public agency by the City and County of Sacramento in 1973. SHRA is the lead public agency for the City and County regarding affordable housing, public housing, and community/neighborhood development. As a joint City/County agency, SHRA is uniquely positioned to address a wide range of cross jurisdictional and regional challenges, as many housing and community development issues transcend geopolitical boundaries.
SHRA’s various departments routinely implement activities that involve cross- departmental and inter-organizational communication and cooperation. For example, the loan-processing department is responsible for production of homebuyer programs and single-family rehabilitation loans, while the marketing of homebuyer programs is

101
generally carried out by the Community Development and Development Services Departments. The integrated nature of SHRA ensures that staff can focus on their individual areas of expertise while utilizing resources across departmental lines. SHRA’s City Community development staff further exemplify cross departmental and inter- agency coordination as they routinely work with community partners in various neighborhoods and redevelopment areas. Staff regularly coordinates activities with the City departments of Transportation, Planning, Parks and Recreation, and Economic Development related to affordable housing, public facilities, and infrastructure improvements. SHRA’s County staff likewise works closely with city officials from the incorporated jurisdictions within the County covered by the agency’s entitlement program. And, as the oversight agency responsible for administration of both the City and County of Sacramento’s public housing programs, SHRA is able to ensure that all public housing programs - traditional project-based housing, housing choice vouchers, and PHA homebuyer initiatives – are coordinated with SHRA’s other affordable housing efforts.
Increasing Affordable Housing
Between 2004 and 2008 SHRA’s various programs increased the supply of affordable housing throughout the agency’s jurisdiction by 1,240 units. Of these, 813 were the result of new construction, and an additional 427 units became available through acquisition and/or rehabilitation of existing properties. During this same period SHRA’s programs also contributed to the development of 2,389 units of market rate housing.
SHRA Supported Housing
2004 - 2008
2004
2005
2006
2007
2008
Affordable
Market
Rate
Affordable
Market
Rate
Affordable
Market
Rate
Affordable
Market
Rate
Affordable
Market
Rate Acquisition
& Rehab
24
129
92
67
72
646
126
80
113
460 New
Construction
0
0
113
370
115
195
261
145
324
297
TOTAL
24
129
205
437
187
841
387
225
437
757
FIGURE 8.1
Leveraging Federal Financial Resources
One way in which SHRA maximizes the impact of its CDBG, HOME, and other Federal funding is through “leveraging.” Essentially, SHRA almost always uses its limited Federal funds in concert with private sector investment and/or lending in order to

102
increase the agency’s capacity to effect change. Year-to-year the highest level of “leveraging” occurs in SHRA’s new construction and first time homebuyer
programs,122 although such leveraging exists in virtually all SHRA housing related initiatives.
In Sacramento City, the combined total of SHRA administered Federal dollars between 2004 and 2008 was $77,335,000. These funds were utilized to leverage and additional $1,120,823,000 in private funds, a ratio of almost 14.5 to 1. In the County, SHRA’s housing related programs over the same period had a slightly lower, but still impressive, leveraging ratio of 11.35 to 1, with $82,470,000 in Federal funds attracting $936,688,000 in private capital. A year by year breakdown on the leveraging of private investment in the City and County is provided in Figure 8 .2.
FIGURE 8.2
Leveraging Federal Dollars * 2004 - 2008
City County
Federal Funds
Private Capital
Ratio Federal Funds
Private Capital
2004
13,539
187,799
14 to 1
14,983
164,967
2005
16,706
253,091
15 to 1
15,067
168,402
2006
18,729
263,174
14 to 1
18,237
173,913
2007
17,063
295,244
17 to 1
23,942
344,308
2008
11,298
121,515
10 to 1
10,241
95,098
(*in thousands)
Innovative and Integrated Homebuyer and Homeowner Assistance Programs
First Time Homebuyer Programs
Commencing with the receipt of its initial grant of American Dream Down Payment Initiative (ADDI) funding in 2004, SHRA launched a comprehensive effort to incorporate the new HOME funding with already existing first time homebuyer programs. The result was a revised “layering” policy, designed to maximize and carefully target program benefits to lower-income homebuyers and/or to properties located in specific target neighborhoods or low-income areas. The new program enabled SHRA to combine, in a variety of ways, homebuyer assistance funds so as to create
122 City and County of Sacramento Consolidated Annual Performance and Evaluation Reports (CAPERS), 2004-2008.

103
affordable home purchase options for the widest possible range of eligible recipients. ADDI was thus added to an existing array of programs, including SHRA Mortgage Assistance Program, the First Time Homebuyer Program, the Target Area Homebuyer Program, the CalHome Mortgage Assistance Program, and the homebuyer assistance programs of the City and County Public Housing Authorities, as well as the Mortgage Credit Certificate Program (a tax credit program).
The new “layering” policy essentially permitted SHRA to combine resources from more than one program, and to provide varying levels of down payment assistance to prospective homeowners based on their level of need. Thus. prospective owners earning between 60 and 80 percent of the area median income were made eligible for a combination of assistance from three different programs; those with incomes of 80 percent or more of area median were made eligible for a combination of funds from any two programs.
Between 2005 and 2008 at least 84 new homeowners were supported by assistance from SHRA’s City of Sacramento ADDI program, and at least an additional 99 families
became homeowners under the County’s ADDI program.123
SHRA is aggressive in seeking to ensure that assistance to new homeowners is effective. To help prepare applicants for the responsibilities of undertaking and maintaining homeownership, all applicants must complete SHRA’s approved homebuyer education classes. These classes cover the home buying process, property maintenance practices, credit, and family budgeting practices. The classes must be successfully completing prior to purchasing a home with SHRA assistance.
“Create a Loan” Program
Another closely related example of how SHRA remains vigilant in maximizing and maintaining the effectiveness of its programs is the manner in which the agency adjusted its “Create a Loan” program. This program was originally intended to preserve existing affordable housing stock, prevent displacement of existing homeowners, and revitalize lower-income neighborhoods. In 2004, as part of its regular annual staff review of all programs, SHRA realized that while the program had assisted many individual homeowners, the delivery of loans was scattered over too large an area to make a significant impact on any particular distressed neighborhood. In response, SHRA moved to modify the program to concentrate the available HOME rehabilitation dollars in
123 City of Sacramento 2005-2008 CAPERs at pp. 27, 27, 28, and 25 respectively; County of Sacramento 2005-2008 CAPERs at pp. 27, 26, 28, and 26 respectively. The CAPERS also state that a number of ADDI assisted purchases in most years involved the purchase of properties under the public housing program’s section 5(h) initiative, either by public housing residents or voucher recipients, or by members of the general public, but it is not clear if these figures are a subset of the ADDI total reported for each year, or represent additional homebuyer assistance..

104
specific target neighborhoods. SHRA estimated that the change in program delivery would make a visible change in one or more neighborhoods.
SHRA’s ability to incorporate new programs and resources into its existing panoply of initiatives and programs, and its proven capacity to identify problems or shortcomings in existing programs and make timely and effective changes, are two sides of the same coin – quality administration of a complex and demanding regime.
The Housing Trust Funds
Another excellent example of how SHRA has fostered the development of locationally specific affordable housing throughout the City and County is the Housing Trust Fund (HTF). With the support of SHRA, both the City and County of Sacramento adopted
ordinances establishing HTFs.124 The requirements of both ordinances are essentially identical, and mandate that private developers of commercial real estate pay a fixed amount into the applicable HTF to ensure the availability of affordable housing for new workers in any lower income jobs tied to the commercial development. As such, the HTFs represent a concrete step in ameliorating if not preventing the dislocation between job location and housing location experienced by so many lower income workers.
The HTF ordinances establish specific fees to be paid into the Funds, based on the type of commercial development involved and the square footage of the project. HTF fees are applicable not only to entirely new commercial construction projects, but also to additions to existing businesses and remodeling of interior space where the type of business is being changed. The highest fees per square foot apply to office, hotel, and research and development sites, with lower fees for other commercial, manufacturing, and warehouse developments. Payment of all fees is a precondition for the issuance of a building permit. The HTFs are administered by SHRA, and can thus be utilized in conjunction with all of SHRA’s other available housing development resources in order to maximize impact.
Some examples affordable housing developed or under development using HTF funds include:
• The Saybrook Apartments, a converted dilapidated motel now serving as a supportive housing complex containing 61 units occupied primarily by very-low and low income individuals completing transitional housing program;
124 The City’s ordinance was adopted in March 1989. City of Sacramento 2003-2007 Consolidated Plan at 3-65. The County’s ordinance was adopted in [SHRA – PLEASE PROVIDE DATE].

105
• The Silverado Creek Apartments, a 12 building complex set aside for targeted income groups for at least 15 years. This project includes 63 units at rent levels affordable to households earning no more than 60% of area median income (AMI) and an additional 72 units for households earning no more than 50% of AMI, and will be maintained as affordable for a minimum of 55 years per the terms of SHRA loan agreement;
• The Colonia San Martin project, a 12 building complex comprised of 36 one- bedroom, 18 two-bedroom, and 6 three-bedroom apartments, adjacent to the Florin Mall. Of the 60 total units, 40 are to be reserved for income eligible households with HIV?AIDs, and 19 of the other 20 units for households with incomes no greater than 50% of AMI; and
• The Natomas Family Apartment, a 135 unit family complex which will satisfy the mixed income housing requirements applicable to the master plan for the Natomas Place development, and which will consist of 47 extremely low income units, 44 very low income units, and 43 low income units, in 5 three-story buildings. A mix of one, two, and three bedroom apartments complemented by a clubhouse, community rooms, a classroom with a computer lab, tot lots, a picnic area and a swimming pool, along with 232 covered and uncovered parking spaces highlight this affordable development.
Other Innovative Programs and Initiatives
Transit Oriented Housing Developments
The development of affordable housing proximate to public transportation is another key to enhancing fair housing choice. By providing housing opportunities near major rapid transit lines, SHRA enhances the ability of lower income households to commute to and from work sites and shopping at a reasonable cost, a factor that can make a significant difference in the quality of life of low and moderate income families.
Specific examples of such transit oriented developments include:
• The 65th Street Transit Village, which, when completed, will include housing, commercial space, a hotel, and retail establishments, and which will involve a reconfiguration of the existing proximate bus and light rail circulation patterns to better serve the community;
• The Township 9 Building Infrastructure Project, which will expedite the creation of a mixed-use transit oriented development located at the intersection of North Seventh street and Richardson Boulevard in the River District;
• The 626 I street project, a 12 story mixed-use building, first constructed in 1975 for the Housing Authority. The first three floors are office/commercial, while the

106
remaining floors will provide 108 units of housing for elderly and/or disabled households;
• The development of mixed income housing at the La Valentina site, which will serve as both a transit oriented development for the City of Sacramento and as an important revitalization of the Alkali Flat neighborhood; and
• Streetscape improvements and mixed use developments currently planned around the Globe Light Rail Station to create additional housing and commercial growth in and around the station and the adjoining area.
Infill Projects
Another way in which SHRA has demonstrated its capacity to respond to changing circumstances in the region’s housing market is agency’s current focus on “infill” projects. As the single-family housing market began to collapse, SHRA recognized that a redirection of housing resources to inner city projects made a good deal of sense. This was particularly true where such an investment could serve to help revitalize a declining area.
One excellent example of such a project is Globe Mills, in Alkali Flat. The Mills, a former grain and cereal mill complex, is a designated City Historic Landmark, but it was in a severely dilapidated and declining condition since ceasing commercial operation in 1970.
After four years of pre-development work, SHRA positioned itself so as to save the complex from further deterioration and return the site to productive use. The project is designed to preserve all of the historic structures on the site, converting them to a 31 market rate one- and two-bedroom apartments, while simultaneously adding two new buildings which will house 110 low-income seniors. The architectural design of the new buildings will complement the historic architecture of the sites original buildings. The project, upon completion, will also include tenant-serving retail and common area facilities, as well as supportive services and classes to enhance the quality of life for the senior citizens residing there.
The Powerhouse Science Center is another example of creative “infill” planning and development. The Center will be the premier science and space learning center in the City
of Sacramento. It will serve as a model for 21st century experiential education in science, math, technology, engineering and space, as well as an exemplary “green” building that serves as an environmental teaching laboratory. Located on the Sacramento River in the River District, the historic PG&E Power Station is the first choice location, because the buildings position on the riverfront is highly visible, heightening awareness of the Center.
107
Plans are also underway to improve alleys between buildings in downtown Sacramento, to make them friendlier to businesses and other commercial activities. It should also be noted that a number of SHRA’s transit-oriented developments are also “infill” projects, including the Township 9 and 626 I Street Projects.
SHRA is also currently engaged in developing an even more comprehensive Infill Housing Plan. The will entail designing separate infill plans and projects for selected infill areas and redevelopment areas within Sacramento City. There will be five sets of plans with different elevations modified or created, in addition to a marketing plan focusing on builders, contractors, and property owners. These plans are being funded with CDBG resources, and, where appropriate, will be integrated with NSP projects for vacant foreclosed properties which SHRA has bought.
Responding to the Foreclosure Crisis
In no area has SHRA been more proactive than in its response to the foreclosure crisis which has enveloped the City and County of Sacramento over the past three years. The past, current, and planned future activities and initiatives of SHRA, relying primarily but not exclusively on the Neighborhood Stabilization Program (“NSP”), have been and will remain a critical component in stabilizing the region’s homeownership market.
Background
SHRA has tracked foreclosure activity in the City and County of Sacramento since October 2007. SHRA delivered three separate reports on the subject of foreclosure prior to receiving authorization to begin implementation of the NSP on February 24, 2009. The first report was a memorandum to the Mayor and Council and the Board of Supervisors on December 12, 2007, “Foreclosures in Sacramento.” The second report was on April 11, 2008, “Sacramento Foreclosure Trends and Potential Local Initiatives.” Those reports predated substantial action by the federal government related to the foreclosure crisis.
In July 2008, Congress passed the Housing and Economic Recovery Act of 2008 (HERA) and required The US Department of Housing and Urban Development (“HUD”) to release the $3.9 billion formula allocation and program guidelines pertaining to the one- time CDBG allocation intended to address foreclosures. HUD awarded $31,870,289 to the City and County of Sacramento from the NSP; as such all funds must be committed by September 30, 2010. The award allocates $18,605,460 to unincorporated Sacramento County and $13,264,829 to the City of Sacramento. These funds are administered by SHRA and will be targeted to areas that are hardest hit by foreclosures and subprime lending. The NSP targets areas in the City and County that are most severely impacted by foreclosures and in weaker housing markets that are not as readily able to recover without assistance.

108
Programs
Several new programs have been developed under the NSP with similar shared goals to:
• Return vacant foreclosed or abandoned residential properties to occupancy as quickly as possible;
• Revitalize neighborhoods through strategic redevelopment, rehabilitation and reuse of vacant properties; and
• Provide affordable homeownership and improved affordable rental opportunities to Sacramento families.
Vacant Property Program (VPP)
This new program was modeled after SHRA’s successful Boarded and Vacant program. The VPP is designed to return vacant and blighted homes to owner occupancy by partnering with local builders and non-profits in targeted areas of the City and County. The Program provides a developer incentive fee to be paid after homes are rehabilitated and sold to owner-occupants.
The program leverages external funding sources by requiring participating builders to purchase properties using their own resources, then allows the builder to access NSP rehabilitation funding, and provides a $30,000 developer fee upon sale to an eligible homebuyer. Staff anticipates that at least 160 homes in both the City and County can be assisted through the VPP.
As the VPP will be geographically targeted in lower-income neighborhoods, it is anticipated that prices will be affordable to families at 80 percent of median income. However, HERA regulations allow maximum sales prices up to 120 percent of median income. In no instance will a home be sold at a price that exceeds the total of acquisition, rehabilitation/construction, and disposition costs.
Block Acquisition and Rehabilitation (Block)
SHRA is seeking to consolidate ownership and create unified property management through a block acquisition and rehabilitation activity outlined in the NSP. It was also envisioned that this strategy would be used to address the very low income housing requirements under NSP, which mandate that 25 percent of all NSP funds must assist households at or below 50 percent area median income (“AMI”).
The NSP identified eligible blocks where this strategy likely could be implemented including Western Avenue, Nedra Court, Coral Gables, and Morrison Creek Estates in the City and Clover Manner, Morningstar Drive, Gigi Place & Della Circle, Lerwick Road, and Norcade Circle in the County. To ensure success, SHRA analyzed individual blocks

109
based upon current data illustrating both current foreclosures and likely future foreclosure activity. Implementation required SHRA to determine significant opportunities to consolidate ownership due to foreclosures and to create a unified property management structure with onsite management.
Based on these criteria, Morrison Creek Estates, Lerwick Road, and Norcade Circle were selected and each recieved $4 million in NSP funds to undertake planning, acquisition and rehabilitation activities. These fourplex communities are significantly blighted and have experienced a significant number of foreclosures. An opportunity exists to acquire and/or rehabilitate up to 120 foreclosed units to leverage with additional local resources.
Property Recycling Program (PRP)
The NSP contemplated an entity (government, affiliate or private) to quickly acquire foreclosed properties and adjacent parcels, conduct the necessary rehabilitation or demolition, rent or sell and engage in redevelopment.
SHRA established the Property Recycling Program to pursue a highly targeted acquisition strategy focusing on properties in the Target Areas that meet the following criteria:
1) Acquisition price not to exceed $500,000;
2) Price meets the required NSP discount of 1% below assessed value; and,
3) Meets targeting requirements by --
• Supporting larger site assembly efforts for the City or Redevelopment Agency;
• Acquiring properties located in NSP Target Areas for the purpose of
rehabilitation. The acquired properties are transferred to Volume Builders and Mission Builders for rehabilitation. SHRA provides a Rehabilitation Loan to complete the construction based on approved construction standards; or
• Property can be absorbed into the Housing Authority’s property management
portfolio; or
• Property is significantly deteriorated such that the property is unmarketable or rehabilitation is not reasonable. Properties meeting this targeting requirement would likely be blighted and pose a health and safety issue to the neighborhood, thus likely necessitating demolition and land banking for a period of time to alleviate the negative impacts of foreclosure in the neighborhood.
Properties in this program may require an intermediate hold strategy in accordance with a long-term plan that can be fully implemented once the market can support the additional investment. As such, demolition and land banking activities are viable intermediate

110
actions that can bring an immediate impact with the potential for an even larger benefit in the future.
Pilot Pre-Foreclosure Initiative
SHRA set aside funds within the PRP to establish a pilot initiative in both the City and County and partnered with a private equity investment firm to purchase and modify distressed mortgages in the Target Areas. The pilot initiative funds were to be used exclusively for properties within the portfolio that were in foreclosure. Funds were to have been highly leveraged, adding a foreclosure prevention component to NSP activities. The premise was that some distressed mortgages purchased by the private equity investor would not be successfully refinanced. Therefore, PRP funds would be available for those properties that must be foreclosed to expedite their rehabilitation and occupancy. With this initiative, the PRP will tackle current foreclosed properties as well as reduce the number of properties potentially facing foreclosure. Unfortunately, SHRA was unable to implement this pilot initiative within the established timeline requirements, which mandated that all eligible properties be identified, and a scope of work be placed under contract, by September 30, 2010.
The disposition of properties acquired under the PRP creates additional opportunities to partner with for-profit and nonprofit entities. These activities will allow for additional public participation and present significant leveraging opportunities beyond the next year or two. Based on Board of Supervisor and City Council direction, SHRA staff has developed the disposition component of the PRP. On October 27, 2009 the Board of Supervisors and City Council approved the rank order of applicants selected through a competitive procurement process for participation as a Mission Builder and Volume Builder under the PRP. Consistent with the PRP Guidelines, SHRA identified experienced and responsible Community Partners for the expedient transfer, rehabilitation, marketing and re-sale of the foreclosed properties acquired by SHRA. Specifically, SHRA identified two types of Community Partners:
1. Volume Builder(s) – Non-profit or for-profit single family builders with financial
capacity to rehabilitate many scattered site homes at a time, including the ability to provide capital for purchase, carrying costs, and the ability to provide sufficient labor.
2. Mission-Driven Organization(s) – Non-profit organizations with a track record of rehabilitating or constructing single family homes and a complimentary community purpose or mission to the NSP. Such missions include job training, youth empowerment, deeply targeted affordable housing, and community reinvestment.
To maximize NSP effectiveness with best possible outcomes, and to position Sacramento for receipt of additional NSP support through future rounds of funding, SHRA has partnered with two national housing entities: National Community Stabilization Trust
111
(NCST) and Enterprise Community Partners. The NCST is a national nonprofit organization created to connect banks and loan servicers holding foreclosed properties with local governments and organizations working to stem the decline of communities with high concentrations of vacant and abandoned foreclosed properties. Partnership with NCST will provide SHRA with a priority “first look” at foreclosed and abandoned properties within the NSP target areas. It will also allow for the targeted and expedited purchase of foreclosed and abandoned properties from various financial institutions working with NCST by SHRA. With this partnership, SHRA will be able to deliver properties to the development community to bring them quickly to the market.
Enterprise Community Partners is a national nonprofit with 25 years of experience in the community development and affordable housing field. They are the leading provider of capital and expertise for affordable housing and community development activities. Enterprise has committed to provide technical assistance to SHRA for NSP. The partnership has included analysis of SHRA NSP programs, best practice reviews across the nation, network of other programs providers, recommendations on modifications to SHRA NSP programs, and possible ways to leverage additional resources for Sacramento.
Foreclosure Education and Counseling
SHRA has worked with both City and County agencies and officials on a comprehensive strategy to combat the foreclosure crisis. These efforts have included working with the District Attorney to proactively try to avert potential mortgage scams for homeowners in default, including sending notifications to at risk homeowners which provide reputable resources if and when a notice of default is filed. SHRA has been tracking foreclosure activity and publishing a quarterly report on foreclosure filings, identifying the most impacted neighborhoods and most prevalent servicers of foreclosed properties.
SHRA has been partnering with major lenders, loan servicers, and local HUD- approved housing counseling agencies to provide outreach and resources to assist, educate, and inform homeowners facing the loss of their home and to preserve homeownership. Between 2008 and 2009 SHRA hosted ten foreclosure events in the City and County of Sacramento. As many as 15 major lenders and loan servicers participated in these events as a way to meet with their own customers and other struggling homeowners face to face to discuss the mortgage default process, and determine eligibility for loan modifications or other options to address their distressed loans. The first few events in 2008 attracted between 300 and 500 homeowners. As the foreclosure crisis deepened in 2009, over 3,000 people attended these events. SHRA continues to serve as a valuable resource for concernewd homeowners by providing referrals to local HUD-approved housing counselors, in addition to providing a wide range of information and helpful tips on SHRA website.

112
Conclusion
The comprehensive nature of SHRA’s response to the foreclosure crisis and the various innovative ways in which the agency has chosen to utilize its allocation of NSP funds is clear from the description above. Of significance from a fair housing choice perspective is the fact that so much of the effort is designed to target neighborhoods most severely impacted by the foreclosure crisis in general, and by subprime lending activities in particular. Subprime lending, in large part, precipitated the crisis, and had an especially deleterious effect on minority homeowners, and SHRA’s foreclosure prevention and amelioration programs are sensitive and responsive to this reality.
Summary
As noted at the outset of this chapter, SHRA is an effective and forward looking agency. Time and again it has demonstrated a capacity to maximize all available resources to achieve optimum results in the housing and community development arena. SHRA not only administers a comprehensive array of programs, it also monitors these programs carefully, and responds to changing circumstances rapidly and without any hesitation when the programs need modification or fundamental reorientation. Because of its institutional structure SHRA is uniquely positioned to oversee the development of affordable housing throughout the Sacramento region. A favorable institutional structure would be meaningless, however, without competent people to carry out the mission. In the AI consultant’s estimation SHRA is effective, first and foremost, because it employs a highly trained, creative, and exceptionally motivated workforce, undaunted by the most compelling challenges any local government could face.