analysis of impediments to fair housing choice …dhcd.maryland.gov/documents/consolidated...
TRANSCRIPT

ANALYSIS OF IMPEDIMENTS TO FAIR HOUSING CHOICE
FOR MARYLAND NON-ENTITLEMENT COMMUNITIES
LAWRENCE J. HOGAN, JR. BOYD K. RUTHERFORD KENNETH C. HOLT
GOVERNOR LT. GOVERNOR SECRETARY
MAY 2015
JA’NAI C. KEITH., PRINCIPAL INVESTIGATOR
OFFICE OF RESEARCH, POLICY AND LEGISLATIVE AFFAIRS – ASUNTHA CHIANG-SMITH. DIRECTOR
MARYLAND DEPARTMENT OF HOUSING AND COMMUNITY DEVELOPMENT
100 COMMUNITY PLACE
CROWNSVILLE, MD 21032
410-514-7040 • 1-800-756-0119
TTY: 1-800-735-2258 • FAX: 410-514-7874

i
Table of Contents
Executive Summary ...................................................................................................... 1 Introduction ................................................................................................................ 16 Methodology................................................................................................................ 17 Public Participation.................................................................................................... 17 Jurisdictional Background Data ................................................................................ 18 Minority and Low Income Concentrations ................................................................. 18 Areas of Minority Concentration ............................................................................... 18 Areas of Low Income Concentration ........................................................................ 20 Housing Problems by Race and Family Status ......................................................... 22 Persons with Special Needs ..................................................................................... 27 Persons of Limited English Proficiency .................................................................... 34 Private Sector Lending Practices .............................................................................. 39 DHCD Lending Practices ............................................................................................ 47 Single Family Program Beneficiaries Review ........................................................... 47 Multifamily Program Beneficiaries Review ................................................................ 50 State Housing and Community Development Policies and Practices ..................... 65 Performance on the State’s 2010 Analysis of Impediments ...................................... 65 CDBG ...................................................................................................................... 75 HOME Investments Partnership Program ................................................................ 76 Section 8 .................................................................................................................. 78 State Rental Housing Programs .............................................................................. 87 Reasonable Accommodations Policy ....................................................................... 93 Transit-Oriented Development ................................................................................ 95 2012 State Disabilities Plan ........................................................................................ 97 Affordable and Available Housing Units ................................................................... 98 Affirmatively Furthering Fair Housing Survey Analysis ........................................... 99 Fair Housing Action Plan.......................................................................................... 112 2015 Actions to Overcome Impediments ................................................................. 115 Consolidated Public Hearing Comments ................................................................ 118

1
ANALYSIS OF IMPEDIMENTS TO FAIR HOUSING CHOICE
EXECUTIVE SUMMARY
The U.S. Department of Housing and Urban Development (HUD) broadly defines fair housing choice as the ability of persons with similar incomes to have the same housing choices regardless of race, color, religion, sex, age, national origin, familial status or disability. Federal fair housing statutes are largely covered by the Fair Housing Act, Housing Amendments Act, and Americans with Disabilities Act. State statutes prohibit discrimination on the basis of sexual orientation. Impediments are actions or omissions that are counter-productive to fair housing choice or that have the effect of restricting housing opportunities based on protected classes. The Analysis of Impediments (AI) to Fair Housing Choice study was developed to ascertain the extent to which the State of Maryland and DHCD work to ensure fair housing choices are accomplished within federally protected classes. DHCD used numerous data sources in preparing the AI. This included reviewing Census data, HUD data, data from the Maryland Departments of Planning, Health and Mental Hygiene, Disabilities and Aging, reviewing Home Mortgage Disclosure Act Data, accessing private data, such as RealtyTrac data, and reviewing policies, procedures and data available from programs such as the HOME Investments Partnership Program, Community Development Block Grant Program, Federal Low-Income Housing Tax Credit Program, Housing Choice Voucher Program (Section 8) and numerous State operated programs such as the Departments own rental housing and homeownership programs, among other sources. In addition, DHCD conducted a review of the policies and procedures possibly affecting fair housing choice. Based on this evaluation, fair housing strategies to overcome any identified impediments were developed for execution in the state’s non-entitlement areas.
MAJOR FINDINGS
The following list identifies five key areas to improve fair housing activities at the State level. 1) Fair housing education; 2) Greater outreach to persons of Limited English Proficiency (LEP); 3) Fair housing choice for persons with disabilities; 4) Working with the federal government to improve data collection on areas such as
mortgage lending and determining housing needs of persons with disabilities; 5) Increasing the supply of affordable and accessible housing.

2
Fair Housing Action Plan Strategies to Overcome Impediments
Improve Fair Housing Education
Education: Analyses showed both a need and a demand for fair housing education over 58% of all respondents to the fair housing survey noted that fair housing education is needed to promote fair housing choice Specific actions DHCD will undertake to address educational needs include, but may not be limited to, the following:
Develop an affirmative fair housing plan Prepare and conduct up to fifteen testing sessions annually in non-entitlement areas Plan and conduct six fair Housing Outreach events annually state-wide

3
Limited English Proficiency
Although most households of limited English (LEP) proficiency reside within entitlement jurisdictions, The Maryland Department of Housing and Community Development believes that continuous efforts need to be taken to ensure that all households across the State are aware of housing choice options that are available to them. The Department’s Maryland Housing Search website provides assistance to persons of LEP across the State. DHCD’s housing search website, www.mdhousingsearch.org, provides written translation on the availability of affordable rental housing in Spanish, and assistance is available in other languages through translator services. In addition to housing search, the State and DHCD (through the Department of Budget and Management) has had a contract with CRT Services to provide oral translation for other housing and community development programs. It is through CRT services that DHCD is able to assist persons of LEP statewide. Specific Actions that DHCD will undertake to address persons of LEP includes:
Promoting affirmative fair housing by providing translations in French, French Creole, Italian, Portuguese, German, Russian, Gujarati, Hindi, Urdu, Chinese, Korean, Vietnamese, Tagalog, Arabic, Greek and Spanish on our website.
Continue to print MMP brochures and information into Spanish, and provide links to this information on our website as documents are translated.
Continue outreach efforts through Spanish language radio, television, and newspapers. Continue written translation on the availability of affordable rental housing in Spanish. Continue State translator subscription service for persons with limited English speaking
ability. This includes the above mentioned languages where feasible. Work with the Department of Human Resources (DHR) in developing its Plan(s) for
helping persons of LEP as per State law. DHR is responsible for providing central coordination and technical assistance to State agencies to ensure compliance with State law regarding persons of LEP.

4
Fair Housing Choice for Persons with Disabilities
There should be continued emphasis on seeking housing opportunities to reach disabled populations. Specific Actions will include the following:
Continued operation of the Homeownership for Persons With Disabilities Program
Provide bonus points under the Qualified Allocation Plan (QAP) for projects that provide housing for persons with disabilities
Provide rental assistance to disabled households in partnership with MDOD and DHMH through the Bridge Subsidy program as they await Section 8 assistance
DHCD has received two rounds of funding under the HUD 811 program, to provide rental assistance to disabled households
Continued support of housing opportunities for severely disabled persons through programs such as DHCD Group Home and Special Housing Opportunities Programs.
However, there are opportunities that the State will pursue in addition to these efforts: The Department of Health and Mental Hygiene (DHMH) and DHCD collaborated on the State Disabilities Plan for fiscal year 2012 – 2015 and developed a series of goals that would pursue to create approximately 1,800 new housing opportunities for identified priority populations with a developmental disability or Severe and Persistent Mental Illness (SPMI). The strategies the State will address include:
Identify long- term funding sources for rental subsidies for people with disabilities for person with SSI/SSDI sole source income
Continue collaboration with non-profit agencies, housing entities (PHA’s), and the disability community to maximize housing opportunities for people with disabilities
Include persons with long-term service and support needs in the state Consolidated Plan
Assist the State’s largest PHA’s to maintain baseline number of housing choice vouchers for non-elderly individuals with disabilities awarded sine 1997
Other goals noted in the State Disabilities Plan include:
Work with Visibility Advocates builders, and other stakeholders to develop and implement effective Visibility legislation for Maryland
Assist PHA’s to maintain compliance with Fair Housing and Equal Opportunity requirements to ensure PHA’s meet their obligations under Section 504 and the ADA to afford persons with disabilities, transitioning from institutions, opportunities to participate in public housing or Housing Choice Voucher Program.
Identify and develop options for modifying existing housing stock to meet the needs of low income individuals with physical disabilities.
Include the production of accessible and affordable housing at early stage of planning activities for Livable Communities at designated and non-designated transit oriented development (TOD) sites around the State of Maryland.
Provide training and outreach to developers of multi-family mixed use properties at TOD sites on the practical accessibility requirements for units.
Engage Federal counterparts responsible for building codes and standards to consider clear and flexible solution for producing accessible units in multi-family dwellings.

5
Improved Data Collection
One of the most significant difficulties DHCD and other agencies face is actually obtaining an accurate picture of fair housing problems and the needs of individual protected classes. For example, there is no cross link between information on persons with disabilities and legitimate housing needs in the Census data. Specific actions DHCD will undertake to improve data collection include:
Continue to advocate to Congress that the federal government improve and expand HMDA data to help determine when and if housing discrimination exists.
Advocate the need to cross reference materials as HUD prepares to update data tables on the housing needs of individuals with disabilities, which is displayed in the Comprehensive Housing Affordability (CHAS) datasets, with 2010 Census data.
Work with HUD to ensure that the data provided under the American Community Survey provides an accurate picture of persons and families with housing needs.
More Affordable and Accessible Housing
The DHCD estimates that from 2006 -2010 Maryland faces an overall net shortage of 201,934 units of affordable and available housing within the Income thresholds of 30%, 50% and 80% of area median income. Of the 98,297 shortage in the 30% AMI 17,610 fall within non-entitlement jurisdictions. Of the 92,446 shortage of affordable and available units in the 50% AMI threshold 11,978 fall within non-entitlement jurisdictions. Finally, of the 11,191 shortage of affordable and available units in the 80% AMI threshold 1,264 units fall within non-entitlement jurisdictions. It is noteworthy to mention that in each category in some jurisdictions there is a surplus of units at the three income thresholds.
OTHER KEY FINDINGS AND OBSERVATIONS Fair Housing Online Survey Findings Participants provided feedback which included background information on their agencies, discrimination in their communities and fair housing solutions. All of the state’s jurisdictions participated in taking the survey. When asked,” what do you think would help promote fair housing choice?” nearly 60 percent of respondents said that better education was to promote fair housing choice. Areas of Minority Concentrations Forty- three (43) of 330 census tracts in Maryland’s non-entitlement areas were defined as minority concentrations. Of these 43 census tracts, 13 were due to an institutional structure, including colleges and universities as well as prisons and military bases. After subtracting the above-mentioned 13 Census Tracts, the State had 30 census tracts of minority concentration in the non-entitlement jurisdictions. This was an increase from the 10 areas of concentration identified in the State’s last AI in 2010 (which used 2000 census data since 2010 data was not available). This increase was due to increases in the Asian and Hispanic populations as the

6
number of black/African American only census tracts fell from ten to nine, with five tracts including institutions, typically local jails, that may have impacted the results. Areas of Low Income Concentrations There were fourteen (14) census tracts with concentrations of low-income persons in Maryland’s non-entitlement jurisdictions that year that also fell within the “10.0 percent” standard HUD uses to determine if a concentration exists. (There were an additional 11 Census Tracts that could be areas of low-income concentration; however the margin of error is too high to accurately determine if this is so. Assuming all of these areas are areas of concentration, this would be fairly consistent with the last AI which showed a total of 39 Census Tracts as areas of low-income concentration.) Of these fourteen Tracts, several were impacted by institutional structures, including Tracts in Allegany, Somerset and Calvert Counties Further, of these ten, three are impacted by the same conditions that skewed the minority concentration information. DHCD Lending Practices - Single Family Beneficiaries Review The beneficiaries for the single family programs were households that received mortgage financing from DHCD toward the purchase of the owner’s home. The DHCD examined MMP single family program data for FY 2010- FY 2013 (July 1, 2009 – June 30, 2014). The predominant racial composition of MMP borrowers were Black or African American (49.0 percent) and White or Caucasian (39.0 percent). These two groups combined represented approximately 98 percent of all borrowers. When examining lending patterns by minority groups alone, nearly half of all MMP loans (49.0 percent) were made to minority borrowers Because MMP borrowers choose where they want to live, most borrowers (82 percent) located outside areas of minority concentration. DHCD Lending Practices – Multifamily Program Beneficiaries Review Based on 2012 calendar year data provided by Spectrum, DHCD examined the racial characteristics of 32,340 households living in multi-family housing projects from calendar year 2012. The racial information provided from those households is:
Approximately 55 percent - African American/Black households
Approximately 29 percent - Caucasian/White households
Approximately 4 percent – Race reported as “other”
Approximately 10 percent- race information not reported Based on the previous AI, the other category may include either Asian households (primarily from the Indian Sub-continent) who are not correctly identified as “Asian”, or it may include Hispanic households who identify as neither white nor black (nor any other race), but use Hispanic as a race. The remaining households include households who identify as Asian, American Indian/Alaska Native, or Hawaiian/Pacific Islander.

7
State Housing and Community Development Policies, Practices, and Procedures The State examined policies and procedures that had possible impacts on fair housing choice. This included reviews of individual departmental programs and overall State policies. Fair Housing and Equal Opportunity (FHEO) laws are designed to protect individuals from discrimination on the basis of race, national origin, religion, color, sex, age, family/marital status and handicap. Programs and policies examined included:
CDBG Policies and activities
Home Investment Partnership Program Policies and activities
Section 8 Policies and activities
Federal Low-Income Housing Tax Credit Policies and activities
Reasonable Accommodations Policies
Sate Rental Housing Programs Policies
Transportation-Oriented Development
State Disabilities 20012-2015 Plan
Homeownership Opportunities for Persons with Disabilities
Affordable and Available Housing Units (2006 – 2010)
PUBLIC PARTICIPATION
In addition to the data collection activities noted above, DHCD engaged citizens by conducting a Fair Housing survey, hosted four public hearings on the draft AI, and met with representatives of Fair Housing organizations to address their concerns regarding fair housing issues. First, DHCD administered a fair housing survey to 1,400 individuals and housing-related agencies throughout Maryland to gauge their response on fair housing issues, practices, concerns, and strategies in their communities. DHCD utilized Survey Monkey, an online software system, to distribute web-based questionnaires to a selected email distribution list. Second, over 850announcement letters were mailed statewide, were sent to nonprofit and for profit housing developers, advocacy groups, local government officials, public housing authorities, chief housing contacts, and private individuals, notifying them about the development of the new AI. These communications also provided information on public hearings, requests for public comment, and information about where to find the draft AI on the DHCD website. Third, draft copies of the AI were sent to regional libraries throughout the State, including a large print version to a library for the blind and physically handicapped. Lastly, the DHCD website (www.dhcd.state.md.us) displayed notice of the draft AI in pdf. format, communicated the dates and times of hearings, as well as opening and closing dates for public comments. Print advertisements were also placed in select newspapers throughout the State.

8
DHCD Affordable Housing Programs for Low Income and Disabled Households and Program Accomplishments Related to the Analysis of Impediments Study
PROGRAMS
DHCD is strongly committed to serving the housing needs of its citizens, including people of all protected classes by offering an assortment of housing opportunities and financing programs. The Department offers a wide range of programs that help promote fair housing choice, ranging from homeownership to rental housing and rental subsidy programs, to programs that assist the most vulnerable including persons with disabilities, the elderly, and the homeless, as well as by increasing opportunity through the Department’s community development efforts. The Maryland Department of Housing and Community Development has received numerous awards as a result of its efforts from; the Council of State Community Development Agencies (COSCDA), the National Council of State Housing Agencies (NCSHA) and the National Association of Housing and Redevelopment Officials (NAHRO). DHCD was awarded funding under HUD’s Section 811 Demonstration Program, targeted specifically to assist persons with disabilities achieve greater fair housing choice, and has received several rounds of funding from the Weinberg Foundation for the same purpose. Additionally, working cooperatively with DHMH, DHCD revised its Qualified Allocation Plan (QAP) for Federal Low Income Housing Tax Credit (LIHTC) and other State resources to provide more housing for persons with disabilities. It should be noted that all DHCD financed projects, regardless of financing source, are required to take Section 8 in order to assist households at the lowest income levels. In fact, some DHCD voucher holders may be living in DHCD financed housing. Some examples of efforts DHCD takes to promote equal housing opportunities for all include: Housing Programs for Individuals with Disabilities DHCD provides a wide array of housing for persons with disabilities, ranging from supportive housing to rental housing to homeownership opportunities. For example, the Group Housing Programs helps individuals, qualified limited partnerships, and nonprofit organizations construct or acquire, and/or modify existing housing to serve as a group home or assisted living unit for eligible persons and households with special housing needs. The DHCD uses both state funds from the Group Home Financing Program and the proceeds from the sale of tax exempt mortgage revenue bonds under the Special Housing Opportunities Program to fund these loans. In another example, the Homeownership for Individuals with Disabilities Program provides low-interest mortgage loans to eligible disabled homebuyers and homebuyers with a son or daughter (regardless of age – who resides with one of the borrowers and is cared for principally by one of the borrowers). One of the borrowers must have a physical or mental impairment that substantially limits one or more major life activities (for example, hearing, seeing, speaking, sitting, standing, walking, concentrating, or performing manual tasks). DHCD is extremely successful in providing rental housing opportunities for persons with disabilities. Some examples below include: .

9
Partnership Rental Housing Program The Partnership Rental Housing Program provides loans for rental housing that will be occupied by households with incomes below 50 percent of the statewide median. There is no limitation on the maximum project amount but Partnership projects tend to include 100 or fewer units. State funds may be used for the development costs of building acquisition, construction or rehabilitation of buildings on site. Projects financed by the program are intended to provide rental housing to individuals and households with incomes sufficient to pay rents in amounts necessary to maintain financial self-sufficiency of the project. Federal Low Income Housing Tax Credit Maryland administers the Federal Low Income Housing Tax Credit Program to support the development of affordable multifamily rental housing. Credits are awarded competitively in conjunction with the State's Rental Housing Program funds and federal HOME funds. Tax credits are allocated in accordance with federal IRS rules and Maryland's Qualified Allocation Plan. Credits are subject to recapture for failure to comply with all IRS and departmental requirements. The 9 percent Tax Credits are awarded on a competitive basis to nonprofit and for-profit sponsors of eligible housing projects. Projects financed with tax-exempt bonds may be eligible for 4 percent Tax Credits outside of the competitive process. The qualified building must remain in compliance with tax credit income restrictions for a minimum of 15 years. DHCD provides bonus points for projects which provide units for individuals with disabilities. This has resulted in over 1,800 units of rental housing produced specifically targeted for disabled populations since this policy was enacted. Federal HOME Investment Partnership Program The HOME Investment Partnerships Program is a federal program that provides funds to the State and certain local governments to promote affordable housing activities. Maryland’s program is administered by the Community Development Administration (CDA) and a portion of the annual allocation is used in conjunction with existing CDA multifamily and single family programs. A portion of the funds, may be allocated to a Special Reserve Fund to stimulate new ideas in housing, initiate pilot programs, and support promising projects. Shelter and Transitional Housing Facilities Grant Program The Shelter and Transitional Housing Facilities Grant Program (STHGP) provides state funded grants to improve or create transitional housing and emergency shelters. The purpose of the program is to reduce homelessness in the State. New construction, acquisition, rehabilitation of housing, and purchase of capital equipment are eligible activities for STHGP grants. Grants must be used for transitional housing and emergency shelters that include supportive services for their residents. Generally, the grants pay up to 50 percent of the project costs and are processed on a first-come, first-served basis. Housing Choice Voucher Program (Section 8) The Section 8 Existing Certificate/Voucher Program is a rental assistance program that subsidizes the rent of lower-income families through the use of federal funds. DHCD administers the Section 8 Existing Certificate/Voucher Program in jurisdictions around the state that do not have legislative authority to act as a public housing authority or do not choose to administer a Section 8 program. This includes managing Vouchers targeting various

10
populations, including Veteran’s with disabilities through the VASH program, and administering NEDs (Non-Elderly Disabled) Vouchers, among other types administered by the Department. Rental Allowance Program The Rental Allowance Program is the major state-funded program for assisting very-low income families to afford decent, safe, and sanitary housing in the private market. The program provides rental assistance for up to two years.
ACCOMPLISHMENTS De-concentration Bonus When operating the Section 8 Housing Choice Voucher program, HUD provides additional, “bonus” points to Public Housing Authorities (PHAs) that are highly successful in having tenants locate outside of areas of low-income concentration. In determining which PHAs receive bonus points, a PHA must show that it has been successful in de-concentrating voucher holders in all of its eligible services areas. DHCD has successfully done this, and was awarded bonus points towards the overall performance rating by HUD for successfully ensuring that voucher holders are not living in areas of low-income concentration. DHCD received a performance rating of “High Performer”. PHAs that achieve overall performance ratings of “High performer” may be given competitive advantages under notice of funds availability.
Multifamily Loans by Area of Minority and Low-Income Concentration The DHCD examined its multifamily lending patterns against areas of minority and low-income concentration. DHCD lending patterns run parallel to the state’s Smart Growth Priority Funding Act enacted in 1997, which ensures that smart growth is concentrated in both new development and redevelopment areas that have either existing or planned infrastructure to avoid sprawl. Smart growth is characterized by compact, transit-oriented, bicycle-friendly land use, with neighborhood schools, walkable streets, mixed-use development and a wide range of housing choices. Its purpose is to conserve and sustain valuable natural resources through the efficient use of land, water and air; create a sense of community and place; expand transportation, employment, and housing choices; distribute the costs and benefits of development in an equitable manner; and promote public health. Smart growth principles have guided policy making across the nation with a central focus supporting development within designated priority funding areas, brownfields, live near your work, job creation tax credits and rural legacy initiatives. DHCD financed a total of 11 developments using all sources of funding (federal LIHTC, HOME, Bond, and State funds) in the State’s non-entitlement areas in FY2014. Of these, eight of the developments were located outside areas of minority concentration and three were located in areas of minority or low-income concentration. DHCD examined the location of its projects against areas of low-income concentration. Of the 11 projects undertaken, six projects were located outside of areas of low-income concentration, five projects, were located in areas of low-income concentration

11
DHCD Single Family Program Beneficiaries The predominant racial composition of MMP borrowers were Black or African American (49.0 percent) and White or Caucasian (49.0 percent). These two groups combined represented approximately 88 percent of all borrowers. Hispanic and Asian represented the fewest number of borrowers and smallest racial groups. When examining lending patterns by minority groups alone, slightly over half of all MMP loans (52.0 percent) were made to minority borrowers. Assisting Persons With Disabilities DHCD has received numerous awards and honors for its work in assisting households where at least one of the residents has a disability. This includes national awards from the Counsel of State Community Development Agencies (COSCDA), the National Counsel of State Housing Finance Agencies (NCSHA), and the National Association of Housing and Redevelopment Officials (NAHRO). These organizations recognize DHCD as a national leader in providing fair housing choice to persons with disabilities through its programs such as the Disabled Borrower Program, Bridge Subsidy Program, Group Home Program, Special Housing Opportunities Program, and its multi-family housing development efforts that have provided substantially greater opportunities for persons with disabilities to access rental housing by offering bonus points through its Qualified Allocation Plan to developers who provide housing units for persons with disabilities among other efforts.
Actions to Overcome Impediments
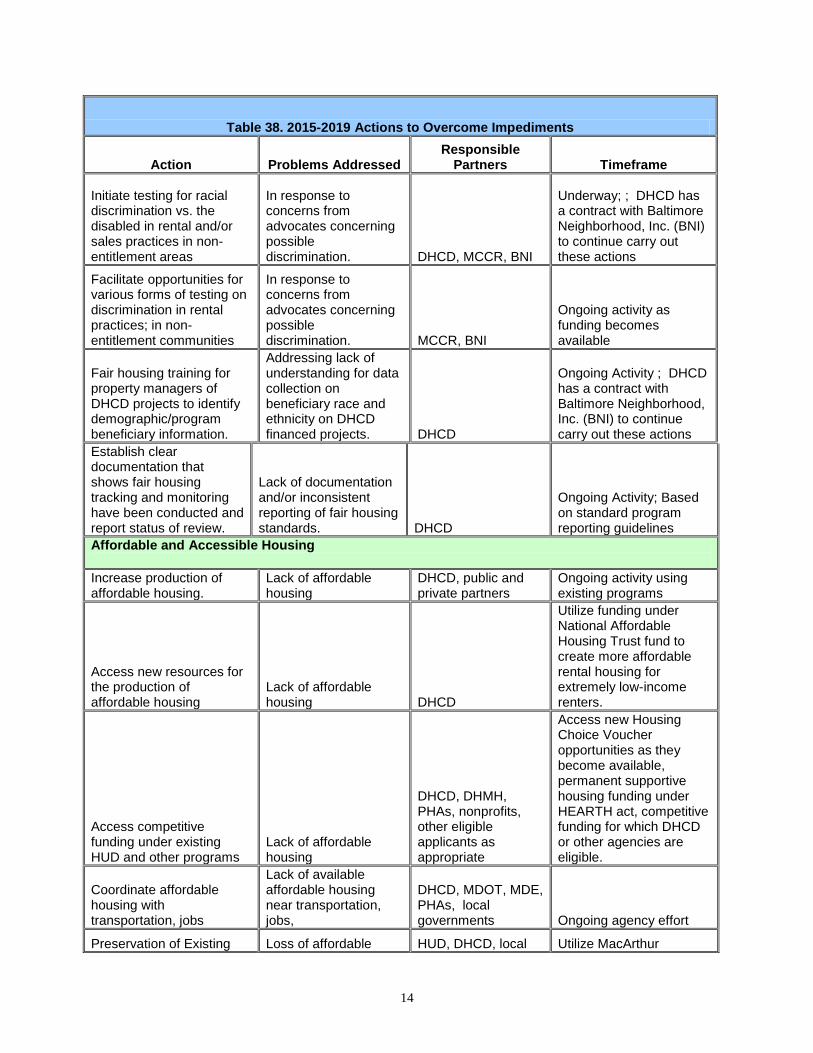
DHCD has experienced numerous successes in providing affordable housing for low income households, which includes providing substantially more units for disabled populations over the past five years. However, housing needs continue to persist. As funding becomes available, DHCD plans to continue seeking opportunities to provide affordable housing and community development for low income households. Working in collaboration with other state agencies, DHCD has identified the following actions to overcome impediments to fair housing.
Table 38. 2015-2019 Actions to Overcome Impediments
Action Problems Addressed Responsible
Partners Timeframe
Fair Housing Education/Information
Undertake local fair housing outreach programs that emphasize race, ethnicity, & disability.
Lack of public awareness of fair housing rights & responsibilities
DHCD, HUD, MCCR, Statewide, with emphasis in Non-entitlement communities Ongoing activity

12
Table 38. 2015-2019 Actions to Overcome Impediments
Action Problems Addressed Responsible
Partners Timeframe
Improve fair housing awareness and build on marketing efforts; specifically targeting residents, realtors, developers, landlords, lenders, insurers, management agents, etc.
Lack of public awareness of fair housing rights & responsibilities
DHCD, MCCR, HUD, MAR, MBA
Ongoing activity; DHCD has a contract with Baltimore Neighborhood, Inc. (BNI) to continue carry out these actions
Sponsor Fair Housing workshops and/or seminars.
Lack of public awareness of fair housing rights & responsibilities
DHCD, HUD, MCCR, NAACP, BNI
Ongoing activity; DHCD has a contract with Baltimore Neighborhood, Inc. (BNI) to continue carry out these actions
Undertake testing for racial discrimination in sales practices & lending; & geographic fair housing testing.
Identification of possible discrimination (see survey results) DHCD and/or MCCR
Ongoing activity ; DHCD has a contract with Baltimore Neighborhood, Inc. (BNI) to continue carry out these actions
Train landlords on new reporting requirements related to fair housing as part of HERA legislation.
Lack of or incorrect data from landlords sometimes impacts the ability to assess fair housing opportunities HUD and DHCD
Awaiting new regulations and Technical Assistance from HUD.
LEP Education/Technical Assistance
Encourage local LEP service provision with towns/municipalities, nonprofit organizations, etc.
Ensure information is available for persons of LEP .
Maryland Dept of Human Resources, HUD Ongoing activity
Develop and Implement LEP marketing, outreach, and information.
Ensure persons of LEP have access to DHCD programs.
DHCD, Maryland Dept of Human Resources, HUD Ongoing activity
Add new links to DHCD's website to address different languages; continue utilizing oral translator services; & Spanish language media.
Establish a single site of information for persons of LEP . DHCD To be completed by 2017
Utilize State Translator Subscription Service for Persons with limited English speaking ability.
Provide information to persons of LEP, including for those whose primary language is not large enough as a group to translate documents under federal or State
DHCD, using State Contractor Ongoing activity

13
Table 38. 2015-2019 Actions to Overcome Impediments
Action Problems Addressed Responsible
Partners Timeframe
requirements.
Translate DHCD documents as required by federal and State LEP requirements
Ensure opportunities to persons of LEP DHCD
As required
Expand Housing Opportunities for Persons With Special Needs
Implement select strategies as outlined in the State Disabilities Plan
Lack of accessible and housing choices for individuals with disabilities. DHMH, DHCD, DHR, Ongoing activity
Increase rental subsidies
Expand housing opportunities for persons with disabilities whose incomes are too low to afford low-income housing as they may have incomes below poverty levels utilizing 811 financing
HUD, DHCD, DHMH, DHR, MDoD
DHCD, MDoD, DHMH was awarded 21 million to carry out this activity over the next five to ten years.
Reinforce planning & program efforts to increase affordable housing opportunities for people with disabilities.
Housing people with disabilities
DHCD, DHMH, MDoA, MDoD Ongoing activity
Continue to operate DHCD programs that assist persons with Special Needs
Providing full range of housing opportunities to persons with special needs for all disability levels. DHCD
Continue funding/operation of Housing Opportunities for Individuals With Disabilities Program, bonus point awards for projects which provide more units to households with special needs, continue operating Group Home and SHOP programs, etc.
Data Collection
Advocate with Congress the improvement & expansion of HMDA data
Lack of Fair Housing data which could provide evidence of possible discrimination in lending DHCD Ongoing
14
Table 38. 2015-2019 Actions to Overcome Impediments
Action Problems Addressed Responsible
Partners Timeframe
Initiate testing for racial discrimination vs. the disabled in rental and/or sales practices in non-entitlement areas
In response to concerns from advocates concerning possible discrimination. DHCD, MCCR, BNI
Underway; ; DHCD has a contract with Baltimore Neighborhood, Inc. (BNI) to continue carry out these actions
Facilitate opportunities for various forms of testing on discrimination in rental practices; in non-entitlement communities
In response to concerns from advocates concerning possible discrimination. MCCR, BNI
Ongoing activity as funding becomes available
Fair housing training for property managers of DHCD projects to identify demographic/program beneficiary information.
Addressing lack of understanding for data collection on beneficiary race and ethnicity on DHCD financed projects. DHCD
Ongoing Activity ; DHCD has a contract with Baltimore Neighborhood, Inc. (BNI) to continue carry out these actions
Establish clear documentation that shows fair housing tracking and monitoring have been conducted and report status of review.
Lack of documentation and/or inconsistent reporting of fair housing standards. DHCD
Ongoing Activity; Based on standard program reporting guidelines
Affordable and Accessible Housing
Increase production of affordable housing.
Lack of affordable housing
DHCD, public and private partners
Ongoing activity using existing programs
Access new resources for the production of affordable housing
Lack of affordable housing DHCD
Utilize funding under National Affordable Housing Trust fund to create more affordable rental housing for extremely low-income renters.
Access competitive funding under existing HUD and other programs
Lack of affordable housing
DHCD, DHMH, PHAs, nonprofits, other eligible applicants as appropriate
Access new Housing Choice Voucher opportunities as they become available, permanent supportive housing funding under HEARTH act, competitive funding for which DHCD or other agencies are eligible.
Coordinate affordable housing with transportation, jobs
Lack of available affordable housing near transportation, jobs,
DHCD, MDOT, MDE, PHAs, local governments Ongoing agency effort
Preservation of Existing Loss of affordable HUD, DHCD, local Utilize MacArthur

15
Table 38. 2015-2019 Actions to Overcome Impediments
Action Problems Addressed Responsible
Partners Timeframe
Affordable Housing housing which exacerbates housing problems for lower income households
governments, private partners.
Foundation Grant, State resources to preserve affordable rental housing. Also work with federal government as they develop new housing preservation programs.

16
ANALYSIS OF IMPEDIMENTS TO FAIR HOUSING CHOICE
Introduction
The U.S. Department of Housing and Urban Development (HUD) broadly defines fair housing choice as “the ability of persons with similar incomes to have the same housing choices regardless of race, color, religion, sex, age, national origin, familial status or disability.” The State of Maryland works to ensure fair housing choice for all households that fall within these federally protected classes, and fosters fair housing choice based on sexual orientation. The Maryland Department of Housing and Community Development (DHCD) prepares the State’s Consolidated Plan for the State’s non-entitlement jurisdictions and receives funding to help finance housing, community development, and homeless assistance in non-entitlement areas. The non-entitlement areas are:
Allegany County (except the City of Cumberland)
Calvert County
Caroline County
Carroll County
Cecil County
Charles County
Dorchester County
Frederick County (except the City of Frederick)
Garrett County
Kent County
Queen Anne’s County
Saint Mary’s County
Somerset County
Talbot County
Washington County (except the City of Hagerstown)
Wicomico County (except the City of Salisbury) and
Worchester County As part of the requirements for receiving HUD funds, DHCD is required to complete an Analysis of Impediments (AI) to Fair Housing Choice, and develop fair housing strategies to overcome any identified impediments in the non-entitlement areas. The State’s AI only applies to the jurisdictions stated above, as the State’s entitlement jurisdictions - Anne Arundel, Baltimore, Harford, Howard, Montgomery, and Prince George’s Counties, and the Cities of Annapolis, Baltimore, Bowie, Cumberland, Frederick, Gaithersburg, Hagerstown, and Salisbury – all receive funding directly from HUD and are required to prepare their own AIs. DHCD conducted an extensive data analysis looking at possible impediments to fair housing choice. The Department examined Home Mortgage Disclosure Data (HMDA) and census data to determine differences in housing need based on race, household size, and ethnicity; reviewed data affecting persons identified with Limited English Proficiency (LED); examined its own lending practices including analysis of program beneficiary data; and mapped projects

17
against areas of minority and low-income concentration. DHCD also examined internal policies and procedures that could impact fair housing choice, including an examination of departmental operations. The programs reviewed included the Community Development Block Grant (CDBG), HOME Investments Partnership (HOME), federal Low-Income Housing Tax Credit (LIHTC) programs, and the Section 8 Housing Choice Voucher program. In particular, the Section 8 examination involved analyzing on-site monitoring procedures at apartment complexes the Department has financed, and reviewing fair housing requirements for programs operated by the Department. Additionally, DHCD examined State policies and information of the Department of Health and Mental Hygiene (DHMH) and the Maryland Commission on Civil Rights (MCCR). Based on the Department’s analysis, it was determined that the State needs to focus its efforts for overcoming possible impediments on five areas: 1) Fair housing education; 2) Greater outreach to persons of Limited English Proficiency; 3) Fair housing choices for persons with disabilities; 4) Working with the federal government to improve data collection on areas such as
mortgage lending and determining housing needs of persons with disabilities; 5) Increasing the supply of affordable and accessible housing. The full scope of the analysis, as well as details regarding how DHCD will work to overcome the impediments is set forth in the pages below.
Methodology
DHCD used its own staff and funds to complete the Analysis of Impediments. Both primary and secondary data sources were utilized to conduct the analysis. The process involved consultation with other state agencies, civic participation, and data collection. Specifically, DHCD consulted with the Maryland Commission on Civil Rights (which is the lead fair housing agency in Maryland), Department of Health and Mental Hygiene, Department of Disabilities, and the Maryland Department of Aging, among others. Secondary data for some aspects of the analysis was obtained from the aforementioned agencies, as well as the U.S. Census Bureau, the U.S. Department of Housing and Urban Development (HUD) CHAS Database, the Maryland Department of Planning, RealtyTrac, Public Housing Authorities (PHA’s), Social Security Administration(SSA), and the Federal Reserve (2012 Home Mortgage Disclosure Act or HMDA data).
Public Participation
In addition to the data collection activities noted above, DHCD engaged citizens by conducting a Fair Housing survey, hosted four public hearings on the draft AI, and met with representatives of Fair Housing organizations to address their concerns regarding fair housing issues. First, DHCD administered a fair housing survey to 1,400 individuals and housing-related agencies throughout Maryland to gauge their response on fair housing issues, practices, concerns, and strategies in their communities. DHCD utilized Survey Monkey, an online software system, to distribute web-based questionnaires to a selected email distribution list. Second, over 850 announcement letters were mailed statewide, to nonprofit and for profit housing developers, advocacy groups, local government officials, public housing authorities, chief housing contacts,

18
and private individuals, notifying them about the development of the new AI. These communications also provided information on public hearings, requests for public comment, and information about where to find the draft AI on the DHCD website. Third, draft copies of the AI were sent to regional libraries throughout the State, including a large print version to a library for the blind and physically handicapped. Lastly, the DHCD website (www.dhcd.state.md.us) displayed notice of the draft AI in pdf. format, communicated the dates and times of hearings, as well as opening and closing dates for public comments. Print advertisements were also placed in select newspapers throughout the State.
Jurisdictional Background Data
Minority and Low-Income Concentrations
In developing the State’s Analysis of Impediments to Fair Housing Choice, one of the first items the State reviewed was areas of minority and low-income concentration in the State’s non-entitlement areas. For the State of Maryland, a concentration is defined as a census tract where the percentage of minority or low income households is at least 10 percent greater than the county average as a whole. For example, if a county had a population that was 40 percent African American, an analysis is done of each census tract in that county, and a census tract that was more than 50 percent African American would be deemed to have a minority concentration. Likewise, if a county had an African American population that was 10 percent countywide, then a concentration in that county would occur if over 20 percent of the tract was comprised of African American persons. The same rules apply to concentrations by ethnicity and income.
Areas of Minority Concentration
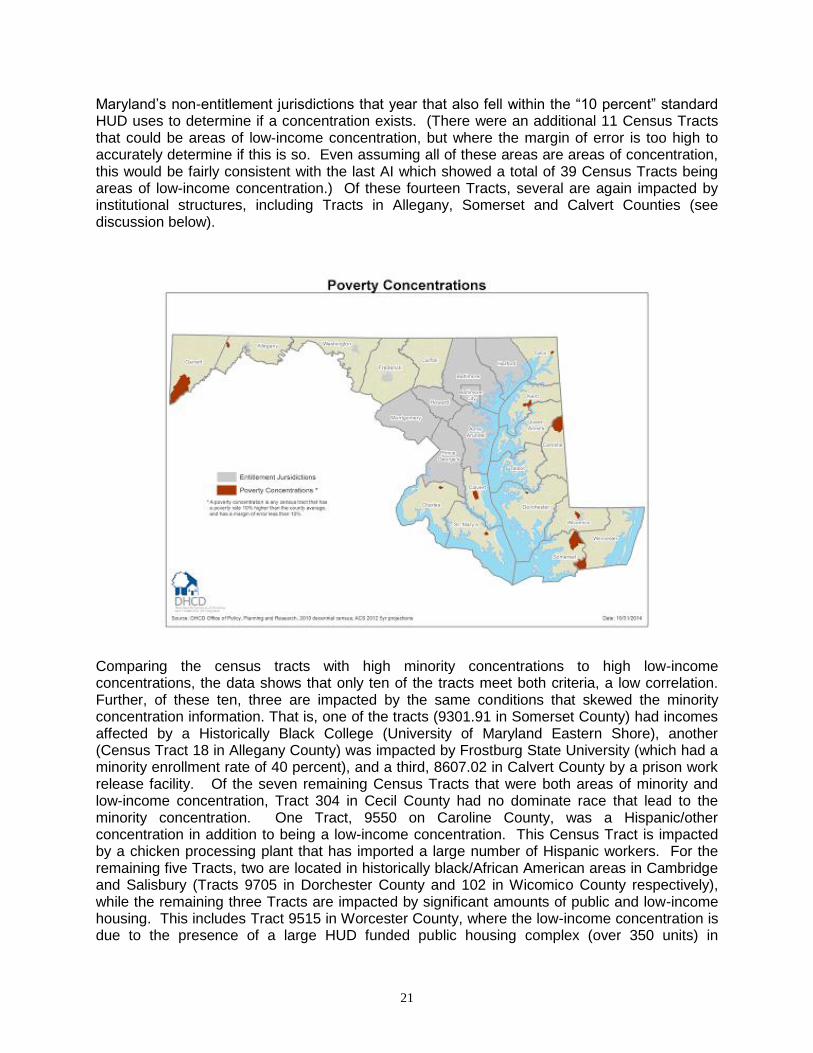
As shown on Map 1 below, of the approximately 330 census tracts in the non-entitlement jurisdictions in Maryland, there were 43 areas of minority concentration of some type. Of these 43, 13 were due to an institutional structure, including colleges and universities (both historically Black Colleges and Universities, such as the University of Maryland Eastern Shore, as well as colleges that had minority enrollment), as well as prisons and military bases. After subtracting these 13 Census Tracts out, the State had 30 census tracts of minority concentration in the non-entitlement jurisdictions. This was an increase from the 10 areas of concentration identified in the State’s last AI in 2010 (which used 2000 census data since 2010 data was not available.), This increase was entirely due to increases in the Asian and Hispanic populations (who identified themselves as “other race” in the Census) as the number of black/African American only census tracts actually fell from ten to nine, and five of these had some sort of institution, typically local jails, that may have impacted the results.

19
As per the 2010 census, there were three Census Tracts in Maryland that were concentrations due to Hispanic populations who identified their race as “other”. These were tracts 9550 in Caroline County, 8509.01 in Charles County, and 96.04 in Talbot County. There were eight additional census tracts where the Asian and Hispanic population combined resulted in an area of minority concentration. These were Census Tracts 8507.06, 8507.08, 8507.10, 8509.04 and 8507.11 in Charles County, and Census Tracts 7510.01, 75.22.02, 75.22.04 in Frederick County. In these tracts, the Asian and Hispanic populations often exceeded the black/African American population. The nine Census Tracts with a black/African American concentration alone were Tracts 8501.01 and 8507.09 in Charles County, Tracts 9705 and 9706 in Dorchester County, Tract 9603 in Talbot County, Tract 102 in Wicomico County, and Tracts 102, 9510, 9513, and 9515 in Worcester County. These last five Tracts in Talbot and Worcester Counties are the Tracts were there are institutions that might be impacting the levels of concentration, but generally the minority population by itself indicates they would be areas of concentration even if the institution was not present. Of these areas, Tracts 9705 and 9706 are located just outside of Cambridge in Dorchester County; Tract 9603 is located on the edge of Easton in Talbot County, and Tract 102 is just outside of Salisbury in Wicomico County. In primarily rural areas, towns typically have higher numbers of minorities than the surrounding farm areas, so these findings are not surprising. However, in a few census tracts the minority count is significantly higher than the counties’ minority representation as a whole. Notably, the tract outside Salisbury and the two tracts in Cambridge show such patterns. These concentrations may indicate either a past historical pattern of segregation, and/or possible discrimination in these communities. The Charles County designations are most likely due to the shifting demographics of the County as a whole, which became a majority minority county with the 2010 Census, as black/African American households moved out of the central core of the Washington, D.C. metro area to find more affordable housing.

20
The Census tracts with institutions that caused the concentration included:
County Census Tract Number Institutional Structure
Allegany County Tract 2 Prison
Allegany County Tract 13 Prison
Allegany County Tract 18 Frostburg State University
Carroll County Tract 5052.03 Prison
Frederick County Tract 7510.93 Prison
Saint Mary’s County Tract 8758.01 Military Base
Saint Mary’s County Tract 8759.01 Military Base
Saint Mary’s County Tract 8769.02 Military Base
Saint Mary’s County Tract 8760.01 Military Base
Saint Mary’s County Tract 8760.02 Military Base
Somerset County Tract 9301.01 University of Maryland Eastern Shore
Somerset County Tract 9804 Prison (and Migrant Worker Camp)
Washington County Tract 110 Prison
Lastly, there were ten (10) Census Tracts that were areas of minority concentration, but no single minority was dominant. Rather, the population of Asian, Hispanic (who identified themselves as “other” for race for the Census), and Black/African American Households combined resulted in a minority concentration. These Census Tracts were 8607.02 and 8607.03 in Calvert County, Tract 9556 in Caroline County, Tracts 304, 305.06, and 306.02 in Cecil County, Census Tracts 8515 and 8509.06 in Charles County, Census Tract 7523.01 in Frederick County, and Census Tract 8107 in Queen Anne’s County. Census Tract 8607.03 in Calvert County was unique in that a significant number of persons identified themselves as American Indian in this area, the only area in the State where this occurred.
Areas of Low-Income Concentration
Low-income households are households with incomes 50 percent or less than the median income. Determining concentrations of low-income households is difficult because American Community Survey (ACS) data on low-income households has high margin of error rates of on the Census Tract level, especially in more rural jurisdictions sometimes exceeding 30 percent or more. However, it is considered the “best available data” by HUD. Based on ACS 2012 Census information, there were 14 census tracts with concentrations of low-income persons in
21
Maryland’s non-entitlement jurisdictions that year that also fell within the “10 percent” standard HUD uses to determine if a concentration exists. (There were an additional 11 Census Tracts that could be areas of low-income concentration, but where the margin of error is too high to accurately determine if this is so. Even assuming all of these areas are areas of concentration, this would be fairly consistent with the last AI which showed a total of 39 Census Tracts being areas of low-income concentration.) Of these fourteen Tracts, several are again impacted by institutional structures, including Tracts in Allegany, Somerset and Calvert Counties (see discussion below).
Comparing the census tracts with high minority concentrations to high low-income concentrations, the data shows that only ten of the tracts meet both criteria, a low correlation. Further, of these ten, three are impacted by the same conditions that skewed the minority concentration information. That is, one of the tracts (9301.91 in Somerset County) had incomes affected by a Historically Black College (University of Maryland Eastern Shore), another (Census Tract 18 in Allegany County) was impacted by Frostburg State University (which had a minority enrollment rate of 40 percent), and a third, 8607.02 in Calvert County by a prison work release facility. Of the seven remaining Census Tracts that were both areas of minority and low-income concentration, Tract 304 in Cecil County had no dominate race that lead to the minority concentration. One Tract, 9550 on Caroline County, was a Hispanic/other concentration in addition to being a low-income concentration. This Census Tract is impacted by a chicken processing plant that has imported a large number of Hispanic workers. For the remaining five Tracts, two are located in historically black/African American areas in Cambridge and Salisbury (Tracts 9705 in Dorchester County and 102 in Wicomico County respectively), while the remaining three Tracts are impacted by significant amounts of public and low-income housing. This includes Tract 9515 in Worcester County, where the low-income concentration is due to the presence of a large HUD funded public housing complex (over 350 units) in

22
Pocomoke City, Tract 8760.01, which is concentration due to an array of different low-income housing developments in Lexington Park, and Tract 8905.01 in Charles County (in the Waldorf area) which is impacted by HUD-funded project based Section 8 development. (In these three Tracts, the number of renter households exceeds 50 percent.)
Housing Problems by Race/Ethnicity and Family Size
DHCD also examined housing problems by race/ethnicity and family status. This analysis was conducted using state level data (HUD 2011 CHAS Data utilizing ACS data) to show the impact of housing problems statewide when examined by household type. It is important to understand when looking at this data that HUD defined housing problems narrowly. HUD data focuses primarily on households with excessive housing costs. Some additional data that HUD provides include households who live in substandard housing. However, this data is not cross referenced by race or ethnicity, leading to some gaps in data analysis due to lack of availability. In determining need in a fair housing context, HUD defines disproportionate housing need as any one group or ethnicity having a housing need that is 10 percent greater than the group as a whole. For example, if 40 percent of all extremely low-income households have a housing problem, but 50 percent of all extremely low-income small family households have a housing problem, then small family households have a disproportionate housing need. What the various data tables provided by HUD show is that there is no disproportionate housing need by family size. The data does show that there is a disproportionate need for Hispanic and Asian households, although that need is not related to rent burdens, so that these needs are probably related to overcrowding or substandard housing, with the former being someone more likely than the latter based on the number of households that are overcrowded. (Unfortunately Census/ACS data is not available to confirm this).

23
Housing Problems by Family Size Based on HUD data using the 2011 ACS (best available), as the table below shows, there is no group of renters by family size which has a disproportionate housing need in terms of paying more than 30 percent of their income for rent. Extremely Low-Income elderly households (those earning less than 30 percent of median income) are the most likely to pay excessive rent (53.2 percent) in that group, but it does not exceed 10 percent of the group as a whole (44.5 percent). For Low-Income households (those earning between 30 and 50 percent of Area Median Income, small families (made up of two to four persons) are the most likely to pay excessive rent (37.5 percent), but again, this is within 10 percent of this group as a whole (34.2 percent). For households earning 50 to 80 percent of median income, single person households (HUD uses the term “other” for these households) are the most likely to pay excessive rent, (24.5 percent) but this group is still well within the 10 percent standard for the group as a whole (21.3 percent).
Cost Burdens for Renter Households Paying More than 30 Percent of
Their Income for Rent by Family Type (Source: 2011 CHAS Data, U.S. Department of Housing and Urban Development)
Cost Burden – Renter
Households paying more than 30 percent of their Income for Rent
Households earning 0-30 Percent of Median Income
Percent
Households earning 30-50 Percent of Median Income
Percent
Households earning 50-80 Percent of Median Income
Percent Total
Small Related 46,245 40.9%
42,420 37.5%
24,475 21.6%
113,140
Large Related 8,690 44.3%
7,260 37.1%
3,645 18.6%
19,595
Elderly 28,090 53.2%
16,250 30.8%
8,465 16.0%
52,805
Other 40,770 44.1%
29,035 31.4%
22,620 24.5%
92,425
Total 123,795 44.5%
94,965 34.2%
59,205 21.3%
277,965
HUD defines households paying more than 50 percent of their income in rent as being severely cost burdened. These are the households most likely to become homeless due to paying excessive rent. Again, in examining the data, there is no disproportionate housing need by family type among these households, as all differences between groups by family type are well within the 10 percent threshold. For households earning less than 30 percent of median income, large households are the most likely to be severely cost burdened (72 percent versus 69.9 percent for the group as a whole). For households earning 30 to 50 percent of median income, small households are the most likely to be paying excessive rent (25.3 percent versus 24.5 percent for the group as a whole). For household earning 50 to 80 percent of median income, elderly households are the most likely to be paying excessive rent (7.9 percent versus 5.6 percent for the group as a whole.)

24
Cost Burdens for Renter Households Paying More than 50 Percent of
Their Income for Rent by Family Type (Source: 2011 CHAS Data, U.S. Department of Housing and Urban Development)
Cost Burden –
Renter Households
paying more than 50 percent of their Income for Rent
Households earning 0-30 Percent of Median Income
Percent
Households earning 30-50 Percent of Median Income
Percent
Households earning 50-80 Percent of Median Income
Percent TOTAL
Small Related
40,745 70.1%
14,715 25.3%
2,655 4.6%
58,115
Large Related
7,340 74.0%
2,215 22.3%
360 3.6%
9,915
Elderly
19,880 67.4%
7,300 24.7%
2,320 7.9%
29,500
Other
35,100 70.3%
11,905 23.8%
2,935 5.9%
49,940
TOTAL
103,065 69.9%
36,135 24.5%
8,270 5.6%
147,470
Housing Problems by Race/Ethnicity DHCD also examined housing problems by race and ethnicity. HUD data (2011 CHAS utilizing the American Community Survey) shows that there is no disproportionate need between Caucasian/White households, Black/African American households, Native American/Pacific Islander or Native American households in Maryland. However, the data shows fairly consistently that there is a disproportionate housing need by Hispanic households (who can be of any race), as well as Asian households. The table below shows this data for households earning less than 30 percent of median income:
Households with Housing Problems Earning Less than 30 percent of Area Median Income Source: HUD CHAS Data 2011/ACS
0-30 Median Income
One or More Housing Problem
No Housing Problem Total
Percent With a Housing Problem
Percent w/o
Problem
Total
155,150
75,949
231,099 67% 33%
White/Caucasian
69,965
40,589
110,554 63% 37%
Black/African American
66,155
29,366
95,521 69% 31%
Asian
5,203
216
5,419 96% 4%
American Indian/Alaska Native
467
353
820 57% 43%
Pacific Islander
25
55
80 31% 69%
Hispanic
10,459
2,490
12,949 81% 19%

25
The table below shows the same data for households earning between 30 and 50 percent of median income. Again, Asian and Hispanic households have disproportionate housing problems. American Indian/Alaska Native households also may have a disproportionate housing problem, however the sample size is fairly small, which may have skewed the results:
Households with Housing Problems Earning Between 30 and 50 Percent of Area Median Income
Source: HUD CHAS Data 2011/ACS
31-50 Median Income One or More
Housing Problem
No Housing Problem Total
Percent With a
Housing Problem
Percent w/o
Problem
Total
79,768
158,987
238,755 33% 67%
White
37,080
84,980
122,060 30% 70%
Black/African American
28,040
59,819
87,859 32% 68%
Asian
4,361
4,082
8,443 52% 48%
American Indian/Alaska Native
272
310
582 47% 53%
Pacific Islander
-
125
125 0% 100%
Hispanic
8,804
7,517
16,321 54% 46%
For Households earning between 50 and 80 percent of median income, the HUD CHAS data one again shows Asian and Hispanic Households have disproportionate housing needs:
Households with Housing Problems Earning Between 50 and 80 Percent of Area Median Income
Source: HUD CHAS Data 2011/ACS
50-80 Median Income One or More
Housing Problem
No Housing Problem Total
Percent With a
Housing Problem
Percent w/o
Problem
Total
42,944
237,254
280,198 15% 85%
White
22,514
142,011
164,525 14% 86%
Black/African American
12,085
75,555
87,640 14% 86%
Asian
2,390
6,795
9,185 26% 74%
American Indian/Alaska Native
63
600
663 10% 90%
Pacific Islander
15
75
90 17% 83%
Hispanic
5,120
9,644
14,764 35% 65%

26
For households earning 80 to 100 percent of median income, one again Hispanic households show a greater housing need. In this instance, Asian households do not show a greater need, but Pacific Islanders do. This may be in part to a small sample size that only covered 135 households.
Households with Housing Problems Earning Between 80 and 100 Percent of Area Median Income
Source: HUD CHAS Data 2011/ACS
80-100 Median Income One or More
Housing Problem
No Housing Problem Total
Percent With a
Housing Problem
Percent w/o
Problem
Total
21,763
203,316
225,079 10% 90%
White
9,710
124,059
133,769 7% 93%
Black/African American
6,971
60,110
67,081 10% 90%
Asian
1,229
6,965
8,194 15% 85%
American Indian/Alaska Native
53
454
507 10% 90%
Pacific Islander
50
85
135 37% 63%
Hispanic
3,272
8,873
12,145 27% 73%
While the HUD CHAS/ACS data shows that there is a disproportionate housing need for Asian and Hispanic households, the data also shows that this need is generally not due to paying excessive rent, at least for Asian households. The data shows Hispanic households are disproportionately impacted paying excessive rent for those households paying more than 50 percent of their income for rent. The difference is just above the 10 percent threshold (0.4 percent above the threshold) which would be within the margin of error for this measure. This suggests that the housing problems Asian and Hispanic households face may be due to overcrowding and substandard housing. Unfortunately, neither the HUD CHAS data nor the ACS data break down overcrowding or substandard housing by race/ethnicity, so we cannot verify this. However, since the housing need for Hispanic households is consistent for all income groups, this is likely a housing problem that needs to be addressed:

27
Housing Cost Burden By Race/Ethnic Group Source: HUD CHAS Data/ACS
Race/Ethnicty Not Cost Burdened
Percent 30-50% Percent >50% Percent
Total
1,363,552 65.6%
422,760 20.4%
291,055 14.0%
White
926,087 71.6%
225,563 17.4%
142,547 11.0%
Black/African American
319,279 55.7%
146,258 25.5%
107,350 18.7%
Asian
54,166 62.8%
19,282 22.4%
12,796 14.8%
American Indian/Alaska Native
2,468 58.2%
981 23.1%
791 18.7%
Pacific Islander
563 79.0%
100 14.0%
50 7.0%
Hispanic
45,077 49.0%
24,549 26.7%
22,412 24.4%
PERSONS WITH SPECIAL NEEDS
The State of Maryland, through its State Disabilities Plan, has adopted a policy that states that People with disabilities will have a full array of housing options similar to their non-disabled peers. People with disabilities will have access to affordable, accessible housing in their communities with linkages to appropriate support services. DHCD, working with the Maryland Department of Disabilities (MDoD), the Maryland Department of Health and Mental Hygiene (DHMH) and other State agencies works to meet that goal in partnership with these and other agencies. Determining the housing needs of persons with disabilities is difficult, in part because the Census and the American Community Survey (ACS) do not collect specific statistics on persons with disabilities with housing needs. In addition, data definitions are fluid and consistently changing, so that, for example, the Census specifically states that data from 2008 and earlier cannot be reliably compared to current data. (In fact, sometimes Census uses the term “disabled” and sometimes “difficulty” when reporting on persons with various limiting conditions). The data Census does collect is also limited in that “disability” or “difficulty” is self-reported, so some minor difficulties may be overstated and some major difficulties not reported at all (and the impact on housing is not clear – for example, if a “hearing difficulty” can be solved with hearing aids versus building housing units for persons who suffer from profound deafness). In addition, the Census does not collect data on certain disabilities, such as persons with HIV/AIDS, even though HUD operates the Housing Opportunities for Persons With AIDS program, and other data, such as the needs of homeless disabled Veterans who are assisted through VASH Vouchers, or non-homeless persons who received Non-Elderly Disabled (NEDs) Vouchers. We do have some information available from DHMH regarding certain populations of persons with disabilities, specifically on the needs of persons with mental illness. The Mental Hygiene Administration of the Department of Health and Mental Hygiene through its public mental health system provide services to individuals with mental illness to include both inpatient and outpatient community services. As of April 2014, the Mental Hygiene Administration funded 2,498 adult residential rehabilitation program (RRP) beds in the community. Many of these RRP sites have been financed by DHCD, DBM – Community Bond, RRP providers, and HUD

28
(811 grants). The MHA notes that over the next five years, partnering efforts will need to focus on assisting over 1,000 consumers with mental illness in need of affordable housing that would need to include funding for rental assistance and a variety of support services in order to be discharged from state hospitals and step down from RRP services to independent housing. This is based on the Statewide Needs Assessment for Mental Health Services and the Mental Hygiene Administration's Five-Year Plan for Downsizing and Consolidating of State Psychiatric Hospitals. The Mental Hygiene Administration also reports that they currently have 1,300 adults on the waiting list for beds, and more than 350 consumers in the RRP programs are in need of integrated and affordable housing. According to the U.S. Census Bureau, American Community Survey (2013), persons with disabilities include persons with hearing difficulty, vision difficulty, cognitive difficulty, ambulatory disability, and self-care difficulty. The Census (and ACS) extensively revised how they report on persons with disabilities after 2008 to define the disabled population in these categories, as well as re-define other problems, especially those affecting children such as Attention Deficit Disorder or testing difficulties which used to be listed as disabilities but no longer are (these changes resulted in a decrease of about 300,000 individuals in Maryland alone being identified as “disabled”.) The data used in this section is from the 2009-2013 five year ACS. The material below only provides information on the estimated numbers of persons with disabilities. It does not include information on persons who are both disabled and have housing needs (which was a problem with the previous data as well). It should be noted that persons with disabilities may actually have more than one “difficulty”. Consequently, if the “difficulties” are added up, they will exceed the total numbers for each group. It should also be noted that neither the Census or ACS collect information on what was formerly called the “frail elderly”, which was essentially persons over 85 years of age, regardless of their physical condition. The Census now splits the data by age cohorts, including the population under five, the population 5-17, the population 18 through 64, and the population 65 or older. This actually helps in looking at persons with different needs, and gives a slightly clearer picture regarding possible housing needs since minors are not able to purchase or rent housing on their own. We acknowledge there are issues with the data, but it is the “best available” for persons with disabilities. The ACS data estimates that about 10.3 percent of Maryland’s population has a disability. Persons with disabilities increase significantly with age. For example, while only about 5.7 percent of the population under 17 has any sort of disability (with cognitive difficulty significantly outstripping all others), this rises to 8.2 percent to individuals between 18 and 64, and just over 33 percent for persons over the age of 65. In fact, persons 65 and over consistently have a difficulty at least four times as often as the population under 65 (except for a cognitive difficulty, which is still more than twice the rate for the rest of the population), and their ambulatory difficulties are closer to five times that of other individuals. The disability rate is slightly higher for females (10.6 percent), than males (9.9 percent) but this may be a reflection of the fact that women live longer, so there are more likely more women in the 65 plus age group than men. In terms of race and national origin, the white alone population has a slightly higher disability rate (10.9 percent) than the black population (10.7 percent), while the Asian population has disability rate at just over half of either of these groups (5.6 percent). The disability rate for American Indian households is the highest, at 15.6 percent.
Persons With Disabilities in Maryland Total With a Percent

29
disability with a disability
Estimate Estimate Estimate
Total civilian non-institutionalized population
5,737,052 588,940 10.3%
Population under 5 years 366,321 3,146 0.9%
With a hearing difficulty - 2,209 0.6%
With a vision difficulty - 1,534 0.4%
Population 5 to 17 years 980,418 46,625 4.8%
With a hearing difficulty - 5,243 0.5%
With a vision difficulty - 6,835 0.7%
With a cognitive difficulty - 36,330 3.7%
With an ambulatory difficulty - 5,533 0.6%
With a self-care difficulty - 8,645 0.9%
Population 18 to 64 years 3,675,444 302,772 8.2%
With a hearing difficulty - 57,087 1.6%
With a vision difficulty - 49,434 1.3%
With a cognitive difficulty - 122,531 3.3%
With an ambulatory difficulty - 150,532 4.1%
With a self-care difficulty - 50,904 1.4%
With an independent living difficulty - 101,998 2.8%
Population 65 years and over 714,869 236,397 33.1%
With a hearing difficulty - 87,487 12.2%
With a vision difficulty - 42,311 5.9%
With a cognitive difficulty - 59,607 8.3%
With an ambulatory difficulty - 153,458 21.5%
With a self-care difficulty - 54,900 7.7%
With an independent living difficulty - 108,761 15.2%
SEX
Male 2,756,347 271,890 9.9%
Female 2,980,705 317,050 10.6%
RACE AND HISPANIC OR LATINO ORIGIN
One Race 5,577,177 575,200 10.3%
White alone 3,355,599 366,253 10.9%
Black or African American alone 1,677,225 179,874 10.7%
American Indian and Alaska Native alone
16,955 2,649 15.6%
Asian alone 330,811 18,400 5.6%
Native Hawaiian and Other Pacific Islander alone
2,207 206 9.3%
Some other race alone 194,380 7,818 4.0%
Two or more races 159,875 13,740 8.6%
White alone, not Hispanic or Latino 3,110,694 354,520 11.4%
Hispanic or Latino (of any race) 488,083 23,570 4.8%
Source: American Community Survey, 2013
Elderly and Frail Elderly

30
As noted earlier in the AI, while HUD asks grantees to look at needs for various disabled populations, including the “frail elderly”, the Census Bureau no longer collects or reports on that information. (This is a category by itself in part because HUD operates the Section 202 elderly which is targeted toward serving the frail elderly.) As also noted above, the population most likely to have a disability or “difficulty” of some type are elderly households, with a third of all elderly households in Maryland having a handicap of some type:
Elderly Population with a Disability in Maryland, 2013
Population 65 years and over 714,869 236,397 33.1%
With a hearing difficulty - 87,487 12.2%
With a vision difficulty - 42,311 5.9%
With a cognitive difficulty - 59,607 8.3%
With an ambulatory difficulty - 153,458 21.5%
With a self-care difficulty - 54,900 7.7%
With an independent living difficulty
- 108,761 15.2%
Source: American Community Survey, 2013
The number of elderly persons with a difficulty varies County by County, with the disabled elderly mostly likely to be found in the more rural Maryland counties in the non-entitlement areas. The table below shows the Elderly population with disabilities in the States non-entitlement areas:
Jurisdiction Population Disabled Percent Percent Elderly
State 5737052 588940 10.3% 33.1%
Allegany 68671 12429 18.1% 38.3%
Calvert 87900 8882 10.1% 33.3%
Caroline 32400 4643 14.3% 37.8%
Carroll 165182 14627 8.9% 30.6%
Cecil 100081 12628 12.6% 33.9%
Charles 146522 13505 9.2% 37.4%
Dorchester 32138 5160 16.1% 40.6%
Frederick 234171 21980 9.4% 32.5%
Garrett 29457 4020 13.6% 33.5%
Kent 19749 2953 15.0% 33.0%
Queen Anne's 47581 4923 10.3% 29.2%
Saint Mary's 103797 11614 11.2% 33.2%
Somerset 21652 3748 17.3% 42.0%
Talbot 37443 4887 13.1% 30.0%
Washington 140973 21111 15.0% 36.5%
Wicomico 98414 11963 12.2% 37.0%
Worcester 50831 7077 13.9% 29.5%
Source: American Community Survey 2013

31
DHCD works to help elderly persons with disabilities through programs that help elderly homeowners age in place by rehabilitating or remodeling their homes to make them more accessible, and by financing affordable rental housing for the elderly which typically includes extensive design features that make housing more accessible for persons with physical limitations. DHCD’s Accessible Homes for Seniors Program provides for accessibility related improvements to the homes of seniors. These improvements may include, among other items, the installation of grab bars and railings, and widening of doorways, the installation of lever handles, and installation of ramps. In addition, improvements such as creating first floor bathrooms or laundry rooms can be done on a case by case basis. Home improvements such as these represent for many older people the key to remaining in their home and maintaining their independence. Accessible and affordable rental housing is provided through DHCD’s rental housing finance programs, which can be used to finance rental housing specifically for the elderly (see below.) In addition to DHCD’s efforts, The Maryland Department of Aging offers an array of programs to elderly persons who require supportive services in order for them to live as independently as possible. These include the following:
Congregate Housing Services Program which provides assistance with activities of daily living in senior citizen apartment buildings that serve low and moderate- income residents.
Continuing Care Retirement Communities CCRCs are specific types of retirement housing that offer a combination of housing and services, including access to health-related benefits for more than one year and usually for life.
Medicaid Home and Community-based Services which provides assistance with activities of daily living to Medicaid recipients who have a chronic illness, medical condition or disability.
Money Follows the Person Options Counseling Initiative to identify Medicaid-eligible individuals in nursing homes who want to transition back into the community using home and community-based services offered through Medicaid waivers.
National Family Caregiver Support Program which provides a broad array of services to families and caregivers who are not receiving compensation for their services.
Senior Assisted Living Group Home Subsidy Program provides low and moderate-income seniors with access to assisted living services in group homes licensed by the State.
Senior Care Services provides coordinated, community-based, in-home services to seniors with disabilities.
Persons With HIV/AIDS The State of Maryland is a recipient of Housing Opportunities for Persons With AIDS (HOPWA) funding from HUD. HOPWA funding may only be awarded to Cities or States, and funding is awarded by HUD based on caseloads, without a cross-reference to persons with HIV/AIDS with housing needs (no data on persons with HIV/AIDS and housing needs is available from Census or other sources). The Maryland Department of Health and Mental Hygiene (DHMH) is the actual grantee for HOPWA funding in Maryland, and DHCD is sub-granted funds from DHMH to carry out the housing portion of the HOPWA program, which DHMH carries out the casework and health requirements.

32
Cities that receive HOPWA funding are required to serve all jurisdictions in their Metropolitan Statistical Area (MSA). For example, Calvert and Charles County residents who seek assistance under the HOPWA program receive their assistance from the City of Washington, D.C., residents of Carroll County who seek HOPWA assistance receive that assistance from Baltimore City, etc. The State’s program serves areas that are not in MSAs. The Table below from DHMH shows HIV/AIDS cases in the non-entitlement areas as of September 30, 2014.
Jurisdiction Count Notes
State of Maryland 30,365 26,813 persons in the Entitlement Jurisdictions had HIV and/or AIDS as of 9/30/2014
Allegany 73
Calvert 100 Part of the Washington, D.C. Service Area
Caroline 60
Carroll 119 Part of the Baltimore Service Area
Cecil 108 Part of the Wilmington, DE/Philadelphia Service Area
Charles 379 Part of the Washington, D.C. Service Area
Dorchester 112
Frederick 306 Part of a Service Area Comprising Frederick and Montgomery Counties Only
Garrett 8
Kent 35
Queen Anne's 47
Saint Mary's 114
Somerset 52
Talbot 54
Washington 300
Wicomico 202
Worcester 79
Subtotal non-entitlement 2,148
Corrections 1,404
Income and Housing for Persons with Disabilities While there is no clear data showing the needs of housing for persons with disability by income, the State does recognize that the need for supportive housing for the persons with disabilities is great, extending well beyond the existing resources of the State. Extremely low-income people with disabilities have the most difficult time locating affordable housing. For this group , government subsided rental assistance is critical. The reason for this is that even low income rental housing is often not affordable to persons on Supplemental Security Income (SSI), which rental housing currently pays $733 per month in benefits, so that SSI recipients can only afford to pay about $219 per month for rent and utilities. A low-income unit without rental subsidies

33
often needs to charge at least $400 per month to meet basic operating and maintenance costs, assuming there is no debt service on the property or unit as well. Given the extended waiting lists for subsidized, DHCD has used and will continue to use Weinberg Foundation capital funding to create units with rents affordable to households at 15% AMI without rental subsidies. DHCD is strongly committed to serving the housing needs of people with disabilities, offering numerous housing opportunities and financing programs listed below. Additionally, working cooperatively with DHMH, DHCD revised its Qualified Allocation Plan (QAP) for federal LIHTC and other State resources to provide more housing for persons with disabilities. DHCD has also worked with DHMH and MDoD in obtaining rental assistance for disabled persons through programs such as HUD’s 811 program, as well as by obtaining VASH and NEDs Vouchers for homeless disabled persons. Another partner in this effort has been the Weinberg Foundation, which has worked with DHCD to finance affordable housing for persons with disabilities throughout the State through several grants to the Department. While DHCD’s efforts have been successful in creating substantially more units for disabled households over the past five years, the numbers show that need continues to exist. Some of the DHCD programs that assist persons with disabilities off all types include: MD Affordable Housing Trust The Maryland General Assembly created the Maryland Affordable Housing Trust (MAHT) in 1992 to make affordable housing more available throughout the State of Maryland. MAHT promotes affordable housing for households earning less than 50 percent of area or statewide median income by:
Funding capital costs of rental and ownership housing; Providing financial assistance for nonprofit-developer capacity building; Funding supportive services for occupants of affordable housing; and Funding operating expenses of affordable housing developments.
Housing Programs for Individuals with Disabilities The Homeownership for Individuals with Disabilities Program provides low-interest mortgage loans to eligible disabled homebuyers and homebuyers with a son or daughter (regardless of age – who resides with one of the borrowers and is cared for principally by one of the borrowers). One of the borrowers must have a physical or mental impairment that substantially limits one or more major life activities (for example, hearing, seeing, speaking, sitting, standing, walking, concentrating, or performing manual tasks). Programs include Group Homes, Disabled Borrowers, Special Housing Opportunities Program, and Group Homes Financing Program. For example, the Group Housing Programs helps individuals, qualified limited partnerships, and nonprofit organizations to construct or acquire, and/or modify existing housing to serve as a group home or assisted living unit for eligible persons and households with special housing needs. The DHCD uses both state funds from the Group Home Financing Program and the proceeds from the sale of tax exempt mortgage revenue bonds under the Special Housing Opportunities Program to fund these loans.

34
Partnership Rental Housing Program The Partnership Rental Housing Program provides loans of up to $75,000 per unit for rental housing that will be occupied by households with incomes below 50 percent of the statewide median. There is no limitation on the maximum project amount but Partnership projects tend to include 100 or fewer units. State funds may be used for the development costs of building acquisition, construction or rehabilitation of buildings on site. Projects financed by the program are intended to provide rental housing to individuals and households with incomes sufficient to pay rents in amounts necessary to maintain financial self-sufficiency of the project. Federal Low Income Housing Tax Credit Maryland administers the Federal Low Income Housing Tax Credit Program to support the development of affordable multifamily rental housing. Credits are awarded competitively in conjunction with the State's Rental Housing Program funds and federal HOME funds. Tax credits are allocated in accordance with federal IRS rules and Maryland's Qualified Allocation Plan. Credits are subject to recapture for failure to comply with all IRS and departmental requirements. The 9 percent Tax Credits are awarded on a competitive basis to nonprofit and for-profit sponsors of eligible housing projects. Projects financed with tax-exempt bonds may be eligible for 4 percent Tax Credits outside of the competitive process. The qualified building must remain in compliance with tax credit income restrictions for a minimum of 15 years. Federal HOME Investment Partnership Funds The HOME Investment Partnerships Program is a federal program that provides funds to the State and certain local governments to promote affordable housing activities. Maryland’s program is administered by the Community Development Administration (CDA) and a portion of the annual allocation is used in conjunction with existing CDA multifamily and single family programs. Shelter and Transitional Housing Facilities Grant Program The Shelter and Transitional Housing Facilities Grant Program (STHGP) provides state funded grants to improve or create transitional housing and emergency shelters. The purpose of the program is to reduce homelessness in the State. New construction, acquisition, rehabilitation of housing, and purchase of capital equipment are eligible activities for STHGP grants. Grants must be used for transitional housing and emergency shelters that include supportive services for their residents. Generally, the grants pay up to 50 percent of the project costs and are processed on a first-come, first-served basis. Rental Assistance Program The Rental Assistance Program is the major state-funded program for assisting very-low income families to afford decent, safe, and sanitary housing in the private market.
Persons of Limited English Proficiency
Persons of Limited English Proficiency (LEP) are defined by the Federal Government as persons who have a limited ability to read, write, speak or understand English. Under federal guidelines, persons characterized in the census with LEP are those who do not speak English either very well or not at all. Every federal agency is required to provide guidance for serving persons of LEP under both the Civil Rights Act of 1964 and Executive Order (EO) 13166 issued
35
August 11, 2000. HUD issued its proposed guidance on persons of LEP in 2003 and issued final guidelines on January 22, 2007. In writing its guidance on LEP, HUD states that if an agency receives HUD funds then, “Coverage extends to a recipient’s entire program or activity, i.e., to all parts of a recipient’s operations…For example, HUD provides assistance to a state government’s Department of Community Development, which provides funds to a local government to improve a particular public facility. All of the operations of the entire Department of Community Development – not just the particular community and/or facility – are covered.” HUD uses LEP persons as a proxy for potential housing issues by ethnic status. In determining the scope of who should be covered under LEP provisions, HUD developed what it calls the four factor test for recipients of its fund to implement in assessing whether LEP persons have meaningful access to HUD’s services and programs. The test factors are as follows: 1. The number or proportion of LEP persons eligible to be served or likely to be encountered
by the program or grantee (including persons who would be served or encountered if the persons received adequate education and outreach and the recipient provided sufficient language services);
2. The frequency with which LEP persons come in contact with the program; 3. The nature and importance of the program, activity, or service provided by the program to
people’s lives; and 4. The resources available to the recipient and costs associated with creating meaningful
access. Because of difficulty determining the outcome of the LEP four part test, HUD also issued “safe harbors” within which a recipient receiving HUD funding should translate vital materials, undertake the translation of such vital materials, maintain records or provide reports to HUD of such efforts; then the recipient will be found to have made reasonable efforts to provide language assistance. The following safe harbor conditions are as follows: (a) The HUD recipient provides written translations of vital documents for each eligible LEP language group that constitutes 5 percent or 1,000 whichever is less, of persons eligible to be served or likely to be either affected or encountered, or;
(b) If there are fewer than 50 persons in a language group that reached the 5 percent trigger then the recipient does not translate vital written materials. Instead, provides written notice in the primary language of the LEP language group to receive competent oral interpretation of those written materials, free of cost. Based on completion of either the four factor test or the safe harbor conditions the recipient of HUD funds then develops an implementation plan or Language Access Plan (LAP) to serve LEP persons. HUD identifies five steps in creating a LAP which includes: 1. Identifying the LEP individuals who need language assistance; 2. Identifying information about the ways in which language assistance will be provided to LEP
persons;

36
3. Implementing a training process of recipient staff to impart an awareness and knowledge about providing LEP persons with meaningful access;
4. Notifying LEP persons of the language services available to them; and, 5. Implementing a process for evaluating the LAP on an ongoing basis.
State Law In addition to federal guidelines, there is also State law regarding persons of LEP. State law regarding persons of LEP (Section 10-1101 of the Annotated Code of Maryland) state: “it is the policy of the State that State departments, agencies, and programs shall provide equal access to public services for individuals with LEP.” Equal access means “to be informed of, participate in, and benefit from public services offered by a State department, agency, or programs, at a level equal to English proficient individuals.” In addition, the law notes that “program” constitutes all operations of a State department. Under State Law, agencies are required to provide access to “vital documents” which includes all applications, or information materials, notices and complaint forms offered by State departments, agencies and programs. These vital documents need to be translated if 3 percent or more of the population in a local office of an agency’s service area is of LEP. It does not specifically say that written translation is needed. Oral translation services may be offered to provide equal access to agency programs, which includes various methods to provide verbal information and interpretation such as staff interpreters, bilingual staff, telephone interpreter programs, and private interpreter programs. Under State law, the lead agency is assisting persons of LEP in Maryland is the Department of Human Resources, which also is required to provide technical assistance to other State agencies in assisting persons of LEP.
Persons of Limited English Proficiency in Maryland Based on 2013 ACS data, about 8 percent of all Maryland residents were of Limited English Proficiency. Unfortunately, while LEP regulations utilize a four part test in determining the need to translate materials or offer assistance to LEP persons, this test was based on the old Census long form, rather than ACS data. Under the Census Long Form, we were able to determine renter versus owner households, as well as determine the age of persons of LEP. This data was important because it allowed us to focus on LEP persons who might access our programs under the test (essentially renters, since they were either looking for affordable rental assistance, or they wanted to access our programs for first-time homebuyers), as well as subtract LEP persons who were not eligible to participate in DHCD programs (such as children between the ages of 6 and 17 who cannot legally obtain mortgages or rent property.) With the elimination of the Long Form and the substitution of ACS data, we can only determine the universe of persons of LEP, regardless of whether they need or can qualify for DHCD housing assistance. In addition, the ACS data has high margins of error. As per the table below, there are at least 17 different languages spoken in Maryland where more than 1,000 persons (the “safe harbor” for persons of LEP) do not speak English well even within the margin of error,
Language Estimate Margin of
Error
Total: 5,562,102 +/-1,310
Speak only English 4,617,898 +/-16,769
Spanish or Spanish Creole: 395,706 +/-8,632
Speak English "very well" 224,206 +/-8,214
Speak English less than "very well" 171,500 +/-7,425

37
French (incl. Patois, Cajun): 51,661 +/-5,558
Speak English "very well" 38,521 +/-4,849
Speak English less than "very well" 13,140 +/-2,664
French Creole: 13,324 +/-3,456
Speak English "very well" 8,162 +/-2,364
Speak English less than "very well" 5,162 +/-2,166
Italian: 8,924 +/-1,787
Speak English "very well" 6,721 +/-1,395
Speak English less than "very well" 2,203 +/-921
Portuguese or Portuguese Creole: 10,273 +/-2,500
Speak English "very well" 7,070 +/-1,899
Speak English less than "very well" 3,203 +/-1,081
German: 16,126 +/-2,436
Speak English "very well" 14,354 +/-2,350
Speak English less than "very well" 1,772 +/-492
Russian: 18,715 +/-2,667
Speak English "very well" 11,090 +/-1,960
Speak English less than "very well" 7,625 +/-1,590
Persian: 13,650 +/-2,268
Speak English "very well" 8,410 +/-1,743
Speak English less than "very well" 5,240 +/-1,422
Gujarati: 9,160 +/-2,549
Speak English "very well" 6,298 +/-1,798
Speak English less than "very well" 2,862 +/-1,028
Hindi: 14,845 +/-2,466
Speak English "very well" 12,159 +/-2,244
Speak English less than "very well" 2,686 +/-1,202
Urdu: 20,755 +/-4,869
Speak English "very well" 15,268 +/-3,808
Speak English less than "very well" 5,487 +/-1,479
Chinese: 65,212 +/-6,368
Speak English "very well" 34,778 +/-3,593
Speak English less than "very well" 30,434 +/-4,350
Korean: 38,547 +/-4,782
Speak English "very well" 17,373 +/-2,542
Speak English less than "very well" 21,174 +/-2,750
Vietnamese: 19,194 +/-3,913
Speak English "very well" 8,758 +/-1,908
Speak English less than "very well" 10,436 +/-2,771
Tagalog: 34,660 +/-4,480
Speak English "very well" 25,461 +/-3,810
Speak English less than "very well" 9,199 +/-1,673
Arabic: 20,236 +/-5,060
Speak English "very well" 15,447 +/-3,981
Speak English less than "very well" 4,789 +/-1,996
Greek: 11,708 +/-4,079
Speak English "very well" 8,341 +/-2,637
Speak English less than "very well" 3,367 +/-2,311

38
In addition, there are three other languages where there are more than 1,000 persons of LEP, but the margin of error is great enough that this may not qualify under the threshold:
Polish: 3,142 +/-952
Speak English "very well" 2,102 +/-625
Speak English less than "very well" 1,040 +/-556
Japanese: 4,518 +/-1,501
Speak English "very well" 3,030 +/-1,152
Speak English less than "very well" 1,488 +/-732
Thai: 4,118 +/-1,414
Speak English "very well" 2,549 +/-1,096
Speak English less than "very well" 1,569 +/-968
The Department’s Maryland Housing Search website also provides assistance to persons of LEP across the State. DHCD’s housing search website, www.mdhousingsearch.org, provides written translation on the availability of affordable rental housing in Spanish, and assistance is available in other languages through translator services. In addition to housing search, the State and DHCD (through the Department of Budget and Management) has had a contract with CRT Services to provide oral translation for other housing and community development programs. Despite finding that the majority of non-English speaking populations are primarily concentrated in entitlement jurisdictions, it is through CRT services that DHCD is able to assist persons of LEP statewide.
39
Private Sector Lending Practices
Federal recognition of the importance of residential credit culminated in the mid to late 1970s with the passage of two well-known pieces of legislation. The Home Mortgage Disclosure Act (HMDA) of 1975 required private lenders to report the number and dollar volume of residential loans at the census tract level. This data allowed people to monitor local investment and disinvestment activity and to identify lenders who were serving their local deposit bases and communities from those who were not. The Community Reinvestment Act (CRA) of 1977 made “redlining” illegal by stipulating that lenders had an affirmative obligation to make loans in low and moderate income communities. In brief, CRA required lenders to conduct business in communities that were traditionally objects of redlining and disinvestment, while HMDA provided people with the information to make sure they were doing it. The DHCD Office of Research analyzed 2012 HMDA data obtained from the Federal Financial Institutions Examination Council to ascertain whether disparities (or possible discrimination) exist in Maryland’s non-entitlement communities. The analysis examined mortgage loan acceptance rates by race, ethnicity and gender. These data contain information on loan applications received by financial institutions and by characteristics of the applicants. The HMDA data selected for this analysis were on the bases of loan type (i.e. conventional loans), loan purpose (purchase of 1-to-4 family homes or refinancing of home purchase or home improvement loans), owner occupancy statue of the loan (properties occupied by the owner), property type (one to four family dwellings), action taken (loans were originated or application was denied), gender of applicant (male or female), ethnicity of applicant (Hispanic or Latino, or Non- Hispanic or Latino), and race of applicant (White or Minority). DHCD used a Z-statistic test to determine possible lending discrimination. The Z-statistics was used to test the hypothesis of the differences in number of households that have received or have been denied loans on the basis of race, gender and ethnicity. However, the implication of the test would only be limited to the conclusions of whether or not there are significant statistical differences between these ratios of zero and 1.96, using a 95 percent confidence level, not whether discrimination existed per se. It is not accurate to assess discrimination on the basis of race, sex or ethnicity on the Z-statistic alone. Other factors that would play a significant role in determining loan acceptance or rejection include, but may not be limited to, debt to income ratio, employment history, income, credit history, down payment, and collateral. A summary of the findings are as: Table 9 shows households who either received or were denied mortgage loans to purchase a home by race of applicant and by county. The test of the differences between two means, which is referred to as the Z-statistics, was significantly different from zero, and hence the hypothesis (defined as no difference between the means of races) can be rejected in six Maryland jurisdictions. The jurisdictions are Anne Arundel, Baltimore, Carroll, Frederick, Harford, Montgomery and Prince George’s Counties.

40
Table 9. Households Who Received or Were Denied a Mortgage Loan to Purchase a Home by Race of Applicant
County
White Minority
Z
Statistics
Number of Loans % Receiving
Loan
Number of Loans % Receiving
Loan Originated Denied Originated Denied
Allegany 319 41 88.6% 21 7 75.0% 0.76
Anne Arundel 4,527 487 90.3% 1,278 280 82.0% 8.23*
Baltimore 4,292 421 91.1% 2,005 435 82.2% 5.79*
Baltimore City 1,995 225 89.9% 1,241 368 77.1% 1.91
Calvert 751 66 91.9% 200 27 88.1% 1.40
Caroline 161 39 80.5% 22 12 64.7% 0.35
Carroll 1,343 125 91.5% 218 42 83.8% 2.85*
Cecil 716 132 84.4% 69 27 71.9% 1.64
Charles 828 93 89.9% 924 290 76.1% -0.24
Dorchester 145 44 76.7% 41 27 60.3% 0.26
Frederick 2,114 227 90.3% 574 113 83.6% 3.90*
Garrett 225 50 81.8% 72 13 84.7% 0.39
Harford 1,980 225 89.8% 434 85 83.6% 3.92*
Howard 2,052 158 92.9% 1,440 242 85.6% 1.55
Kent 116 20 85.3% 16 10 61.5% 0.25
Montgomery 5,398 494 91.6% 3,863 589 86.8% 3.89*
Prince George's 1,827 344 84.2% 4,902 1,613 75.2% -7.79*
Queen Anne's 488 58 89.4% 84 12 87.5% 1.02
Somerset 60 29 67.4% 24 20 54.5% 0.09
St. Mary's 936 79 92.2% 197 34 85.3% 1.87
Talbot 272 32 89.5% 39 13 75.0% 0.59
Washington 844 141 85.7% 143 49 74.5% 1.78
Wicomico 515 122 80.8% 136 40 77.3% 0.96
Worcester 896 150 85.7% 217 33 86.8% 1.72
Maryland 32,800 3,802 88.6% 18,160 4,381 80.6%
* Refers to the difference of the mean approval rates is significantly different from zero at the 95 percent confidence level.
Source: Federally Financed Institutions Council, Home Mortgage Disclosure Act, 2012; DHCD Office of Research
Table 10 shows households who either received or were denied mortgage loans for refinancing a home and/or for home improvements by race of applicant and by county. The test of the differences between two means demonstrates that in nine Maryland jurisdictions the hypothesis (defined as no difference between the means for refinancing a home and/or home improvements by race of applicant) can be rejected. The jurisdictions are Anne Arundel, Baltimore, Baltimore City, Carroll, Frederick, Harford, Howard, Montgomery Prince George’s and St. Mary’s Counties

41
Table 10. Households Who Received or Were Denied a Mortgage Loan To Refinance and/or for Home Improvements, by Race of Applicant
County
White Minority
Z
Statistics
Number of Loans % Receiving
Loan
Number of Loans % Receiving
Loan Originated Denied Originated Denied
Allegany 866 208 80.6% 19 7 73.1% 0.663
Anne Arundel 14,216 2,846 83.3% 1,741 672 72.2% 9.760*
Baltimore 12,917 2,808 82.1% 2,908 1,205 70.7% 7.831*
Baltimore City 3,863 1,069 78.3% 1,625 1,240 56.7% 1.751
Calvert 2,838 638 81.6% 211 114 64.9% 2.055*
Caroline 455 162 73.7% 17 16 51.5% 0.343
Carroll 4,760 858 84.7% 138 33 80.7% 3.616*
Cecil 2,197 607 78.4% 96 37 72.2% 1.644
Charles 2,641 598 81.5% 1,319 504 72.4% 1.034
Dorchester 415 167 71.3% 42 25 62.7% 0.292
Frederick 6,634 1,331 83.3% 704 192 78.6% 4.640*
Garrett 664 236 73.8% 6 3 66.7% 0.515
Harford 6,553 1,193 84.6% 684 241 73.9% 4.592*
Howard 7,502 1,135 86.9% 2,719 607 81.7% 3.742*
Kent 354 147 70.7% 21 16 56.8% 0.261
Montgomery 25,071 3,892 86.6% 8,725 1,919 82.0% 12.789*
Prince George's 4,144 1,191 77.7% 8,956 3,967 69.3% -3.765*
Queen Anne's 1,411 341 80.5% 45 21 68.2% 1.069
Somerset 190 94 66.9% 19 25 43.2% 0.134
St. Mary's 2,980 592 83.4% 297 104 74.1% 2.099*
Talbot 1,022 254 80.1% 48 20 70.6% 0.762
Washington 2,377 643 78.7% 117 39 75.0% 1.768
Wicomico 1,274 370 77.5% 142 78 64.5% 0.886
Worcester 1,983 677 74.5% 84 45 65.1% 1.486
Maryland 107,327 22,057 83.0% 30,683 11,130 73.4%
* Refers to the difference of the mean approval rates is significantly different from zero at the 95 percent confidence level. Source: Federally Financed Institutions Council, Home Mortgage Disclosure Act, 2012; DHCD Office of Research
Table 11 shows households who either received or were denied mortgage loans to purchase a home by ethnicity of applicant and by county. The test of the differences between two means demonstrates that in thirteen Maryland jurisdictions the Z-statistic was significantly different from zero, and hence the hypothesis (defined as no difference between the means by ethnicity of applicant) can be rejected. In other words, the Z-statistic shows that there appears to be significant statistical difference in lending based on ethnicity in the following jurisdictions Baltimore, Baltimore City, Calvert, Cecil, Charles, Dorchester, Garrett, Howard, Kent, Prince George’s, Queen Anne’s, Talbot and Wicomico Counties.

42
Table 11. Households Who Received or Were Denied a Mortgage Loan to Purchase a Home by Ethnicity of Applicant
County
Hispanic or Latino Non- Hispanic or Latino Z
Statistics
Number of Loans % Receiving Loan
Number of Loans % Receiving Loan Originated Denied Originated Denied
Allegany 0 0 n/a 323 39 89.2% Statistics
Anne Arundel 188 47 80.0% 4932 553 89.9% -0.782
Baltimore 146 30 83.0% 5579 690 89.0% -11.479*
Baltimore City 78 12 86.7% 2750 484 85.0% -13.147*
Calvert 23 1 95.8% 805 74 91.6% -6.466*
Caroline 6 1 85.7% 156 33 82.5% -1.892
Carroll 25 6 80.6% 1417 127 91.8% -0.363
Cecil 21 4 84.0% 723 126 85.2% -3.368*
Charles 67 16 80.7% 1518 310 83.0% -1.699*
Dorchester 1 0 100.0% 169 49 77.5% -3.511*
Frederick 107 21 83.6% 2296 260 89.8% -0.407
Garrett 0 0 n/a 250 38 86.8% -5.297*
Harford 54 4 93.1% 2177 268 89.0% -0.605
Howard 129 21 86.0% 2952 294 90.9% -5.137*
Kent 2 1 66.7% 116 20 85.3% -6.831*
Montgomery 692 140 83.2% 7255 785 90.2% -0.276
Prince George's 761 196 79.5% 5080 1461 77.7% -15.881*
Queen Anne's 6 1 85.7% 495 50 90.8% -10.451*
Somerset 0 0 n/a 68 25 73.1% -1.183
St. Mary's 44 7 86.3% 981 83 92.2% -0.165
Talbot 3 2 60.0% 273 34 88.9% -2.267*
Washington 23 15 60.5% 862 120 87.8% -0.653
Wicomico 8 5 61.5% 556 86 86.6% -2.030*
Worcester 11 2 84.6% 877 140 86.2% -1.326
Maryland 2395 532 81.8% 42610 6149 87.4%
* Refers to the difference of the mean approval rates is significantly different from zero at the 95 percent confidence level.
Source: Federally Financed Institutions Council, Home Mortgage Disclosure Act, 2012; DHCD Office of Research
Table 12 shows households who either received or were denied mortgage loans for refinancing a home and/or for home improvements by ethnicity of applicant and by county. The test of the differences between two means demonstrates that in twelve Maryland jurisdictions the Z-statistic was significantly different from zero, and hence the hypothesis (defined as no difference between the means for refinancing a home and/or home improvements by ethnicity of applicant) can be rejected. That is, the Z test indicates that there was statistically significant difference in lending by ethnicity when lending to refinance or make improvements to a home in the following jurisdictions Anne Arundel, Baltimore, Baltimore City, Calvert, Carol, Charles, Frederick, Harford, Howard, Montgomery, Prince George’s and St. Mary’s Counties.

43
Table 12. Households Who Received or Were Denied a Mortgage Loan To Refinance and/or for Home Improvements, by Ethnicity of Applicant
County
Hispanic or Latino Not Hispanic or Latino Z
Statistics
Number of Loans % Receiving Loan
Number of Loans % Receiving Loan Originated Denied Originated Denied
Allegany 3 5 37.5% 872 211 80.5% -0.579
Anne Arundel 110 355 23.7% 15620 3427 82.0% -10.330*
Baltimore 102 263 27.9% 15658 3929 79.9% -10.361*
Baltimore City 62 110 36.0% 5426 2294 70.3% -3.573*
Calvert 19 40 32.2% 3029 734 80.5% -2.005*
Caroline 1 3 25.0% 458 175 72.4% -0.304
Carroll 13 60 17.8% 4848 885 84.6% -3.220*
Cecil 13 33 28.3% 2262 638 78.0% -1.498
Charles 49 128 27.7% 3874 1056 78.6% -2.548*
Dorchester 3 7 30.0% 447 185 70.7% -0.296
Frederick 55 193 22.2% 7178 1477 82.9% -4.744*
Garrett 2 1 66.7% 691 237 74.5% -0.459
Harford 28 127 18.1% 7107 1407 83.5% -4.715*
Howard 79 233 25.3% 9995 1682 85.6% -6.605*
Kent 2 3 40.0% 373 155 70.6% -0.247
Montgomery 623 1840 25.3% 32194 5314 85.8% -21.028*
Prince George's 318 684 31.7% 12652 4957 71.8% -8.215*
Queen Anne's 2 22 8.3% 1443 360 80.0% -0.960
Somerset 15 3 83.3% 209 114 64.7% -0.129
St. Mary's 3 76 3.8% 3202 674 82.6% -2.131*
Talbot 16 12 57.1% 1052 266 79.8% -0.690
Washington 15 36 29.4% 2451 669 78.6% -1.622
Wicomico 12 19 38.7% 1395 426 76.6% -0.921
Worcester 25 25 50.0% 2022 706 74.1% -1.330
Maryland 1570 4278 26.8% 134458 31978 80.8%
* Refers to the difference of the mean approval rates is significantly different from zero at the 95 percent confidence level. Source: Federally Financed Institutions Council, Home Mortgage Disclosure Act, 2012; DHCD Office of Research
DHCD also examined lending by sex of applicant. Table 13 shows households who either received or were denied mortgage loans to purchase a home by sex of applicant and by county. The test of the differences between two means demonstrates that the Z-statistic was significantly different from zero, and hence the hypothesis (defined as no difference between the means by sex of applicant) can be rejected in eight Maryland jurisdictions. These jurisdictions include Anne Arundel, Baltimore, Baltimore City, Frederick, Harford, Howard, Kent, Montgomery, and Worchester Counties. As mentioned earlier in this section, it is not accurate to assess discrimination on the basis of sex, as other factors including credit scores, debt, and

44
collateral may have played a significant role in the acceptance or rejection of a loan application by financial institutions.
Table 13. Households Who Received or Were Denied a Mortgage Loan to Purchase a Home by Sex of Applicant By Sex, 2012
County
Male Female Z
Statistics
Number of Loans % Receiving Loan
Number of Loans % Receiving Loan Originated Denied Originated Denied
Allegany 121 18 87.1% 55 8 87.3% 0.313
Anne Arundel 1,832 211 89.7% 824 118 87.5% 4.779*
Baltimore 1,989 224 89.9% 953 123 88.6% 4.912*
Baltimore City 1,003 162 86.1% 532 105 83.5% 2.233*
Calvert 217 22 90.8% 74 9 89.2% 0.678
Caroline 51 22 69.9% 15 9 62.5% 0.171
Carroll 539 60 90.0% 209 24 89.7% 1.565
Cecil 231 55 80.8% 66 26 71.7% 0.782
Charles 250 42 85.6% 130 28 82.3% 0.569
Dorchester 66 31 68.0% 27 8 77.1% 0.185
Frederick 931 83 91.8% 361 53 87.2% 2.703*
Garrett 201 34 85.5% 42 6 87.5% 0.754
Harford 902 99 90.1% 330 38 89.7% 2.712*
Howard 1,627 147 91.7% 623 57 91.6% 4.760*
Kent 64 15 81.0% 27 5 84.4% 0.175
Montgomery 4,149 412 91.0% 1,937 217 89.9% 10.488*
Prince George's 884 247 78.2% 677 247 73.3% 0.981
Queen Anne's 209 26 88.9% 63 15 80.8% 0.692
Somerset 29 17 63.0% 9 16 36.0% 0.095
St. Mary's 238 23 91.2% 95 12 88.8% 0.678
Talbot 161 17 90.4% 55 12 82.1% 0.503
Washington 284 58 83.0% 117 21 84.8% 0.792
Wicomico 195 66 74.7% 80 35 69.6% 0.545
Worcester 751 121 86.1% 193 29 86.9% 2.646*
Maryland 16,924 2,212 88.4% 7,494 1,221 86.0%
* Refers to the difference of the mean approval rates is significantly different from zero at the 95% confidence level.
Source: Federally Financed Institutions Council, Home Mortgage Disclosure Act, 2012
Table 14 shows households who either received or were denied mortgage loans for refinancing a home and/or home improvements by sex of applicant and by county. The test of the differences between two means demonstrates that in seven Maryland jurisdictions the hypothesis (defined as no difference between the means of refinancing a home and/or home improvements by sex) can be rejected. In other words, the Z statistic indicated that there was statistically significant difference in refinancing loans and home improvement loans by sex of applicant in the following jurisdictions Anne Arundel, Baltimore, Carroll, Frederick, Harford, Howard and Montgomery counties.

45
Table 14. Households Who Received or Were Denied a Mortgage Loan to Refinance and/or for Home Improvements, by Sex of Applicant
County
Male Female Z
Statistics
Number of Loans % Receiving Loan
Number of Loans % Receiving Loan Originated Denied Originated Denied
Allegany 533 53 91.0% 181 18 91.0% 0.315
Anne Arundel 9,242 255 97.3% 3,619 106 97.2% 5.026*
Baltimore 9,002 216 97.7% 4,162 100 97.7% 4.326*
Baltimore City 2,701 57 97.9% 1,653 49 97.1% 0.937
Calvert 1,758 34 98.1% 613 16 97.5% 1.023
Caroline 272 8 97.1% 101 7 93.5% 0.153
Carroll 3,253 109 96.8% 966 48 95.3% 2.044 *
Cecil 1,395 41 97.1% 445 23 95.1% 0.849
Charles 1,811 32 98.3% 916 18 98.1% 0.800
Dorchester 287 5 98.3% 104 3 97.2% 0.164
Frederick 4,757 94 98.1% 1,708 39 97.8% 2.725*
Garrett 534 32 94.3% 118 4 96.7% 0.372
Harford 4,252 123 97.2% 1,465 31 97.9% 2.491*
Howard 7,098 146 98.0% 2,317 51 97.8% 4.273*
Kent 236 15 94.0% 92 7 92.9% 0.129
Montgomery 23,505 321 98.7% 9,360 134 98.6% 12.643*
Prince George's 5,551 85 98.5% 4,514 74 98.4% 0.927
Queen Anne's 983 29 97.1% 263 20 92.9% 0.644
Somerset 108 5 95.6% 58 5 92.1% 0.045
St. Mary's 1,679 44 97.4% 550 13 97.7% 1.009
Talbot 752 16 97.9% 243 8 96.8% 0.455
Washington 1,552 38 97.6% 524 14 97.4% 0.919
Wicomico 789 23 97.2% 315 12 96.3% 0.424
Worcester 1,620 32 98.1% 435 8 98.2% 1.059
Maryland 83,670 1,813 97.9% 34,722 808 97.7%
* Refers to the difference of the mean approval rates is significantly different from zero at the 95 percent confidence level.
Source: Federally Financed Institutions Council, Home Mortgage Disclosure Act, 2012

46
Foreclosures and Demographic Trends
DHCD also examined foreclosure data in Maryland using data from RealtyTrac. Foreclosures in Maryland are highly concentrated within “Hot Spot” communities like Prince George’s County. Baltimore City and Prince George’s County, two of Maryland’s majority minority jurisdictions, account for 25.5 percent of the state’s population and 35.1 percent of the state’s foreclosure events. A foreclosure Hot Spot is defined as a community that had more than ten foreclosure events in the current quarter and recorded a foreclosure concentration ratio of greater than 100. The concentration ratio, in turn, is measured by a foreclosure index. The index measures the extent to which a community’s foreclosure rate exceeds or falls short of the State average foreclosure rate. Foreclosures in Maryland are highly correlated with race, as noted in Table 15 below. The highest intensity of foreclosures impact minority communities – particularly African American populations.
Table 15. Property Foreclosures by Race/Ethnicity in Maryland: 2014 Q4
Category
Foreclosure Intensity
Moderate High Very High
Number of Households per Foreclosure (Avg) 170 77 47
Number of Foreclosures 3,930 7,320 1,924
Percent of Foreclosures 29.8% 55.6% 14.6%
Race/Ethnicity of the Communities
White 65.0% 43.2% 21.0%
Minority 35.0% 56.8% 79.0%
African American 15.6% 41.6% 71.8%
Hispanic 8.8% 9.2% 3.8%
Asian 8.2% 3.9% 1.6%
Other 3.9% 3.9% 1.6% Source: RealtyTrac, DHCD Office of Research Property Foreclosures in Maryland, Fourth Quarter 2014 ACS 2012 5YR EST- RACE AND ETHNICITY DATA AT ZIPCODE LEVEL
Raymond Skinner (Former Maryland Secretary of Housing and Community Development) indicated that the Department and the State of Maryland has been proactive in addressing communities and populations hardest hit by the foreclosure crisis, but data limitations currently prohibit some detailed analysis of mortgage lending activity, including HMDA analysis. The Former Secretary asked Congress to assist DHCD’s efforts, stating:
More information is needed about the lending practices in our communities. The Home Mortgage Disclosure Act (HMDA data) helps track bank loans by demographic, location, and amount, but it does not provide the other factors that contribute to the lending rate such as credit score and existing debt. Expanding data requirements is the key to strengthening the use of HMDA data as an enforcement mechanism of fair lending practices.

47
DHCD Office of Research conducts monthly and quarterly tracking of Maryland foreclosures. These analyses help to inform the Department’s decisions concerning the state of housing at both the state, county and community level. According to DHCD Property Foreclosures in Maryland Fourth Quarter 2014 report, property foreclosures increased to 13,959 events, up 20.0 percent over the previous quarter and up 9.6 percent above last year. The State’s overall foreclosure rate increased from 58.7 per 10,000 households in the previous quarter to 58.7 in the 2014 fourth quarter, moving the State’s national ranking from the 2nd highest in the third quarter to the 3rd highest in the current quarter. Maryland foreclosure concentration rate in the fourth quarter was 129.2 percent above the national average rate. Prince George’s County with 2,852 filings continued to have the largest number of foreclosures in Maryland, accounting for 20.4 percent of all foreclosure activity statewide. Baltimore City with 2,045 foreclosure filings (14.7 percent of the total) had the second highest number of foreclosures. Based on both the HMDA data and the foreclosure data, DHCD believes that discrimination in lending may exit. However, without complete data, it is hard to prove. As part of its efforts to overcome possible impediments to fair housing choice, DHCD will continue to lobby Congress and HUD to improve HMDA data so that discriminatory lending practices can be prosecuted when it exists.
DHCD Lending Practices
DHCD examined its own lending practices as well as the individuals’ benefiting from the Department’s programs. This included an examination of overall single family lending activities, and specific lending activity in the state’s non-entitlement areas compared to areas of low-income or minority concentration. DHCD also analyzed the beneficiaries of persons living in multifamily housing the Department financed. The beneficiaries of multi-family projects were the low-income households who live in projects financed with DHCD resources. The Department reviewed projects undertaken in the non-entitlement areas against areas of minority or low-income concentration. This was done for multi-family projects funded with HOME Investment Partnership (HOME) funds, federal Low-Income Housing Tax Credits (LIHTC) and Community Development Block Grant (CDBG) funding, as well as examining loans for the Multi-family portfolio.
DHCD Single Family Program Beneficiaries Review
DHCD conducted a review of the beneficiaries who reside in both its single family (homeownership) programs and rental housing programs. The beneficiaries for the single family programs were households that received mortgage financing from the Department toward the purchase of the owner’s home. The Community Development Administration Maryland Mortgage Program (MMP) provides low-interest mortgage loans to eligible low and moderate-income homebuyers through private lending institutions throughout the state. The program began in 1980 and is targeted primarily to first-time homebuyers. These resources are funded by tax exempt revenue bonds issued by the Department’s Community Development Administration (CDA). The mortgage payments are used to pay off bond issuance. DHCD single family housing makes provisions for affordable housing in designated areas throughout Maryland. In development of the State’s AI, DHCD examined MMP single family program data for fiscal years 2010 through 2015 (July 1, 2009 through June 30, 2014). The analysis focused on this two year period, in part, to show the Department’s lending practices in a period where housing and credit markets have declined
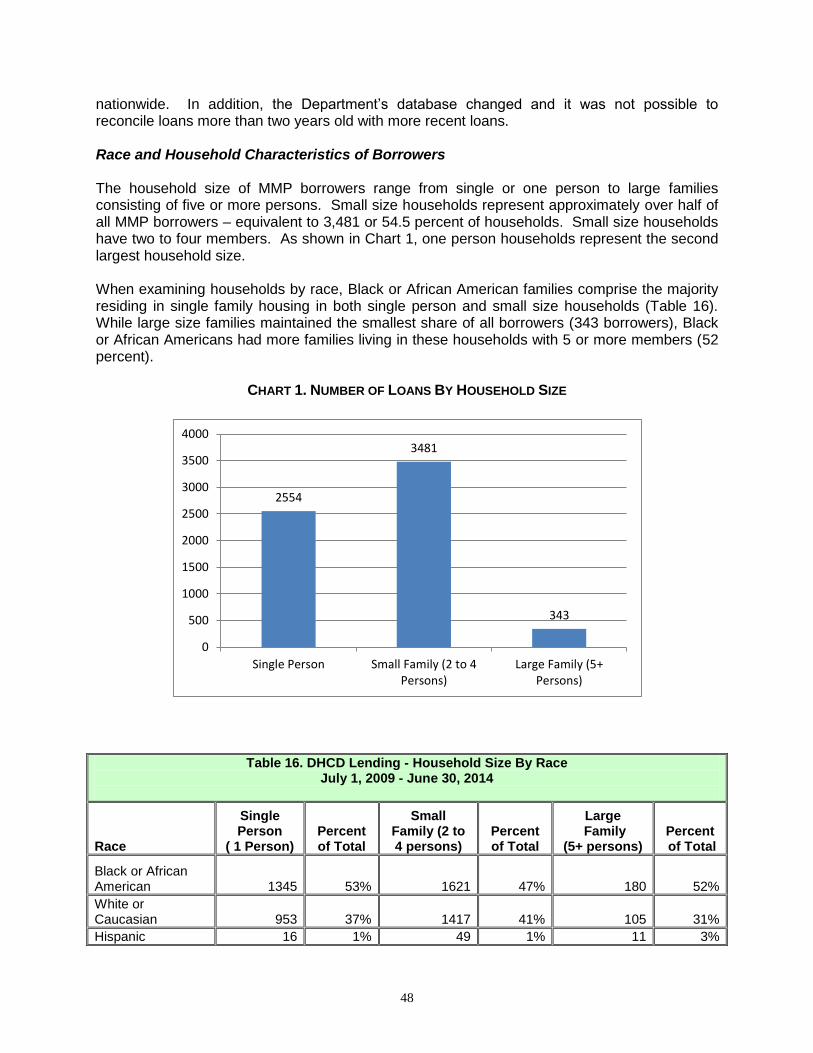
48
nationwide. In addition, the Department’s database changed and it was not possible to reconcile loans more than two years old with more recent loans. Race and Household Characteristics of Borrowers The household size of MMP borrowers range from single or one person to large families consisting of five or more persons. Small size households represent approximately over half of all MMP borrowers – equivalent to 3,481 or 54.5 percent of households. Small size households have two to four members. As shown in Chart 1, one person households represent the second largest household size. When examining households by race, Black or African American families comprise the majority residing in single family housing in both single person and small size households (Table 16). While large size families maintained the smallest share of all borrowers (343 borrowers), Black or African Americans had more families living in these households with 5 or more members (52 percent).
CHART 1. NUMBER OF LOANS BY HOUSEHOLD SIZE
2554
3481
343
0
500
1000
1500
2000
2500
3000
3500
4000
Single Person Small Family (2 to 4Persons)
Large Family (5+Persons)
Table 16. DHCD Lending - Household Size By Race July 1, 2009 - June 30, 2014
Race
Single Person
( 1 Person) Percent of Total
Small Family (2 to 4 persons)
Percent of Total
Large Family
(5+ persons) Percent of Total
Black or African American 1345 53% 1621 47% 180 52%
White or Caucasian 953 37% 1417 41% 105 31%
Hispanic 16 1% 49 1% 11 3%

49
Asian 23 1% 70 2% 18 5%
American Indian/Alaska Native Only 3 0% 6 0% 0 0%
Native Hawaiian Pl Only 5 0% 2 0% 1 0%
Two or More Races (any other combination)/Other 16 0% 18 0% 3 1%
No Race Data 192 8% 294 8% 22 6%
Total 2554 100% 3481 100% 343 100% Note: Two or more races combined includes: American Indian, American Native, and Black; American Indian, American Native, and White; Black and White; and Other Multiple Races.
As illustrated in Table 17, the predominant racial composition of MMP borrowers were Black or African American (49.0 percent) and White or Caucasian (39.0 percent). These two groups combined represented approximately 88 percent of all borrowers. Native Hawaiian only and American Indian/Alaska Native only represented the fewest number of borrowers and smallest racial group. When examining lending patterns by minority groups alone, slightly over half of all MMP loans (52 percent) were made to minority borrowers.
Table 17. DHCD Lending By Race July 1, 2009 - June 30, 2014
Race Number of Loans Percent of Total
Black or African American 3146 49.0%
White or Caucasian 2475 39.0%
Hispanic 76 1.0%
Asian 111 2.0%
American Indian/Alaska Native Only 9 0%
Native Hawaiian Pl Only 8 0%
Two or More Races (any other combination) 11 0%
No Race Data Reported 508 8.0%
Total 6378 100.0% Note: Two or more races combined includes: American Indian, American Native, and Black; American Indian, American Native, and White; Black and White; and Other Multiple Races.
Marital Status of Borrowers When examining borrower data by marital status and sex of primary borrower, a fairly equal share of loans were granted to both men and women (Table 18). The distribution represented 3,498 persons or 54.8 percent women, and 2,880 or 45.1 percent men as mortgage holders. Of the 6,378 total loans, unmarried persons outnumber all borrower types (4,338 borrowers) in both the male and female categories.

50
Table 18. Marital Status by Sex of Primary Borrower July 1, 2009, June 30, 2014
Marital Status, By Sex Number Percent of Total
Female Divorced 21 1.0%
Female Married 634 18.0%
Female Unmarried 2,760 79.0%
Female Separated 78 2.0%
Female Widowed 5 0%
Sub-Total 3,498 100.0%
Male Divorced 9 0%
Male Married 1,267 44.0%
Male Unmarried 1,578 55.0%
Male Separated 25 1.0%
Male Widowed 1 0.0%
Sub-Total 2,880 100.0%
All Divorced 30 0%
All Married 1,901 30.0%
All Unmarried 4,338 68.0%
All Separated 103 2.0%
All Widowed 6 0%
Total 6,378 100.0%
DHCD Multifamily Program Beneficiaries Review
DHCD contracts out the reporting of multifamily program beneficiaries of the LIHTC program with a private contractor (Spectrum). Spectrum follows reporting guidelines issued by HUD for the program. However, due to issues/gaps in data nationwide, HUD is revising the reporting requirements for the LIHTC program. Many subject areas still show large numbers of “unknown” for reporting purposes, which HUD is addressing with the contractors Housing Finance Agencies such as DHCD utilize to gather beneficiary data. For purposes of the AI, DHCD is using the most recent year data is available (CY 2012) from Spectrum as the “best available”. For CY 2012, Spectrum reviewed 33,837 Tax Credit units; of which data was available in some form for 32,340 of them (the other 461 units were most likely vacant).

51
Multi Family Tenants by Head of Household and Martial Status Spectrum reported that for the 32,340 units for which households were present, that 22,859 of them (70.68%) had Female headed households; and 9,481 (29.31%) had Male heads of households (numbers do not total 100 percent due to rounding). In terms of marital status, where data was available, most households were single, followed by widowed, married, divorced, separated, and then other status. The table below shows marital status of tenants in LIHTC units:
Marital Status of Tenants in LIHTC Projects (2012)
Status All
Where Known
Widowed
3,331 10.30%
3,331 16.40%
Divorced
1,521 4.70%
1,521 7.49%
Separated
567 1.75%
567 2.79%
Single
11,914 36.84%
11,914 58.64%
Unmarried
248 0.77%
248 1.22%
Unmarried Couple
46 0.14%
46 0.23%
Married
2,690 8.32%
2,690 13.24%
Not Reported
12,023 37.18%
TOTAL
32,340 100.00%
20,317 100.00%

52
LIHTC Multifamily Tenants by Race and Ethnicity Based on CY 2012 Data from Spectrum, about 55 percent of all households in DHCD financed rental housing projects were African American/Black, and about 29 percent were Caucasian/White, almost 10 percent of households did not report their race. About 4 percent of households were identified as “other”, which, based on the last AI, may include either Asian households (primarily from the Indian Sub-continent) who are not correctly identified as “Asian”, or it may include Hispanic households who identify as neither white nor black (nor any other race), but use Hispanic as a race (see ethnicity discussion below). The remaining households include households who identify as Asian, American Indian/Alaska Native, or Hawaiian/Pacific Islander.
LIHTC Multifamily Tenants by Race (2012)
Race All
Where Known
African American/Black 17,823 55.11% 17,823 61.18%
Caucasian/White 9,242 28.58% 9,242 31.72%
Hawaiian/Pacific Islander 86 0.27% 86 0.30%
American Indian/Alaskan Native 126 0.39% 126 0.43%
Asian 546 1.69% 546 1.87%
Other 1,309 4.05% 1,309 4.49%
Not Available 3,208 9.92%
Total 32,340 100.00% 29,132 100.00%
Spectrum also examined the ethnicity (Hispanic versus non-Hispanic) of households residing in LIHTC projects. For all tenants, just over 7 percent identify themselves as Hispanic. Hispanic can be of any race, but often Hispanic households identify as “other”, which may be reflected in the statistics in the table above (see the discussion on areas on minority concentration as well.) The table below shows data on Hispanic and non-Hispanic households residing in DHCD funded LIHTC projects in 2012:
MF LIHTC Households by Ethnicity (2012)
Ethnicity All
Where Known
Hispanic 2,280 7.05% 2,280 9.32%
Non-Hispanic 22,172 68.56% 22,172 90.68%
Unreported 7,888 24.39%
TOTAL 32,340 100.00% 24,452 100.00%

53
Multifamily Tenants by Disability Status Disability status of multifamily tenants was determined by a simple “yes” count. There was no option of replying “not disabled,” so only tenants who said they were disabled counted under the data provided by DHCD’s contractor. A total of 1,375 households were identified as having a disabled head of household, while the remaining households were either not disabled or chose not to respond.
Multi-family Tenants in HOME Funded Units DHCD also examined the beneficiaries of tenants specifically living in multi-family projects that received HOME funding. The Department financed a total of 161HOME Assisted Units in the past four fiscal years, all of which were located in the State’s non-entitlement areas. DHCD does not use HOME funding in entitlement areas since those jurisdictions receive their own HOME funding. Similar to the larger universe of households assisted in the multi-family portfolio, beneficiary data was not available for all households. Of the 161 units financed, 50 projects are under construction and will remain vacant through completion. Racial data is known for 114 of the 161 units. Of these assisted households, 64 or 56 percent were Caucasian/white households, thirty-nine or 39 percent were African American/black households, Asian and Native Hawaiian represented 2 households or 1 percent and 4 percent is unknown. This is somewhat different than DHCD’s portfolio as a whole, but the numbers are not surprising given the State’s allocation of HOME funds targeting rural areas. Rural communities tend to have a significantly lower minority population than some of the State’s urban jurisdictions, including several urban jurisdictions that are predominantly minority. Data was not available for head of household. However, of the 114 units, fifteen or about 48 percent of the households were elderly; the remaining 52 percent were family households. In terms of household size, forty-eight households or 42 percent of all households assisted were one person households, thirty-six or 31 percent were two person households, fifteen or 13 percent were three person households, and twelve or about 10 percent were four or more person households (NOTE: Numbers do not add up to 100 percent due to rounding).
Community Development Block Grant Housing Beneficiaries The Department utilizes the Community Development Block Grants (CDBG) to primarily invest in capital projects related to community development and infrastructure. Funds are also used for housing activities including the rehabilitation of single family owner occupied housing, connections of housing to water and sewer lines, or purchase of land that can be used for the development of affordable housing. The analysis included an examination of the Department’s CDBG housing related activities funded from July 1, 2010 through June 30, 2014. Like HOME, CDBG funds are only used in the State’s non-entitlement areas, as entitlement areas receive their own CDBG funding. During this period, DHCD funded a total of thirty-one housing related activities with CDBG funds which have assisted 1,023 households to date. This included eight rental projects which have or will result in 590 units. Of these, two projects were assisted specifically to preserve existing affordable rental housing, two projects improved existing developments and four projects were funded for new construction or renovations to create affordable units. Other projects financed during this timeframe included rehabilitation of owner occupied housing; connections to water and sewer service; foreclosure counseling; and construction of housing to be sold to eligible homebuyers.

54
Of the 1,023 households assisted to date, 479 or about 47 percent were Caucasian/white households, 501 or about 49 percent African American/black, 43 or 4 percent were households classified as “other”. Of these, 25 households identified themselves as Hispanic. In lieu of reporting marital status, HUD has CDBG grantees report on how many households assisted are female headed households. Based on information from our grantees, 313 households assisted were headed by single females. As required, the majority of persons assisted with CDBG housing funds were households of low and moderate income. Of the 1,023 households, 350 or about 34 percent of all households assisted had very low incomes, 331 or about 32 percent were low income households, 282 or about 28 percent had low to moderate incomes, and 60 or about 6 percent were above moderate income. Of the households assisted, 94 percent of them were of low and moderate income.
Section 8 Housing Choice Vouchers In addition to financing the construction of affordable rental housing, DHCD operates the Section 8 Housing Choice Voucher program in Allegany, Caroline, Dorchester, Frederick, Garrett, Kent, Somerset, Talbot, Wicomico and Worcester Counties. DHCD operates the program on a first-come, first served basis. Based on information as of September 30, 2014 over half of all assisted households were African American/Black 56 percent, 38 percent, were Caucasian/White and the remaining 6 percent were all other races. Thirty-eight percent of all households assisted included at least one family member with a disability. HUD does not collect information on households by marital status. Although the profile of families utilizing Housing Choice Vouchers varies somewhat from the profile of households in DHCD financed projects, the differences are not significant given distinctions in both service areas and scope of the programs. As noted above, DHCD financed portfolio includes all areas of the State, including urban entitlement jurisdictions that have “majority minority” status. The service areas for the Housing Choice Voucher program operated by the Department are predominantly rural and their populations have a larger percentage of Caucasian/white residents. As with Housing Choice Voucher holders, the difference in disability status is also not surprising. First, DHCD financed housing and the Housing Choice Voucher programs have different income targets. Most DHCD financing programs targets households earning 60 percent of median income or less, typically “workforce housing” where rents can serve lower income households and generate enough rent through underwriting to support debt service on the projects. Housing Choice Vouchers are targeted at households earning less than 30 percent of median income, which includes many disabled households who are unable to pay affordable rents without Section 8 assistance. DHCD needs minimum rent contributions of about $425 per month to meet basic maintenance and operating costs on units, assuming a unit has zero debt service. Most households with disabled persons can only afford about $175 per month, therefore cannot afford housing without additional assistance such as Section 8, which makes up the difference between what the household can pay and the rent.

55
Second, there is a difference in the disability status between households assisted in DHCD financed housing and the DHCD operated Housing Choice Voucher Program. DHCD has been very pro-active in moving persons with disabilities onto the Section 8 waiting list, resulting in disabled households receiving Section 8 assistance. This is accomplished through both the State’s Bridge Subsidy Program (which specifically helps persons with disabilities pay their rents as they wait for Section 8 assistance) and the federally funded Housing Opportunities for Persons with AIDS program (HOPWA) as well as the Section 8/11 Program. Lastly, all DHCD financed projects are required to take Section 8 in order to assist households at the lowest income levels. In fact, some DHCD voucher holders may be living in DHCD financed housing. DHCD gives bonus points in its Qualified Allocation Plan for providing housing for persons with disabilities, a policy the Department enacted about several years ago which has resulted in the financing of thousands of units targeted to persons with disabilities. As mentioned earlier, the Department has received national recognition for its efforts to assist persons with disabilities to obtain affordable housing and achieve fair housing choice.
De-concentration Bonus
When operating the Section 8 Housing Choice Voucher program, HUD provides additional, “bonus” vouchers to Public Housing Authorities (PHAs) that are highly successful in having tenants locate outside of areas of low-income concentration. In determining which PHAs receive bonus vouchers, a PHA must show that it has been successful in deconcentrating voucher holders in all of its eligible services areas. DHCD has successfully done this, and was awarded bonus Vouchers by HUD for successfully ensuring that voucher holders are not living in areas of low-income concentration.
Multifamily Loans by Area of Minority and Low-Income Concentration
As part of developing this AI, DHCD examined the multi-family projects it funded in areas of minority and low-income concentrations in the last five years. For FY 2014, DHCD undertook a total of eleven (11) projects in non-entitlement areas, two of which (Stewart’s Neck and Cannon Street/Satterfield) had HOME funding. Three of the eleven projects were located in an area of minority concentration. Two of these project were in areas of minority concentration due to institutional structures: Spring Valley in Saint Mary’s County was in an area of minority concentration due to the presence of the Patuxent River Naval Air Station, and Stewart’s Neck Apartments (which receive HOME funding) was in an area of minority concentration due to the presence of the University of Maryland Eastern Shore (UMES), a HUD funded historically black college/university. Both Spring Valley and Stewart’s Neck involved the acquisition and rehabilitation of existing projects. (Stewart’s Neck was actually a preservation project of existing low-income apartments as well). The third project, Leonard Apartments, involved the acquisition and rehabilitation of a property that is a USDA project for off-site farm labor. All three projects are also located in designated revitalization areas.

56
In terms of projects located in areas of low-income concentration, five of the 11 projects the State funded were in areas of low-income concentration. However, this was again due primarily to the presence of institutional structures. These five projects included the three acquisition/rehabilitation projects noted above (Spring Valley and Stewart’s Neck, low-income concentrations due to the presence of the Naval Air Station and the UMES, and Leonard apartments, which involved the rehabilitation of a project for USDA off-farm labor.) Of the other two projects in areas of low-income concentration, one was Seton Village, which is located in an area of low-income concentration due to the presence of the “mother house” of the Little Sisters of the Poor, a religious order of nuns who have taken a vow of poverty (the project actually involves converting part of the convent into affordable housing). The other project is Riverwoods at North East, which involved the new construction of affordable family housing. We don’t know why the low-income concentration exists for this census tract. There are no institutional structures that would cause this, the area may simply be economically distressed. We also note the area is not an area of minority concentration, in fact, the area is 87.2 percent white/Caucasian as per the U.S. Census/American Fact Finder (2014). Regardless, we would note all five projects in areas of low-income concentration are designated revitalization areas.

57
In FY 2013, Multi-family programs, DHCD undertook a total of four (4) projects in non-entitlement areas. As the maps on the following pages show, none of these projects were located in an area of either low-income or minority concentration:

58
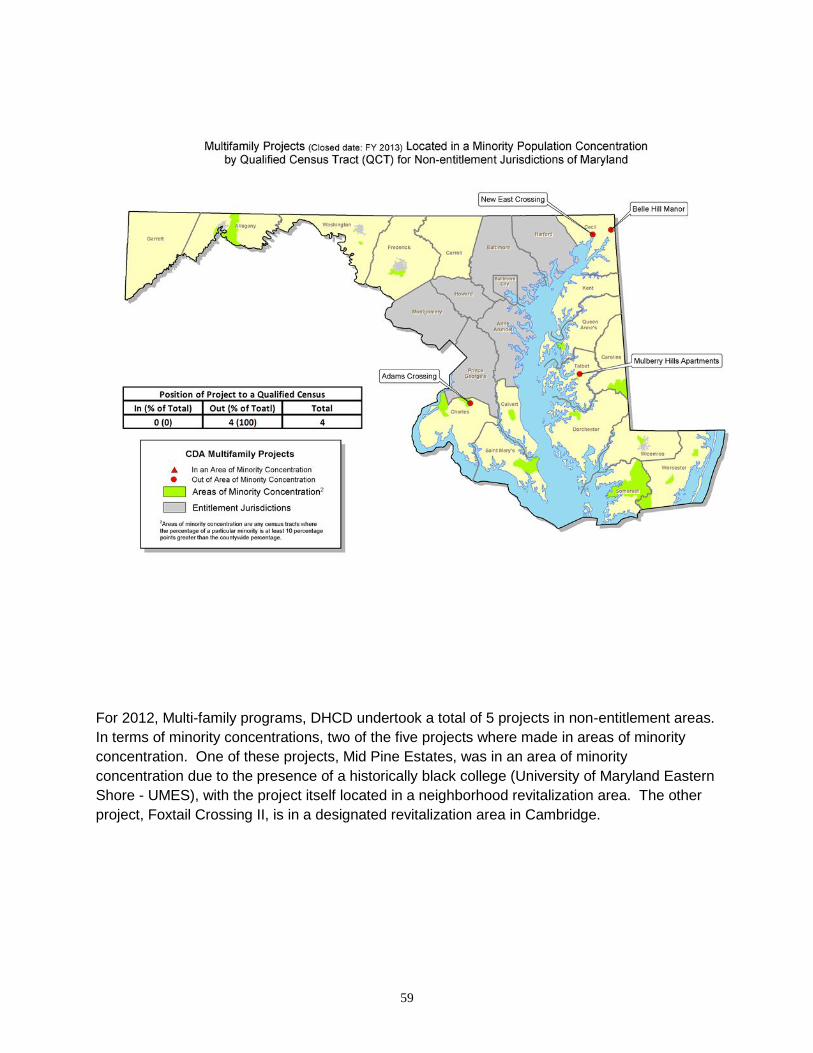
59
For 2012, Multi-family programs, DHCD undertook a total of 5 projects in non-entitlement areas.
In terms of minority concentrations, two of the five projects where made in areas of minority
concentration. One of these projects, Mid Pine Estates, was in an area of minority
concentration due to the presence of a historically black college (University of Maryland Eastern
Shore - UMES), with the project itself located in a neighborhood revitalization area. The other
project, Foxtail Crossing II, is in a designated revitalization area in Cambridge.

60
In terms of projects located in areas of low-income concentration, both Foxtail II and Mid Pine Estates are also in areas of low-income concentration. Again, Mid Pine was in an area of low-income concentration due to the students at the UMES, both projects are in designated revitalization areas.

61
In 2011, Multi-family programs made a total of 5 loans in non-entitlement areas. In terms of minority concentrations, three of the five loans were made in areas of minority concentration. In all cases, these concentrations where due to the presence of institutional structures – a prison work release facility in Calvert County where Silverwood Farm is located, and military facilities in Saint Mary’s County, where the Greenview and Indian Bridge projects are being undertaken. All three projects were located in designated revitalization areas, and all three projects were preservation projects. That is, they involved the acquisition and rehabilitation of existing properties which were preserved as affordable housing, so they did not change or impact concentrations in the areas where they are located.

62
In terms of projects located in areas of low-income concentration, two of the projects were located in these areas. This includes Elkton Senior which is located in a designated revitalization area, and the aforementioned Silverwood Farm which is impacted by the same work-release facility noted above.

63
In FY 2010, DHCD made a total of 14 loans in non-entitlement areas (which was high due to American Recovery and Reinvestment Act [ARRA] funding), In terms of minority concentrations, four of the 14 loans where made in areas of minority concentration. This included two projects in Saint Mary’s County – Indian Bridge and Victory Woods – which have a minority concentration due to a large military presence in the area (the military typically has a significantly larger minority population than the country as a whole, especially compared to the general population in rural areas). For the other two projects, Conifer Village is located in a designated revitalization area, while Somerset Commons is located in an area of minority concentration due to the presence of a historically black college, University of Maryland Eastern Shore (UMES).

64
In terms of projects located in areas of low-income concentration, six projects where located in these areas. This includes North Creek Run, Elkton Senior, Conifer Village, and Victory Woods, all of which are located in designated revitalization areas, as well as Somerset Commons which is impacted by the incomes of students at the historically black college mentioned previously. The other project is an area of low-income concentration is Braddock’s Green in Allegany County. It is unclear why this low-income concentration exists, but we note that it is not an area of minority concentration.

65
State Housing and Community Development Policies, Practices and Procedures
The State examined policies and procedures that had possible impacts on fair housing choice. This included reviews of individual departmental programs and overall State policies.
Performance on the State’s Previous Analysis of Impediments
In developing the State’s latest Analysis of Impediments study, advocacy groups requested that the State provide an assessment on what has been achieved and accomplished to address previously cited impediments in the previous AI. The previous AI summarized its findings in a matrix table describing proposed activities. The matrix, shown in Table 27 below, notes activities that should have been accomplished by either DHCD and/or other agencies such as the Maryland Commission on Civil Rights, Maryland Department of Disabilities, HUD, and private nonprofit organizations involved in fair housing. The State has generally been quite successful in carrying out the fair housing activities it had proposed in the earlier AI.

66
2010 Actions to Overcome Impediments
Action Problems Addressed Responsible
Partners Accomplishments
Fair Housing Education/Information
Undertake local fair housing outreach programs that emphasize race, ethnicity, & disability.
Lack of public awareness of fair housing rights & responsibilities
DHCD, HUD, MCHR, Statewide, with emphasis in Non-entitlement communities
These activities are continuous and ongoing, DHCD has undertaken numerous trainings over the past five years either singularly or in partnerships with other agencies and organizations such as HUD, the Maryland Commission on Civil Rights (formerly the Maryland Commission on Human Relations) and private non-profit partners.
Improve fair housing awareness and build on marketing efforts; specifically targeting residents, realtors, developers, landlords, lenders, insurers, management agents, etc.
Lack of public awareness of fair housing rights & responsibilities
DHCD, MCCR, HUD, MAR, MBA
Sponsor Fair Housing workshops and/or seminars.
Lack of public awareness of fair housing rights & responsibilities
DHCD, HUD, MCCR, NAACP, BNI
Initiate testing for racial discrimination in sales practices & lending; & geographic fair housing testing particularly in Dorchester & Wicomico Counties.
Identification of possible discrimination (see survey results) DHCD and/or MCCR
This effort is currently underway.
Train landlords on new reporting requirements related to fair housing as part of HERA legislation.
Lack of or incorrect data from landlords sometimes impacts the ability to assess fair housing opportunities HUD and DHCD
Awaiting new regulations and Technical Assistance from HUD. HUD has provided some guidelines, but this did not result in the data HUD actually wanted, so revisions are being made.
LEP Education/Technical Assistance
Encourage local LEP service provision with towns/municipalities, nonprofit organizations, etc.
Ensure information is available for persons of LEP.
Maryland Dept of Human Resources, HUD
This is an ongoing activity, especially with sub-grantees who receive funding under HUD programs.
Develop and Implement LEP marketing, outreach, and information.
Ensure persons of LEP have access to DHCD programs.
DHCD, Maryland Dept of Human Resources, HUD
This is an ongoing activity, the focus has been on Spanish with brochures, ads, and radio and television announcements.

67
2010 Actions to Overcome Impediments
Action Problems Addressed Responsible
Partners Accomplishments
Add an "En Espanol" link to DHCD's website; continue utilizing oral translator services; & Spanish language media.
Establish a single site of information for persons of LEP . DHCD
This activity was completed in 2013, with more than 200 pages on our website translated into Spanish.
Utilize State Translator Subscription Service for Persons with limited English speaking ability. This includes Spanish as well as Chinese, French, Korean, Russian, and Vietnamese, if possible
Provide information to persons of LEP, including for those whose primary language is not large enough as a group to translate documents under federal or State requirements.
DHCD, using State Contractor
This is an ongoing activity that DHCD continues to utilize.
Translate DHCD documents as required by federal and State LEP requirements
Ensure opportunities to persons of LEP DHCD This is done as needed.
Expand Housing Opportunities for Persons With Special Needs
Implement select strategies as outlined in the State Disabilities Plan
Lack of accessible and housing choices for individuals with disabilities. DHMH, DHCD, DHR,
This has been an on-going activity, with numerous efforts undertaken to assist households with disabilities, including modifying existing practices to provide housing for persons with disabilities by holding units open, utilizing Weinberg Foundation funding, and other efforts.
Increase rental subsidies
Expand housing opportunities to persons with Special Needs whose incomes are too low to afford low-income housing as they may have incomes below poverty levels
HUD, DHCD, DHMH, DHR
This has been done through multiple efforts. This includes the funding of the Bridge Subsidy program first by DHCD then by DHMH, as well as receiving assistance under the HUD 811 Demonstration in partnership with DHMH and MDoD. In addition, DHCD has received additional Section 8 Vouchers from HUD targeting various groups, including VASH Vouchers and NEDs

68
2010 Actions to Overcome Impediments
Action Problems Addressed Responsible
Partners Accomplishments
Vouchers.
Target additional rent subsidies to the highest priority target populations served by MHA & DDA.
Expand housing opportunities to persons with Special Needs whose incomes are too low to afford low-income housing as they may have incomes below poverty levels
HUD, DHCD, DHMH, DHR
This has been accomplished in partnership with HUD, DHMH and MDoD through the Section 811 Demonstration program and other efforts. In addition, the State operates the Bridge Subsidy Program which assists these households while they move up the Section 8 waiting list.
Reinforce planning & program efforts to increase affordable housing opportunities for people with disabilities.
Housing people with disabilities
DHCD, DHMH, MDoA, MDoD
This is an on-going activity, DHCD participates with the other agencies listed in periodic updates to the State Disabilities Plan, and takes action where appropriate, necessary.
Continue to operate DHCD programs that assist persons with Special Needs
Providing full range of housing opportunities to persons with special needs for all disability levels. DHCD
DHCD continues funding/operation of the Housing Opportunities for Individuals With Disabilities Program (homeownership), as well as the Group Home and SHOP programs, and continues to provide bonus point awards for projects which provide more units to households with special needs. The Department also provides tenant assistance with NEDS and VASH Vouchers, along with “standard” Vouchers as households become eligible for assistance, and operates the rental portion of the HOPWA program.
Access possible new sources of funding to assist persons with Special
Providing additional resources to serve Special Needs DHCD, DHMH, HUD
This has been accomplished by obtaining several grants

69
2010 Actions to Overcome Impediments
Action Problems Addressed Responsible
Partners Accomplishments
Needs Households from the Weinberg Foundation, as well as accessing the Section 811 demonstration program.
Data Collection
Advocate with Congress the improvement & expansion of HMDA data
Lack of Fair Housing data which could provide evidence of possible discrimination in lending DHCD
While both the DHCD Secretary and Deputy Secretary testified on this issue before Congress, these new standards have not been implemented/adopted by the Federal Government, in part due to political issues related to the new consumer protection agency created under Dodd-Frank.
Initiate testing for racial discrimination vs. the disabled in rental and/or sales practices in non-entitlement areas
In response to concerns from advocates concerning possible discrimination. DHCD, MCCR, BNI This is underway.
Facilitate opportunities for various forms of testing on discrimination in rental practices; in non-entitlement communities
In response to concerns from advocates concerning possible discrimination. MCCR, BNI This is underway.
Fair housing training for property managers of DHCD projects to identify demographic/program beneficiary information.
Addressing lack of understanding for data collection on beneficiary race and ethnicity on DHCD financed projects. DHCD
This is an on-going activity, DHCD and its partner agencies have conducted numerous trainings over the past five years.
Establish clear documentation that shows fair housing tracking and monitoring have been conducted and report status of review.
Lack of documentation and/or inconsistent reporting of fair housing standards. DHCD Ongoing Activity
Affordable Housing
Increase production of affordable housing.
Lack of affordable housing
DHCD, public and private partners
Ongoing activity using existing programs, DHCD has produced more than 8,000 rental units during the period covered by the

70
2010 Actions to Overcome Impediments
Action Problems Addressed Responsible
Partners Accomplishments
AI.
Access new resources for the production of affordable housing
Lack of affordable housing DHCD
This item was created in relation to the National Affordable Housing Trust Fund which was authorized but never funded. Consequently, no action has been taken.
Access competitive funding under existing HUD and other programs
Lack of affordable housing
DHCD, DHMH, PHAs, nonprofits, other eligible applicants as appropriate
DHCD has successfully accessed funding under programs such as the Section 811 Demonstration program, and also received funding under programs from DOE that has helped make housing more affordable.
Coordinate affordable housing with transportation, jobs
Lack of available affordable housing near transportation, jobs,
DHCD, MDOT, MDE, PHAs, local governments
This item was based on Sustainable Communities funding which the Department did not receive from HUD. DHCD did change the QAP to give bonus points to projects located near transportation and jobs.
Preservation of Existing Affordable Housing
Loss of affordable housing which exacerbates housing problems for lower income households
HUD, DHCD, local governments, private partners.
Utilize MacArthur Foundation Grant, State resources to preserve affordable rental housing. Also work with federal government as they develop new housing preservation programs.

71
Local Policies
Barriers to Affordable Housing Local zoning regulation and limited financial resources are two barriers which can prohibit the production of affordable housing. First, zoning is the primary system by which counties and municipalities maintain control over the pattern of land development within their borders. Zoning regulations allocate parcels of land to different classifications with certain uses being permitted, while others are proscribed. Zoning practices of counties and localities often have the intended or unintended effect of increasing housing costs, and effectively excluding prospective moderate-income households from locating affordable housing for purchase or rent. Second, a widely recognized, yet difficult to overcome barrier to affordable housing in Maryland is the lack of adequate financial resources. Although nationally recognized for its innovative and effective housing programs, DHCD still has insufficient resources to meet the need for affordable rental and homeownership housing. Like all states, the need for increased revenue for housing has to compete with other legitimate public priorities, such as education, transportation, health and welfare. The fair housing survey obtained input from representatives of local municipalities and towns on local land use and zoning in an effort to capture their perspectives and ascertain ways to address such barriers (see Affirmatively Furthering Fair Housing Survey Analysis). The survey requested feedback from participants on a series of questions concerning barriers to fair housing in land use and zoning. Key survey findings revealed the following:
Minor barriers were most prevalent in the limitations on density of housing, lack of adequate zoning for manufactured housing and restrictive covenants by builders, developers and/or homeowner association according to respondents.
The most highly rated responses were given to the question concerning whether or not minor barriers exist in land use and zoning. Respondents indicated most severe barrier to land use and zoning exists concerning limitations on housing for people with low income.
Local Zoning Zoning can be used as a positive tool in support of cost-effective and efficient design if housing affordability is considered as a part of a jurisdictions’ policy. The use of techniques such as programs for moderately priced dwelling units, zero lot line housing, mixed use zones, viable basic design and performance zoning can help to produce affordable housing. DHCD has established working relationships with local governments through the Department’s multifamily housing and neighborhood revitalization divisions for the purposes of ensuring that rehabilitation and/or construction projects remain consistent with effective land use and maintain optimal benefit the local residents. These practices are reinforced in the Department policies as noted in this report.

72
Conversely, the separation of residential from non-residential uses exacerbates traffic problems since most employees cannot walk to work. Moreover, upper-income residents may bid up the price or rent of housing units that are conveniently located near to places of employment therein forcing lower-income residents to live farther from their places of employment. The State's high priority on rebuilding healthy, diverse communities and eliminating sprawl development is intended to reverse this trend. Zoning regulations prescribing minimum lot sizes minimum setbacks, and other requirements may necessitate the need for larger lots, which drive up the cost of housing and making it less affordable. In addition, zoning is occasionally used to "zone out" manufactured housing, which is an important source of housing for many low- and moderate income-citizens. Zoning regulations also may prohibit the development of ancillary dwelling units, even if such units do not impose a significant cost on other community residents. The State of Maryland has been proactive in working with local government designating affordable housing.

73
CDBG projects
Fair Housing and Equal Opportunity (FHEO) laws are designed to protect individuals from discrimination on the basis of race, national origin, religion, color, sex, age, family/marital status and handicap. Maryland grantees and their CDBG contractors and subrecipients must comply with applicable FHEO provisions. DHCD staff must review grantee, contractor, and sub-recipient compliance in all aspects of CDBG administration and implementation to ensure:
1. All CDBG-funded activities are carried out in a manner that will not cause discriminatory effects;
2. Opportunities exist for equal opportunity in employment and contracting connected with the CDBG Program, and in access to services; and,
3. Affirmative action is taken to overcome the effects of past discriminatory actions
FHEO laws applicable to the CDBG Program are detailed below. By completing the Title I certification required for receipt of CDBG funds, the State of Maryland assumes a specific legislative mandate to enforce certain Federal provisions. Exhibit E of the Grant Agreement requires the grantee to comply with the applicable Federal civil rights laws and regulations. The relevant rules and regulations include:
Title VI of the Civil Rights of 1964 – provides that no person, on the grounds of race, color, or national origin, be denied the benefits of, be excluded from participation in, or be subjected to discrimination under any program or activity receiving Federal financial assistance.
Title VIII of the Civil Rights Act of 1968 (The Fair Housing Act) and Sections 104 and 106 of Title I of the Housing and Community Development Act of 1974, as amended – provides for fair housing and prohibits discrimination in the sale, financing or rental of housing, as well as related brokerage services. Grantees must also administer programs and activities relating to housing and urban development in a manner that affirmatively promotes fair housing and furthers the purposes of Title VIII.
Executive Order 11063, as amended by Executive Order 12259 – directs grantees to take action necessary to prevent discrimination in the sale, leasing, rental and other disposition of residential property and related facilities (including land to be developed for residential use) provided in whole or in part with Federal loans, grants, contributions and/or advances.
Section 504 of the Rehabilitation Act of 1973, as amended – provides that no qualified individual shall, solely by reason of his or her handicap, be excluded from program participation, including employment, be denied program benefits or be subjected to discrimination.
The Americans with Disabilities Act of 1990 – establishes provisions for assuring equality of opportunity, full participation, independent living and self-sufficiency of disabled persons relative to employment, benefits and services, accommodations, commercial facilities, and multi-family housing.

74
Section 109 of the Housing and Community Development Act of 1974, as amended – provides that no person, on the grounds of race, color, national origin, or sex, be denied the benefits of, be excluded from participation in, or be subjected to discrimination under any program or activity funded in whole or in part with community development funds made available under Title I of the Act.
Age Discrimination Act of 1975, as amended – provides that no person shall be excluded from participation, denied program benefits, or be subjected to discrimination under any program or activity funded in whole or in part with Federal assistance on the basis of age.
Section 3 of the Housing and Urban Development Act of 1968, as amended – provides that, to the maximum extent feasible, opportunities for training and employment be given to lower income persons residing in the project area and contracts be awarded to business concerns that are located in or owned in substantial part by persons residing in the project area.
Executive Order 11246 – prohibits discrimination on basis of race, color, sex, religion or national origin under Federally-assisted construction contracts in excess of $10,000. The contractor must also post this non-discriminatory policy in conspicuous places, in employment advertisements and in labor union collective bargaining agreements.
In addition to these Federal rules, Maryland has its own provisions regarding prohibition of discrimination:
Maryland Commission on Civil Rights (Article 20-702) – prohibits discrimination in State-assisted programs relative to employment, housing, contracting, general program policies and benefits.
THE REVIEW PROCESS
To facilitate its review of grantee compliance, DHCD defines the type of FHEO data and documentation to be maintained by the grantee in its record-keeping system. While the type of documentation may vary according to the nature of the CDBG activities being implemented, all grantees should compile and keep track of the following:
Population demographic data relating to race, ethnic group, sex, age, and head of household;
Employment data on affirmative action in equal opportunity;
Minority business participation;
Characteristics of program beneficiaries; and,
Actions taken to affirmatively further fair housing. The CDBG Grant Agreement between DHCD and the grantee specifies some of the records that must be maintained pertaining to documentation of compliance with Civil Rights

75
requirements. Further, the Grant Agreement requires that the following relevant documents must be available for review during project monitoring:
Affirmative Action Strategy Personnel Policies Section 3 Employment Plan
To review grantee compliance, DHCD staff review the grantee’s Affirmative Action Plan, Section 3 plan and other appropriate documentation (personnel policies, employment records, hiring patterns, etc.) that support the grantee’s efforts in these areas. Where data are inadequate, it may be necessary to interview project area residents as well as local minority, women’s and civil rights groups. It is also important to ensure that a grantee has advised contractors and subrecipients of their respective responsibilities and, where appropriate, FHEO posters are prominently displayed on the job site. The FHEO Monitoring and Compliance Review should also be linked to the Project Management/Record-keeping, Procurement, and Labor Standards Monitoring and Compliance reviews. For example, DHCD staff must also ensure that third party contracts (primarily contracts with a value over $10,000) contain appropriate FHEO provisions. Minutes of the pre-construction conference should provide evidence that FHEO compliance was discussed with the contractor. Moreover, DHCD staff shall review evidence that the grantee has monitored third party compliance with these provisions through on-site inspections, employee interviews, review of contracts, etc. IN-HOUSE REVIEW In preparation for the site review, DHCD staff should undertake a review of the grantee’s overall project to determine the following:
What is the nature of the grantee’s project and which FHEO laws are applicable?
Did the grantee hire new employees?
Who were the anticipated project beneficiaries?
Is a subrecipient responsible for implementing project activities?
Has the grantee awarded any third party contracts? ON-SITE REVIEW The CDBG Program monitoring should be conducted with the representative(s) of the grantee responsible for ensuring compliance with FHEO requirements. Typical activities that might be conducted as part of the on-site FHEO review include:
Spot check the grantee’s office to determine that equal employment opportunity and fair housing posters are on display.
Ask grantee to describe overall efforts to meet FHEO compliance requirements.
Review source documentation (contracts, etc.) in grantee files for evidence of grantee compliance or complaints not previously reported to DHCD staff.
Determine if the CDBG project area is consistent with the geographic area described in the CDBG application.
Review correspondence, prospective bidders’ lists, phone logs, copies of newspaper ads, etc., to determine grantee outreach efforts.

76
Review grantee employment records regarding composition of staff by sex, race, handicap status, national origin; review hiring, training, promotion and compensation data.
Review copies of grantee site inspection reports to determine the nature and scope of site reviews and the depth of grantee monitoring of third party contractors (file review, payroll review, etc.).
Review grantee CDBG contracts to determine percentage that meet Section 3 requirements, as well as the percentage of minority- and women-businesses.
Make site inspection of CDBG activities to determine grantee and third party contractor compliance with FHEO requirements.
HOME Investments Partnership Program
In accordance with 24CFR Part 92, Subpart H, 92.351, Affirmative Marketing; Minority Outreach Program, each participating jurisdiction in the HOME Program is required to adopt marketing procedures for affirmatively marketing rental and homebuyer projects containing five or more HOME-assisted housing units. The DHCD requires owners to take actions to provide information and attract eligible persons in the market area to the available housing without regard to race, color, sex, national origin, religion, familial status or disability. This document is provided to all sponsors of multifamily rental projects following the reservation of HOME funds by the Department as well as to the sponsors’ development team at Kick Off Meeting coordinated by DHCD following a funding reservation. The document is also available on the DHCD website as part of the Submission Packages described below. Affirmative Marketing Plan Following the Kick Off Meeting, sponsors of multifamily rental projects which have a reservation of HOME funds are required to submit one of the following Submission Packages prior to DHCD providing a commitment of HOME funds or proceeding to Initial Closing on a HOME loan: 1) Viability/Design Development Review Submission Package; or 2) Combined Viability/Commitment Submission Package. The Affirmative Marketing Plan form must be completed as part of the applicable Submission Package. In addition, the package must include the Management Agents’ Work Experience and Marketing Plan. The DHCD HOME Program Manager will review and provide comments to the Affirmative Marketing Plan within 30 days of receipt. Deficiencies in the Affirmative Marketing Plan will be noted and must be corrected prior to Initial Closing of the project’s HOME loan. The Affirmative Marketing Plan should include at least the following elements: 1. Methods for informing the public and potential tenants/owners about federal Fair Housing laws and affirmative marketing policies by:
a. Visiting tenants/owners in buildings selected for rehabilitation (if applicable) and
posting signs regarding the Program in each building project. The HUD Equal Housing Opportunity logo must appear on all postings;
b. Using the Equal Housing Opportunity logo or slogan in press releases and other written communications used in the marketing of all units;

77
c. Displaying fair housing posters in the sales/rental office or other places where it can be seen by potential tenants/residents.
2. Procedures to inform the public about vacant units or upcoming housing opportunities using such resources as:
a. Advertising in the commercial media; b. Placing flyers in the local unemployment center, offices of the local
housing authority, offices of any other local housing counseling agencies and other agencies serving low-income persons;
c. Notifying applicants on the local housing authority's waiting lists about upcoming vacancies.
3. Special outreach procedures to inform and solicit applications from persons otherwise not likely to apply for the housing such as:
a. Announcements in general circulation newspapers and/or ethnic, neighborhood, community, or school newspapers;
b. Posters publicizing the housing placed in grocery stores, job center sites, community centers, schools, etc;
c. Announcements and supportive outreach assistance provided by organizations such as social service agencies, housing counseling agencies, fair housing groups or religious organizations;
d. Use of community organizations run by minorities or those who primarily serve minorities, minority churches, etc.
Technical Assistance At Initial Closing, the obligation to comply with Affirmative Marketing Plan and other HOME requirements is incorporated into the “HOME Regulatory Agreement, Declaration of Covenants and Deed of Trust”. As noted above, a Kick-Off Meeting is held and attended by members of the project development team, the management company and pertinent DHCD staff - including the HOME Program Manager when HOME funds are used. During such meetings, DHCD emphasizes the HOME requirements including the affirmative marketing obligations. At the point where construction has reached the substantial completion stage and before actual lease-up begins, a Pre-Occupancy Meeting is scheduled and coordinated by DHCD’s Division of Credit Assurance. Owners are again reminded of the Affirmative Marketing Plan and the obligation to maintain records to document compliance. Recordkeeping and Monitoring Project sponsors must keep records for the duration of the HOME period of affordability with regard to:
a. The racial, ethnic, and gender characteristics of: (1) Tenants/owners occupying units before rehabilitation; (2) All tenants/owners-occupying units following completion.
b. Activities they undertake to inform the general renter public, specifically: (1) Copies of advertisements placed in the news media; (2) Dates on which the owner contacted other agencies;

78
(3) Dates on which the owner contacted the local housing authority; c. Activities recipients’ undertake for special outreach; and d. All applicants for tenancy.
Asset Management staff from DHCD’s Division of Credit Assurance will complete on-site compliance reviews during the period of project occupancy. As part of that review, the Asset Manager will determine whether the Affirmative Marketing Plan is present, record the goals in the plan and help capture the data on the initial occupants in the project. For each project, the owners will periodically be asked to provide an assessment of their own progress to the DHCD HOME Administrator based on the goals set in the plan. The DHCD HOME Program then makes an overall assessment of affirmative marketing plans to determine if good faith efforts have been made and to determine the results of the efforts overall. DHCD may require corrective actions if it is found that sponsors fail to carry out the required procedures. Corrective actions may include, but are not limited to, withholding unallocated funds, requiring the return of unexpended funds, requiring the repayment of expended funds or requiring the return of program income. If, after discussing ways to improve procedures, the project owners or program contractors continue to fail to meet the affirmative marketing requirements, DHCD may also consider disqualifying them from future participation in the HOME Program.
Section 8
The Section 8 Program was enacted as part of the Housing and Community Development Act of 1974, which recodified the U.S. Housing Act of 1937. The Act and its requirements have been amended from time to time, as they apply to the Section 8 Tenant-Based Assistance Program. The Act and requirements are described in and implemented throughout the State’s Administrative Plan.
The Section 8 Rental Assistance Programs are federally funded and administered by the Maryland Department of Housing and Community Development (MD DHCD) as the Public Housing Authority (PHA) through the Eastern Shore Regional Section 8 Program housing office and the Section 8 offices of the subcontractors. The Eastern Shore Regional Section 8 Program and the Section 8 subcontractors are identified as the Local Housing Agencies (LHAs) throughout the Administrative Plan.
Administration of the Section 8 Program, the functions, and the responsibilities of the PHA is required to be in compliance with all applicable personnel policies, the Department of Housing and Urban Development’s (HUD) Section 8 Regulations, and in conjunction with all Federal, State and local Fair Housing laws and regulations. The PHA for purposes of the Section 8 program is the State, which works with LHAs in carrying out the requirements of the Section 8 program.
A. HOUSING AUTHORITY MISSION STATEMENT
The mission of the PHA, administered by the LHA, is to promote adequate and affordable housing, economic opportunity and a suitable living environment free from discrimination.
B. LOCAL GOALS [24 CFR 982.1]

79
The following goals of the PHA are in conjunction with the strategic goals of HUD.
HUD Strategic Goal: Increase the availability of decent, safe and affordable housing.
Our goal is to expand the supply of assisted housing. To accomplish our goal of expanding the supply of assisted housing, we will:
1. Apply for additional rental vouchers.
2. Leverage private or other public funds to create additional housing opportunities.
Our goal is to improve the quality of assisted housing. To accomplish our goal of improving the quality of assisted housing, we will:
1. Improve voucher management, using the Section 8 Management Assessment Program (SEMAP) scores.
2. Increase customer satisfaction.
Our goal is to increase assisted housing choices. To accomplish our goal of increasing assisted housing choices, we will:
1. Provide voucher mobility counseling.
2. Conduct outreach efforts to potential voucher landlords.
HUD Strategic Goal: promote self-sufficiency and asset development of families and individuals.
Our goal is to promote self-sufficiency and asset development of assisted households. To accomplish our goal of promoting self-sufficiency and asset development, we will:
1. Provide or attract supportive services to improve assistance recipients’ employability.
HUD Strategic Goal: ensure Equal Opportunity in Housing for all Americans.
Our goal is to ensure equal opportunity and affirmatively further fair housing. To accomplish our goal of ensuring Equal Opportunity and affirmatively furthering fair housing, we will:
1. Undertake affirmative measures to ensure access to assisted housing regardless of race, color, religion national origin, sex, familial status, and disability.
2. Undertake affirmative measures to ensure accessible housing to persons with all varieties of disabilities regardless of unit size required.
C. PURPOSE OF THE PLAN [24 CFR 982.54]
The purpose of the Administrative Plan is to establish policies for the LHAs to implement the programs in a manner consistent with HUD requirements, local goals and objectives contained in the Administrative Plan. Housing Voucher Contracts and Over Fair Market Rent Tenancy

80
Contracts will remain in effect until the family’s second re-examination after the merger date or when a new lease is executed, whichever comes first.
The PHA, and each LHA, is responsible for complying with all changes in HUD regulations pertaining to these programs. If such changes conflict with this Plan, HUD regulations will have precedence. The original Plan and any changes and the pertinent sections included in the Agency Plan will be distributed to each LHA and a copy will be provided to HUD.
Applicable regulations include:
1. 24 CFR Part 5: General Program Requirements
2. 24 CFR Part 8: Nondiscrimination
3. 24 CFR Part 982: Section 8 Tenant-Based Assistance
D. RULES AND REGULATIONS [24 CFR 982.52]
This Administrative Plan is set forth to define the PHA, through the LHAs, local policies for operation of the housing programs in the context of Federal laws and Regulations. All issues related to Section 8 are governed by such Federal regulations, HUD Memos, Notices and guidelines or other applicable laws.
E. TERMINOLOGY
The following terms are used frequently within this Administrative Plan:
The Maryland Department of Housing and Community Development is referred to as PHA or Public Housing Authority throughout this document.
The Maryland Department of Housing and Community Development (MD DHCD) subcontracts administration of Section 8 duties to local entities. These entities are the Local Housing Agencies inclusive of the Maryland DHCD Eastern Shore Regional Program and are referred to as the LHAs within this plan.
The term Family is used interchangeably with Applicant or Participant. Family may also refer to a single person.
Tenant refers to as a participant in terms of the relationship to landlord or project owner.
Landlord and owner are used interchangeably within this plan.
Disability is used in place of the term handicap.
Non-Citizens Rule refers to the regulation restricting assistance to U.S. citizens and eligible immigrants. This regulation was effective June 19, 1995.
The Voucher Choice Program refers to the merged program effective as of 8/12/99.
HQS refers to the Housing Quality Standards required by regulations and is enhanced by the PHA.

81
Failure to Provide refers to all requirements in the first Family Obligation as described in Chapter 15 of this Plan.
F. FAIR HOUSING POLICY [24 CFR 982.54(d)(6)]
It is the policy of the PHA and the LHA to comply fully with all Federal, State and local nondiscrimination laws and with the rules and regulations governing Fair Housing and Equal Opportunity in housing and employment.
The LHA shall not deny any family or individual the equal opportunity to apply for or receive assistance under the Section 8 Programs on the basis of race, color, sex, religion, creed, national or ethnic origin, age, familial or marital status, disability or sexual orientation.
To further the commitment of full compliance with applicable Civil Rights laws, the LHA will provide Federal/State/local information regarding unlawful discrimination and any recourse available to families who believe they are victims of a discriminatory act. Such information will be made available during the family briefing session. All applicable Fair Housing Information and Discrimination Complaint Forms will be included in the briefing packet and will be available upon request.
All PHA and LHA staff will be required to attend Fair Housing training that stresses the importance of affirmatively providing fair housing and equal opportunities to all families, including making reasonable accommodations to persons with disabilities, as a part of the overall commitment to quality customer service. In addition to this training, staff will attend update training sponsored by HUD and other local organizations to remain current with new developments.
Fair Housing posters are posted throughout the PHA and LHA offices, including all lobbies and interview rooms. The equal opportunity logo will be used on all outreach materials.
Individuals with disabilities shall not be denied the benefits of, be excluded from participation in, or otherwise be subjected to discrimination because the facilities of the PHA/LHA are inaccessible to or unusable by persons with disabilities. Any exceptions are those identified in 24 CFR 8.21 (c)(1), 8.24 (a), 8.25 and 8.31. Display posters and housing information are displayed in locations throughout the PHA and LHA offices in such a manner that they are easily readable from a wheelchair.
The MD Department of Housing and Community Development office and LHA offices are accessible to persons with disabilities. The MD Department of Housing and Community Development office is also accessible to hearing impaired individuals by telephone through the Maryland Relay Service at (800) 375-2258.
REASONABLE ACCOMMODATIONS POLICY FOR SECTION 8 HOUSING [24 CFR 700.245(c)(3)]
It is the policy of both DHCD as a PHA and LHA, to be service-oriented in the administration of our housing programs and to demonstrate a high level of professionalism while providing housing services to families in compliance with the Section 8 regulation [24.CFR 700.245 (c)(3)].

82
A participant with a disability may ask for a specific change to a policy or practice as an accommodation of the disability. The PHA’s policies and practices, as administered by the LHAs, will be designed to provide persons with disabilities reasonable accommodations, upon request, so that they may fully access and utilize the housing program and related services.
The option to request an accommodation will be made public by including notices on LHA forms and letters. This policy is intended to provide persons with disabilities an equal opportunity to obtain the same result, to gain the same benefit, or to reach the same level of achievement as individuals without disabilities. This policy is applicable to all situations described in this Administrative Plan. Such situations include a family initiating contact with the LHA; the LHA initially contacting a family at the time of application; or the LHA scheduling appointments of any kind.
To be eligible to request a reasonable accommodation, the individual must certify (if apparent) or verify (if not apparent) that he or she is a person with a disability as defined by the Americans with Disabilities Act (ADA). The ADA definition includes:
A physical or mental impairment that substantially limits one or more of the major life activities of an individual;
A record of such impairment; or
Being regarded as having such impairment.
Rehabilitated drug users and alcoholics are also covered under the Americans with Disabilities Act; however, a current drug user is not covered. In accordance with section 5.403(a), individuals are not considered disabled for eligibility purposes solely on the basis of any drug or alcohol dependence. Individuals whose drug or alcohol addiction is a material factor to their disability are excluded from the definition. Individuals are considered disabled if disabling mental and physical limitations persist if drug or alcohol abuse discontinued.
Once a persons’ qualified disability status is confirmed, the LHA will require that a competent, professional third party make an assessment. This professional must provide written verification that the individual needs specific accommodations due to a disability and the change is required for that person to have equal access to the housing program.
If the LHA finds that the requested accommodation creates an undue administrative or financial burden, the LHA will deny the request or present an alternate accommodation to meet the needs of the person. An undue administrative burden is one that requires a fundamental alteration of the essential functions of the LHA, such as waiving a family obligation. An undue financial burden is one that poses a severe financial hardship on the LHA to implement the requested accommodation.
The LHA will provide a written decision to the person requesting the accommodation within 14 calendar days of receipt of the request. If a person is denied the accommodation or feels that the alternative accommodation is inadequate, he or she may request an informal hearing with the LHA to review the decision.
Reasonable accommodation will be made for a person with a disability that requires an advocate or accessible offices. A designee will be allowed to provide information on behalf of the person, but only with the permission of the person with the disability.

83
All LHA mailings will be made available in an accessible format upon request, as a reasonable accommodation.
Verification of Disability
The LHA will verify disabilities as outlined in the definitions of the Fair Housing Amendments Act of 1988, Section 504 of the 1973 Rehabilitation Act, and the Americans with Disabilities Act.
Applying for Admission
All persons who wish to apply for any of the PHA’s programs must submit a written pre-application, as directed in the public notice of the LHA. Applications will be made available in an accessible format for a person with a disability, upon request.
To provide specific accommodation as requested, to persons with disabilities, the information may be mailed to the applicant, also in an accessible format.
The full application is to be completed in the applicant’s own handwriting, at an eligibility appointment. A person may request assistance of accommodation if he or she has a special need due to a disability. The LHA staff will interview applicants and will review the completed application. Verification of disability, as previously described, will be requested at the time of the interview. The application includes specific questions as to whether reasonable accommodations for the applicant are necessary.
H. TRANSLATION OF DOCUMENTS
In determining whether it is feasible to provide translation of documents written in English into other languages, the LHA will consider if resources through local organizations are available to provide translation services to non-English speaking families.
The Department of Housing and Community Development completed a four factor analysis as a part if the Language Access Plan (LAP). The PHA is required to provide access to “vital documents” which include all application, or information materials, notices and complaint forms offered by the program. The Department has ready access to language interpreters through contractual services, volunteer organizations or identified local government employees. As previously mentioned, DHCD has a LEP plan to assist in providing required access to vital documents. The plan is as follows:
DHCD utilizes translation services through the Department of Budget and Management’s (DBM) contracts with Language Line and Ad Astra, Inc. and Schreiber ( for written translation services) . DHCD utilizes both contactors on an as needed basis.
Bilingual staff- DHCD has a list of in-house bilingual staff interpreters. There are eight
(8) languages that are covered by DHCD bilingual staff. For the majority of these staff
members English is their second language.

84
DHCD has translated vital programs into Spanish on our website in keeping with HUD requirement to increase LEP access for programs where individuals could apply directly for assistance.
The department is currently developing a system to track numbers data on LEP clients using our services.
Additionally, DHCD has identified two LEP Coordinators to address all LEP issues and coordinate DHCD’s LEP plan
I. MANAGEMENT ASSESSMENT OBJECTIVES (Revised 01/2002)
The PHA operates the Housing Assistance Program with efficiency. The PHA can demonstrate to HUD auditors that the LHAs are using its resources in a manner that reflects its commitment to quality and service. Our policies and practices are consistent with the areas of measurement for the following HUD Section 8 Management Assessment Program (SEMAP) indicators:
Selection from the Waiting List
Reasonable Rent
Determination of Adjusted Income
Utility Allowance Schedule
Housing Quality Standards -- Quality Control Inspections
Housing Quality Standards Enforcement
Expanding Housing Opportunities
Fair Market Rent -- Exception Rent & Payment Standards
Annual Re-examinations
Correct Tenant Rent Calculations
Pre-Contract Housing Quality Standards Inspections
Annual Housing Quality Standards Inspections
Lease-Ups
Family Self-Sufficiency Enrollment and Escrow Account Balances
Bonus Indicator Deconcentration
The PHA will perform annual compliance reviews of each LHA. The review will involve selecting a sample of files and records in an unbiased manner, according to the following schedule:
Minimum Number of Files (per LHA) to be Sampled:
50 or less 5
51 – 600 5, plus 1 for each increment of 50 (or part of 50) over 50
601 – 2000 16, plus 1 for each increment of 100 (or part of 100)
Over 2000 30, plus 1 for each increment of 200 (or part of 200) over 2000

85
A file monitoring worksheet will be completed for each file reviewed. The worksheet includes a review of all indicators recognized by SEMAP. Upon completion of the file reviews the results will be summarized on the rating worksheet and a score will be calculated to determine the LHA rating.
The file monitoring and SEMAP Rating Worksheets are located under Attachment II of the Administrative Plan.
Scoring and performance ratings for each LHA will mirror the HUD guidelines used in SEMAP, as follows:
High Performer Overall score 90% or more
Standard Performer Overall score 60 – 89%
Troubled Performer Overall score less than 60%
At the end of each annual compliance review, a discussion will be held with the LHA to review any errors found and the overall performance. A written report will be prepared and sent to the LHA requiring corrective actions on the individual errors identified in the report. The LHA must respond to the PHA within 30 days of receipt of the annual compliance review report.
If an LHA is rated as troubled, it will be required to develop and submit an action plan for improvement with its response to the review report. The LHA will also be scheduled for a six-month follow-up review, as opposed to its regularly scheduled annual review, to determine if it has adhered to its action plan and if performance has improved.
J. RECORDS FOR MONITORING PHA PERFORMANCE (Revised 01/2002)
To demonstrate compliance with HUD and other pertinent regulations, the PHA and LHAs will maintain records, reports and other documentation for a specific time period. The time period established is in accordance with HUD requirements and allows an auditor, housing professional or other interested party to follow, monitor and/or assess operational procedures objectively, accurately, and in accordance with SEMAP requirements regarding internal supervisory audits.
LHA supervisory staff will perform monthly internal quality control audits in accordance with the following guidelines:
100% of the files for all new admissions
Minimum of 25% of the files for all re-examinations
Minimum of 100% of the files for all claims processed
The LHA Monthly Supervisory Audit Form will be completed upon the review of each participant file and maintained in the LHA office. A copy of the form(s) can be found under Attachment II. During the PHA’s annual monitoring visit, this form will be reviewed to determine if the LHA is complying with the requirement to conduct supervisory audits. Should the LHA experience problems with the audit requirement, the LHA will be required to submit the form to the PHA on a monthly basis.
K. PRIVACY RIGHTS [24 CFR 982.551]

86
Applicants and participants, including all adults in the households, are required to sign the HUD 9886 Authorization for Release of Information. This document incorporates the Federal Privacy Act Statement and describes the conditions under which HUD/PHA/LHA will release family information to third parties. The PHA’s policy regarding the release of information is for the LHA to do so in accordance with State and local laws, which may restrict the release of family information.
Any and all information regarding the nature or severity of a person's disability must be kept in a separate folder and marked Confidential or it is to be returned to the family member after use. The personal information in this folder must not be released except on an as needed basis, such as cases under consideration for an accommodation. The LHA Section 8 Administrator must approve all requests for access to the information in any confidential folder.
The PHA practices and procedures are administered by the LHA in a manner that safeguards the privacy of applicants and program participants. All applicant and participant files will be stored in a secure location. In addition, the LHA staff will not discuss family information contained in any files, except on an as needed basis for business reasons.
L. FAMILY OUTREACH [24 CFR 982.153(b)(1)]
The LHA will publicize information regarding the availability of housing assistance and related services for very low-income families on a regular basis. For example, when the LHA's waiting list is open, the LHA will publicize the nature of housing assistance and availability for very low-income families in a general-circulation newspaper, minority media, and by other suitable means of publicity.
For those who cannot read, the LHA will distribute fact sheets to and initiate personal contacts with the broadcasting media as well as community service personnel. The LHA will also utilize public service announcements.
The LHA will communicate the status of housing availability to other service providers in the community, and advise them of housing eligibility factors and guidelines. They in turn can make proper referrals for housing assistance.
M. OWNER OUTREACH [24 CFR 982.54(d)(5), 982.153(b)(1)]
The LHA makes a concerted effort to keep private owners informed of legislative changes in the tenant-based program, which are designed to make the program more attractive to owners. This effort includes informing owners of applicable legislative changes in program requirements. The LHA encourage owners of decent, safe and sanitary housing units to lease to Section 8 families.
In addition to informing owners of legislative changes, the LHA may conduct periodic meetings with participating owners. These meetings provide an opportunity for the LHA to improve owner relations and to recruit new owners to participate in the tenant-based program. For their respective jurisdictions, the LHA offices will:
Maintain a list of interested local landlords through MDHousing search
Maintain a list of units available for the Section 8 Program.
Maintain lists of available housing submitted by owners in all neighborhoods within the LHA’s jurisdiction to ensure greater mobility and housing choice to very low-income

87
households. The lists of owners/units will be provided at briefings and will be available upon request.
Initiate personal contact with private property owners and managers by conducting formal and informal discussions and meetings.
Offer printed material to acquaint owners and managers with the opportunities available under the program.
Actively participate in community-based organizations comprised of private property and apartment owners and managers.
Actively recruit property owners with property located outside areas of minority and poverty concentration.
Apply for exception payment standards if the PHA or LHA determines it is necessary to make the program more accessible in the LHA's jurisdiction.
Encourage program participation by owners of units located outside areas of poverty or minority concentration.
Periodically evaluate the demographic distribution of assisted families to identify areas within the jurisdiction where owner outreach should be targeted.
The purpose of these activities is to provide more choice and better housing opportunities to families. Interested families and voucher holders are informed of a broad range of areas where they may lease units within the LHA's jurisdiction. They are also given a list of landlords or other parties who are willing to lease units or help families who desire to live outside areas of poverty or minority concentration.
The LHA periodically will also:
Request the HUD Field Office to furnish a list of HUD-held properties available for rent.
Develop working relationships with owners and real estate broker associations.
Establish contact with civic, charitable or neighborhood organizations which have an interest in housing for low-income families and public agencies concerned with obtaining housing for displaced families.
Explain the program, including equal opportunity requirements and nondiscrimination requirements, Fair Housing Amendments Act of 1988 and the Americans with Disabilities Act to real estate agents, landlords, and other groups that have dealings with low-income families or are interested in housing such families.
State Rental Housing Programs
In addition to federal fair housing requirements for the HOME program, DHCD also requires affirmative marketing of projects that use only State funding and/or receive Federal Low-Income Housing Tax Credits. These requirements are specified in the Multifamily Rental Financing Program Guide and include
eliminate local residency preferences;
ensure access to leasing offices for persons with disabilities;
provide flexible application and office hours to permit working families and individuals to
apply; and
encourage credit references and testing that take into account the needs of persons with
disabilities or special needs.

88
In addition, project sponsors are required to certify fair housing activities as set forth below regarding EEO, Civil Rights, and Drug and Alcohol Free Workplace requirements: Recipients of State funding or LIHTC agree to the following as a condition of receiving funding:
A. Title VI of the Civil Rights Act of 1964 (the "Act"), as amended, to the end that, in accordance with Title VI of the Act, no person in the United States shall, on the ground of race, color, or national origin be excluded from participation in, be denied the benefits of, or be otherwise subjected to discrimination under any program or activity for which the Applicant-Recipient receives financial or technical assistance from the Department of Housing and Community Development of the State of Maryland. B. Title VII of the Civil Rights Act of 1964, as amended, to the end that, in accordance with Title VII of that Act, it shall be an unlawful employment practice for an employer: 1. to fail or refuse to hire or to discharge any individual, or otherwise discriminate against any individual with respect to his compensation, terms, conditions, or privileges of employment, because of such individual's race, color, religion, sex or national origin; 2. to limit, segregate, or classify his employees or applicants for employment in any way which would deprive or tend to deprive any individual of employment opportunities or otherwise adversely affect his status as an employee because of such individual's race, color, religion, sex, or national origin. C. Title VIII of the Civil Rights Act of 1968, as amended, to the end that, it is the policy of the United States to provide, within constitutional limitations, for fair housing throughout the United States. D. The Fair Housing Amendments Act of 1988, as amended (the "Fair Housing Amendments Act"), to the end that it shall be unlawful to discriminate against any person in the terms of rental of a dwelling because of familial status except with respect to "housing for older persons" (as defined in the Fair Housing Amendments Act). E. Article 20-702 of the Annotated Code of Maryland, as amended, which establishes the Maryland Commission on Civil Rights and prohibits discrimination in residential housing practices. F. State of Maryland Executive Order 01.01.1989.18 relating to drug and alcohol free workplaces for non-State entities, promulgated November 28, 1989. G. The Secretary's Policy Statement on Equal Opportunity, to the end that, the Department shall not knowingly approve grants of financial or technical assistance to recipients who are engaged in discriminatory employment practices. H. The Secretary's Minority Business Enterprise Program which establishes a program to provide opportunities for minority contractors and vendors to participate in Department Programs; and the minority business enterprise plan submitted by or on behalf of Applicant-Recipient as approved by the Department's Equal Opportunity Officer, provided, however, that this Paragraph H shall not apply in the event that a statement is attached hereto from the Applicant-Recipient's equal opportunity officer stating that the general contractor is in compliance with local minority business participation programs or objectives.

89
I. The Department of Housing and Community Development’s Relocation Policy where applicable J. All other related applicable Federal and State laws, regulations and rules. VIABILITY DESIGN DEVELOPMENT REVIEW
DHCD has established a project review process that ensures, among other things, that all major state and federally funded projects are consistent with federal fair housing compliance. The review requires completion of an Affirmative Marketing (AM) Plan that includes elements to attract prospective buyers or tenants of all minority and non-minority groups in the housing market area regardless of their race, color, national origin, disability, familial status, religion, or sex. The AM Plan must also demonstrate that the project will not provide any local residency preferences and will:
ensure access to leasing offices for persons with disabilities;
provide flexible application and office hours to permit working families and individuals to
apply; and
encourage credit references and testing that take into account the needs of persons with
disabilities or special needs.
Upon selection and approval of housing development projects, the Maryland Department of Housing and Community Development requires additional financial and construction information from chosen developers for a “viability and commitment review.” This Design Development Review provides a comprehensive outline of information to be submitted by developers after projects are selected for a reservation of funds, including submission of a Marketing and Management Plan for all multifamily rental housing projects receiving state loan financing. The State’s viability and commitment review of the materials submitted by the developers includes the evaluation of the reasonableness of proposed operating expenses, rent-up schedule and marketing costs. Affirmative Marketing Plan
Each applicant is required to carry out an affirmative program to attract prospective buyers or tenants of all minority and non-minority groups in the housing market area regardless of their race, color, national origin, disability, familial status, religion, or sex. These protected groups in the housing market area who may be subject to housing discrimination include: White, Black or African American, Hispanic or Latino, Asian, persons with disabilities, families with children, or -- American Indian or Alaska Native, Native Hawaiian or Other Pacific Islander-- where applicable by census data. The applicant shall describe in the AM Plan the proposed activities to be carried out during advance marketing, where applicable, and the initial sales and rent-up period. The affirmative marketing program also should ensure that any group(s) of persons ordinarily not likely to apply for this housing without special outreach, know about the housing, feel welcome to apply and have the opportunity to rent. Applicant and Project Identification. The applicant may obtain census tract location information from local planning agencies, public libraries and other sources of census data.
Type of Affirmative Marketing Plan. Applicants for multifamily housing projects should check both the Project Plan and indicate the status of the AM Plan, e.g. new or update. All Project Plans should indicate the racial composition of the housing market area in which the housing

90
will be (is) located by checking one of the three choices. Direction of Marketing Activity. Indicate which group(s) the applicant believes are least likely to apply for this housing without special outreach. Consider factors such as price or rental of housing, sponsorship of housing, racial/ethnic characteristics of housing market area in which housing will be (is) located, disability or familial status of eligible population, public transportation routes, etc.
Marketing Program. The applicant shall describe the marketing program to be used to attract all segments of the eligible population, especially those groups designated in Part 3 of this AM Plan as least likely to apply. The applicant shall state: the type of media to be used, the names of newspaper/call letters of radio or TV stations; the identity of the circulation or audience of the media identified in the AM Plan (e.g., White, Black or African American, American Indian or Alaska Native, Asian, Native Hawaiian or Other Pacific Islander, Hispanic or Latino, persons with disabilities, and families with children) and the size or duration of newspaper advertising or length and frequency of broadcast advertising. Community contacts include individuals or organizations that are well known in the housing market area or the locality, that can influence persons within groups considered least likely to apply. Such contacts may include, but need not be limited to: neighborhood, minority and women’s organizations, grass root faith-based or other community based organizations, labor unions, employers, public and private agencies, disability advocates, schools and individuals who are connected with these organizations and/or are well-known in the community.
Methods for informing the public and potential tenants/owners about federal Fair Housing laws and affirmative marketing policies could include:
a. Visiting tenants/owners in buildings selected for rehabilitation (if applicable) and posting signs regarding the Program in each building project. The HUD Equal Housing Opportunity logo must appear on all postings;
b. Using the Equal Housing Opportunity logo or slogan in press releases and other written communications used in the marketing of all units;
c. Displaying fair housing posters in the sales/rental office or other places where it can be seen by potential tenants/residents.
Procedures to inform the public about vacant units or upcoming housing opportunities could include using such resources as:
a. Advertising in the commercial media; b. Placing flyers in the local unemployment center, offices of the local housing
authority, offices of any other local housing counseling agencies and other agencies serving low-income persons;
c. Notifying applicants on the local housing authority's waiting lists about upcoming vacancies;.
a. ensure access to leasing offices for persons with disabilities; and
b. provide flexible application and office hours to permit working families and individuals to
apply.
Review and Update. The applicant assumes full responsibility for the AM Plans implementation and required reviews and updates. DHCD and/or HUD may monitor the implementation of this AM Plan at
91
any time and request modification in its format or content, where deemed necessary. Project sponsors must keep records for the duration of the HOME period of affordability with regard to:
a. The racial, ethnic, and gender characteristics of:
(1) Tenants/owners occupying units before rehabilitation; (2) All tenants/owners-occupying units following completion.
b. Activities they undertake to inform the general renter public, specifically: (1) Copies of advertisements placed in the news media; (2) Dates on which the owner contacted other agencies; (3) Dates on which the owner contacted the local housing authority;
c. Activities recipients undertake for special outreach; and d. All applicants for tenancy.
ASSURANCE OF COMPLIANCE
DHCD Assurance of Compliance requires that Rental Housing Programs comply with numerous laws or statutes related to fair treatment; namely, Equal Employment Opportunity (EEO), Civil Rights, and Drug and Alcohol Free workplace requirements. These laws include:
Title VI of the Civil Rights Act of 1964
Title VII of the Civil Rights Act of 1964
Title VIII of the Civil Rights Act of 1968
The Fair Housing Amendments Act of 1988
Article 49B of the Annotated Code of Maryland
The State of Maryland Executive Order 01.01.1989.18
The Secretary of DHCD Policy Statement on Equal Opportunity
The Secretary of DHCD Minority Business Enterprise Program
The Community Development Administration’s Relocation Policy
All other related applicable Federal and State laws, regulations and rules Title VI of the Civil Rights Act of 1964. Compliance requirements ensure that no person in the United States shall, on the grounds of race, color, or national origin be excluded from participation in, be denied the benefits of, or be otherwise subjected to discrimination under any program or activity for which the Applicant-Recipient receives financial or technical assistance from DHCD. MARYLAND CODES ADMINISTRATION The Codes Administration within the Maryland Department of Housing and Community Development complies with the Fair Housing Amendments Act of 1988. The Amendments prohibits discriminatory housing practices based on disability and familiar status. As a protected class, people with disabilities are unique in at least one respect because they are the only minority that can be discriminated against solely by the design of the built environment. The Fair Housing Act remedies that in part by establishing design and construction requirements for multifamily housing built for the first occupancy after March 13, 1991. The final Fair Housing
92
Accessibility Guidelines were published on March 6, 1991. Maryland Accessibility Code adopted the design and construction requirements of the Fair Housing Act and the Guidelines. There is no change from HUD except HUD recognized six other safe harbors for compliance with the Fair Housing Act's design and construction requirements. Maryland Accessibility Code complies with the Guidelines and recognizes the safe harbors but makes no policy changes to the Maryland Accessibility Code since February 1995. As a recipient of Community Development Block Grant funds, DHCD complies with federal regulation to provide for and encourage citizen participation, particularly by low and moderate income persons, to issue complaints and grievances to the Department. All grievances or complaints are reviewed and shall receive a written response within fifteen working days. ASSET MANAGEMENT REVIEW Asset Management Officers conduct Administrative reviews of projects typically once a year. Fair Housing is one of the elements of this monitoring. Depending upon the performance of a project and the loan program(s) used to finance it,
periodic management and physical reviews are conducted by DHCD’s asset managers. One
focus of the management review is the project’s compliance with the requirements of its
Affirmative Fair Housing Marketing (AFHM) Plan. The AFHM Plan is a marketing strategy
developed to attract tenants from all groups, regardless of gender, disability, race, ethnicity,
familial status, etc. The Plan outlines the requirements related to advertising, community
outreach and other marketing initiatives designed to inform potential tenants of the existence of
the units.
The AFMH Plan is developed during underwriting in accordance with HUD’s guidelines. It can
be amended, with DHCD’s approval, as necessary to improve a property’s Fair Housing
performance. The Plan requires project management to maintain a file of invoices documenting
advertising efforts and copies of postings, letters and other evidence of outreach to local
governments, social service agencies, etc. These records must demonstrate consistency and
full compliance with the AFMH Plan. The project’s asset manager will also verify the posting of
required Fair Housing signage and the availability of Fair Housing information.
Specific complaints about Fair Housing are handled as they are received. According to the DHCD Director of Multifamily Asset Management, although official complaints are extremely rare they are typically dealt with in collaboration with the appropriate agency charged with addressing fair housing issues. Only one or two fair housing matters have been raised in the past five years and none in the past year. The concerns never reached the level of official complaints, but were resolved by informal mediation.
Reasonable Accommodations Policy
As with Section 8 programs noted earlier in the AI, compliance to the reasonable accommodation policy is service-oriented and demonstrates a high level of professionalism

93
while providing housing services to families. DHCD multifamily rental housing programs follow similar practices. Accommodations for Individuals with Physical Disabilities All projects funded pursuant to the Multifamily Rental Financing Program Guide and the QAP must ensure that individuals with physical disabilities have priority for occupancy of any units qualified under the Uniform Federal Accessibility Standards (UFAS). To ensure that persons with disabilities who require the features of a UFAS unit receive priority for UFAS qualified housing, when a UFAS unit becomes available, it must be offered first to a prospective tenant whose disabilities require such a unit even if other applicants who do not require accessible units have higher placement on the general waiting list. Additionally, when renting UFAS units to households that do not require an accessible unit, owners are encouraged to include provisions in the lease that require the household to move to another comparable unit within the project in order to make the UFAS unit available for a household that requires such a unit. Additionally, all non-elderly projects funded pursuant to the Maryland Qualified Allocation Plan and Guide must reserve at least five percent of proposed units for households at or below 60% AMI and headed by a non-elderly person with disabilities (PWD). Projects that exceed this requirements may qualify to receive incentive points. Projects that provide integrated independent housing opportunities for individuals with disabilities receive an additional qualified allocation point (QAP) allocation totaling five maximum points, targeting especially those living on Supplemental Security Income (SSI) or Supplemental Security Disability Income (SSDI). Some exceptions apply, including transitional housing or other facilities with limits on the term of occupancy or leases by tenants; in addition to properties that are not subject to the Department’s RHF, Tax Credit or MBP use or occupancy restrictions.
To receive points, the units must be made available only to individuals with disabilities and held for individuals with disabilities including SSI/SSDI recipients until the prescribed percentage of resident individuals with disabilities is achieved but no longer than 60 days beyond 80 percent of initial occupancy for new construction projects. Points will be awarded to occupied rehabilitation projects that will market and hold units for individuals with disabilities including those who are income-qualified or SSI/SSDI recipients upon turnover for at least 60 days after vacancy. Points will be awarded based on the percentage of total units within the project whether or not rent- or income-restricted targeted to individuals with disabilities, including those at SSI/SSDI income levels, according to Table 28.
Table 28. Percent of Units for Individuals with Disabilities
10% or more of the proposed units 5 points
8-9% of the units 4 points
6-7% of the units 3 points
4-5% of the units 2 points
1-3% of the units 1 point
Less than 1% of the units 0 points

94
To receive points, an application should include a letter from or a memorandum of understanding or other agreement with an entity that will assist the applicant in marketing the units to individuals with disabilities or special needs. The sponsor also must include with the application a marketing plan for meeting its targeting commitments.
DHCD will award points for projects that set aside up to 25% of units in a project for PWD or other targeted populations. To qualify as a targeted population set-aside unit, the housing unit must be permanent housing and Income and rent restricted at no more than 50% of the area median income. Points will be awarded as follows:
Points Set aside for targeted population
6 15% to <25%*
5 13% to <15%
4 12% to <13%
3 10% to <12%
2 8% to <10%
1 6% to <8%
Projects with more than 25% of the units for a targeted population will receive zero
points in this category
Applicants seeking points under this section for PWD must agree to provide notice of unit availability to and accept tenant referrals from DHMH and MDOD. Units that receive points under this category must be reserved exclusively for the target population. If a project is unable to fill a unit with the targeted population after a ninety (90) calendar day referral period, the unit may be leased to another household with income at 50% AMI or below. The next available 50% AMI unit in the Project shall be marketed to the Project’s original targeted population until the project is in compliance with percentage for which it received points. The ninety (90) calendar day period at lease-up will be measured from the date upon which the project achieves 80% occupancy and at turnover will be measured from the date upon which the unit is determined ready for occupancy following move-out by the prior tenants and completion of any unit turn cleaning, repairs, or maintenance.
Transit-Oriented Development
DHCD seeks opportunities to integrate affordable housing in Maryland’s transit areas. Two existing initiatives demonstrate activities focused on creating a nexus between housing and transportation: 1) QAPs for Transit-Oriented Development and 2) Sustainable Communities Act.

95
DHCD issues points to eligible applicants who demonstrate sustainable development, including energy conservation for all projects requesting financing. As noted in the 2014 Multifamily Rental Financing Program Guide (which covers the State's application procedures for multifamily rental housing throughout Maryland) DHCD awards 8 points to a project that is part of a MDOT-designated TOD. in addition 4 ports may be awarded to a property where any part of which is located within one-half mile of the passenger boarding and alighting location of: (a) a planned or existing transit rail stop or station , or (b) a transit note that brings at least two bus lines or other forms of transit (excluding cars) together.
MARYLAND COMMISSION ON CIVIL RIGHTS
The Maryland Commission on Civil Rights (MCCR) is the State’s Fair Housing enforcement agency, and is the lead agency for fair housing efforts in Maryland. To assist in preparing the AI, DHCD utilized MCCR web-based reports posted for public record regarding fair housing issues. In the MCCR 2013 annual report data was examined to identify patterns of housing complaints based on protected class characteristics. As illustrated in Table 29 below, when examined by region, non-entitlement areas had fewer housing complaints over the past three years from 20011 to 20013, than do entitlement areas. Non-entitlement communities which represent 70.8 percent of all Maryland jurisdictions corresponded 31.3 percent of total housing complaints statewide. Jurisdictions located in the Western region (Allegany, Frederick, Garrett and Washington Counties) combined reflected the highest rates of housing complaints among all non-entitlement communities during this time period (33). Frederick (26) and Allegany Counties (4) reflected the highest number of complaint cases in Western Maryland. Additionally, the Eastern region had the second highest number of housing complaints during the same period (27), and represented the largest territory of non-entitlement communities. Table 30 shows housing complaints that MCCR received between in a three year period between 2013 and 2011. The MCCR Annual reports 2011-2013 do not contain data on the distribution of housing complaints by age. MCCR’s efforts to address these complaints are undertaken on an ongoing basis. The complaints may be addressed through mediation, legal action, or dismissed if the complaints are not found to be valid. MCCR does not release information on complaints in order to protect the privacy of parties the parties involved, except when cases move to court.
TABLE 29. DISTRIBUTION OF HOUSING COMPLAINTS, BY REGION
Jurisdiction 2013 2012 2011 Total
West
Allegany 1 2 1 4
Frederick 18 7 1 26
Garrett 0 0 1 1
Washington 0 1 1 2
Central
Anne Arundel 3 7 4 14

96
TABLE 29. DISTRIBUTION OF HOUSING COMPLAINTS, BY REGION
Jurisdiction 2013 2012 2011 Total
Baltimore City 8 10 5 23
Baltimore 11 10 10 31
Carroll 0 1 0 1
Harford 1 4 2 7
Howard 5 5 1 11
Montgomery 10 11 16 37
Prince George's 10 5 9 24
Southern
Calvert 0 0 0 0
Charles 2 1 3 6
St. Mary's 0 0 0 0
Eastern
Caroline 0 0 0 0
Cecil 2 0 3 5
Dorchester 15 0 0 15
Kent 1 0 0 1
Queen Anne's 1 0 2 3
Somerset 1 0 0 1
Talbot 0 0 0 0
Wicomico 0 1 0 1
Worcester 0 0 1 1
Total 89 65 60 214 Note: Shaded areas represent non-entitlement jurisdictions
Source: Maryland Commission on Human Relations, 2011, 2012, 2013 Annual Reports.
Source: Maryland Commission on Human Relations, 2011, 2012, 2013 Annual Reports. Note: According to MCHR, cases may be filed on more than one basis; therefore totals may exceed number of charges received.
State Disabilities Plan 2009
The Maryland Department of Disabilities advances the rights and interests of people with disabilities so they may fully participate in their communities. DHCD is part of the Department of Disabilities Policy team to address issues related to people with disabilities.
Table 30. Distribution of Housing Complaints by Cause
Race Sex Sexual
Orientation Age Disability Religion National Origin
Familial Status
Marital Status Color Total
FY2013 17 4 0 n/a 39 3 7 2 0 0 72
FY2012 22 7 0 n/a 42 3 3 13 0 1 91
FY2011 36 4 0 n/a 40 3 2 10 0 0 95
Total 75 15 0 n/a 121 9 12 25 0 1 258

97
In fulfilling the commitment to providing housing options for people with disabilities DHCD has met the following accomplishments:
Supported successful legislation to permit local tax credits for homeowners that install accessible features in a home (HB 54).
Supported successful legislation to modify DHCD Rental Assistance Program for individuals with disabilities to streamline the existing requirements (HB 231).
Widely distributed the Maryland Housing Modification Resource Guide to individuals with disabilities who need to modify their homes for accessibility.
Widely distributed a Guide for Homeownership for individuals with disabilities that promote the creative use of all available affordable housing programs to expand homeownership.
In 2013, the DHCD received $10.9 million from the U.S. Department of Housing and Urban Development (HUD) through HUD's Section 811 Project Rental Assistance Demonstration Program (PRA Demo). The PRA Demo program provides rental assistance to extremely low-income persons with disabilities, many of whom are transitioning out of institutional settings or are at high risk of homelessness. The $10.9 million received from HUD provided five years of rental assistance for 150 units that served non-elderly persons with disabilities with incomes at or below 30 percent Area Median Income who receives Medicaid services t. In March of 2015 HUD announced DHCD would receive 9.8 million in additional funds 811 funds to continue to support extremely low-income persons with disabilities. The PRA Demo funds are administered by DHCD in partnership with the Maryland Department of Disabilities (MDOD) and the Maryland Department of Health and Mental Hygiene (DHMH).

98
Homeownership Opportunities
DHCD operates programs that both assist persons with disabilities purchase homes, or allows persons with disabilities to make modifications to homes they already own. The Homeownership for Individuals with Disabilities Program provides affordable loans (2.25 to 4.25 percent) to households where either one of the borrowers or a son or daughter (regardless of age; who resides with one of the borrowers and is cared for principally by one of the borrowers) is disabled or one of the borrowers is a guardian for an immediate family member who is disabled (regardless of age; who resides with one of the borrowers and is cared for principally by one of the borrowers). This includes a physical or mental impairment that substantially limits one or more major life activities (for example, hearing, seeing, speaking, sitting, standing, walking, concentrating, or performing manual tasks).
The Maryland Department of Housing and Community Development (DHCD), in partnership with the Maryland Department of Aging (MDoA), continue to promote accessibility related improvements to the homes of seniors. These improvements include, among others, the installation of grab bars and railings, widening of doorways and installation of ramps. Home improvements such as these represent for many older people the key to remaining in their home and maintaining their independence.
The program provides grants or zero percent interest, deferred loans for a term of up to 30 years to finance accessibility improvements. The program is funded by DHCD under the Maryland Housing Rehabilitation Program (MHRP) and is administered by Special Loan Programs. The program is marketed through the local Area Agencies on Aging.
Affordable and Available Housing Units
As illustrated in Table 31 below, the DHCD estimates that from 2006 -2010 Maryland faces a shortage in units of affordable and available housing for renter households in the 30%, 50% and 80% area median incomes. According to the 2006-2010 CHAS data for every 100 Maryland renters at thirty percent of area median income there are only 38 units of affordable housing available to them. This results in a shortage of 62 units per 100 renter households. Of the 98,297 shortage in the 30% AMI 17,610 fall within non-entitlement jurisdictions. The number of affordable and available housing units per 100 renter household for the 50% AMI is estimated at 67 and at 97 for 80% AMI. Of the 92,446 shortage of affordable and available units in the 50% AMI threshold 11,978 fall within non-entitlement jurisdictions. Finally, of the 11,191 shortage of affordable and available units in the 80% AMI threshold 1,264 units fall within non-entitlement jurisdictions. It is noteworthy to mention that in each category in some jurisdictions there is a surplus of units at the three income thresholds.

99
Table 31. Net Shortage of Affordable and Available
Rental Housing in Maryland, 2006 – 2010
Shortage by Income Threshold
Counties 30% AMI 50% AMI 80% AMI
Allegany 1,313 141 -292
Anne Arundel 4,414 7,667 4,566
Baltimore 15,748 18,257 1,658
Baltimore City 24,069 14,301 -5,461
Calvert 795 875 342
Caroline 418 258 -37
Carroll 1,631 1,453 -124
Cecil 1,617 1,203 -109
Charles 1,084 861 470
Dorchester 797 332 -53
Frederick 2,352 2,095 366
Garrett 161 -287 -472
Harford 2,299 1,987 -678
Howard 2,631 4,061 2,554
Kent 175 -45 -344
Montgomery 15,744 23,551 15,388
Prince George's 16,526 14,648 1,355
Queen Anne's 195 146 86
Somerset 515 92 -252
St. Mary's 1,437 757 -219
Talbot 355 377 -24
Washington 2,669 1,492 -978
Wicomico 2,096 1,897 -183
Worcester -744 -3,672 -6,368
Maryland 98,297 92,446 11,191 Source: DHCD, Office of Research
AFFIRMATIVELY FURTHERING FAIR HOUSING SURVEY
To enhance understanding of community concerns regarding fair housing choice, DHCD administered a fair housing survey designed to gauge fair housing issues, practices, and strategies in communities throughout Maryland. The questionnaire solicited feedback from a diverse group of representatives involved in housing efforts in Maryland. The participating agencies provided their perspectives on the extent to which barriers exist in communities they serve. A total of 1,000 individuals from various agencies were solicited regarding fair housing issues, and 102 responses to the survey were received. Survey participants were asked to respond to 17 questions, using Survey Monkey, an online survey software system that captured

100
and tabulated responses. The questionnaire is divided into three sections: (1) Background, (2) Discrimination in your community, and (3) Fair Housing Solutions.
BACKGROUND
Section One provides background on the agencies and individuals participating in the survey. The purpose is to learn about the respondents, their profession in the housing industry, ascertain their geographic location and service areas, as well as gain a perspective on any incidents of housing discrimination in their communities. Respondents from every jurisdiction within Maryland participated in the survey. The respondents’ best define their organizations as: non-profit, for-profit, community action agencies, advocacy organization, unit of local government-town, unit of local government-county, for-profit housing developer, non-profit housing developer, or other organization. Together, non-profits and counties encompassed the largest share of communities served – representing more than half of all organization types (62.8 percent). For-profit and Other types of organizations combined represented 20.6 percent. The remaining 16.6 percent represent community action organizations, both for-profit and non-profit housing developers, and organizations that have either a regional or statewide community focus.
HOW WOULD YOU BEST DEFINE YOUR ORGANIZATION? BY PERCENT OF RESPONDENTS
Chart 2
Every jurisdiction in the state of Maryland was represented within the respondents. As shown in Table 32, the combined largest number of respondents operated primarily in Howard, Carroll, Baltimore, Prince George’s Counties and Baltimore City with a total of 72.6 percent. Montgomery County at 9.8 percent along with the other counties represented the remaining 27.4 percent of respondent’s primary operation location.
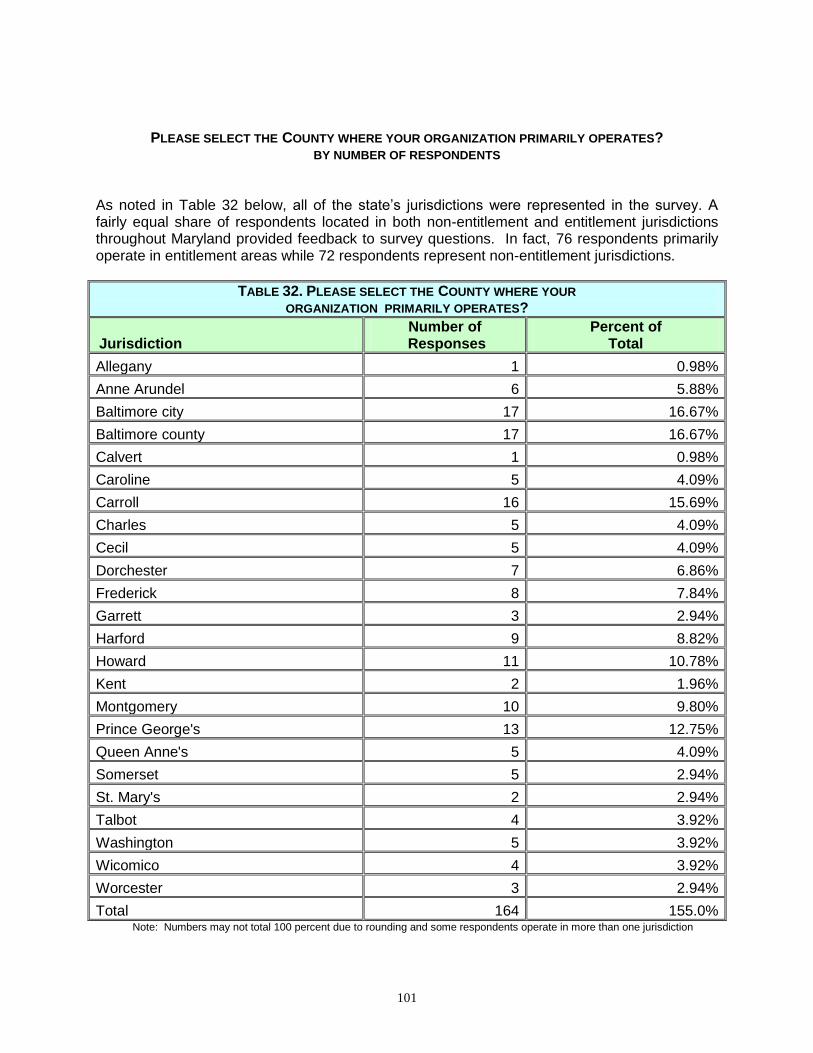
101
PLEASE SELECT THE COUNTY WHERE YOUR ORGANIZATION PRIMARILY OPERATES? BY NUMBER OF RESPONDENTS
As noted in Table 32 below, all of the state’s jurisdictions were represented in the survey. A fairly equal share of respondents located in both non-entitlement and entitlement jurisdictions throughout Maryland provided feedback to survey questions. In fact, 76 respondents primarily operate in entitlement areas while 72 respondents represent non-entitlement jurisdictions.
TABLE 32. PLEASE SELECT THE COUNTY WHERE YOUR ORGANIZATION PRIMARILY OPERATES?
Jurisdiction Number of
Responses Percent of
Total
Allegany 1 0.98%
Anne Arundel 6 5.88%
Baltimore city 17 16.67%
Baltimore county 17 16.67%
Calvert 1 0.98%
Caroline 5 4.09%
Carroll 16 15.69%
Charles 5 4.09%
Cecil 5 4.09%
Dorchester 7 6.86%
Frederick 8 7.84%
Garrett 3 2.94%
Harford 9 8.82%
Howard 11 10.78%
Kent 2 1.96%
Montgomery 10 9.80%
Prince George's 13 12.75%
Queen Anne's 5 4.09%
Somerset 5 2.94%
St. Mary's 2 2.94%
Talbot 4 3.92%
Washington 5 3.92%
Wicomico 4 3.92%
Worcester 3 2.94%
Total 164 155.0% Note: Numbers may not total 100 percent due to rounding and some respondents operate in more than one jurisdiction
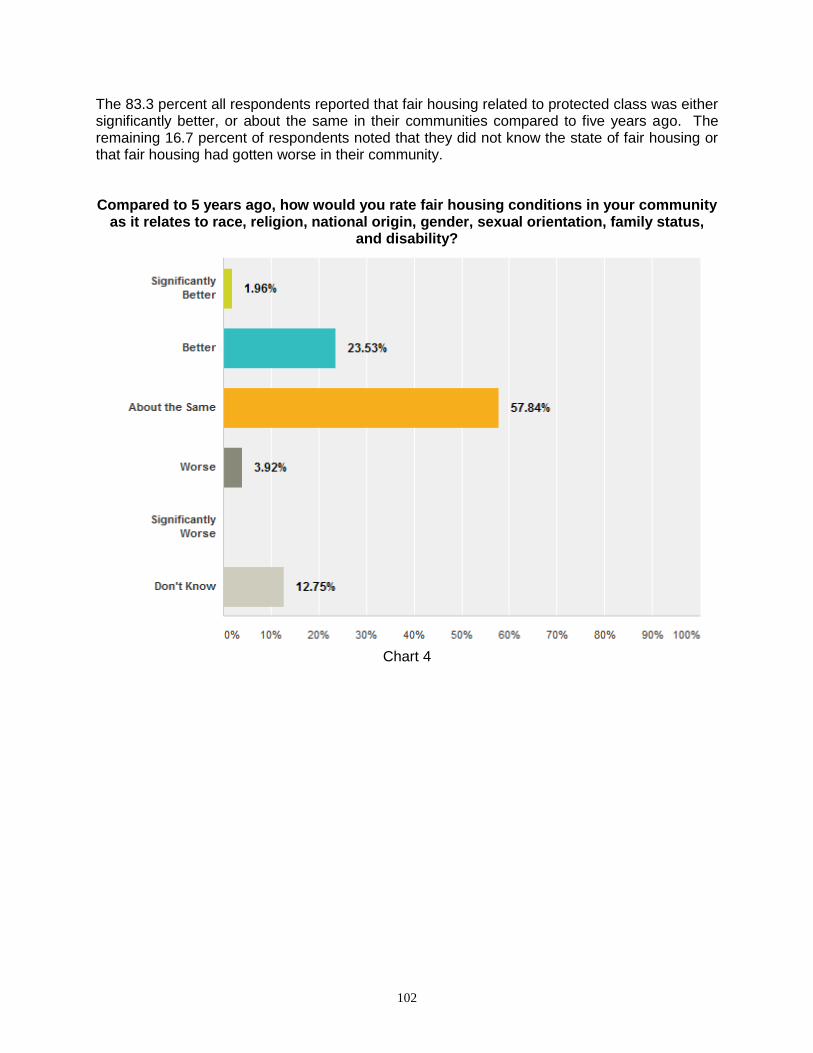
102
The 83.3 percent all respondents reported that fair housing related to protected class was either significantly better, or about the same in their communities compared to five years ago. The remaining 16.7 percent of respondents noted that they did not know the state of fair housing or that fair housing had gotten worse in their community.
Compared to 5 years ago, how would you rate fair housing conditions in your community as it relates to race, religion, national origin, gender, sexual orientation, family status,
and disability?
Chart 4

103
DISCRIMINATION IN YOUR COMMUNITY
Section two below solicits feedback from respondents concerning housing discrimination or unfair treatment in their respective communities. Questions ascertain the extent to which a persons’ ability to secure housing fairly has been impeded by acts or incidents of discrimination based on a variety of protected class characteristics. When asked whether or not respondents were aware of any incidents of discrimination in obtaining housing based on race, religion disability, gender, color, familial status, national origin, ability to speak English, or sexual orientation, the majority of all respondents 89.8 percent) were not aware of any incidents (Chart 5). The ability to speak English was the second most observed type of discrimination by number of incidents, showing 7 responses or 7.1 percent of all responses received. DHCD also gave respondents the opportunity to comment on other incidents of discrimination of protected classes not identified in the survey. There was no central theme in the incidents discussed.
INCIDENTS OF DISCRIMINATION, BY NUMBER OF ALL RESPONDENTS
Chart 5

104
As noted in their responses below, the majority of all respondents 77.8 percent reported that they did not have any knowledge or experiences of discrimination in their communities, 12.5 percent of respondents were aware of persons being directed to certain neighborhoods by housing providers or lenders.
Chart 6
Respondents Knowledge or Experience of Discrimination
Are you aware of anyone in your community experiencing the following in the past five years?

105
BARRIERS TO FAIR HOUSING
Section Three below involves barriers to fair housing, and seeks feedback from respondents that measure the degree to which fair housing obstacles prohibit persons from obtaining housing in their communities. The ratings were measured using a likert scale ranging from not a barrier, minor barrier, moderate barriers, to severe barriers, and don’t know, for each statement in a construct. This section contains three constructs which measure possible barriers in the areas of (1) fair housing, (2) land use and zoning, and (3) knowledge and awareness. An examination of the following fair housing construct revealed the most highly rated patterns as follows: Lack of Affordable Housing When comparing responses to the statement involving the lack of affordable housing in general, 68 percent of all respondents indicated that severe barriers exist, 24.4 percent indicated that moderate barriers exist, and 7.7 percent reported that there it is no barrier, minor barrier or do not know if barriers exist. Lack of affordable housing for persons with disabilities When comparing responses to the statement involving the lack of affordable housing for persons with disabilities, 51.3 percent of all respondents indicated that severe barriers exist, 25.6 reported that moderate barriers exist and 23.1 percent reported having no barriers, minor barriers, or do not know if barriers exist. Concentration of affordable housing in certain geographic areas When comparing responses to the statement involving the geographic concentration of affordable housing, 36.8 percent of all respondents indicated that severe barriers exist, 29.0 percent indicated moderate barriers exist and 15.8 percent reported having minor barriers in their communities with the remaining 18.4 percent reporting there were no barrier or not aware of any barriers in their community. Discrimination in credit and lending practices When comparing responses to the statement involving discrimination in credit and lending practices; 37.8 percent of all respondents indicated that they did not know if barriers to credit and lending practices existed in their communities and 23.0 percent reported that discrimination in credit and lending practices was not a barrier in fair housing. Discrimination due to source of income (social security, disability or retirement income) When comparing responses to the statement involving discrimination due to source of income nearly more than of all responses were between not a barrier (26.6 percent) and did not know if a barrier existed (31.6 percent). A combined 30.3 percent of respondents reported that source of income discrimination was a minor to moderate barrier. Only 11.8 percent believed the barrier was severe.

106
Lack of real estate representation by persons of differing races, ethnicities, disabilities, gender, and sexual orientation. When comparing responses to the statement involving lack of real estate representation by persons of protected classes, 30.3 percent of respondents indicated that they did not know if this was a barrier while 29.0 percent reported that this was not a barrier. These categories present the largest share of responses combined equivalent to 59.3 percent. Additionally, the remaining 40.7 percent saw this as impeding fair housing with a combined 34.2 percent reporting that this was a minor to moderate barrier. Only 6.6 percent reported that there was a severe barrier in their community. Lack of housing information translated in other languages When comparing responses to the statement involving lack of housing information translated in other languages, respondents varied in opinion ranging from 27.3 percent not knowing to 23.4 percent considered this measure not a barrier. A combined 39 percent of respondents considered the lack of housing information translated into other languages a moderate to minor barriers and 10.3 percent of respondents consider this a severe barrier. An examination of transportation, availability and acceptance of section 8 vouchers and preservation of existing affordable housing below revealed the most highly rated patterns as follows: Lack of transportation in Urban Areas When comparing responses to the statement involving limitations on density of housing, 24.3 percent of all respondents indicated that severe barriers exist, and 31.1 percent reported having experienced no barriers to transportation barriers in urban areas. Lack of transportation in Rural Areas When comparing responses to the statement involving lack of transportation in rural areas, 7.8 percent of all respondents indicated there was not a barrier while an overwhelming 46.8 percent reported that transportation is indeed a severe barrier in rural areas. Lack of Acceptance of Section 8 Vouchers by Landlords When asked if lack of acceptance of section 8 vouchers by landlords impacted their community, 20.8 percent of respondents did not know. In comparison 48.1 percent of combined respondents considered this to be a minor or moderate barrier. Lack of Available Section 8 Vouchers An overwhelming 53.9 percent of respondents agree that the lack of Available Section 8 housing vouchers is a severe barrier impacting housing choice in their communities. Only 1.3 percent of respondent considered this to not be a barrier.

107
Preservation of Existing Affordable Housing When reviewing responses to the extent preservation of affordable housing impacts communities 28.0 percent of respondents considered this to be a severe barrier and 36 percent of respondents a moderate barrier. Additionally 21.3 percent of respondents did not know if preservation of existing affordable housing was a barrier in their communities. The remaining 14.7 percent of respondents considered this to be either not a barrier (5.3 percent) or minor barrier (9.3 percent). An examination of the land use and zoning construct below revealed the most highly rated patterns as follows: Limitations on density of housing When comparing responses to the statement involving limitations on density of housing, 38.7 percent of all respondents indicated that minor barriers exist, and 30.7 percent reported they don’t know if a limitation on density of housing is a barrier community. Additionally 18.7 percent of respondents reported that no barriers to housing density in their communities exist. Lack of adequate zoning for manufactured housing When comparing responses to the statement involving lack of adequate zoning for manufactured housing, 38.7 percent of respondents reported this as a minor barrier, 36 percent of all respondents indicated that they did not know if adequate zoning is a barrier, and 20.0 percent reported that no barriers exist in their communities. Restrictive covenants by builders, developers, and/or homeowners’ associations. The bulk of responses received involving restrictive covenants by select housing organizations fell into two categories 41.3 percent of respondents reporting this is a minor barrier and 33.3 percent indicating they did not know if this was a barrier. 17.3 percent of the respondents surveyed however indicated that no barrier existed. Limitations on housing for people with disabilities When comparing responses involving limitations on housing for people with disabilities, over half the respondents (55.3 percent) indicated that both severe and minor barriers exist – 31.6 percent and 23.7 percent combined, respectively. 31.6 percent of all respondents reported that they do not know if barriers exist regarding housing limitations for people with disabilities. Limitations on housing for people with low income When comparing responses involving limitations on housing for people with low income, 50.7 percent of all respondents reported that severe barriers exist, 27.3 percent of respondents indicated a minor barrier. Additionally, 15.6 percent indicated that no barriers exist for people with low income.
108
LAND USE AND ZONING CONSTRUCT, ALL RESPONDENTS BY PERCENT OF TOTAL
An examination of levels of knowledge and awareness revealed the most highly rated patterns as follows: Residents When comparing responses on the knowledge of residents concerning fair housing laws, the majority (68.1 percent) indicated that they are somewhat aware. While 16.7 percent indicated residents are not aware. Large property landlords When comparing responses on large property landlords and managers concerning fair housing laws, the majority of all respondents (80.1 percent) reported that they are very aware or somewhat aware of fair housing laws in their communities. Small property landlords When comparing responses on small property landlords, more than half (65.3 percent) indicated that they are somewhat aware of fair housing laws in their communities. The remaining share of all responses represented a fairly equal distribution between “very aware” (14.7 percent) and “don’t know” (16.0 percent). Property Managers When comparing responses on property managers, slightly under half (47.3 percent) indicated that they are somewhat aware of fair housing laws in their communities. The “very aware” distribution of responses was the next highest (37.8 percent) and “don’t know” took the remaining majority of respondents (12.2 percent). Real Estate Agents When comparing responses on real estate agents, slightly under half (46.7 percent) of all respondents indicated that they are very aware of fair housing laws in their communities. The remaining share was ““somewhat aware” (37.3 percent) and “don’t know” (14.7 percent). Bankers and Lenders When comparing responses on bankers and lenders, nearly half (49.3 percent) of all respondents indicated that they are very aware of fair housing laws. 29.3 percent noted that they are somewhat aware, 18.7 percent did not know whether or not bankers and lenders are knowledgeable or aware, and 2.7 percent responded that they are not aware of fair housing laws in their communities. Insurance Industry Representatives When comparing responses concerning insurance representatives, 39.7 percent were somewhat aware and a fairly equal rating emerged between very aware (26.6 percent), and don’t know (28.8 percent).

109
Appraisers When comparing the ratings on appraisers and their level of knowledge and awareness, more than half (60.0 percent) of all respondents claimed that they are between somewhat aware and very aware of fair housing laws in their communities. Additionally, 33.3 percent cited that they did not know whether or not appraisers are knowledgeable on this subject. Local Government Officials When comparing the ratings on local government officials and their level of knowledge and awareness, more than half (80.0 percent) of all respondents claimed that they are between somewhat aware and very aware of fair housing laws in their communities. 14.7 percent cited that they did not know whether or not local government officials are knowledgeable on this subject. State Government Officials When comparing the ratings on state government officials and their level of knowledge and awareness, more than half (79 percent) of all respondents claimed that they are between somewhat aware and very aware of fair housing laws in their communities. Fifteen percent cited that they did not know whether or not appraisers are knowledgeable on this subject. FAIR HOUSING SOLUTIONS Section Four, Fair Housing Solutions, elicits feedback from respondents’ to determine ways in which fair housing practices can be enhanced to better serve the needs of individuals and families of protected classes. The questions seek to identify areas of concern, organizations best suited to handle identified problems. When asked, “What efforts have been made by your jurisdiction, businesses, and other entities to create housing opportunities for lower income citizens?” The majority of respondents identified utilization of existing funding programs, local government support, education and production of affordable housing as ways jurisdiction, businesses, and other entities to create housing opportunities for lower income citizens. The majority of the remaining respondents equally were not sure or thought little to no efforts have been made. Respondents were asked to check all that applied below is a chart displaying responses:

110
EXISTING PRACTICES OFFERED BY RESPONDENTS
Chart 9
When asked, “What do you think would improve fair housing in your community?” The majority of respondents think more funding and more affordable housing, would “help a lot” to improve fair housing. When we review combined results respondents identify more funding, more affordable housing, housing for persons with disabilities, better marketing and outreach and better education as improvements for fair housing in their respected communities.
When asked, “have you ever assisted a client with filing a housing discrimination complaint in your community?” the majority of all respondents reported having never assisted clients with filing a housing discrimination complaint (94 percent).
When asked, “What do you think are the reasons people do not report incidents of housing discrimination?” Of the fifty responses, the most common themes was fear of retaliation, displacement and that nothing will be done if incident is reported. When asked, “What other types of barriers to fair housing do you think may exist?” Of the fifty responses, the most common themes was fear of retaliation, displacement and that nothing will be done if incident is reported. The final survey question asked “What other actions do you believe will improve fair housing choice?” The common theme among respondents was education and marketing and outreach.

111
Conclusions
Survey participants were asked to respond to 17 questions, using Survey Monkey, an online survey software system that captured and tabulated responses. Participants provided feedback which included background information on their agencies, discrimination in their communities and fair housing solutions. All of the state’s jurisdictions were represented in the survey. Most respondents were not aware of any incidents of housing discrimination in their communities in relation to protected class. However, of all protected class categories, ability to speak English was the most frequently selected issue across the state as a whole. Fair housing, land use and zoning, and knowledge and awareness factors were measured to determine the extent to which barriers to fair housing prohibit persons from obtaining housing in their communities. The most highly rated responses revealed that the lack of affordable housing in general were at severe levels. The least severe cases relate to the lack of real estate representation by persons of protected class. When comparing all statements in the land use and zoning construct, the most highly rated responses revealed that severe barriers involve limitations on housing for people with low income. The least severe barriers involve restrictive covenants by builders, developers, and/or homeowners’ associations. When comparing all statements in the knowledge and awareness construct, the most highly rated responses revealed that residents are somewhat aware of fair housing laws, while large property owners and bankers/lenders were considered very aware when compared to all representatives in this grouping. Finally, the survey elicits feedback from respondents’ to determine ways in which fair housing practices can be enhanced to better serve the needs of individuals and families of protected classes. When asked, “What efforts have been made by your jurisdiction, businesses, and other entities to create housing opportunities for lower income citizens?” Respondents indicated that evidence of their commitment to creating housing opportunities was demonstrated utilization of existing funding programs. When asked,” what do you think would improve fair housing in your community?” the most frequently suggested option is more funding and more affordable housing.

112
Fair Housing Action Plan Strategies to Overcome Impediments
The extensive data review contained in this report revealed important information about efforts DHCD has and should undertake to address fair housing choice. Analyses revealed the following patterns: Census data shows little difference in housing need based on race or ethnicity. Further examination of the 2010 AI Plan was conducted to determine the extent to which previously identified impediments had been addressed. The majority of identified impediments have been rectified by either DHCD alone or in collaboration with other agencies. Additionally, analysis showed increased concern about fair housing provisions for individuals with disabilities. Other key findings from the survey revealed the majority of participants citing a need for better education as a strategy to improving fair housing in their communities. Lastly, there are some significant data gaps that may indicate problems regarding fair housing choice, but are difficult to determine. Despite success in carrying out most fair housing activities, the State found areas requiring greater attention in providing fair housing choice. They include: 1) improving fair housing education efforts, 2) increasing efforts to assist persons of Limited English Proficiency, 3) ensuring that persons with disabilities have expanded fair housing choice, 4) strengthening federal laws regarding lending practices to make it easier to determine whether or not discrimination in lending exists, and 5) increasing the amount of affordable and accessible housing availability to low income populations. Education: Analyses showed both a need and a demand for fair housing education over 58% of all respondents to the fair housing survey noted that fair housing education is needed to promote fair housing choice Specific actions DHCD will undertake to address educational needs include, but may not be limited to, the following:
Develop an affirmative fair housing plan Prepare and conduct up to fifteen testing sessions annually in non-entitlement areas Plan and conduct six fair Housing Outreach events annually state-wide

113
Limited English Proficiency Although most households of limited English proficiency reside within entitlement jurisdictions, The Maryland department for Housing and Community Development feels that continuous efforts need to be taken to ensure that all households across the State are aware of housing choice options that are available to them. Specific Actions that DHCD will undertake to address persons of LEP includes:
In order to promote affirmative fair housing we will provide translations in French, French Creole, Italian, Portuguese, German, Russian, Gujarati, Hindi, Urdu, Chinese, Korean, Vietnamese, Tagalog, Arabic, Greek and Spanish on our website.
Continue to MMP brochures and information into Spanish, and providing links to this information on our website as documents are translated.
Continuing outreach efforts through Spanish language radio, television, and newspapers.
Continuing written translation on the availability of affordable rental housing in Spanish. Continuing State translator subscription service for persons with limited English speaking
ability. This includes the above mentioned languages where feasible. Working with the Department of Human Resources (DHR) in developing its Plan(s) for
helping persons of LEP as per State law. DHR is responsible for providing central coordination and technical assistance to State agencies to ensure compliance with State law regarding persons of LEP.

114
Fair Housing Choice for Persons With Disabilities DHCD provides a wide array of housing for persons with disabilities, ranging from supportive housing to rental housing to homeownership opportunities. In efforts to strengthen housing fair housing for persons with disabilities DHCD in conjunction with its partners will: Use funding awarded through HUD’s Section 811 Demonstration Program, targeted specifically to assisting, persons with disabilities achieve greater fair housing and use the several rounds of funding from the Weinberg Foundation for the same purpose Provide more housing for persons with disabilities through its revised Qualified Allocation Plan Plan (QAP) through the federal LIHTC program and other State resources which DHCD worked cooperatively with DHMH on. Continue to provide fair housing choices for persons with disabilities though existing DHCD Group Housing Programs and Homeownership for Individuals with Disabilities Program Improved Data Collection One of the most significant difficulties DHCD and other agencies face is actually obtaining an accurate picture of fair housing problems and the needs of individual protected classes. For example, there is no cross link between information on persons with disabilities and legitimate housing needs in the Census data. Specific actions DHCD will undertake to improve data collection include:
Continue to advocate to Congress that the federal government improve and expand HMDA data to help determine when and if housing discrimination exists.
As HUD prepares to update data tables, advocate the need to cross reference materials on the housing needs of individuals with disabilities, which is displayed in the Comprehensive Housing Affordability (CHAS) datasets, with 2010 Census data.
Work with HUD to ensure that the data provided under the American Community Survey provides an accurate picture of persons and families with housing needs.

115
More Affordable and Accessible Housing The DHCD estimates that from 2006 -2010 Maryland faces a shortage in units of affordable and available housing for renter households in the 30%, 50% and 80% area median incomes. The shortage of affordable and available rental housing units has become more concentrated among the low-income renter households despite improvements in income and housing conditions across a broad range of income in the past decade Using existing resources, Maryland has worked hard to address the housing needs of persons with disabilities and low income families, receiving national awards for its efforts. As funding becomes available DHCD plans to continue seeking opportunities to provide affordable housing to the disabled. Funding sources that we plan to pursue for assistance include, bond funds, LIHTC, National Housing Trust and competitive grants, as well as new housing choice vouchers.
Table 38. 2015-2019 Actions to Overcome Impediments
Action Problems Addressed Responsible
Partners Timeframe
Fair Housing Education/Information
Undertake local fair housing outreach programs that emphasize race, ethnicity, & disability.
Lack of public awareness of fair housing rights & responsibilities
DHCD, HUD, MCCR, Statewide, with emphasis in Non-entitlement communities Ongoing activity
Improve fair housing awareness and build on marketing efforts; specifically targeting residents, realtors, developers, landlords, lenders, insurers, management agents, etc.
Lack of public awareness of fair housing rights & responsibilities
DHCD, MCCR, HUD, MAR, MBA
Ongoing activity; DHCD has a contract with Baltimore Neighborhood, Inc. (BNI) to continue carry out these actions
Sponsor Fair Housing workshops and/or seminars.
Lack of public awareness of fair housing rights & responsibilities
DHCD, HUD, MCCR, NAACP, BNI
Ongoing activity; DHCD has a contract with Baltimore Neighborhood, Inc. (BNI) to continue carry out these actions
Undertake testing for racial discrimination in sales practices & lending; & geographic fair housing testing.
Identification of possible discrimination (see survey results) DHCD and/or MCCR
Ongoing activity ; DHCD has a contract with Baltimore Neighborhood, Inc. (BNI) to continue carry out these actions
Train landlords on new reporting requirements related to fair housing as part of HERA legislation.
Lack of or incorrect data from landlords sometimes impacts the ability to assess fair housing opportunities HUD and DHCD
Awaiting new regulations and Technical Assistance from HUD.
LEP Education/Technical Assistance

116
Table 38. 2015-2019 Actions to Overcome Impediments
Action Problems Addressed Responsible
Partners Timeframe
Encourage local LEP service provision with towns/municipalities, nonprofit organizations, etc.
Ensure information is available for persons of LEP .
Maryland Dept of Human Resources, HUD Ongoing activity
Develop and Implement LEP marketing, outreach, and information.
Ensure persons of LEP have access to DHCD programs.
DHCD, Maryland Dept of Human Resources, HUD Ongoing activity
Add new links to DHCD's website to address different languages; continue utilizing oral translator services; & Spanish language media.
Establish a single site of information for persons of LEP . DHCD To be completed by 2017
Utilize State Translator Subscription Service for Persons with limited English speaking ability.
Provide information to persons of LEP, including for those whose primary language is not large enough as a group to translate documents under federal or State requirements.
DHCD, using State Contractor Ongoing activity
Translate DHCD documents as required by federal and State LEP requirements
Ensure opportunities to persons of LEP DHCD As required
Expand Housing Opportunities for Persons With Special Needs
Implement select strategies as outlined in the State Disabilities Plan
Lack of accessible and housing choices for individuals with disabilities. DHMH, DHCD, DHR, Ongoing activity
Increase rental subsidies
Expand housing opportunities to persons with Special Needs whose incomes are too low to afford low-income housing as they may have incomes below poverty levels utilizing 811 financing
HUD, DHCD, DHMH, DHR
DHCD, MDoD, DHMH was awarded 21 million to carry out this activity over the next five years.
Reinforce planning & program efforts to increase affordable housing opportunities for people with disabilities.
Housing people with disabilities
DHCD, DHMH, MDoA, MDoD Ongoing activity

117
Table 38. 2015-2019 Actions to Overcome Impediments
Action Problems Addressed Responsible
Partners Timeframe
Continue to operate DHCD programs that assist persons with Special Needs
Providing full range of housing opportunities to persons with special needs for all disability levels. DHCD
Continue funding/operation of Housing Opportunities for Individuals With Disabilities Program, bonus point awards for projects which provide more units to households with special needs, continue operating Group Home and SHOP programs, etc.
Data Collection
Advocate with Congress the improvement & expansion of HMDA data
Lack of Fair Housing data which could provide evidence of possible discrimination in lending DHCD Ongoing
Initiate testing for racial discrimination vs. the disabled in rental and/or sales practices in non-entitlement areas
In response to concerns from advocates concerning possible discrimination. DHCD, MCCR, BNI
Underway; ; DHCD has a contract with Baltimore Neighborhood, Inc. (BNI) to continue carry out these actions
Facilitate opportunities for various forms of testing on discrimination in rental practices; in non-entitlement communities
In response to concerns from advocates concerning possible discrimination. MCCR, BNI
Ongoing activity as funding becomes available
Fair housing training for property managers of DHCD projects to identify demographic/program beneficiary information.
Addressing lack of understanding for data collection on beneficiary race and ethnicity on DHCD financed projects. DHCD Ongoing Activity
Establish clear documentation that shows fair housing tracking and monitoring have been conducted and report status of review.
Lack of documentation and/or inconsistent reporting of fair housing standards. DHCD
Ongoing Activity; Based on standard program reporting guidelines
Affordable and Accessible Housing
Increase production of affordable housing.
Lack of affordable housing
DHCD, public and private partners
Ongoing activity using existing programs
Access new resources for the production of affordable housing
Lack of affordable housing DHCD
Utilize funding under National Affordable Housing Trust fund to create more affordable rental housing for extremely low-income renters.
Access competitive funding under existing
Lack of affordable housing
DHCD, DHMH, PHAs, nonprofits,
Access new Housing Choice Voucher opportunities as

118
Table 38. 2015-2019 Actions to Overcome Impediments
Action Problems Addressed Responsible
Partners Timeframe
HUD and other programs other eligible applicants as appropriate
they become available, permanent supportive housing funding under HEARTH act, competitive funding for which DHCD or other agencies are eligible.
Coordinate affordable housing with transportation, jobs
Lack of available affordable housing near transportation, jobs,
DHCD, MDOT, MDE, PHAs, local governments Ongoing agency effort
Preservation of Existing Affordable Housing
Loss of affordable housing which exacerbates housing problems for lower income households
HUD, DHCD, local governments, private partners.
Utilize MacArthur Foundation Grant, State resources to preserve affordable rental housing. Also work with federal government as they develop new housing preservation programs.
Analysis of Impediments Hearing Comments
Oral Comments: DHCD received a number of oral comments at the hearings on the Con Plan and the AI. Most of the comments on the Con Plan were essentially along the lines that local jurisdictions did not find the document particularly useful given its new format and the inability to separate data out by local jurisdiction. We explained that the new format is a HUD fillable form that provided most of the data found in the Plan. There was also some discussion of the AI. Some of the comments were accepted, such as a request that fair housing education be provided to providers of housing as well as consumers. Other discussions were more general, such as the discussion of HMDA data and mortgage lending. One comment that was made on the AI that was not accepted/incorporated into the Plan was identifying Source of Income as a barrier to fair housing. See our response to this issue in the written comments below.

119
Written Comments: DHCD received several comments regarding the National Housing Trust Fund, the (lack of a) method of allocation, and suggestions that Trust Fund monies be reserved entirely for specific groups, including persons with disabilities, the homeless, youth exiting foster care, etc. DHCD has decided it will not include a proposed method of distribution for Housing Trust Fund monies in this year’s version of the Consolidated Plan. There are several reasons for this. First, DHCD would not receive any funding under the Trust until 2016 at the earliest, all of which concern funding issues. Consequently, we have and want time to think through this program and the method of distribution of funding. Second, while the GSEs have been directed to provide money to the fund, current projections indicate there will not be enough money in the Trust to meet the statutory minimum State allocations of $3 million per State in 2016. If that is the case, funding would probably not come before 2017 at the earliest, so it would be premature to set policies for funding we may not receive until several years in the future. Third, there is also legislation to de-fund the Trust, as well as legislation to divert Trust fund monies to the HOME program, so there is some likelihood the Department will not receive any funding under the Trust at all. As for reserving funding for specific groups, even if we agreed with reserving the funding for one specific group, it is again too premature to make that decision when no funding may be available at all under the program. Several Groups commented that the State AI should have covered entitlement jurisdictions as well as non-entitlement jurisdictions, that hearings should have been held in entitlement jurisdictions, and that the public participation process was inadequate. The State’s Analysis of Impediments is designed to address fair housing barriers in Maryland’s non-entitlement areas. The entitlement areas which include Anne Arundel, Baltimore, Harford, Howard, Montgomery and Prince George’s Counties, as well as Baltimore City among others, prepare their own AIs. This is fully consistent with HUD policy about the geographic areas State AI’s should cover. That the State’s AI need only cover the non-entitlement areas is confirmed by a letter dated December 5, 2014 to the Counsel of State Community Development Agencies (COSCDA), signed by both HUD Assistant Secretary for Fair Housing and Equal Opportunity (FHEO) Gustavo Velasquez and Acting HUD Assistant Secretary for Community Planning and Development (CPD) Cliff Taffett that clarified this issue nationwide. (Other States had also been incorrectly told their AIs should cover entitlement areas as well, hence the letter to COSCDA to clarify this issue for all States.) The letter from the Assistant Secretaries explicitly says that State AIs need only cover non-entitlement areas, that entitlement areas are required to perform their own AIs, and that any HUD Field Office that has an incorrect interpretation that State AIs should cover entitlements should also be directed to HUD central in Washington, D.C. for correction. Consequently, any belief or position that holds States should cover entitlement areas in their AIs is, according to HUD itself, incorrect. In that light, the State also acted correctly in holding its hearings in areas which are under the State’s AI rather than in jurisdictions that are covered by local AIs. The State identified strategic locations across Maryland, including Denton (Caroline County), Cumberland (Allegany County), Owings (Calvert County), and Stevensville (Queen Anne’s County).

120
In regard to the survey, DHCD made a good faith effort to gather as many email contacts as possible through each division at the department for the fair housing survey, including our Fair Housing office, Division of Neighborhood Revitalization, Division of Development Finance, etc. In addition, as part of the development of the AI, over 850 announcement letters were mailed statewide, letters were sent to nonprofit and for profit housing developers, advocacy groups, local government officials, public housing authorities, chief housing contacts, and private individuals, notifying them about the development of the new AI. These communications also provided information on public hearings, requests for public comment, and information about where to find the draft AI on the DHCD website. Draft copies of the AI were sent to regional libraries throughout the State, including a large print version to a library for the blind and physically handicapped. Notice about the comment period on the AI was also provided in newspaper ads that ran across the State, including newspapers in Annapolis, Baltimore, Hagerstown, Salisbury and various other communities (see complete list in the public participation section). Lastly, the draft AI was posted on DHCD’s website (www.dhcd.state.md.us) and the website also included postings that communicated the dates and times of hearings, as well as opening and closing dates for public comments. Consequently, we believe the State’s notification and public participation process for the AI was more than adequate for those persons and organizations interested in the AI and the planning process. DHCD received several comments that the AI and Con Plan fail to identify Source of Income Discrimination as an Impediment to Fair Housing and to propose Remedial Action. The Department recognizes that not all landlords accept Section 8 Housing Choice and VASH vouchers (the primary areas of concern for organizations pushing for its inclusion as a barrier to fair housing) and that legislation has frequently been introduced, but not been passed, by the Maryland General Assembly regarding sources of income legislation. DHCD continues to encourage more landlords to accept Section 8, and has included our marketing efforts in our AI. In addition, DHCD also requires developers who utilize funding from DHCD for their projects to accept Housing Choice Vouchers.
Comment: The AI does not represent an independent, rigorous assessment, free of conflicts of interest. Based on the information available to us, we believe that if DHCD consulted with any outside person(s) or entities at all, it was only with its own CDBG grantees and contractors. As noted above, DHCD carried out an extensive public participation process in developing the AI. In addition, DHCD consulted directly with numerous agencies in the development of the AI, and directly incorporated their comments, concerns, and materials into the AI. Consequently, the statement that DHCD only consulted with CDBG grantees and contractors is factually incorrect. The comment about “conflict of interest” is unclear, as no conflict of interest was identified in the comment, and DHCD is not aware of any conflicts of interest.

121
Comment: There is no examination of the Qualified Allocation Plan (QAP) policies to determine whether they burden production of LIHTC in Communities of Opportunity and steer construction of LIHTC to areas that already have a concentration of assisted housing and poverty, as well as segregation. Starting on page 50, the AI includes a discussion of persons who are assisted in housing financed with the LIHTC program and includes multiple maps looking at projects financed with LIHTC, with discussion of projects that are (or are not) located in areas of low-income or minority concentrations over the past five years. DHCD utilizes a set of metrics to fund LIHTC projects in areas the Department identifies as areas of opportunity, while at the same time meeting congressionally mandated requirements to provide incentives to developers to construct projects in Qualified Census Tracts, which are essentially areas with higher average poverty rates. (We would note that the organization making the comment about “areas of opportunity” is pushing the Department to use its version of areas of opportunity rather than DHCDs. As per a letter signed by former Assistant Secretary Frank Coakley, DHCD is publicly in disagreement with this organization’s definition of areas of opportunity based on some of the data they are using, metrics, and weightings of what constitutes “opportunity areas” among other issues.) That said, DHCD recognizes that there are limitations to the LIHTC discussion, in part because HUD is in the process of revising how information on LIHTC projects should be reported in terms of program beneficiaries. We also note that HUD pulled its proposed Fair Housing Assessment Tool for States in part due to conflicting standards of what is congressionally required under the LIHTC program and HUD policy regarding where affordable housing projects should be developed/located. Comment: Smart Growth Control Regulations as a barrier to affordable housing and an impediment to fair housing: The draft and Con plan view state do not examine whether there are state regulatory policies, practices or procedures that impede the development of housing costs, particularly in areas that are predominantly white and affluent. DHCD and the State of Maryland do not believe that Smart Growth is an impediment to Fair Housing. Rather, we believe that targeting growth, investing in communities and promoting neighborhood revitalization that are part of Smart Growth efforts provides for significantly better communities and housing opportunities than sprawl. Smart Growth policies cover an extremely large amount of all State resources, not just housing resources, and the availability of funding, typically below market, do not impede the development of affordable housing, but encourage it by providing assistance to developers and communities at below market rates. Further, there is no racial component to Smart Growth efforts. Designated Smart Growth communities are based on a number of items that promote communities and the wise use of resources. Comment: State transportation polices as an impediment to fair housing: Transportation and housing are inextricably linked and protected groups are disproportionately transit dependent. The new draft AI contains no assessment of state policies or programs related to transportation as it relates to housing choice and job access. We do not agree that State transportation policies are an impediment to fair housing, and the comments provide no argument or evidence to support this claim. In its rating and ranking for housing development, DHCD does award bonus points to projects that are located near mass transit which allows individuals and families better access to jobs, educational opportunities, and other resources.
122
Comment: The AI and Con plans analysis of disproportionate housing needs is superficial and understates the extent to which the State’s housing problems fall disproportionately on African Americans. The data used in this section of the AI and Con Plan are directly from HUD and are provided through HUD’s own E-Con Planning Suite. The data HUD provided does NOT show that the State’s housing problems fall disproportionately on African Americans. In fact, in no income category or housing size did the data show this. Comment: The AI and ConPlan lack a focus on the housing problems of all protected groups particularly families with children. The Con Plan and the AI does include a discussion of the housing needs of families with children. What the HUD provided data shows from the American Community Survey is that the need for families with children is actually less than the need for other groups. This is actually consistent with findings in previous years under the long-form of the Census as well. While there is certain need for affordable housing for low-income families with children, it is not the largest group of need, nor is there any disparate impact of need for these households. Comment: The AI improperly conflates affordable housing with fair housing. DHCD believes there is a link between affordable housing and fair housing. Affordable housing provides fair housing choices to many individuals and households who might not otherwise have it. This includes providing opportunities and choices for the disabled, single individuals, the elderly, and families. Comment: The AI and Con Plan lack a meaningful analysis of CHAS data and other data sources available to the State. With the replacement of the Census Long Form with the American Community Survey, an enormous amount of housing data that was available in the past in no longer available. This includes updated CHAS data. We used the data HUD provided in the E-Con Planning Suite in preparing the AI and the Con Plan, and recognize that it has many limitations, an issue we have raised repeatedly with HUD and note in the Con Plan and the AI. We are currently working with HUD, as well as the Census Bureau, to obtain better data on housing, including fair housing measures, in the future. Comment: The Con Plan needs assessment presents data in charts that contain only absolute numbers without percentages. Again, the data provided here is directly from the E-Con Planning Suite as HUD provided it to DHCD. We found this limitation rather frustrating too, and had to load a great deal of it into other software to extract percentages for certain housing needs, including the differing needs of various groups by race/ethnicity. While percentages are not available in the HUD data tables for the Con Plan (which follows a fillable form format by HUD), we did include the percentage information in the AI where/as appropriate.

123
Comment: The Department failed to identify private sector mortgage lending practices as an impediment to fair housing although it once again finds evidence of unexplained racial and ethnic disparities. DHCD did an analysis of private sector lending practices using HMDA data. The comment is correct to the extent we found evidence of unexplained racial and ethnic disparities. The key word is "unexplained". The problem we have is that the HMDA data is not detailed enough to determine whether the differences in lending among different groups and populations is due to discrimination or other issues. For example, the differences could be due to different credit scores, differences in proposed down payments, or other factors, so that differences in lending could be legitimate rather than discriminatory. This is one reason the Department has testified before Congress on several occasions on the need for better data on mortgage lending, including HMDA data. This is also one of the reasons we continue to include the need for better data in the AI, so that if lending is clearly discriminatory, it can be addressed. However, because we can't clearly determine why there is a difference in lending, we do not identify private sector mortgage lending practices as an impediment, we can only state it might exist based on the analysis we can do.