analysis of impediments pdf - miami gardens, fl
TRANSCRIPT
1
City of Miami Gardens
Analysis of Impediments to Fair
Housing Choice
Updated May 2016 by:
The Florida Housing Coalition
2
Contents EXECUTIVE SUMMARY ................................................................................................................................................... 4
I. INTRODUCTION .................................................................................................................................................... 13
A. HISTORY AND PURPOSE ......................................................................................................................................... 13
B. WHO CONDUCTED THE ANALYSIS? .......................................................................................................................... 15
C. METHODOLOGY .................................................................................................................................................. 15
D. FUNDING ........................................................................................................................................................... 16
II. JURISDICTION’S DEMOGRAPHIC, ECONOMIC AND HOUSING PROFILE ................................................................ 16
A. POPULATION ....................................................................................................................................................... 18
Race and Ethnicity ................................................................................................................................................ 18
Disability ............................................................................................................................................................... 23
Age ....................................................................................................................................................................... 23
Population Projection........................................................................................................................................... 26
B. INCOME ............................................................................................................................................................. 26
C. EMPLOYMENT ..................................................................................................................................................... 30
D. HOUSING ........................................................................................................................................................... 33
Housing Costs and Cost Burden ........................................................................................................................... 34
Additional Housing Problems ............................................................................................................................... 35
Housing and Neighborhood Revitalization Resources .......................................................................................... 37
Public and Assisted Housing ................................................................................................................................. 40
Homelessness ...................................................................................................................................................... 44
E. TRANSPORTATION ................................................................................................................................................ 46
F. GOVERNMENT STRUCTURE .................................................................................................................................... 49
III. JURISDICTION’S FAIR HOUSING PROFILE ......................................................................................................... 51
A. FAIR HOUSING ENFORCEMENT ............................................................................................................................... 51
B. PUBLIC AWARENESS OF FAIR HOUSING ISSUES ........................................................................................................... 57
Extent of Perceived Discrimination and Trends in Awareness ............................................................................. 58
Survey Results ...................................................................................................................................................... 59
C. FAIR HOUSING INFORMATIONAL PROGRAMS ............................................................................................................. 63
D. FAIR HOUSING COMPLAINTS .................................................................................................................................. 64
E. FAIR HOUSING DISCRIMINATION SUITS FILED ............................................................................................................. 65
F. LENDING POLICIES AND PRACTICES .......................................................................................................................... 70
Portfolio Share Analysis of Single Family Lending ................................................................................................ 72
Market Share Analysis of Single Family Lending ................................................................................................... 78
Denial Disparity Analysis of Single Family Lending ............................................................................................... 81
G. PLANNING AND ZONING/BUILDING CODES ................................................................................................................ 84
IV. ACTION TAKEN TO REDUCE IMPEDIMENTS..................................................................................................... 89

3
V. CONCLUSIONS AND RECOMMENDATIONS .......................................................................................................... 93
A. IDENTIFIED IMPEDIMENTS TO FAIR HOUSING CHOICE .................................................................................................. 93
B. 2015 SUPREME COURT RULING ON FAIR HOUSING .................................................................................................. 100
C. CONCLUSION AND NOTE ON HUD’S NEW FAIR HOUSING FINAL RULE .......................................................................... 101
D. FAIR HOUSING PLAN .......................................................................................................................................... 102
SIGNATURE PAGE ....................................................................................................................................................... 106

4
EXECUTIVE SUMMARY
Miami Gardens is a distinctive suburban City in Miami-Dade County. Incorporated in 2003,
Miami Gardens is the largest predominantly African-American municipality in the state of Florida,
with a solid working-class and middle-class resident base and a strong sense of community
ownership and civic pride. The City had a population of 110,867 in 2014 (American Community
Survey 5-year estimates), and has received Community Development Block Grant (CDBG) funds
from the U.S. Department of Housing and Urban Development (HUD) since 2006. In fiscal year
2015, Miami Gardens received $1,000,644 in CDBG funds and is slated to receive $971,071 in
2016.
As a CDBG grantee, the City is required to affirmatively further fair housing (AFFH). Not only
must the City refrain from illegal discrimination on the basis of race, sex, disability, or other
“protected classes” in its housing-related activities, but it must also actively promote fair housing
choice for protected classes that have historically experienced housing discrimination. The City’s
AFFH obligation is not restricted to its use of CDBG funds, but rather extends to all housing-
related activities in the grantee’s jurisdictional area, whether publicly or privately funded.
For the past two decades, HUD has required grantees of its Community Planning & Development
(CPD) programs, which include CDBG, to periodically prepare an Analysis of Impediments to Fair
Housing Choice. The Analysis of Impediments (AI) identifies barriers and enforcement activities
related to fair housing choice, and provides recommendations for ongoing efforts to
affirmatively further fair housing.
5
This document consists of five sections:
I. INTRODUCTION
II. JURISDICTION’S DEMOGRAPHIC, ECONOMIC, AND HOUSING PROFILE
III. JURISDICTION’S FAIR HOUSING PROFILE
IV. ACTIONS TAKEN TO REDUCE IMPEDIMENTS
V. CONCLUSIONS AND RECOMMENDATIONS
I. INTRODUCTION
The Introduction places the document in context, describing the history and purpose of Analyses
of Impediments to Fair Housing Choice required of CPD grantees by HUD. We also discuss the
methods and funding used to conduct this Analysis of Impediments.
II. JURISDICTION’S DEMOGRAPHIC, ECONOMIC, AND HOUSING PROFILE
1. Miami Gardens had a population of 110,867 in 2014, an increase of approximately 3%
since 2010. The City’s population is projected to grow to 119,105 by 2040.
2. The City’s population was 76% African-American and 24% Hispanic or Latino (of any race)
in 2014. African-American residents tend to be less concentrated along the City’s
western boundary, where Hispanic and Latino residents tend to be more concentrated.
3. People with disabilities are relatively concentrated in the Andover Lakes area, which has
a high elderly population and a subsidized elderly housing complex, and in several
western Census tracts with moderate to high poverty rates.
4. In 2014, Miami Gardens had a median household income of $39,545, slightly lower than
Miami-Dade County’s median income of $43,099. Higher-income households are mainly
concentrated to the northeast of the City center, while the largest area of low household
incomes is found along the City’s southern border.
5. The employment rate among Miami Gardens residents aged 16 and older was 52.3% in
2014, lower than the County and State employment rates (55.2% and 52.7%,
6
respectively)1. The geographic distribution of residents in the labor force tends to have
an inverse relationship with income, though there are exceptions.
6. Miami Gardens had 35,154 housing units in 2014, of which 10.8% were vacant. Over 70%
of units were built between 1950 and 1979. The homeownership rate in 2014 was about
67%.
7. Median rents in Miami Gardens have increased by 11% since 2010, reaching $1,069 in
2014. The City’s median home value of $129,200 is lower than that of the County, and
has declined since 2010, according to 5-year (2010-2014) American Community Survey
data. According to the Shimberg Center, the median home sale price increased slightly,
from $117,894 in 2010 to $122,930 in 2014.
8. Housing cost burden is widespread in Miami Gardens. Among renters and homeowners
with mortgages, 62% and 59%, respectively, paid 35% or more of their incomes on
housing costs in 2014. A small percentage of households (6.3%) were overcrowded, and
it was extremely rare for a home to lack complete plumbing or kitchen facilities. The
extent of home deterioration and code violations is difficult to measure.
9. The City of Miami Gardens uses a variety of funding sources (e.g. CDBG, SHIP, NSP) and
partnerships (e.g. with housing counseling agencies and lenders) to support its housing
rehabilitation and homebuyer assistance programs.
10. Miami Gardens is within the service area of the Miami-Dade Public Housing and
Community Development department. The City has 57 units of public housing, and the
percentage of rental units with a Housing Choice Voucher (Section 8) is as high as 20% in
many Census tracts. However, thousands of households in Miami Gardens zip codes are
on the waiting list for public housing or Section 82.
11. The number of people identified as homeless in Miami Gardens is low, since the City lacks
emergency shelters and transitional housing. The City cooperates with the Miami-Dade
1 These percentages are based on American Community Survey data for all residents aged 16 and older, which
includes those not in the labor force. 2 It should be noted that more than 70,000 people sign up for the Public Housing and Section 8 wait lists
Countywide.
7
County Homeless Trust (the County’s Continuum of Care lead agency) and local providers
such as Citrus Health Network to meet the needs of people experiencing or at risk of
homelessness.
12. The City of Miami Gardens is well served by roads and other transportation networks,
with most workers experiencing a commute time of 44 minutes or less. A free trolley
service began in June 2015 and has served 31,000 riders in the first year. However,
additional bus service would expand access to employment centers.
13. Miami Gardens has a “Mayor-Council-Manager” form of government, with the Council
exercising all legislative powers of the City. Council acts as the final authority for the
appropriation of funds for Annual Action Plan activities under the Consolidated Plan grant
programs, following the recommendations of the City Manager.
III. JURISDICTION’S FAIR HOUSING PROFILE
1. Fair housing in Miami Gardens is subject to a hierarchy of local, state, and federal
regulations. Local agencies, including the Miami-Dade County Commission on Human
Rights and the nonprofit Hope, Inc. are tasked with receiving public fair housing
complaints and facilitating fair housing enforcement. However, guidance provided by
local agencies on filing complaints is inconsistent. Additionally, Hope, Inc., the dominant
fair housing organization in Miami-Dade County, was unable to provide information on
complaints received.
2. Public knowledge of fair housing laws and options for recourse is limited. In an online
survey of Miami Gardens residents and stakeholders, 7.2% of respondents reported
experiencing housing discrimination while another 7.2% were unsure. About 44% of
respondents were unfamiliar with or unsure of fair housing laws, and nearly 53% were
unfamiliar with or unsure of the resources available for filing discrimination complaints.
3. Of survey respondents who reported experiencing discrimination, race or ethnicity was
the most common basis for the discrimination. Only one of the 16 respondents who
believed they had experienced discrimination reported the incident. Among the other 15
8
respondents, the most common reasons for not reporting included a belief that it would
be ineffective, uncertainty about where to file a complaint, or lack of awareness that the
discrimination was illegal.
4. Hope, Inc. seeks to close the gap between fair housing laws and fair housing knowledge
and enforcement. The nonprofit agency conducts community outreach; assists
entitlement jurisdictions in implementing fair housing plans; provides educational
programs to developers, real estate agents, and other stakeholders; conducts fair
housing testing; and refers fair housing complaints for enforcement when appropriate.
5. Between 2009 and 2015, 85 fair housing complaints were filed in Miami Gardens. Of the
85 filed complaints, only two have a “right to sue” status. 17 complaints were found to
have no cause, 7 cases were withdrawn, 15 cases have not moved forward due to the
complainant’s failure to cooperate, 5 cases were settled with benefits, and 38 cases are
still open.
6. Three fair housing lawsuits have been resolved since the last Analysis of Impediments
was issued. Collectively, the lawsuits address discrimination on the basis of race, familial
status, disability, and sex. One additional case was filed, although information about its
details or status is unavailable.
7. Home Mortgage Disclosure Act (HDMA) data indicates that African-American borrowers
receive a disproportionately low share of market-rate loans: the group makes up 76% of
the population of Miami Gardens yet accounts for only 50% of the prime loans. Hispanic
borrowers (23% of the population) receive a higher-than-expected share of high-cost
loans (58%). Additionally, low- and moderate-income borrowers receive a
disproportionately low share of all mortgage loans.
8. African-American borrowers in Miami Gardens were denied single family loans 34.7
percent of the time, similar to white non-Hispanic borrowers who were rejected 32.4
percent of the time. In contrast, Hispanic borrowers were denied a much lower 20.9
percent of time. LMI borrowers, meanwhile, were denied loans 1.32 times as often as
more affluent borrowers.

9
9. The Housing Element of Miami Gardens’ Comprehensive Plan calls for certain progressive
land use policies that are not reflected in the Land Development Code (LDC). Specifically,
the LDC does not authorize Accessory Dwelling Units (ADUs), even though the SHIP Local
Housing Assistance Plan lists ADUs as an incentive strategy. The LDC also fails to
authorize Single Room Occupancy (SRO) developments. Other elements in the LDC,
including minimum setbacks, lot frontage, and building square footage, could be relaxed
in some zoning districts to reduce the cost of housing development.
10. The LDC provides incentives to developers to build workforce housing (affordable to
households between 65% and 200% AMI). However, the LDC does not provide a specific
schedule of incentives based on a development’s percentage of workforce housing units
or their targeted income brackets.
IV. ACTIONS TAKEN TO REDUCE IMPEDIMENTS
The City’s 2008 Analysis of Impediments identified five (5) impediments to fair housing choice
evident in the City of Miami Gardens:
1. Violations of federal, state, and local fair housing laws in the jurisdiction and
immediate surrounding areas
2. Lack of awareness of fair housing laws, issues and resources
3. Racial disparities in fair and equal lending
4. A strongly segregated housing market
5. Limited funding availability for the creation of affordable housing opportunities
To address these impediments, the City of Miami Gardens and its partners have taken the
following steps:
Workshops have been provided to first-time homebuyers, with information on fair
housing laws included.
HOPE, Inc. provided fair housing training for housing providers in the Opa-Locka/Miami

10
Gardens area.
HOPE, Inc. provided training on fair lending practices for Miami Gardens Department of
Community Development staff.
Brochures in English, Spanish and Creole on fair housing, housing discrimination, and
reporting continued to be made available to the public at City departments, and are
given to all housing program participants.
Between 2011 and 2015, the City has purchased 79 foreclosed and abandoned homes, of
which 69 have been sold to income-eligible first-time homebuyers, and 2 have been
conveyed to nonprofit entities for rental to individuals at or below 50% AMI.
V. CONCLUSIONS AND RECOMMENDATIONS
Our analysis identified six (6) major impediments to fair housing choice. Each impediment is
listed below, along with the strategies proposed to address it.
1. Lack of sufficient affordable housing options
Strategies:
I. Improve collaboration with County affordable housing efforts to expand the supply of
safe, decent and affordable housing available in the City.
II. Collaborate with area housing developers who provide additional affordable housing
options
III. Provide information and technical assistance on housing development programs
IV. Emphasize mixed income housing in all neighborhoods
V. Support pre-purchase counseling programs
2. Lack of initiatives to affirmatively further fair housing
Strategies:
I. Overhaul marketing strategies for all counseling, rehabilitation, and public services
11
II. Ensure equal inclusion in housing programs for minorities, the LGBT community, and
other protected classes in Miami Gardens
III. Provide technical assistance in affirmative marketing to recipients of City-
administered housing development funds
IV. Provide fair housing training for City government staff, community advocates,
housing providers, and financial institutions
V. Update Limited English Proficiency plan to ensure persons with limited English
proficiency have meaningful access to all housing programs and activities, whether
publicly or privately provided. Deliver multi-language format presentations to
community members
3. A strongly segregated housing market
Strategies:
I. Undertake an analysis of housing utilizing the new AFH Assessment Tool
II. Encourage mixed-income development in areas with a high concentration of poverty
or a single racial group
III. Encourage development of affordable housing for low- and moderate-income
households in high-opportunity neighborhoods
4. Incomplete government support system for fair housing
Strategies:
I. Work with Miami-Dade County to obtain substantial equivalency certification for the
County’s fair housing ordinance
II. Work with appropriate County offices, HOPE, Inc., and the HUD Miami Field Office as
necessary to improve coordination of the system for receiving and tracking fair
housing complaints
III. Provide training for the City’s Mayor, Council, and Manager to ensure that the City is
affirmatively furthering fair housing in all housing and housing-related activities,
whether publicly or privately provided

12
5. Discriminatory lending practices
Strategies:
I. Develop and deliver targeted marketing efforts to increase minority and low-income
participation in credit counseling and home ownership programs
II. Expand credit counseling programs for both potential homebuyers and existing
homeowners
III. Expand financial literacy training programs for both potential homebuyers and
existing homeowners
6. Restrictive land use and zoning regulations
Strategies:
I. Update the LDC to include provisions for Accessory Dwelling Units and Single Room
Occupancy developments
II. Provide a specific schedule of incentives for workforce housing
III. Ease requirements for residential development, such as minimum unit sizes and
setbacks
The document concludes with a Fair Housing Plan, which provides five (5) goals for Affirmatively
Furthering Fair Housing (listed below). Each goal is accompanied by a list of activities for the City
of Miami Gardens to undertake in collaboration with its partners.
Goal #1: Reduce the incidence of housing discrimination
Goal #2: Educate the community about its rights and responsibilities regarding fair
housing
Goal #3: Reduce discriminatory and abusive practices in lending
Goal #4: Promote integration and diversity within the City of Miami Gardens
Goal #5: Provide more affordable housing
13
I. INTRODUCTION
A. HISTORY AND PURPOSE
The Federal Fair Housing Act, Section 808(e)(5), requires the Secretary of the U.S. Department of
Housing and Urban Development (HUD or “the Department”) to administer the Department’s
housing and urban development programs in a manner that affirmatively furthers fair housing
(AFFH). All local governments that directly receive Community Development Block Grant (CDBG)
funds from HUD are required to conduct an assessment of the barriers to housing choice and to
develop a plan for overcoming the impediments identified. Although the grantee’s AFFH
obligation arises in connection with the receipt of federal funding, its AFFH obligation is not
restricted to the design and operation of HUD-funded programs. The AFFH obligation extends to
all housing and housing-related activities in the grantee’s jurisdictional area whether publicly or
privately funded.3
For the past two decades, HUD has required grantees of its Community Planning & Development
(CPD) programs, which includes CDBG, to periodically prepare an Analysis of Impediments to Fair
Housing Choice. The Analysis of Impediments (AI) document provides demographic and
economic context for a HUD grantee’s fair housing landscape; reviews the grantee’s legal and
institutional framework for fair housing enforcement; identifies recent enforcement activities,
disparities, and accomplishments related to fair housing choice; and provides recommendations
for ongoing efforts to affirmatively further fair housing.
In July 2015, HUD issued a Final Rule on Affirmatively Furthering Fair Housing, which clarified and
simplified existing requirements for grantees, and replaced the required Analysis of Impediments
with an Analysis of Fair Housing (AFH). To help grantees plan, implement, and monitor actions
to affirmatively further fair housing more effectively, HUD provides a standardized template and
public datasets for completion of the AFH. The timeline for preparing the first AFH documents is
3 U.S. Department of Housing and Urban Development, Office of Fair Housing and Equal Opportunity,
Fair Housing Planning Guide, Chapter 1, Section 1.2, 1-1
14
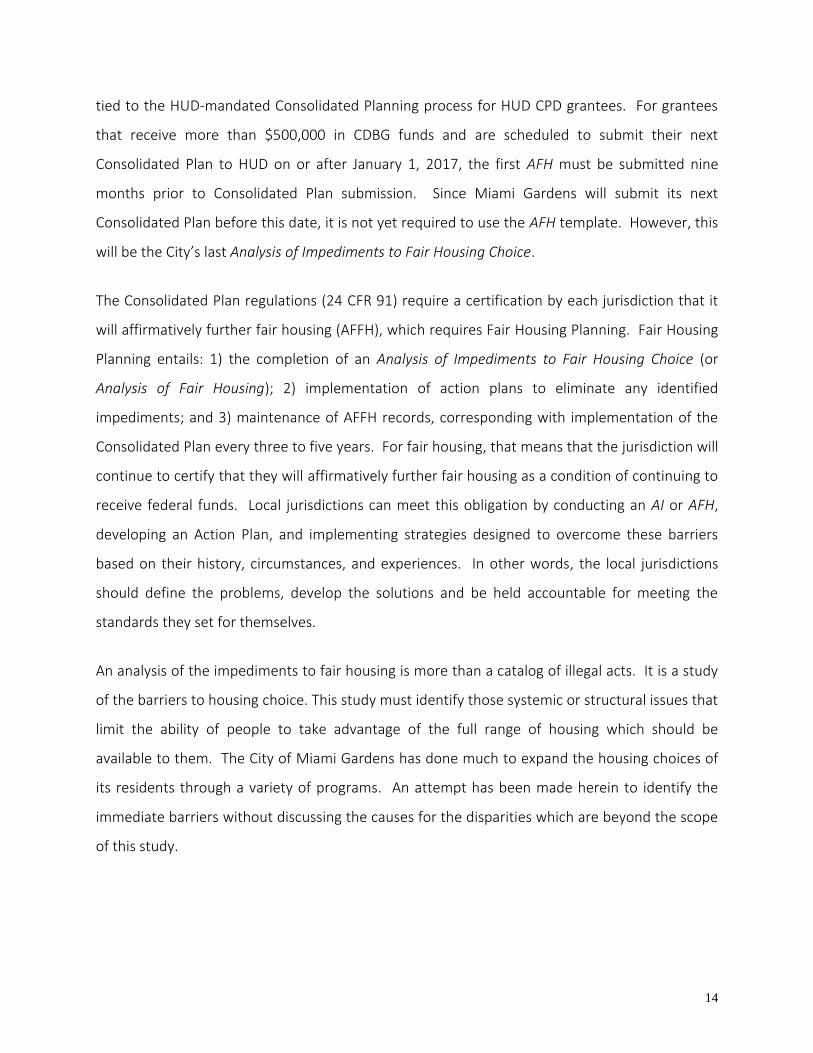
tied to the HUD-mandated Consolidated Planning process for HUD CPD grantees. For grantees
that receive more than $500,000 in CDBG funds and are scheduled to submit their next
Consolidated Plan to HUD on or after January 1, 2017, the first AFH must be submitted nine
months prior to Consolidated Plan submission. Since Miami Gardens will submit its next
Consolidated Plan before this date, it is not yet required to use the AFH template. However, this
will be the City’s last Analysis of Impediments to Fair Housing Choice.
The Consolidated Plan regulations (24 CFR 91) require a certification by each jurisdiction that it
will affirmatively further fair housing (AFFH), which requires Fair Housing Planning. Fair Housing
Planning entails: 1) the completion of an Analysis of Impediments to Fair Housing Choice (or
Analysis of Fair Housing); 2) implementation of action plans to eliminate any identified
impediments; and 3) maintenance of AFFH records, corresponding with implementation of the
Consolidated Plan every three to five years. For fair housing, that means that the jurisdiction will
continue to certify that they will affirmatively further fair housing as a condition of continuing to
receive federal funds. Local jurisdictions can meet this obligation by conducting an AI or AFH,
developing an Action Plan, and implementing strategies designed to overcome these barriers
based on their history, circumstances, and experiences. In other words, the local jurisdictions
should define the problems, develop the solutions and be held accountable for meeting the
standards they set for themselves.
An analysis of the impediments to fair housing is more than a catalog of illegal acts. It is a study
of the barriers to housing choice. This study must identify those systemic or structural issues that
limit the ability of people to take advantage of the full range of housing which should be
available to them. The City of Miami Gardens has done much to expand the housing choices of
its residents through a variety of programs. An attempt has been made herein to identify the
immediate barriers without discussing the causes for the disparities which are beyond the scope
of this study.
15
B. WHO CONDUCTED THE ANALYSIS?
The City of Miami Gardens contracted with the Florida Housing Coalition (the Coalition) to
update its Analysis of Impediments, which was last published in 2008. The Coalition is a
statewide not-for-profit corporation established in 1982 as a nonprofit membership
organization, and is recognized as Florida’s foremost authority on affordable housing training
and technical assistance. The Coalition provides technical assistance nationwide for grantees of
HUD Community Planning and Development programs including CDBG and CDBG-DR, ESG, CoC,
and NSP.
For Consolidated Planning and Analysis of Impediments to Fair Housing work, the Coalition’s
philosophy is first and foremost to respect the community vision for housing and then to
coordinate available resources in the most efficient manner. The organization has a proven
ability to help local governments exceed HUD’s requirements for citizen participation and
stakeholder consultation, while developing goals, priorities, and recommendations that are
supported both by data and public feedback.
C. METHODOLOGY
HUD’s Fair Housing Planning Guide was utilized in the preparation of this Analysis of
Impediments to Fair Housing Choice. To construct a demographic, economic, and housing profile
of Miami Gardens, we used data from the U.S. Census Bureau’s American Community Survey and
the Shimberg Center for Housing Studies at the University of Florida. To assess the amount of
fair housing enforcement activity in Miami Gardens, we obtained data on fair housing complaints
from the HUD Miami Field Office, as well as information on fair housing lawsuits filed. We
hosted two public meetings and conducted an online community survey to gauge public
awareness of fair housing laws and perceptions of fair housing violations, and reviewed the
existing legal and institutional structure for fair housing education and enforcement (including
both public and private agencies) to identify gaps. We analyzed Home Mortgage Disclosure Act
(HMDA) data for Miami Gardens to investigate possible disparities in mortgage lending, and

16
reviewed the City’s policy and regulatory documents related to housing development to identify
provisions that help or hinder fair housing choice. Additionally, the City of Miami Gardens
provided information on fair housing accomplishments since the last Analysis of Impediments
was published. In the Conclusions and Recommendations section of this document, information
on the strengths and gaps of Miami Gardens’ system for promoting fair housing choice is
synthesized to provide a blueprint going forward.
D. FUNDING
The City of Miami Gardens executed an agreement with the Florida Housing Coalition, Inc.
effective October 22, 2015 to update the City’s Analysis of Impediments. Community
Development Block Grant (CDBG) funds were utilized to fund this effort.
II. JURISDICTION’S DEMOGRAPHIC, ECONOMIC AND HOUSING PROFILE
The City of Miami Gardens was incorporated on May 13, 2003 as the 33rd city in Miami-Dade
County, and is the third largest city in the County (after Miami and Hialeah). The City is located
in North-Central Miami-Dade County and covers an area of approximately 20 square miles.
Miami Gardens borders Broward County to the north, the City of Miami Lakes and
Unincorporated Miami-Dade County to the west, the City of Opa-Locka to the south, and the City
of North Miami Beach and unincorporated Miami-Dade County to the east (see Figure 1). The
City of Miami Gardens is comprised of seven communities identified as Census Designated Places
(CDP) in the 2000 Census: Andover CDP, portions of Carol City CDP, Scott Lake CDP, portions of
Norland CDP, portions of Lake Lucerne CDP, Opa-Locka North CDP, and Bunche Park CDP. Miami
Gardens is an urban/suburban community that was heavily developed between 1950 and 1969.
It is a solid, working and middle class community of unique diversity and holds the distinction of
being the largest predominantly African-American municipality in the State of Florida.

17
Figure 1. City of Miami Gardens

18
A. POPULATION
Race and Ethnicity
Table 1 shows Miami Gardens’ population by race and ethnicity in 2010 and 2014. According to
the 2010-2014 American Community Survey, Miami Gardens has an estimated population of
110,867 – an increase of 2.9% since 2010. The City is reported to be 76% Black or African
American, 2.4% non-Hispanic White, 0.7% Asian, and 0.1% American Indian and Alaskan Native.
Persons of Hispanic or Latino ethnic origin are 24.2% of the population. Based on these
estimates the population of Black and African Americans increased slightly by 3%, non-Hispanic
Whites decreased 5%, and Hispanics and Latinos increased 14%. Furthermore, about 30% of the
residents of Miami Gardens are foreign-born (32,924).
Table 1: Race and Ethnicity of Miami Gardens Residents
The following series of maps displays the concentration of population in the City of Miami
Gardens. According to the 2014 ACS, the northern and western areas of the City were the most
densely populated (Figure 2). The lightest shaded areas have the lowest concentration of
population, and the concentration increases as the shade darkens.
Race 2010 % 2014 %
White 19,625 18.3% 22,882 20.6%
Black or African American 81,776 76.3% 84,216 76.0%
American Indian and Alaskan Native 264 0.2% 86 0.1%
Asian 643 0.6% 827 0.7%
Native Hawaiian and Pacific Islander 30 0.0% 138 0.1%
Some other race 2,421 2.3% 1,709 1.5%
Two or more races 2,408 2.2% 1,009 0.9%
Ethnicity 2010 % 2014 %
Hispanic or Latino (of any race) 23,606 22.0% 26,835 24.2%
White (alone) 2,806 2.6% 2,661 2.4%
Total 107,167 100% 110,867 100%
Data Source: Census 2010, 2010-2014 American Community Survey 5-Yr Estimates (DP05)

19
Figure 2: Miami Gardens Population by Census Block Group

20
According to the 2014 ACS,
Blacks or African Americans
are the predominant race
group in Miami Gardens,
though the population is
more heavily concentrated in
the eastern portion of the
City (Figure 3). The lightest
blue areas have a Black or
African American population
of 54.9% or less, while darker
blue areas have a higher
concentration of African-
American residents.
Figure 3: Miami Gardens Black Population by Census Block Group
21
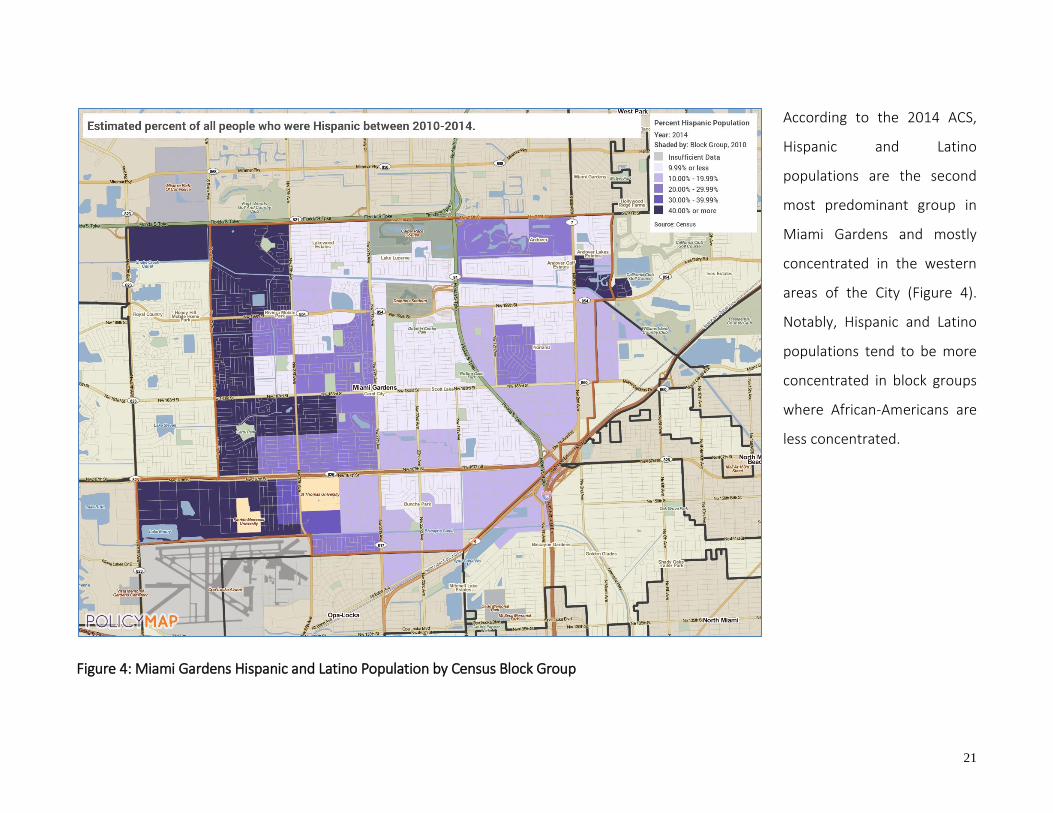
According to the 2014 ACS,
Hispanic and Latino
populations are the second
most predominant group in
Miami Gardens and mostly
concentrated in the western
areas of the City (Figure 4).
Notably, Hispanic and Latino
populations tend to be more
concentrated in block groups
where African-Americans are
less concentrated.
Figure 4: Miami Gardens Hispanic and Latino Population by Census Block Group
22
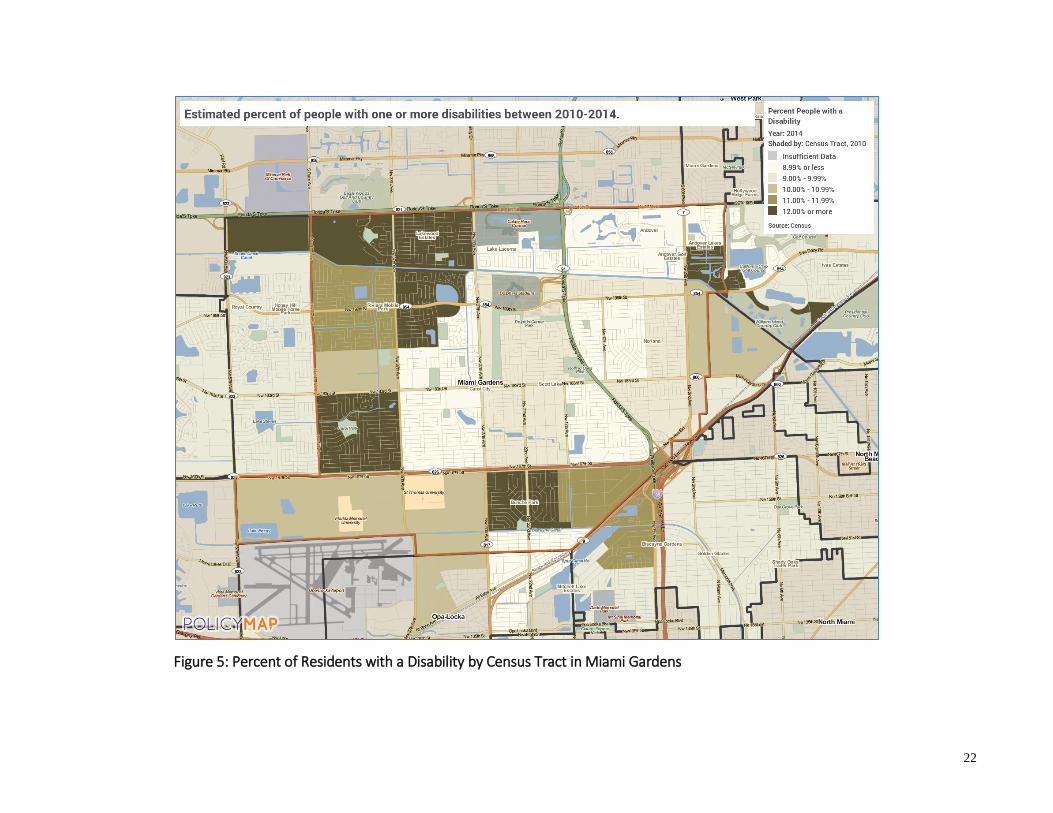
Figure 5: Percent of Residents with a Disability by Census Tract in Miami Gardens

23
Disability
Approximately 9.7% (10,714) of the City’s population has a disability, although the share of
people 65 years and older with a disability rises to 37.7% (4,738). Notably, although American
Indian and Alaskan Natives represent a small portion of the population, 54.7% have a disability –
more than five times the citywide rate. (2010-2014 ACS)
Miami Gardens residents with disabilities are not evenly distributed across the City (Figure 5).
Persons with disabilities are most concentrated in a northeastern Census tract in the Andover
Lakes area, which has a high elderly population and includes the Robert Sharp Towers, a
subsidized elderly housing development. Comparing the geographic distribution of people with
disabilities to that of the poverty rate (see the 2016-2020 Consolidated Plan), several Census
tracts with moderate or high concentrations of people with disabilities also have moderate or
high poverty rates.
Age
Approximately 27.2% (31,103) of the City’s population is 19 years and under, and 6.1% (6,753) is
under the age of 5. Households with own children under 18 years of age make up 26.6% of all
total households in Miami Gardens (8,332). Elders (65 and older) represent 11.3% (12,559) of
the total population of the City (2010-2014 ACS).
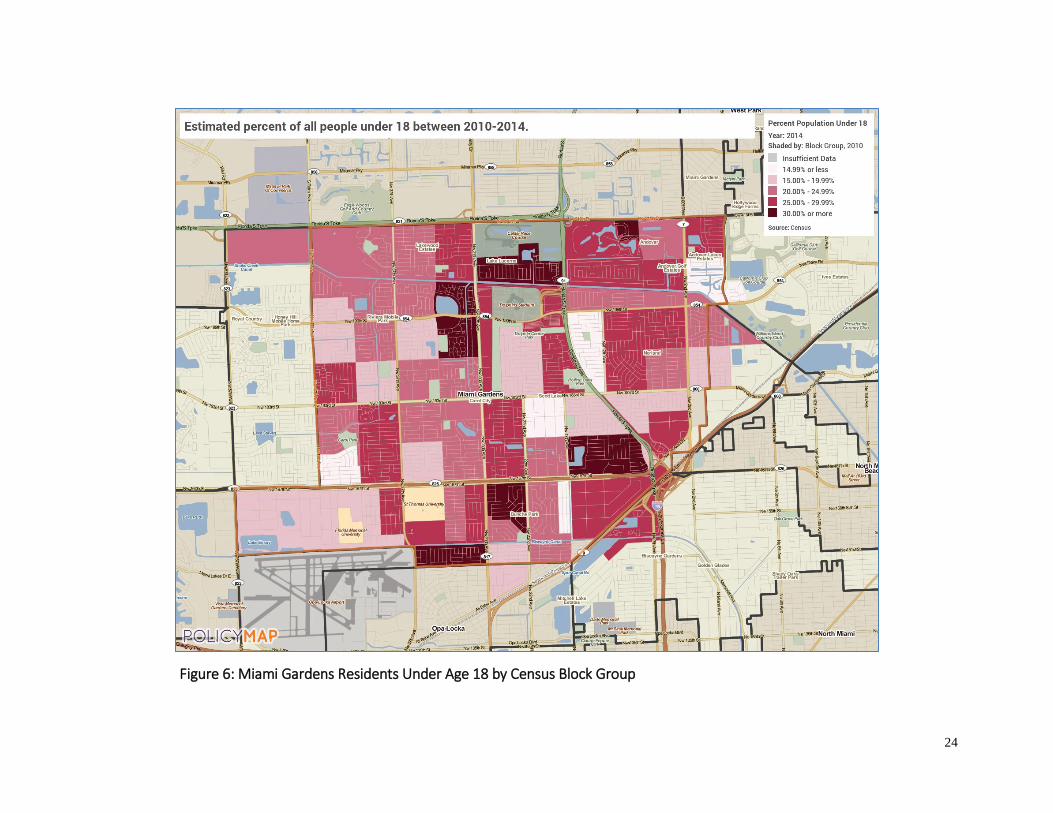
Figure 6 shows the distribution of children under age 18 in Miami Gardens by block group. The
lightest shaded areas have the lowest concentration of children. The highest concentrations of
children are in several eastern and central Census block groups, but moderate concentrations of
children are found throughout the City.
24
Figure 6: Miami Gardens Residents Under Age 18 by Census Block Group
25
Figure 7: Miami Gardens Residents Aged 65 and Over by Census Block Group
26
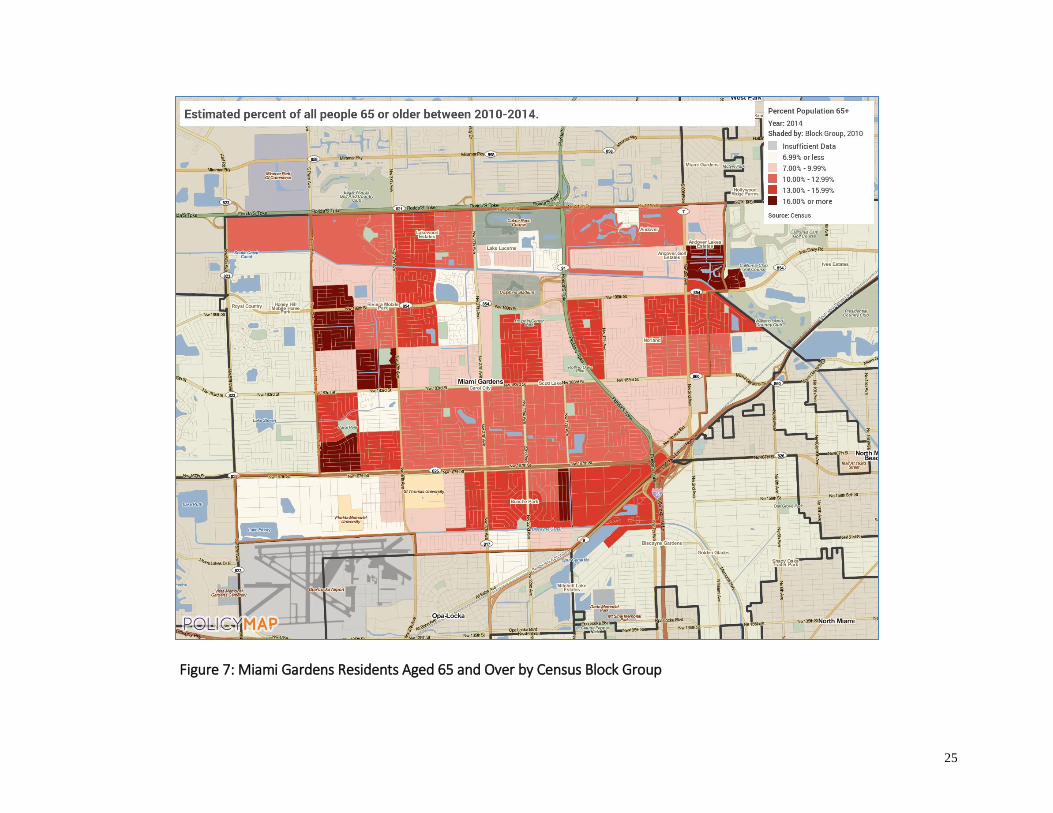
Figure 7 shows the distribution of elders aged 65 and over in Miami Gardens by block group.
The lightest red shaded areas represent the lowest concentration of elders, and the
concentration increases as the shade darkens. There is some overlap between the distribution
of elders and people with disabilities, but areas of moderate or high elderly concentration are
more widespread. The block groups with the highest concentrations of elders are near the City
limits, but block groups with moderate concentrations of elders are spread throughout the City.
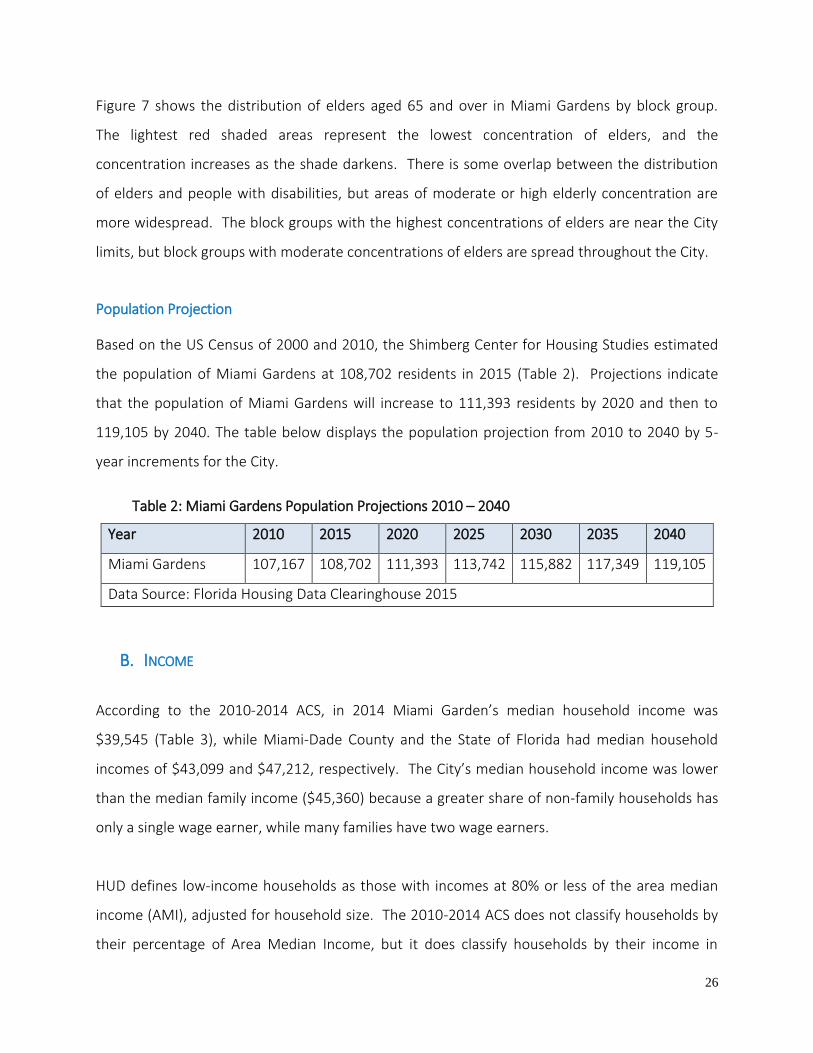
Population Projection
Based on the US Census of 2000 and 2010, the Shimberg Center for Housing Studies estimated
the population of Miami Gardens at 108,702 residents in 2015 (Table 2). Projections indicate
that the population of Miami Gardens will increase to 111,393 residents by 2020 and then to
119,105 by 2040. The table below displays the population projection from 2010 to 2040 by 5-
year increments for the City.
Table 2: Miami Gardens Population Projections 2010 – 2040
Year 2010 2015 2020 2025 2030 2035 2040
Miami Gardens 107,167 108,702 111,393 113,742 115,882 117,349 119,105
Data Source: Florida Housing Data Clearinghouse 2015
B. INCOME
According to the 2010-2014 ACS, in 2014 Miami Garden’s median household income was
$39,545 (Table 3), while Miami-Dade County and the State of Florida had median household
incomes of $43,099 and $47,212, respectively. The City’s median household income was lower
than the median family income ($45,360) because a greater share of non-family households has
only a single wage earner, while many families have two wage earners.
HUD defines low-income households as those with incomes at 80% or less of the area median
income (AMI), adjusted for household size. The 2010-2014 ACS does not classify households by
their percentage of Area Median Income, but it does classify households by their income in

27
absolute dollar amounts. As of the latest ACS, 14,074 (44.9%) had an MHI of $34,999 or less; by
comparison, 80% of the City’s median household income is $31,636. Table 3 and Table 4 display
incomes for households and families, respectively.
Table 3: Household Income and Benefits in Miami Gardens
Household Income Number of Households
% of Households
Less than $10,000 3,126 10.0%
$10,000 to $14,999 2,264 7.2%
$15,000 to $24,999 4,608 14.7%
$25,000 to $34,999 4,076 13.0%
$35,000 to $49,999 5,284 16.8%
$50,000 to $74,999 5,490 17.5%
$75,000 to $99,999 3,101 9.9%
$100,000 to $149,999 2,536 8.1%
$150,000 to $199,999 570 1.8%
$200,000 or more 310 1.0%
Median household income (dollars) 39,545 (X)
Mean household income (dollars) 50,133 (X)
With earnings 25,021 79.8%
Mean earnings (dollars) 50,340 (X)
With Social Security 9,740 31.1%
Mean Social Security income (dollars) 14,610 (X)
With retirement income 4,445 14.2%
Mean retirement income (dollars) 22,151 (X)
With Supplemental Security Income 2,541 8.1%
Mean Supplemental Security Income (dollars) 8,755 (X)
With cash public assistance income 1,053 3.4%
Mean cash public assistance income (dollars) 2,689 (X)
With Food Stamp benefits in the past 12 months 9,024 28.8%
Total households 31,365 (X)
Data Source: 2010-2014 American Community Survey 5-Yr Estimates (DP03)
28
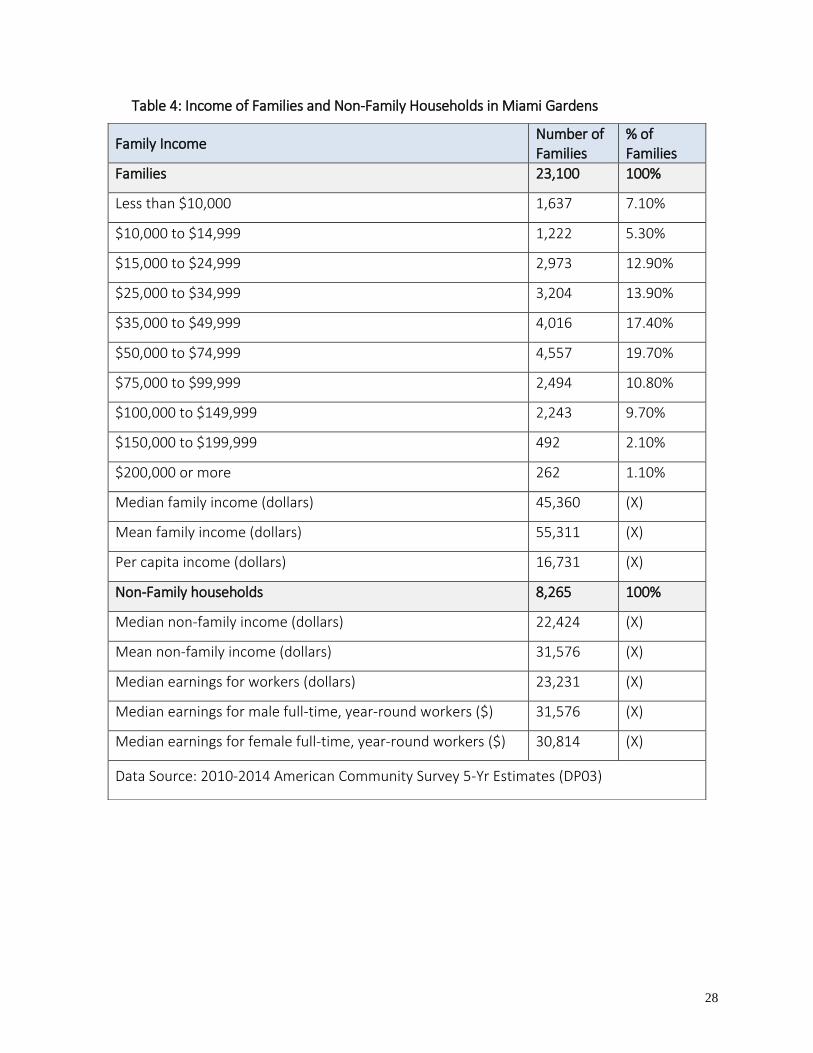
Table 4: Income of Families and Non-Family Households in Miami Gardens
Family Income Number of Families
% of Families
Families 23,100 100%
Less than $10,000 1,637 7.10%
$10,000 to $14,999 1,222 5.30%
$15,000 to $24,999 2,973 12.90%
$25,000 to $34,999 3,204 13.90%
$35,000 to $49,999 4,016 17.40%
$50,000 to $74,999 4,557 19.70%
$75,000 to $99,999 2,494 10.80%
$100,000 to $149,999 2,243 9.70%
$150,000 to $199,999 492 2.10%
$200,000 or more 262 1.10%
Median family income (dollars) 45,360 (X)
Mean family income (dollars) 55,311 (X)
Per capita income (dollars) 16,731 (X)
Non-Family households 8,265 100%
Median non-family income (dollars) 22,424 (X)
Mean non-family income (dollars) 31,576 (X)
Median earnings for workers (dollars) 23,231 (X)
Median earnings for male full-time, year-round workers ($) 31,576 (X)
Median earnings for female full-time, year-round workers ($) 30,814 (X)
Data Source: 2010-2014 American Community Survey 5-Yr Estimates (DP03)
29
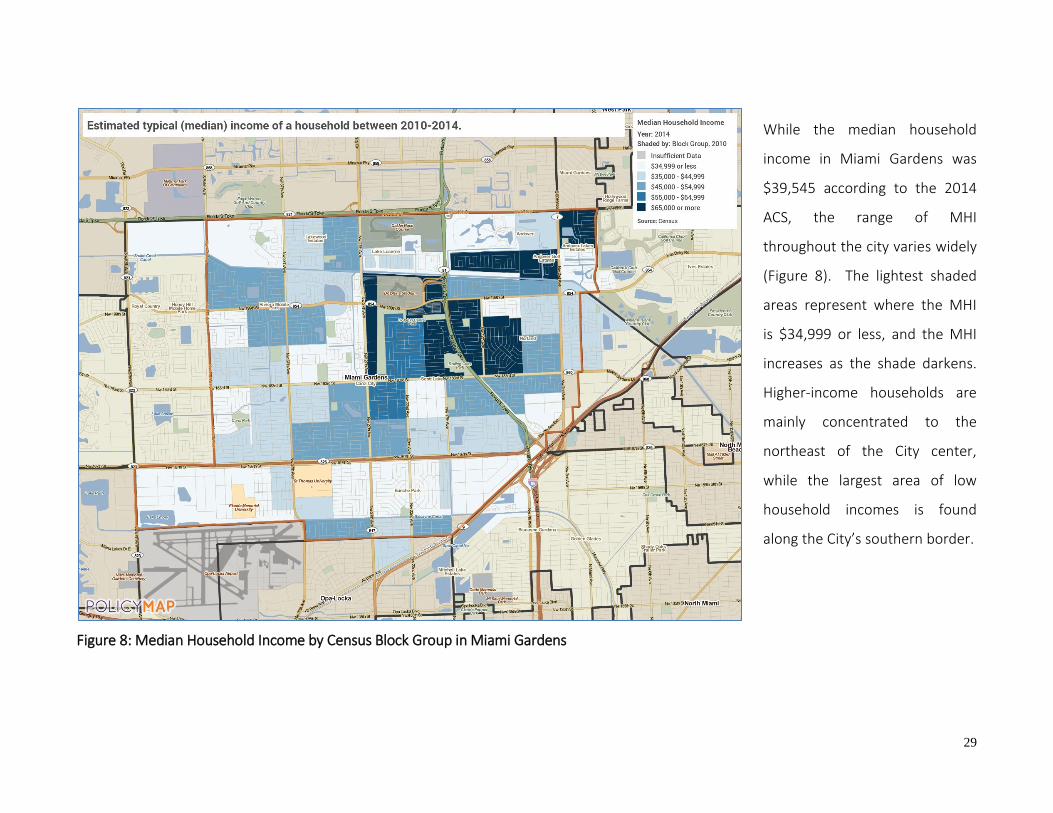
While the median household
income in Miami Gardens was
$39,545 according to the 2014
ACS, the range of MHI
throughout the city varies widely
(Figure 8). The lightest shaded
areas represent where the MHI
is $34,999 or less, and the MHI
increases as the shade darkens.
Higher-income households are
mainly concentrated to the
northeast of the City center,
while the largest area of low
household incomes is found
along the City’s southern border.
Figure 8: Median Household Income by Census Block Group in Miami Gardens
30
C. EMPLOYMENT
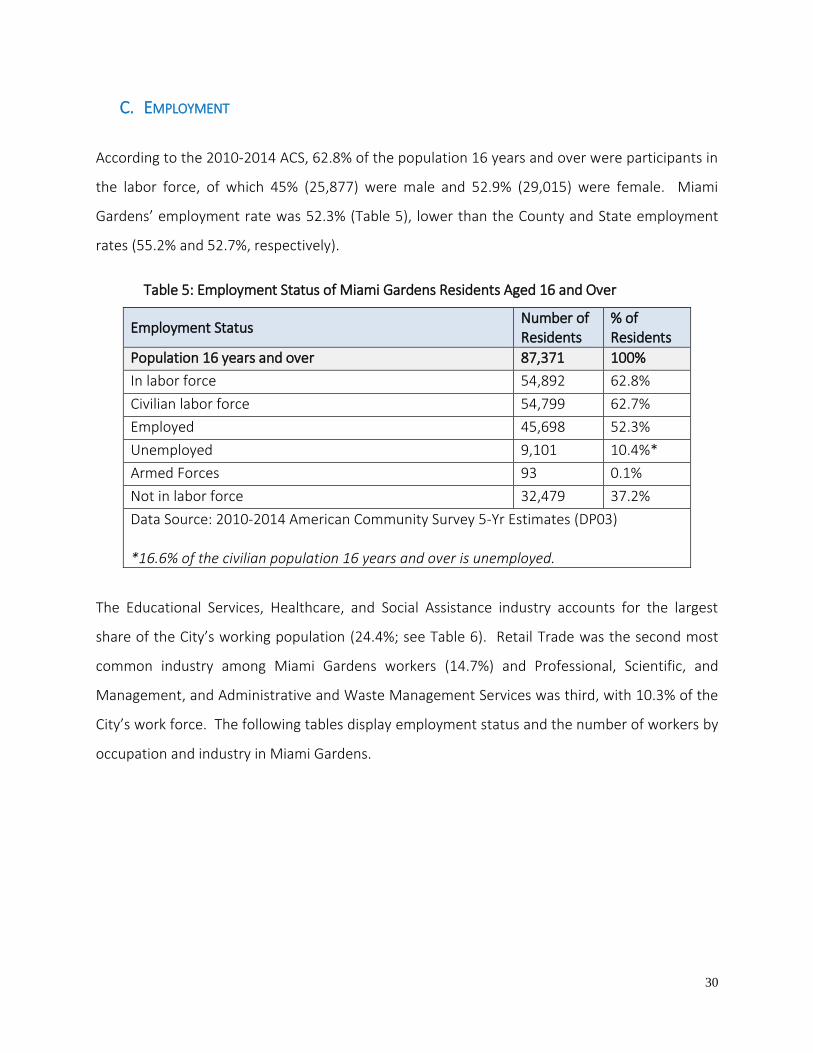
According to the 2010-2014 ACS, 62.8% of the population 16 years and over were participants in
the labor force, of which 45% (25,877) were male and 52.9% (29,015) were female. Miami
Gardens’ employment rate was 52.3% (Table 5), lower than the County and State employment
rates (55.2% and 52.7%, respectively).
Table 5: Employment Status of Miami Gardens Residents Aged 16 and Over
Employment Status Number of Residents
% of Residents
Population 16 years and over 87,371 100%
In labor force 54,892 62.8%
Civilian labor force 54,799 62.7%
Employed 45,698 52.3%
Unemployed 9,101 10.4%*
Armed Forces 93 0.1%
Not in labor force 32,479 37.2%
Data Source: 2010-2014 American Community Survey 5-Yr Estimates (DP03) *16.6% of the civilian population 16 years and over is unemployed.
The Educational Services, Healthcare, and Social Assistance industry accounts for the largest
share of the City’s working population (24.4%; see Table 6). Retail Trade was the second most
common industry among Miami Gardens workers (14.7%) and Professional, Scientific, and
Management, and Administrative and Waste Management Services was third, with 10.3% of the
City’s work force. The following tables display employment status and the number of workers by
occupation and industry in Miami Gardens.

31
Table 6: Occupations and Industries of Miami Gardens Workers (Civilians 16 and Over) Occupation & Industry Number of
Residents % of Residents
Civilian employed population 16 years and over 45,698 100%
OCCUPATION
Management, professional, and related occupations 10,292 22.5%
Service occupations 11,736 25.7%
Sales and office occupations 13,476 29.5%
Natural resources, construction, and maintenance occupations 4,107 9.0%
Production, transportation, and material moving occupations 6,087 13.3%
INDUSTRY
Agriculture, forestry, fishing and hunting, and mining 152 0.3%
Construction 2,684 5.9%
Manufacturing 1,985 4.3%
Wholesale trade 1,149 2.5%
Retail trade 6,713 14.7%
Transportation and warehousing, and utilities 3,745 8.2%
Information 917 2.0%
Finance and insurance, and real estate and rental and leasing 1,614 3.5%
Professional, scientific, and management, and administrative and waste management services 4,690 10.3%
Educational services, health care, and social assistance 11,163 24.4%
Arts, entertainment, and recreation, and accommodation, and food services 4,238 9.3%
Other services, except public administration 2,713 5.9%
Public administration 3,935 8.6%
Data Source: 2010-2014 American Community Survey 5-Yr Estimates (DP03)
32
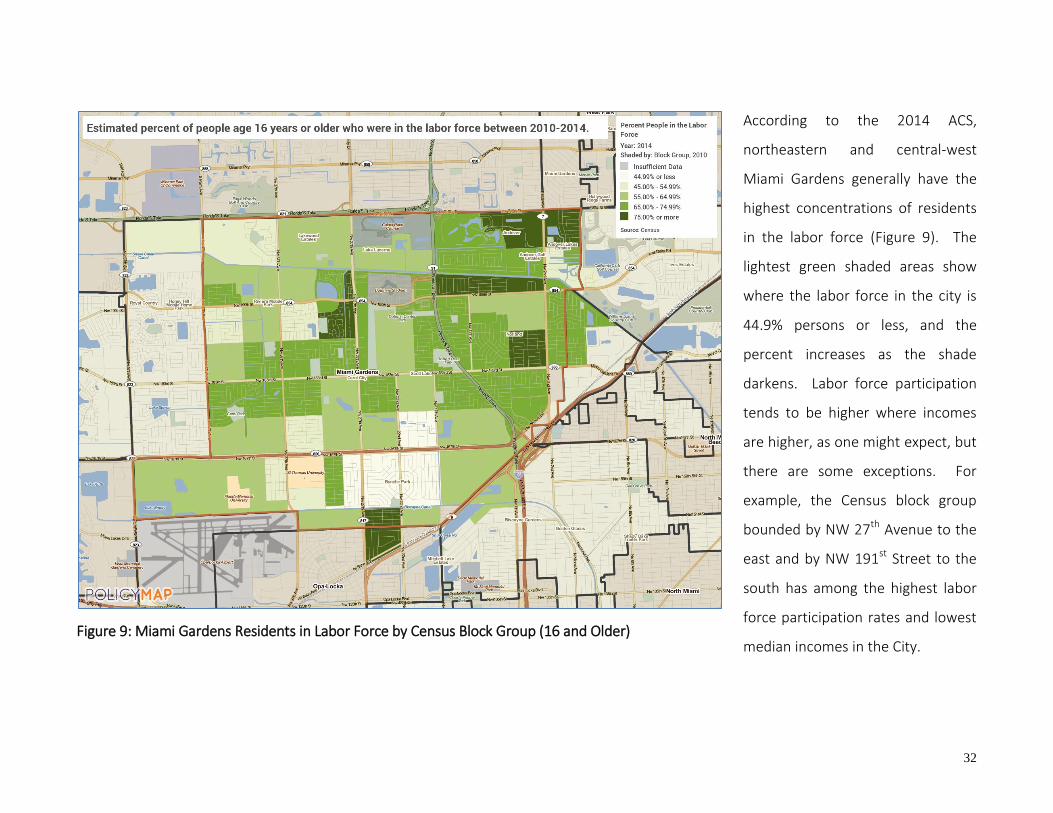
According to the 2014 ACS,
northeastern and central-west
Miami Gardens generally have the
highest concentrations of residents
in the labor force (Figure 9). The
lightest green shaded areas show
where the labor force in the city is
44.9% persons or less, and the
percent increases as the shade
darkens. Labor force participation
tends to be higher where incomes
are higher, as one might expect, but
there are some exceptions. For
example, the Census block group
bounded by NW 27th Avenue to the
east and by NW 191st Street to the
south has among the highest labor
force participation rates and lowest
median incomes in the City.
Figure 9: Miami Gardens Residents in Labor Force by Census Block Group (16 and Older)

33
D. HOUSING
Miami Gardens had an estimated 35,154 housing units in 2014 according to the ACS 5-Year
Estimates, with 26,703 units in structures with 4 or fewer units, 8,110 units in structures with 5
or more units, and 341 mobile homes. Single-family detached homes are by far the most
common housing type in the City, accounting for 67.6% of units (23,770 units). Units in
structures with 20 or more units (large apartment and condominium complexes) are the second
most common housing type, accounting for 12.9% of units (4,550 units).
Of the 35,154 total units reported in the 2014 ACS, an estimated 31,365 units were occupied
(89.2%), leaving 3,789 units (10.8%) vacant. The 2000 Census reported a vacancy rate of 5.6%
for the areas that now comprise Miami Gardens, which means the vacancy rate has nearly
doubled in the last decade. Of the total occupied units in 2014, approximately 20,920, or 66.7%,
were owner-occupied, while 10,445, or 33.3%, were renter occupied. This is a reduction in both
owner occupied units and percentage of units occupied by homeowners in the areas comprising
Miami Gardens since the 2000 Census, which was 22,052 and 75%, respectively.
Table 7: Age of Miami Gardens Housing Units
Year Structure Built Number of Units % of Units
2010 or Later 47 0.1%
2000-2009 2,996 8.5%
1990-1999 2,430 6.9%
1980-1989 2,962 8.4%
1970-1979 7,111 20.2%
1960-1969 8,258 23.5%
1950-1959 10,297 29.3%
1940-1949 852 2.4%
1939 or Earlier 201 0.6%
Total 35,154 35,154
Data Source: American Community Survey 2010-2014 5 Year Estimates (DP04)
Table 7 above provides data on the age of the housing stock for Miami Gardens. The largest
cohort of housing units – 29.3% of units - were built between 1950 and 1959, while the second
34
largest cohort (23.5%) was built between 1960 and 1969.
Housing Costs and Cost Burden
In 2014 the median gross monthly rent for renter-occupied units in the City was approximately
$1,069, which is an increase of 11.4% when compared to the 2010 ACS ($960). This increase is
higher in comparison to Miami-Dade County as a whole where the median rent is $1,098, a 9.4%
increase from 2010.
The value of owner-occupied Miami Gardens units decreased substantially from the 2010 5-year
ACS to the 2014 5-year ACS. The estimated median home value was $203,100 in 2010 and
$129,200 in 2014, compared to $194,100 for Miami-Dade in 20144. In Miami Gardens
approximately 60.3% of owner-occupied units are valued at less than $150,000.
Shimberg Center data on home sales captures trends in real time more effectively than 5-year
ACS data, and shows that median sale prices for single-family homes and condominiums
increased slightly between 2010 and 2014, from $117,894 to $122,9305. The 2014 median sale
price in Miami Gardens is an appreciable increase over the 2010 median price of $98,908.
HUD considers households to be “cost burdened” if they pay more than 30% of their incomes on
housing costs, including rent or mortgage payments, utilities, property taxes, and homeowner
association or condominium fees, as applicable. Approximately 70.9% of the total renters in
2014 paid more than 30% of household income for gross housing costs, making them “cost
burdened” according to HUD. Moreover, almost 62% of renters are paying 35% or more of their
incomes to housing. The situation is slightly better for homeowners with a mortgage, of which
approximately 59% were cost-burdened, with 49.3% of all homeowners with a mortgage paying
35% or more of their incomes for housing. By contrast, among homeowners without a
4 Note that trends in 5-year ACS data lag behind trends in real time, since these numbers are 5-year averages. Nonetheless, 5-year ACS data is generally better than 1-year ACS data for cities of Miami Gardens’ size, since the former has smaller margins of error. 5 Data on mobile home sales is not available. Shimberg Center data for Miami Gardens home sales does not differentiate between sales to owner-occupiers and sales to investors.
35
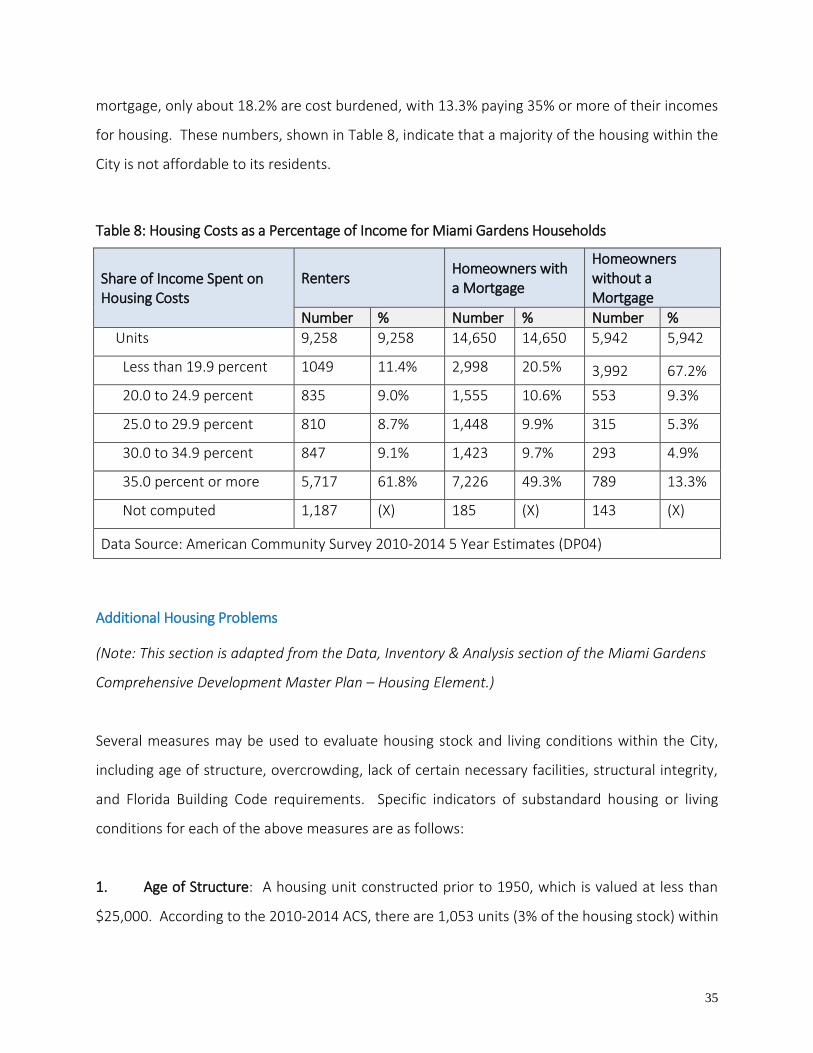
mortgage, only about 18.2% are cost burdened, with 13.3% paying 35% or more of their incomes
for housing. These numbers, shown in Table 8, indicate that a majority of the housing within the
City is not affordable to its residents.
Table 8: Housing Costs as a Percentage of Income for Miami Gardens Households
Share of Income Spent on Housing Costs
Renters Homeowners with a Mortgage
Homeowners without a Mortgage
Number % Number % Number %
Units 9,258 9,258 14,650 14,650 5,942 5,942
Less than 19.9 percent 1049 11.4% 2,998 20.5% 3,992 67.2%
20.0 to 24.9 percent 835 9.0% 1,555 10.6% 553 9.3%
25.0 to 29.9 percent 810 8.7% 1,448 9.9% 315 5.3%
30.0 to 34.9 percent 847 9.1% 1,423 9.7% 293 4.9%
35.0 percent or more 5,717 61.8% 7,226 49.3% 789 13.3%
Not computed 1,187 (X) 185 (X) 143 (X)
Data Source: American Community Survey 2010-2014 5 Year Estimates (DP04)
Additional Housing Problems
(Note: This section is adapted from the Data, Inventory & Analysis section of the Miami Gardens
Comprehensive Development Master Plan – Housing Element.)
Several measures may be used to evaluate housing stock and living conditions within the City,
including age of structure, overcrowding, lack of certain necessary facilities, structural integrity,
and Florida Building Code requirements. Specific indicators of substandard housing or living
conditions for each of the above measures are as follows:
1. Age of Structure: A housing unit constructed prior to 1950, which is valued at less than
$25,000. According to the 2010-2014 ACS, there are 1,053 units (3% of the housing stock) within
36
the City that were constructed prior to 1950. There are also 1,433 specified owner-occupied
units (6.8% of the total) in Miami Gardens valued at less than $50,000 in 2014.
2. Lacking Facilities: A housing unit lacking complete plumbing facilities, heating and
cooking facilities, and/or complete kitchen facilities. The 2010-2014 ACS reported that high
percentages of the year-round housing stock had complete plumbing facilities (99.7%) and
complete kitchen facilities (99.6%). Due to the high level of availability, it is concluded that “lack
of facilities” does not, in itself, raise any issues regarding overall substandard living and housing
conditions within the City.
3. Over-Crowding: 1.01 persons per room or more within a dwelling unit. According to the
2010-2014 ACS, there were an estimated 1,952 households, or 6.3% of the total, reporting
occupancy of more than 1.0 person per room in the City.
4. External Housing Conditions: A housing unit categorized as either of the following by the City
of Miami Gardens.
Deteriorated: Meaning in need of some relatively minor exterior repair, which is
indicative of a lack of maintenance. Examples include: housing that requires painting,
fascias and soffits showing signs of deterioration, cracked and broken windows, and
even severely overgrown yards, which is generally accompanied by a lack of structural
maintenance.
Dilapidated: Meaning in need of substantial rehabilitation. The unit may be
considered to be unfit for human habitation or rapidly approaching that condition.
This category of substandard housing needs to be addressed immediately, through
either rehabilitation or demolition, as the health and safety of the inhabitants may be
endangered.
A general survey oriented to evaluating external housing conditions has not been completed
since incorporation in 2003.
37
5. Code Violations: The City has adopted the Florida Building Code (Miami-Dade & Broward
Edition) that incorporates the following definition for an unsafe structure:
A building deemed a fire hazard, as a result of debris or other combustible material,
creates a hazard, vacant and unguarded; or
A building deemed structurally unsafe by design or deterioration, partially destroyed,
unsafe or lack of adequate plumbing, inadequate or unsafe electrical, inadequate
waste disposal system or lack of a building permit.
The analysis conducted by the City concluded that, while “age of structure” and “value,” in
combination, do not raise any immediate issues regarding overall substandard living and housing
conditions, vigilant code enforcement and conservation efforts will need to be undertaken as a
means to preserve the City’s affordable housing stock.
Given significant changes in home values and rental rates since the 2000 Census, increases in
housing production costs, the current mortgage and credit climate and the continued reduction
of federal funding to local jurisdictions, the City’s ability to produce affordable housing
opportunities for its residents will be adversely impacted.
Housing and Neighborhood Revitalization Resources
The City of Miami Gardens Department of Community Development utilizes the grant funds it
receives from federal and state government sources to help meet local housing needs and
promote the development of a viable urban community. The primary objective of this
Department is to provide decent housing, a suitable living environment and the expansion of
economic opportunities for the neediest residents. The Department serves the City’s very low-,
low- and moderate-income residents by carrying out a wide range of housing and community
development activities such as Homeownership Assistance, Housing Rehabilitation and
Emergency Housing Rehabilitation.

38
The Statutes and Regulations detailed on the following pages govern the Department’s housing
programs.
CDBG Program (Community Development Block Grant):
Federal Statute: Title 1- The Housing and Community Development Act of 1974. 42 U.S.C.-5301
Regulations: 24 CFR 570
SHIP Program (State Housing Initiatives Partnership):
Florida Statute: Chapter 420.907
Regulations: Florida Housing Finance Corporation Rule Chapter 67-37
NSP (Neighborhood Stabilization Program):
Federal Statutes:
Section 1497 of the Dodd-Frank Wall Street Reform and Consumer Protection Act:
Additional Assistance for Neighborhood Stabilization Program [2010]
This Act is the authorizing legislation for the third round of funding for NSP. The law
allocates $1 billion in NSP3 funding. It also amends the 25 percent set-aside requirement
by removing the restriction that allows only abandoned or foreclosed upon homes or
residential properties to be used to meet this requirement. Instead, NSP grantees may
also use vacant or demolished property to meet the set-aside requirement as well.
Division B, Title III of the Housing and Economic Recovery Act (HERA) of 2008 -Emergency
Assistance for the Redevelopment of Abandoned and Foreclosed Homes
This Act is the authorizing legislation for NSP. The law allocates $3.92 billion in NSP1
funding. It also includes requirements related to allocations, timeliness, eligible activities,
income eligibility, national objectives, program income, relocation, purchase discounts,
affordability and sales price, and other requirements.
Regulations: Since NSP is a component of the Community Development Block Grant (CDBG)
Program, the CDBG regulatory structure is the platform used to implement NSP. The regulations
39
created by HUD’s Office of the Assistant Secretary of Community Planning and Development that
pertain to Community Development programs are contained within 24 CFR Part 570. NSP is
governed by CDBG regulations except where specifically waived.
The City of Miami Gardens uses the funding sources governed by the statutes and rules above to
provide the following housing programs:
Housing Rehabilitation Program:
The City’s Housing Rehabilitation Program is currently funded by CDBG and provides assistance
for low- to moderate-income residents Citywide. Given the age of the City’s housing stock,
priority is placed on disaster mitigation and weatherization, improving energy efficiency in these
units by replacing central air conditioning and insulation that are no longer energy efficient, and
addressing building and/or code violations when feasible, along with meeting Housing Quality
Standards (HQS).
Homeownership Assistance Program:
The City’s purchase assistance program provides financial assistance which can be used toward
principal reduction and to pay for reasonable closing cost to low- to moderate-income first-time
homebuyers using SHIP funding. Buyers purchasing single-family homes, townhomes, twin
homes and condominiums are eligible for the program. Under the current Local Housing
Assistance Plan (LHAP) governing the use of SHIP funds in Miami Gardens, the first $10,000 of
homeownership assistance is provided as a 0% interest, deferred payment, forgivable loan, while
any assistance above that amount is provided as a 0% interest amortized loan.
Emergency Rehabilitation Program:
Funded by SHIP, this program provides emergency repair assistance to low- and moderate-
income homeowners to carry out limited repairs to immediately rectify hazardous conditions
that threaten the life, safety and health of the occupants. Funding is provided in the form of a
deferred payment loan which is forgiven at maturity.

40
Neighborhood Stabilization Program (NSP):
Under NSP, the City purchases and rehabilitates foreclosed and abandoned homes that are sold
to low- and moderate-income buyers at the lesser of appraised value or total development costs.
Although the City no longer receives an allocation of NSP funding, program income is still
available for use.
Partnerships:
The City’s affordable housing programs are made possible by its partnerships with a variety of
public and private organizations, particularly mortgage lending partners and homebuyer
counseling agencies. To qualify for home purchase assistance, homebuyers must be approved
for a loan by one of the City’s approved mortgage lenders. Potential homebuyers and
homeowners also benefit from the counseling services offered by several HUD-approved
agencies in Miami Gardens. These services include, but are not limited to, homebuyer education
courses, money and debt management, post-purchase counseling and education on predatory
lending.
Public and Assisted Housing
Public housing units and Housing Choice Vouchers (Section 8) are another important affordable
housing resource in Miami Gardens. The City is included in the service area of the Miami-Dade
County Public Housing and Community Development (PHCD) department. PHCD was formed by
the 2011 merger of the former Miami-Dade Public Housing Agency (MDPHA) and Miami-Dade
County’s Housing and Community Development (HCD) Department. As the sixth largest housing
agency in the nation, PHCD administers nearly 10,000 public housing units and about 16,000
Housing Choice Vouchers. Miami Gardens has 57 public housing units in three developments, as
shown in Table 9. In half of the City’s Census tracts (including parts of Census tracts that extend
beyond the City limits), vouchers are used in 20.44% or more of the rental units present, as
shown in Figure 10.

41
Table 9: Public Housing in Miami Gardens
Public Housing Development Number of Units
Venetian Gardens 52
FHA scattered-site homes 4
Gwen Cherry / New Haven Garden scattered-site unit 1
PHCD is not currently designated by HUD as a “troubled” Public Housing Authority. The former
MHDPA was taken into HUD receivership in late 2007, and local control was returned in January
2009. The agency’s merger with the Housing and Community Development Department has
helped to focus future planning efforts as well as current operations. PHCD’s most recent Public
Housing Assessment System (PHAS) score for the quality of its public housing stock and
management, calculated for the fiscal year ending 9/30/2013, is 65 out of 100 possible points
and is designated “Substandard Management”. The agency’s Section 8 Management
Assessment Program (SEMAP) score, which measures the effectiveness of waitlist management,
the physical quality of voucher units, and the quality of financial management, was 93% in the
fiscal year ending 9/30/2015, high enough for PHCD to earn a “high performer” designation from
HUD.
According to PHCD, the physical condition of the units at the present time is good. All units are
inspected annually and meet the Housing Quality Standards as set by HUD’s Real Estate
Assessment Center. PHCD has a (5) Year Capital Fund Plan (CFP) which satisfies the physical
needs of its properties, including appliance upgrades and safety and security features. In
addition to ongoing maintenance and improvement of properties, PHCD encourages tenants to
form Resident Councils; works with residents, law enforcement, and social service providers to
reduce crime in public housing; and helps residents connect with jobs and social services. The
Agency also allows up to 200 Family Self-Sufficiency (FSS) program participants to participate in
the Section 8 Tenant-Based Homeownership Program, and is applying for a Resident
Opportunities and Self-Sufficiency (ROSS) grant. Currently, 198 families are enrolled in the FSS
program.

42
Figure 10: Public and Assisted Housing in Miami Gardens

43
As a Public Housing Authority, PHCD is subject to Section 504 of the Rehabilitation Act of 1973
(Section 504), and to Title II of the Americans with Disabilities Act (ADA). Section 504 provides
that no qualified individual with a disability should, only by reason of his or her disability, be
excluded from the participation in, be denied the benefits of, or be subjected to discrimination
under any program or activity receiving Federal financial assistance. Title II of the ADA bars state
and local government entities from discriminating against people with disabilities, and requires
that public housing providers make reasonable accommodations for tenants with disabilities.
PHCD has a Voluntary Compliance Agreement (VCA) with HUD to make its offices, public housing
dwellings and non-housing programs accessible to people with disabilities, thereby complying
with the requirements of Section 504 and the Americans with Disabilities Act (ADA). To date,
PHCD has brought 378 units into compliance with Uniform Federal Accessibility Standards
(UFAS), out of the 459 units ultimately required by the VCA.
In addition to implementing a VCA, PHCD is required to provide reasonable accommodations in
its housing programs and services to persons with disabilities. A reasonable accommodation is a
change, modification, alteration or adaptation in a policy, procedure, practice or program of a
housing facility that provides a qualified individual with a disability the opportunity to participate,
or benefit from, a housing or non-housing program or activity. For example, a PHA is customarily
required to allow tenants with disabilities to keep service animals even if the development does
not allow pets. Applicants and residents receive documents at move-in and annual
recertification that advise them about their disability-related rights.
In accordance with HUD’s Equal Access Rule and PIH Notice 2014-20 and the policies of Miami-
Dade County, PHCD has revised its definition of “family” to provide equal access regardless of
actual or perceived sexual orientation, gender identity, gender expression or marital status. If a
complaint is received, PHCD will determine if a program violation has occurred and implement
appropriate corrective actions.
44
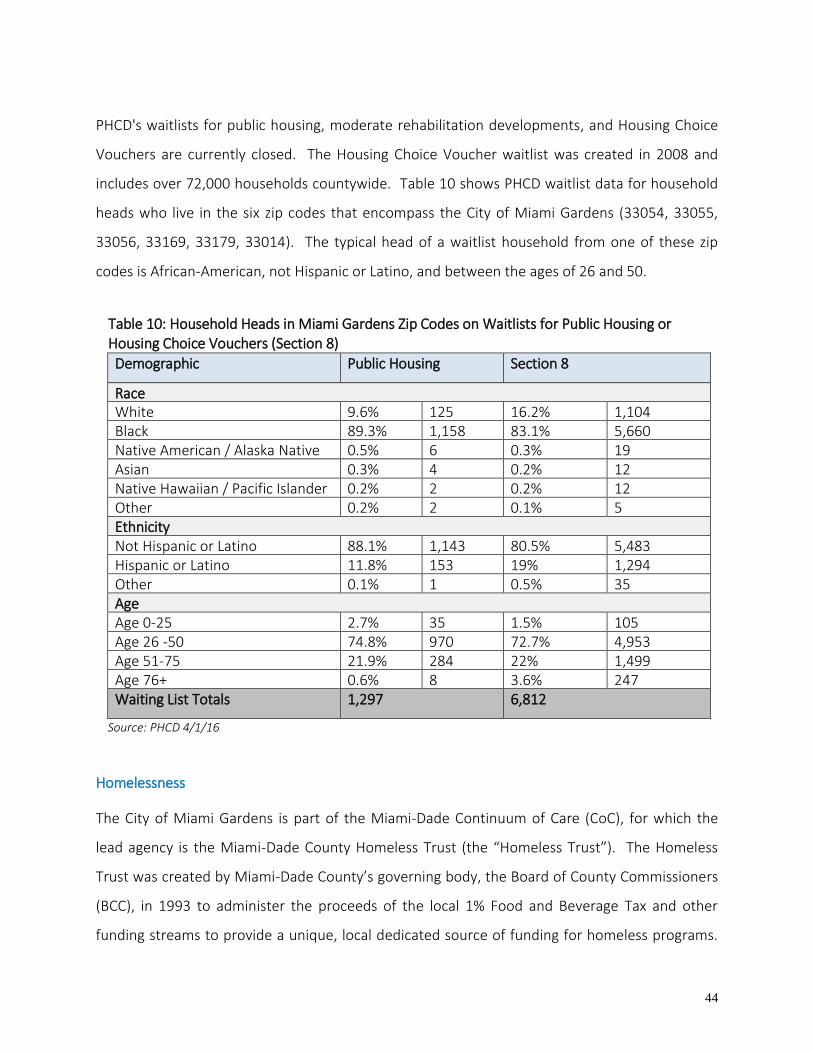
PHCD's waitlists for public housing, moderate rehabilitation developments, and Housing Choice
Vouchers are currently closed. The Housing Choice Voucher waitlist was created in 2008 and
includes over 72,000 households countywide. Table 10 shows PHCD waitlist data for household
heads who live in the six zip codes that encompass the City of Miami Gardens (33054, 33055,
33056, 33169, 33179, 33014). The typical head of a waitlist household from one of these zip
codes is African-American, not Hispanic or Latino, and between the ages of 26 and 50.
Table 10: Household Heads in Miami Gardens Zip Codes on Waitlists for Public Housing or Housing Choice Vouchers (Section 8)
Demographic Public Housing Section 8
Race White 9.6% 125 16.2% 1,104 Black 89.3% 1,158 83.1% 5,660 Native American / Alaska Native 0.5% 6 0.3% 19 Asian 0.3% 4 0.2% 12 Native Hawaiian / Pacific Islander 0.2% 2 0.2% 12 Other 0.2% 2 0.1% 5 Ethnicity Not Hispanic or Latino 88.1% 1,143 80.5% 5,483 Hispanic or Latino 11.8% 153 19% 1,294 Other 0.1% 1 0.5% 35 Age Age 0-25 2.7% 35 1.5% 105 Age 26 -50 74.8% 970 72.7% 4,953 Age 51-75 21.9% 284 22% 1,499 Age 76+ 0.6% 8 3.6% 247 Waiting List Totals 1,297 6,812
Source: PHCD 4/1/16
Homelessness
The City of Miami Gardens is part of the Miami-Dade Continuum of Care (CoC), for which the
lead agency is the Miami-Dade County Homeless Trust (the “Homeless Trust”). The Homeless
Trust was created by Miami-Dade County’s governing body, the Board of County Commissioners
(BCC), in 1993 to administer the proceeds of the local 1% Food and Beverage Tax and other
funding streams to provide a unique, local dedicated source of funding for homeless programs.
45
Their mission was to implement the Miami-Dade Community Homeless Plan, which was created
that same year. In 2004, the Homeless Trust developed a Ten Year Plan to End Homelessness in
Miami-Dade County. These additional strategies are incorporated into the Miami-Dade County
Homeless Plan, which is updated on a regular basis.
In Miami Gardens, the only provider of services targeted to homeless populations is Del Prado
Gardens, a permanent supportive housing development owned by Carrfour Supportive Housing.
Moreover, the City does not directly receive funding from HUD’s Emergency Solutions Grant, a
CPD program that funds rapid re-housing, shelter, and outreach activities. However, people who
become homeless in Miami Gardens have access to shelter, housing, and supportive services in
other parts of northern Miami-Dade County.
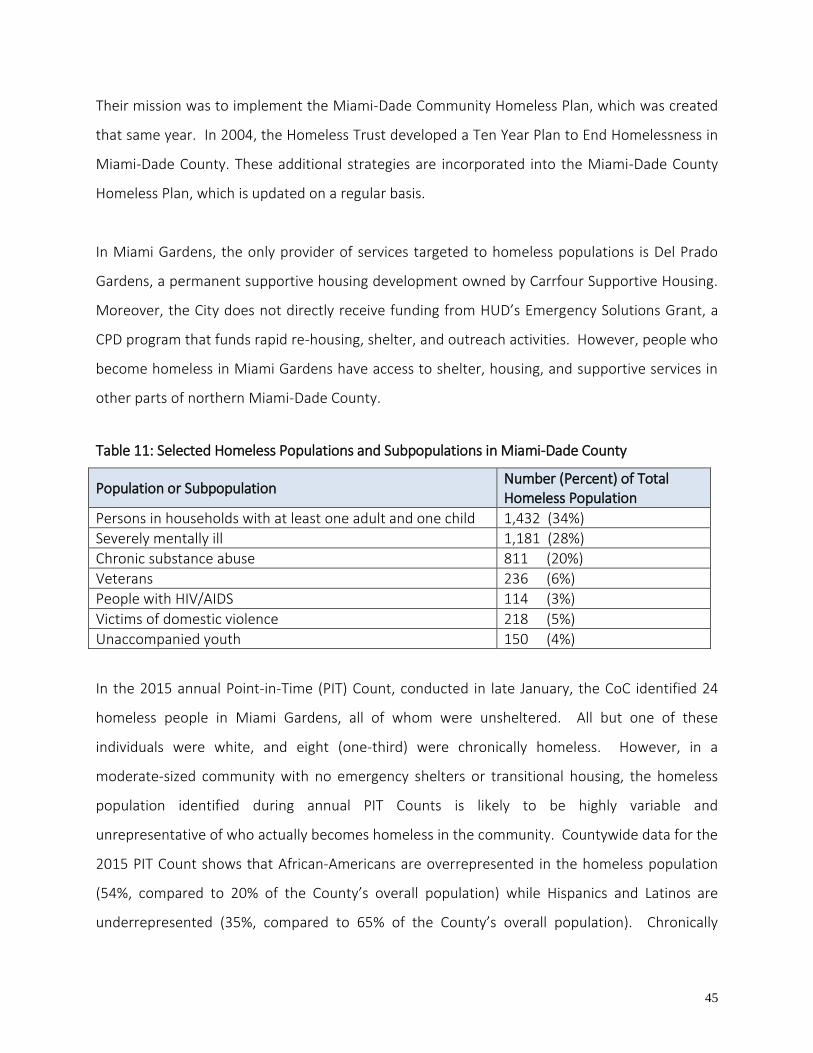
Table 11: Selected Homeless Populations and Subpopulations in Miami-Dade County
Population or Subpopulation Number (Percent) of Total Homeless Population
Persons in households with at least one adult and one child 1,432 (34%)
Severely mentally ill 1,181 (28%)
Chronic substance abuse 811 (20%)
Veterans 236 (6%)
People with HIV/AIDS 114 (3%)
Victims of domestic violence 218 (5%)
Unaccompanied youth 150 (4%)
In the 2015 annual Point-in-Time (PIT) Count, conducted in late January, the CoC identified 24
homeless people in Miami Gardens, all of whom were unsheltered. All but one of these
individuals were white, and eight (one-third) were chronically homeless. However, in a
moderate-sized community with no emergency shelters or transitional housing, the homeless
population identified during annual PIT Counts is likely to be highly variable and
unrepresentative of who actually becomes homeless in the community. Countywide data for the
2015 PIT Count shows that African-Americans are overrepresented in the homeless population
(54%, compared to 20% of the County’s overall population) while Hispanics and Latinos are
underrepresented (35%, compared to 65% of the County’s overall population). Chronically

46
homeless populations comprise 13% of the County’s homeless population. Additional
Countywide data is shown in Table 11 above.
The CoC's Coordinated Outreach, Assessment and Placement (COAP) program helps connect
homeless Miami-Dade County residents, including those in Miami Gardens, with the most
appropriate interventions. Citrus Health Network and Jackson Memorial Hospital, two health
care providers with service areas that include Miami Gardens, participate in a Memorandum of
Agreement as part of the COAP, wherein they refer patients being discharged into homelessness
to the Homeless Trust's outreach teams in order to access shelter.
In 2009, the City of Miami Gardens joined Miami, North Miami, and Miami-Dade County in
contributing Homelessness Prevention and Rapid Re-Housing Program (HPRP) funds for the
creation of the Housing Assistance Network of Dade (HAND). HPRP was a time-limited HUD
funding program designed as a response to the Recession, and is no longer available. However,
Citrus Health Network continues to operate HAND’s homelessness prevention and rapid re-
housing programs with funding from the Homeless Trust and the State of Florida. Staff from the
City of Miami Gardens continue to attend the Homeless Trust’s Continuum of Care
subcommittee meetings.
E. TRANSPORTATION
(Note: This section is adapted from the Miami Gardens Comprehensive Development Master Plan
– Transportation Element)
Miami Gardens is centrally located in the region. The boundaries are from I-95 and NE 2nd
Avenue on the east; NW 47th Avenue and NW 57th Avenue on the west; County Line Road on
the north; and NW 151st Street on the south. This location at the border of Miami-Dade and
Broward Counties makes Miami Gardens extremely accessible, and a viable residential and
business destination. The City is easily accessed by I-95, the Palmetto Expressway (SR 826), and
the Florida Turnpike, as well as numerous other County and State surface roads that form a

47
relatively uninterrupted grid through the City.
There are many levels of connectivity in Miami Gardens, from major interstates, regional rail
transit, and sub-regional County and State roads, to prevalent pedestrian and bicycle facilities.
The CSX tracks, located along the southeast boundary of the City, are the only rail facility located
within the City of Miami Gardens. The tracks carry the TriRail trains through the Golden Glades
Interchange between the Miami International Airport and west Palm Beach County. There are
no airports or seaports within the City of Miami Gardens. However, the Opa-Locka Airport is
located immediately adjacent to the City limits.
Table 12: Transportation to Work for Miami Gardens Residents
Transportation Type Number of Workers % of Workers
Workers 16 years and over 44,352 100%
Car, truck, or van -- drove alone 35,079 79.1%
Car, truck, or van -- carpooled 4,378 9.9%
Public transportation (excluding taxicab) 3,106 7.0%
Walked 435 1.0%
Other means 556 1.3%
Worked at home 798 1.8%
Data Source: 2010-2014 American Community Survey 5-Yr Estimates (DP03)
Miami Gardens is served by several bus lines, including 11 routes operated by the Miami-Dade
Metrobus system and 4 routes operated by Broward County Transit (not including express
routes). However, Miami-Dade County has a car-dependent culture, and only 7% of Miami
Gardens residents commute to work by public transit (see Table 12 above). For workers without
automobiles, commuting by bus can be time-consuming and inconvenient. Additionally, the
Transportation Element of Miami Gardens’ Comprehensive Development Master Plan, last
updated in 2006, identified the need for a local circulator route. The City launched a pilot trolley
circulator in June 2015, which has become a permanent free trolley that has had over 31,000
riders in its first year.

48
Overall, Miami Gardens is highly accessible with automobile, bus and rail transit. Table 13 below
shows commute times for workers who live in the City of Miami Gardens.
Table 13: Travel Time to Work for Miami Gardens Residents
Travel Time to Work (Commute) Percentage
Workers 16 years and over who did not work at home 43,554 (100%)
Less than 10 minutes 3.5%
10 to 14 minutes 8.2%
15 to 19 minutes 11.8%
20 to 24 minutes 17.8%
25 to 29 minutes 7.1%
30 to 34 minutes 23.0%
35 to 44 minutes 11.0%
45 to 59 minutes 10.0%
60 or more minutes 7.6%
Mean travel time to work (minutes) 29.8
Data Source: American Community Survey 2010-2014 5 Year Estimates (S0801)

49
Figure 11: Mean Travel Time to Work by Census Tract in Miami Gardens
According to the 2014 ACS, the mean travel time to work was 29.8 minutes, although mean
travel time to work varies across the City (Figure 11). As determined by Census Tracts, areas in
the northwest part of the City and one area in the east have average travel times to work of
more than 35 minutes.
F. GOVERNMENT STRUCTURE
The City has a “Mayor-Council-Manager” form of government. The City Council, which consists
of the Mayor and six (6) Council members, is vested with all legislative powers of the City. The
Mayor is a voting member of the Council and presides over its meetings. The City Manager is the
chief administrative officer of the City and is responsible for carrying out the policies adopted by
50
the Council6 (See Attachment 1- City of Miami Gardens Organizational Chart).
The Consolidated Plan regulations (24 CFR 91) require that the City of Miami Gardens complete
the Fair Housing Planning, which includes the completion of an Analysis of Impediments to Fair
Housing Choice. The Miami Gardens City Council acts as the final authority for the appropriation
of funds for Annual Action Plan activities under the Consolidated Plan grant programs, following
the recommendations of the City Manager. The City of Miami Gardens Community
Development Department is the lead administrative agency for the Consolidated Plan programs.
The Department provides fiscal and regulatory oversight of all CDBG funding, as well as other
federal and state grants for housing, economic, and community development.
6 City of Miami Gardens, City Charter
51
III. JURISDICTION’S FAIR HOUSING PROFILE
Expanding fair housing choice in a community depends on multiple components, including
education about fair housing laws for residents, housing providers, lenders, and other
stakeholders; an efficient system for victims of housing discrimination to file complaints; and
effective enforcement of fair housing laws. In reality, knowledge of fair housing laws and
processes is low in many communities, many instances of discrimination are never reported, and
many fair housing complaints are never adjudicated. By examining each component of its fair
housing system and reviewing data on complaints, lawsuits, and lending disparities, a community
comes closer to understanding the full scope and nature of its fair housing problems and
identifying gaps to be closed in the enforcement system.
This section begins by reviewing the legal and institutional framework for fair housing
enforcement in Miami Gardens, and the gaps therein. We discuss public knowledge of this
framework, drawing on survey data to address the nature of perceived housing discrimination
and gaps in public understanding of fair housing. We then review instances of perceived fair
housing discrimination in Miami Gardens that have risen to the level of a formal complaint or a
lawsuit in recent years. Local home lending data is reviewed to assess whether mortgage-
lending patterns reveal further evidence of discrimination. Finally, this section assesses the
impact of the City’s land use policy and regulatory framework on fair housing choice.
A. FAIR HOUSING ENFORCEMENT
Housing activities in Miami Gardens are regulated by federal, state, and local fair housing laws,
each with their own enforcement agencies. State and local fair housing enforcement agencies,
in addition to enforcing the laws in their own respective jurisdictions, are also intended to help
enforce fair housing laws at higher levels of government. These agencies should collaborate with
each other and with other fair housing agencies, such as nonprofit advocacy groups, to provide a
streamlined system for members of the public who believe they have experienced discrimination
and wish to file a complaint. The federal, state, and local framework for fair housing
52
enforcement in Miami Gardens is described below.
Federal:
The Federal Fair Housing Act7 prohibits discrimination on the basis of race, color, national origin,
religion, sex, familial status, and disability. The U.S. Department of Housing and Urban
Development, Office of Fair Housing and Equal Opportunity (FHEO), is charged with enforcing
the Federal Fair Housing Act as well as other civil rights laws including Title VI of the Civil Rights
Act of 1964, Section 109 of the Housing and Community Development Act of 1974, Section 504
of the Rehabilitation Act of 1973, Title ll of the Americans with Disabilities Act of 1990, the Age
Discrimination Act of 1975, Title IX of the Education Amendments Act of 1972 and the
Architectural Barriers Act of 1968. The Fair Housing Act contains administrative enforcement
mechanisms, giving HUD the authority to investigate, conciliate and charge claims of housing
discrimination filed under the Act.
In addition, HUD FHEO administers the Fair Housing Assistance Program (FHAP) and the Fair
Housing Initiatives Program (FHAP). FHEO also publishes guidance on fair housing compliance,
establishes fair housing and civil rights policies for HUD programs, and monitors those programs
for compliance.
Complaints filed with HUD are investigated by FHEO and if the complaint is not successfully
conciliated, then FHEO determines whether reasonable cause exists to believe that a
discriminatory housing practice has occurred. Where reasonable cause is found, the parties to
the complaint are notified by HUD's issuance of a Determination, as well as a Charge of
Discrimination, and a hearing is scheduled before a HUD administrative law judge (ALJ). Either
party – complainant or respondent – may cause the HUD-scheduled administrative proceeding
to be terminated by electing instead to have the matter litigated in federal court. Whenever a
party has so elected, the Department of Justice takes over HUD's role as counsel seeking
resolution of the charge on behalf of aggrieved persons, and the matter proceeds as a civil
7 Title VIII of the Civil Rights Act of 1968, 42USC3601

53
action. Either form of action – the ALJ proceeding or the civil action in federal district court – is
subject to review in the U. S. Court of Appeals8.
State:
The right to equal opportunity in housing is ensured not only by the Fair Housing Act, but also by
State and local laws. The Florida Fair Housing Act9, FS 760.20-760.37, parallels the Federal Fair
Housing Act. The Florida Commission on Human Relations (FCHR) is a Fair Housing Assistance
Program (FHAP) agency that enforces Florida’s state fair housing law, which has been deemed by
HUD to be “substantially equivalent” to the Federal Fair Housing Act. The FCHR promotes and
encourages fair treatment and equal opportunity for all persons regardless of race, color,
religion, sex, national origin, age, handicap, or marital status.
FHAPs enable HUD to use the services of substantially equivalent State and local agencies in the
enforcement of fair housing laws, and to reimburse these agencies for services that assist in
carrying out the spirit and letter of the federal Fair Housing Act. While certification results in a
shift in fair housing enforcement power from the federal government to the State or locality, the
substantive and procedural strength of the federal Fair Housing Act is not compromised.
When HUD receives a complaint alleging violations of a State or local fair housing law
administered by an interim certified or certified agency, HUD will generally refer the complaint
to the agency for investigation, conciliation and enforcement activities. Fair housing
professionals being based in the locality where the alleged discrimination occurred benefits all
parties to a housing discrimination complaint. These individuals often have a greater familiarity
with local housing stock and are in closer proximity to the site of the alleged discrimination,
offering greater efficiency in case processing.
8 www.hud.gov/fairhousing 9 State of Florida, Civil Rights Statutes, Title XLIX, Chapter760.2

54
Florida Commission on Human Relations
Address: 2009 Apalachee Parkway, Suite 100
Tallahassee, FL 32301-4857
Phone: (850) 488-7082
Local:
Miami-Dade County's Human Rights Ordinance10 is codified as Chapter 11A of the Miami-Dade
County Code, as amended. The ordinance prohibits discrimination against any person in Miami-
Dade County in the area of employment, family leave, public accommodations, credit and
financing practices, and housing accommodations on the basis of race, color, religion, ancestry,
national origin, age, sex, pregnancy, disability, marital status, familial status, gender identity,
gender expression, sexual orientation, and/or status as a victim of domestic violence, dating
violence, or stalking. Further, discrimination in housing based on source of income is also
prohibited.
The Miami-Dade County Commission on Human Rights (CHR), a quasi-judicial board charged with
the enforcement of Chapter 11A, was originally established as the Fair Housing Commission by
Ordinance 69-25, which passed on June 18, 1969 and was later renamed the Fair Housing and
Employment Appeals Board. Subsequent amendments added more protections from
discrimination for residents of Miami-Dade County and defined case processing and
enforcement authority. In April 1990, the Fair Housing and Employment Appeals Board was
reestablished as the Equal Opportunity Board. In June of 2009, the Equal Opportunity Board was
reestablished as the CHR. The Human Rights and Fair Employment Practices Division of the
Miami-Dade County Human Resources Department staffs the CHR.
The CHR investigates allegations of discrimination under state, federal and local laws. After the
filing of a formal complaint of discrimination, the CHR staff conducts an investigation into the
allegations raised in the charge. The investigation may entail the taking of testimony from the
10 Miami Dade County Ordinance No.90-32, Chapter 11A, Article II

55
parties and witnesses, the inspection of documents, site visitations to the respondent’s facilities
and fact-finding conferences. During this process, early resolution is encouraged through
mediation efforts. If the charge is not settled, the Director of the CHR issues a determination of
probable cause or no probable cause. Any of the parties to an investigation may appeal the
Director’s determination. An appeal is heard by a hearing panel consisting of three or more
members of the CHR board or a hearing officer at a public hearing. The panel or officer may
uphold, modify or overturn the Director’s determination. After a finding of discrimination, the
chairperson, with the approval of a quorum of the board members, issues an adjudicative final
order including, but not limited to: 1) hiring, reinstatement or promotion, with accrued seniority
and benefits, and with back pay; 2) taking affirmative action and making corrections; 3) requiring
reasonable accommodations; 4) awarding costs and attorney’s fees to a prevailing party; and 5)
other quantifiable relief to a prevailing complainant for injuries incurred as a result of an act
prohibited by Chapter 11A.
Unlike the state fair housing law, the Miami-Dade County ordinance currently does not have
substantial equivalency certification from HUD. Substantial equivalency certification results in
housing discrimination cases having the benefit of State or local complaint processing. At the
same time, the process assures that the substantive and procedural strength of the federal Fair
Housing Act will not be compromised.
MIAMI-DADE COUNTY COMMISSION ON HUMAN RIGHTS
Address: Stephen P. Clark Center111 NW 1st St., 21st Floor
Miami, FL 33128
Phone: 305-375-5272 or 305-375-2784
Fax: 305-375-2114 or 305-372-6017
E-mail: [email protected]
Miami-Dade County residents can also report fair housing complaints through the County
56
government’s 3-1-1 Contact Center. Customer service on the 311 hotline is available in English,
Spanish, and Creole, and residents can initiate requests for help with fair housing issues, among
other services. However, there is conflicting information regarding 311’s role in handling Fair
Housing complaints. 311 Senior Specialist, Ann M. Collada-Gordillo, reports that 311 refers these
complaints to HOPE, Inc., while Erin A. New, Esq., Director of the Human Rights & Fair
Employment Practices Division of the Miami-Dade County Human Resources Department,
reports that 311 refers complaints to her department.
Private Organizations:
Housing Opportunities Project for Excellence (HOPE), Inc. is a private, non-profit fair housing
organization, incorporated in 1988, with a mission to fight housing discrimination in Miami-Dade
and Broward Counties and to ensure equal housing opportunities throughout the state of
Florida. HOPE was created by the Miami-Dade County Fair Housing and Employment Appeals
Board (now the Miami-Dade County Equal Opportunity Board - MDCEOB) utilizing funding from
HUD’s Fair Housing Assistance Program, Type II grant. The organization has been engaged in
testing for fair housing law violations; pursuing enforcement of meritorious claims; and carrying
out fair housing education, outreach, and counseling programs designed to prevent and
eliminate discriminatory housing practices in Miami-Dade and Broward Counties for over 25
years.
HOPE’s Private Enforcement Initiatives are primarily funded by grants from HUD’s Fair Housing
Initiative Program (FHIP). The main components of the initiative include: intake for complaint
processing or referral, testing and additional investigation, where appropriate, and supervised
referral of enforcement proposals (complaints that have been reviewed for jurisdiction by
applicable fair housing laws, supported with credible and legitimate evidence) for enforcement
action.
HOPE, Inc. is the only entity in Miami-Dade and Broward counties engaged in “testing”. Testing
is a controlled method for measuring and documenting whether differences occur in the quality,
57
content, and quantity of information and services given to various home seekers by housing
providers. Testing is an effective and accurate tool in identifying policy or procedural oversight
or infraction that may require corrective action.
For litigation or settlement of housing discrimination cases, HOPE, Inc. enlists private law firms
and attorneys to contribute their services, on a pro bono basis. While governmental
entities/agencies represent the public interest, private fair housing groups are able to advocate
for the individual interests of victims of housing discrimination. There is no cost for legal
representation or for any other service provided by HOPE to persons complaining of housing
discrimination.
HOPE, Inc. has implemented a wide range of crucial services for diverse constituencies and has
been instrumental negotiating settlements for victims of housing discrimination. By drawing on
the strengths of private and public fair housing organizations, such partnerships can result in
effective efforts to combat housing discrimination.
B. PUBLIC AWARENESS OF FAIR HOUSING ISSUES
Gustavo Velasquez, Assistant Secretary for Fair Housing and Equal Opportunity at HUD, stated in
the Annual Report on Fair Housing (FY 2012/2013) that “Housing discrimination has a profound
and lasting impact on its victims, as access to housing affects not only where individuals and
families live, but the education, employment and other opportunities that are available to
them,” yet most housing discrimination goes unreported. Discrimination in real estate
transactions is possibly the most common unreported type of housing discrimination. Among
the reasons for non-reporting housing discrimination are: 1) failure to identify the incident as
discrimination, 2) uncertainty about where to turn for help when one has experienced
discrimination, 3) a belief that nothing will be done if one reports the incident, or 4) fear of
retaliation for reporting discrimination.
Ongoing education and outreach efforts are essential to promote awareness of rights conferred

58
under fair housing laws and to ensure compliance with fair housing laws. In an effort to gauge
the current local level of housing discrimination, a Fair Housing Survey was conducted
throughout the City of Miami Gardens. From January – March 2016, the City, in conjunction with
the Consolidated Planning process and the Florida Housing Coalition, conducted a survey that
posed a series of questions to local residents regarding housing discrimination,
tenant/homeowner rights, and local fair housing resources. Steps were taken to ensure a
random and widespread response from residents within Miami Gardens. Links to the online
survey were posted on the City’s website, on Facebook, and distributed via email to local
residents and stakeholders. Four meetings were held to solicit feedback on the extent and
perception of fair housing violations as well as knowledge on filing complaints. 229 surveys as
well as additional public comment were collected through all of these efforts.
Extent of Perceived Discrimination and Trends in Awareness
In Miami Gardens, 7.2% of residents surveyed (16 of 229) claimed to have experienced some
type of housing discrimination, and 7.2% were unsure if they had been discriminated against. Of
the 16 respondents reporting discrimination, only one person had taken any action in response.
These are important issues because the Fair Housing Act relies on homebuyers or renters
knowing enough to recognize housing discrimination when it occurs and, if experienced, to
initiate a response—such as filing a formal complaint for investigation, conciliation, or
adjudication with local and national organizations, such as HOPE, Inc., HUD, or Miami-Dade
County agencies.
19.11% percent of Miami Garden residents surveyed admitted to unfamiliarity with fair housing
laws and the individual rights of renters and homeowners and 24.89% were unsure. Also, 39.4%
of those surveyed were unaware of the resources available for filing discrimination complaints
and 13.16% were unsure. Education and outreach are the main sources for dispersing such
information throughout local communities. Grassroots organizations traditionally play the role
of local informer and trusted resource.
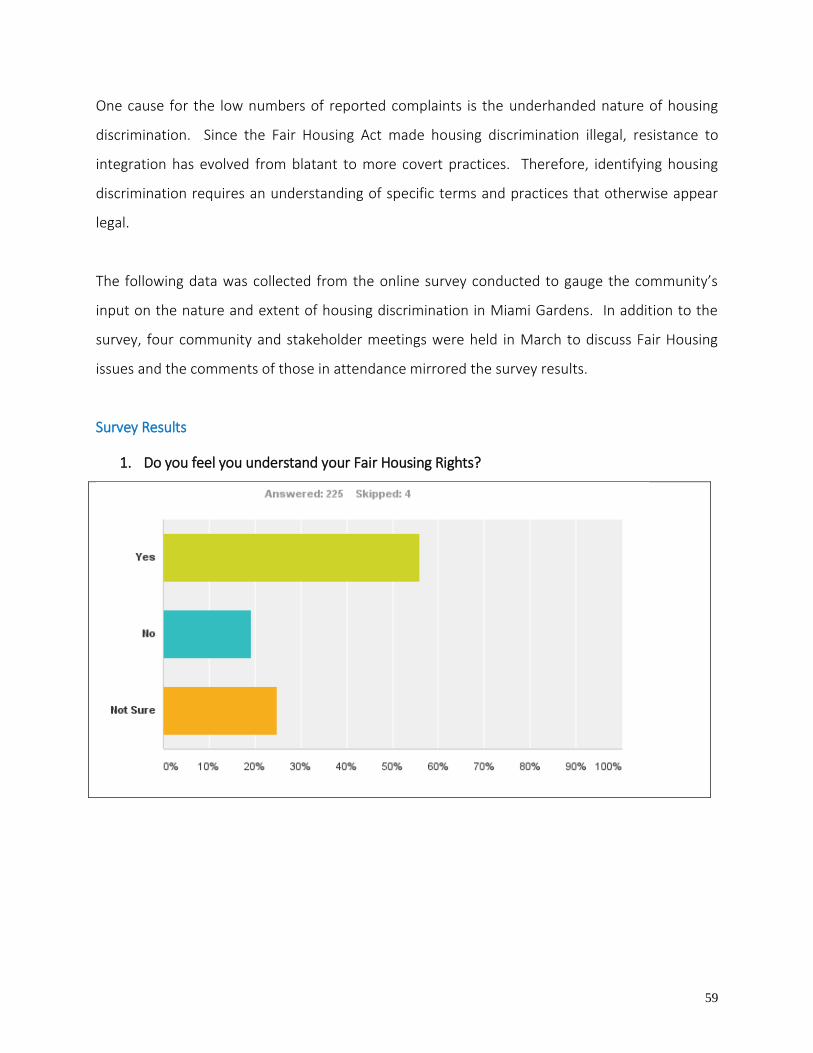
59
One cause for the low numbers of reported complaints is the underhanded nature of housing
discrimination. Since the Fair Housing Act made housing discrimination illegal, resistance to
integration has evolved from blatant to more covert practices. Therefore, identifying housing
discrimination requires an understanding of specific terms and practices that otherwise appear
legal.
The following data was collected from the online survey conducted to gauge the community’s
input on the nature and extent of housing discrimination in Miami Gardens. In addition to the
survey, four community and stakeholder meetings were held in March to discuss Fair Housing
issues and the comments of those in attendance mirrored the survey results.
Survey Results
1. Do you feel you understand your Fair Housing Rights?

60
2. Do you know where to file a housing discrimination complaint?
3. Since living in Miami Gardens, have you experienced discrimination?11
11 This survey question included the following additional text: (NOTE: The following actions would represent housing discrimination if based on your race, color, national origin, religion, sex, familial status, or disability: 1) Refusal to rent, sell or negotiate the rental/sale of housing; 2) Falsely denying that housing is available for inspection, sale or rental; 3) Setting different rental terms, conditions, or privileges for sale or rental of a dwelling; or 4) Providing different housing services or facilities)

61
4. Who discriminated against you? (Check all that apply)
5. On what basis do you feel you were discriminated against? (Check all that apply)

62
6. Did you file a report of that discrimination?
7. If you did not file a report, why didn’t you?
63
C. FAIR HOUSING INFORMATIONAL PROGRAMS
HOPE, Inc., the primary provider of fair housing education and information in Miami-Dade
County, endeavors to close the gap between fair housing protections and the public knowledge
of and access to them. HOPE, Inc. is funded in part by the HUD Fair Housing Initiatives Program
(FHIP) as well as Miami-Dade County and the Cities of Miami Beach and North Miami. Generally,
private fair housing organizations like HOPE are better equipped to reach local communities and
marginalized people through continual outreach and partnerships with both secular and religious
grassroots organizations. Such organizations have the established reputations and private status
that promote more trust from local communities.
HOPE, Inc.’s major objectives are to:
Provide educational materials, seminars and working sessions regarding protected
classes and prohibited practices under federal, state, and local fair housing laws;
Provide comprehensive fair housing services while seeking to identify illegal housing
practices in the areas of rentals, sales, mortgage/lending, insurance, and advertising;
Assist Entitlement Jurisdictions in implementing Fair Housing Action Plans that are
designed to eliminate identified impediments to Fair Housing Choice and to meet
Consolidated Plan requirements to Affirmatively Further Fair Housing; and
Conduct educational programs designed to furnish developers, real estate brokers,
property managers, financial institutions, and the media/advertising industry with the
most current information necessary to fully comply with fair housing laws, Community
Reinvestment Act regulations, and affirmative marketing requirements.
All programs are tailored to meet individual organizational needs. Public Housing Authority and
Not-for-Profit Community Development Corporation Workshops provide technical assistance to
ensure equal housing opportunities for all protected classes and the elimination of institutional
barriers to decent, affordable housing. The overarching objective of these activities is to assist
64
communities in developing a coordinated strategy of actions to affirmatively further fair housing.
Legal Community Seminars offer practitioners training in fair housing litigation skills. Community
and Civil Group Education Sessions are implemented to ensure that the general public and
protected classes become knowledgeable about fair housing laws and the means available to
seek redress for fair housing rights violations. Media campaigns inform the public of the fair
housing services made available by HOPE, Inc., utilizing a combination of public service
announcements, print ads, signs/billboards, and other media. The telephone Help Line provides
information regarding fair housing issues, referral services for victims of discrimination to file
complaints and seek redress, and affordable housing and other housing related referrals. HOPE
publishes and disseminates a fair housing newsletter quarterly highlighting national, statewide,
and local fair housing news, and conducts national Fair Housing Month activities in April
annually.
D. FAIR HOUSING COMPLAINTS
The National Fair Housing Alliance’s 2015 Fair Housing Trends Report announced that 27,528 fair
housing complaints were filed nationwide in 2014, a slight increase over the 2013 level12.
According to the report, Americans report only a small fraction of discriminatory complaints.
Discrimination the basis of disability represents over 50% of all complaints and racial
discrimination represents 22% of complaints. Further, the report estimates that private
nonprofit fair housing organizations process more than double the number of complaints
received by HUD and Fair Housing Assistance Program agencies.
From 2009 through 2015, the HUD Miami Field Office reported a total of 85 Fair Housing
complaints in the City of Miami Gardens. The nature of the complaints was not provided and
further information required filing a Freedom of Information Act request. The status of these
cases is shown in Figure 12 below.
12 http://www.nationalfairhousing.org/Portals/33/2015-04-30%20NFHA%20Trends%20Report%202015.pdf

65
Figure 12: Miami Gardens Fair Housing Complaints Filed 2009-2015
E. FAIR HOUSING DISCRIMINATION SUITS FILED
Milsap, et al. v. Cornerstone Residential Management13
The developer and property management company of affordable housing units located in
Miami-Dade and Broward Counties is subject to a class action lawsuit alleging discrimination on
the basis of familial status and race. Two properties subject to this lawsuit are located in the City
of Miami Gardens:
Crossings @ University, 18740 N.W. 27 Ave, 33055;
Eagle's Landing, 18800 N.W 27 Ave, 33055;
The plaintiffs allege that the occupancy restrictions established and enforced by Cornerstone
have a discriminatory impact on families with children and Blacks. HUD has established a general
rule of two persons per bedroom as a reasonable occupancy standard for purposes of the Fair
13 Filed in 2005 by The Law Office of Matthew Dietz in the United States District Court, Southern District of Florida, Civil Division, Case No. 05-60038 CIV
17
15
7 5 2
1
38
No Cause
Failure to Cooperate
Withdrawals
Settlement with Benefits
Right to Sue
Administrative Closure
Currently Open HousingCases
66
Housing Act.14 The plaintiffs allege that the occupancy standards enforced at properties owned
and operated by Cornerstone are more restrictive than those established by HUD, thus having a
discriminatory impact on families with children. Further alleged is that properties located in
areas with larger minority populations have even more restrictive occupancy limitations than
areas with smaller minority populations, resulting in racial disparities.
HOPE, Inc. was one of five plaintiffs in this class action lawsuit filed in 2005 against
Cornerstone15, a prominent affordable housing developer and property manager, alleging
violations of the Fair Housing Act for denial of rental opportunities, discrimination in the terms,
conditions and privileges of a housing opportunity, and disparate impact based on familial status.
Cornerstone had established occupancy restrictions for all of its properties, most of which
limited occupancy to less than two persons per bedroom. Plaintiffs alleged one of Cornerstone's
properties enforced a written one child per bedroom policy made available at the front desk and
given to potential renters prior to being provided an application. As a result of occupancy
restrictions, families who exceeded them were denied housing or paid more for their housing
because they were forced to live in a larger unit.
Five years later, the case was settled out of court. While Cornerstone Residential Management,
Inc. et.al., denied violating the federal and Florida Fair Housing Acts or engaging in any wrongful
conduct, the terms of the settlement include undisclosed relief for the individual plaintiffs and
implementation of policies that will increase the availability of affordable housing opportunities
to families with children at over 7,500 affordable housing units managed by Cornerstone in and
out of Miami-Dade and Broward counties, since all units are owned and operated by the same
company and are subject to the agreement. Occupancy standards will be maintained that are
not less than two persons per bedroom (excluding infants under two years of age).
14 Department of Housing and Urban Development, Fair Housing Enforcement- Occupancy Standards, Notice of Statement of Policy, Docket No. FR-4405-N-01; Federal Register/Vol. 63, No. 245/Tuesday, December 22, 1998/Notices 15 HOPE, Inc. Press Release, "Settlement Reached in Landmark Mislap VS. Cornerstone Case 6/4/2010. hrtp:llwww.hopefhc.com/newsl 20 I 0-20 15 and City of Miami Analysis of Impediments to Fair Housing Choice Page 39 Updated 4-1-2012
67
The Consent Order further calls for:
Cornerstone submission of an Affirmative Fair Housing Marketing Plan to HOPE
annually and ongoing training for its employees;
HOPE monitoring of vacancies and leasing reports for affected properties; at its own
expense, HOPE may develop and implement a testing program to audit and monitor
the Defendants' compliance with the Fair Housing Act and the Consent Order with
respect to familial status;
Cornerstone posting and prominently displaying a full size HUD fair housing poster in
a conspicuous location in or near the rental office;
Cornerstone including the "Equal Housing Opportunity" or the fair housing logo in all
rental advertising, including billboards, telephone and internet.
Housing Opportunities Project for Excellence, Inc., Pamela Carter, Carlos Quinones, Vanessa Cano,
Berthenia Mannings, individually and as parent of KM, Graciela Cisneros, and Julian Mitchell vs.
Miami Property Group, LTD., Charter Realty Group, Inc. and Paulette Gopaul16
Plaintiffs alleged that Defendants have systematically limited and denied the equal housing
opportunity rights of their residents by promulgating rules and regulations and establishing
practices which discriminate against persons based upon their sex, disability and familial status;
and denied residents reasonable modifications or accommodations for their disabilities which
would allow them equal use and enjoyment of the premises, including the common use areas.
These alleged violations took place at the following properties located in the City of Miami
Gardens::
183rd St Apartments located at 18451 NW 37th Ave., Miami Gardens, FL 33056;
187th St Apartments located at 18665 NW 37th Ave., Miami Gardens, FL 333056;
16
Case No. 1:14-cv-22142-LMM. Filed in US District Court Southern District of Florida, Miami Division
68
On April 16, 2015, the parties entered into a Settlement Agreement and Mutual Release with the
following terms:
The Agreement resolves all issues between Plaintiff and Defendant and does not
constitute admission by any Parties of any violation of Federal, State or Local law,
ordinance or of any liability or wrongdoing.
The Court will retain jurisdiction to enforce the terms of the Settlement Agreement.
A Joint Stipulation of Dismissal with Prejudice and a proposed Order of Dismissal shall
be filed within 5 business days of the Effective date and within 10 business days,
Plaintiffs shall provide to HUD, a written Notice of Withdrawal of their Housing
Discrimination Complaint releasing any damages claims in connection therewith.
Defendant shall wire $625,000 to the Disability Independence Group, Inc.’s. Trust
Account within 11 business days.
Miami Property Group agrees to make reasonable accommodations to Pamela Carter,
Graciela Cisneros and Vanessa Cano.
Charter Realty Group will, within 60 calendar days of the Effective Date, enter into a
consulting agreement with a 3rd party to review all requests made by Charter Realty
for reasonable accommodations at the subject properties.
Subject to lender approval, Miami Property Group will revise its management
agreement with Charter Realty Group to contain provisions to require compliance
with the Federal Fair Housing Act, Florida Fair Housing Act, Miami-Dade Human
Rights Ordinance, Section 504 of the Rehabilitation Act, Violence Against Women Act,
Limited English Proficiency Requirements, Affirmative Fair Housing Marketing
Requirements and LGBT protections in all applicable statutes and regulations. In
addition, Charter Realty Group must provide certifications of completion of staff
training.
Charter Realty Group will acknowledge and accept a resident’s determination of
disability provided by Social Security Administration.

69
For 2 years from Effective Date, Charter Realty Group will provide HOPE with reports
regarding in person trainings provided to its employees with responsibility for
providing services at the Subject Properties. Trainings must be conducted by a 3rd
party with relevant training experience and must consist of 6 hours/year.
Revised polices regarding reasonable accommodation have been deemed acceptable
by HOPE and any revisions made within 2 years of Effective Date must be reviewed by
HOPE. HOPE agrees to provide Charter Realty with written notice of any changes that
it alleges may violate any applicable law or ordinance.
For 2 years from the Effective Date, Charter Realty Group will provide quarterly logs
to HOPE reflecting requests for reasonable accommodations and the modifications
and accommodations provided.
At recertification, Charter Realty Group will continue to provide to residents of the
Subject Properties notification regarding VAWA, Reasonable Accommodation and
Limited English Proficiency.
Charter Realty Group will continue to screen potential live-in aides with the same
criteria used to screen housing applicants, but will not include financial criteria.
Charter Realty group will not deny someone from serving as a live-in aide solely
because the individual is a current tenant of another unit, a family member of tenant
requiring the aide or a former tenant.
At recertification, Charter Realty Group will ask specific questions outlined in the
Settlement Agreement regarding disability and modifications. They will also read
specific questions from HUD Form 50059 to verify responses.
Miami Property Group will install playground equipment at 185/187 Apartments
within 120 days of Effective Date.
Charter Realty Group will designate an area for children to ride bikes at 185/187
Apartments.
70
Charter Realty Group will extend pool hours and make the pool available on
weekends.
Charter Realty Group will continue to allow evicted residents who have committed no
crime to be on the property to visit family members who are tenants, unless any
other federal, state or local law or directive from HUD prohibits this practice.
Miami Property Group will continue to provide afterschool program.
Charter Realty Group will continue to leave pedestrian gate open during certain hours
unless emergency circumstances require differently.
Charter Realty Group will continue to maintain written policies in English and Spanish
and will provide alternate formats as needed.
Charter Realty Groups House rules and policies will remain compliant with the
requirements of VAWA.
Charter Realty Group agrees to allow scheduled tenant meetings in the Community
Room upon reasonable notice.
Sanchez, Luis v. Miami Property Group, LTD, et al.
Miami HUD Field office reference number 04-14—156-6
LOF of Compliance Title VI
No further information was available on this case as the filing parties stated they are not at
liberty to discuss.
F. LENDING POLICIES AND PRACTICES
Historically, racial and ethnic minority groups have encountered barriers to full access to home
mortgage lending. Typically, these barriers are identified by higher rejection and failure rates for
loan applications. In other instances, racial and ethnic minority groups have been steered to
government-insured FHA (Federal Housing Administration) loans when they could have qualified
71
and benefited from conventional loans in the private market. The Federal National Mortgage
Association (Fannie Mae) and the Federal Home Loan Mortgage Corporation (Freddie Mac), the
two federally-chartered secondary market enterprises that stimulate the mortgage markets by
purchasing loans, are charged by the government with reaching specific goals for serving both
affordable and minority housing markets with conventional loans. This indicates the clear policy
goal of reaching as many borrowers as possible through private conventional markets.
As the market of sub-prime lending has grown, studies by the U.S. Department of Housing and
Urban Development and other researchers, as well as many lawsuits, have raised the concern
that minority ethnic and racial groups have been unfairly steered to these higher interest rate
products when they could have been served by either conventional prime loans or FHA lending.
Thus, the key concerns presently raised about barriers to fair lending include both the
impediments to access to conventional prime loans and the infusion of FHA and sub-prime
lending into minority markets. Accordingly, this analysis of barriers to full access to mortgage
lending focuses on the issues of access to conventional prime loans and steering to FHA and sub-
prime loans in both the home purchase and refinance markets.
The Florida Housing Coalition team conducted a portfolio and market share analysis using 2014
Home Mortgage Disclosure Act (HMDA) data with the following specifications for Miami
Gardens, FL: all single family lending, conventional and government- insured, loans to owner-
occupants, and first-lien loans. All single-family loans include loans for home purchase, home
improvement, and refinances. For the portfolio share analysis, we evaluated the prime (or
market-rate) and subprime (or high-cost) lending performances by gender of borrower; by race
and ethnicity of borrower (i.e. white non-Hispanic, Black, Asian, or Hispanic); by income level of
borrower (low- and moderate- income, or LMI, and middle- and upper-income, or MUI); and by
income level of census tract (LMI or MUI neighborhood). High-cost loans are those with the
price information reported under the Home Mortgage Disclosure Act (HMDA). For more
information about HMDA, please visit http://www.consumerfinance.gov/hmda/learn-more.
Lending patterns were then compared to the demographics of Miami Gardens, where applicable,
72
to illustrate potential lending disparities.
The market share analysis compares the portion of high-cost loans made to a particular
borrower group to all loans (market-rate loans plus high-cost loans) made to that same borrower
group. The disparity ratio illustrates the extent to which originations occurred to one borrower
group compared to another. Market-rate loans are loans made at prevailing interest rates to
borrowers with good credit histories. High-cost loans, in contrast, are loans with rates higher
than prevailing rates made to borrowers with credit blemishes. The higher rates compensate
lenders for the added risks of lending to borrowers with credit blemishes. While responsible
high-cost lending serves legitimate credit needs, public policy concerns arise when certain
groups in the population receive a disproportionate amount of high-cost loans. When high-cost
lending crowds out market-rate lending in traditionally underserved communities, price
discrimination and other predatory practices become more likely, as residents face fewer
product choices.
Portfolio Share Analysis of Single Family Lending
While comprising about 24 percent of the households in Miami Gardens, according to 2010-2014
American Community Survey, Hispanic borrowers received approximately 37 percent of prime
and 58 percent of all high-cost loans in the City in 2014. As a comparison, white non-Hispanic
borrowers, whose share of households in Miami Gardens was fewer than 3 percent, received 10
percent of all prime and approximately 2 percent of all high-cost loans. Thus, white non-Hispanic
borrowers received a disproportionately higher portion of prime loans and smaller portion of
high-cost loans, as compared to their share of Miami Garden’s households. Hispanics received a
significantly larger portion of high-cost loans than their share of households in the area, though
their share of prime loans was also higher than their share of total households within the City
(see Table 14 and Figure 13 below).
African-American borrowers comprised the largest share of households (76 percent) in Miami
Gardens, according to the 2010-2014 American Community Survey. Further, this borrower

73
group received a smaller portion of both prime and high-cost loans, as compared to their
percentage of the City’s households (i.e. 50 percent of prime and 40 percent of high-cost loans).
Asian borrowers, on the other hand, comprised the smallest share of Miami Gardens’
households (less than 1 percent) while receiving a higher portion of prime loans (2.1 percent)
and a smaller portion of high-cost loans (0.3 percent) than their share of households in the City.
Table 14: Miami Gardens Portfolio Share Analysis by Race/Ethnicity of Borrower (Single-Family)
Race/ Ethnicity of Borrower
Loan Originations % of Loans to All Races All Households Ratio of Prime
Portfolio Share to %
of HHs
Ratio of Sub-prime
Portfolio Share to % of
HHs
Prime Sub-
prime All Prime
Sub-prime
All Count %
White Non-Hispanic
57 5 62 10.0% 1.7% 7.1% 902 2.9% 3.46 0.57
Black/African American
284 119 403 50.0% 39.5% 46.4% 23,564 75.8% 0.66 0.52
Hispanic or Latino
210 175 385 37.0% 58.1% 44.3% 7,243 23.3% 1.59 2.50
Asian 12 1 13 2.1% 0.3% 2.5% 187 0.6% 3.52 0.55
Total17 568 301 869 100% 100% 100% 31,087 100% - -
17 Total includes all originations for which race and ethnicity data were provided. This includes a small number of other races not included identified as a row in the table.
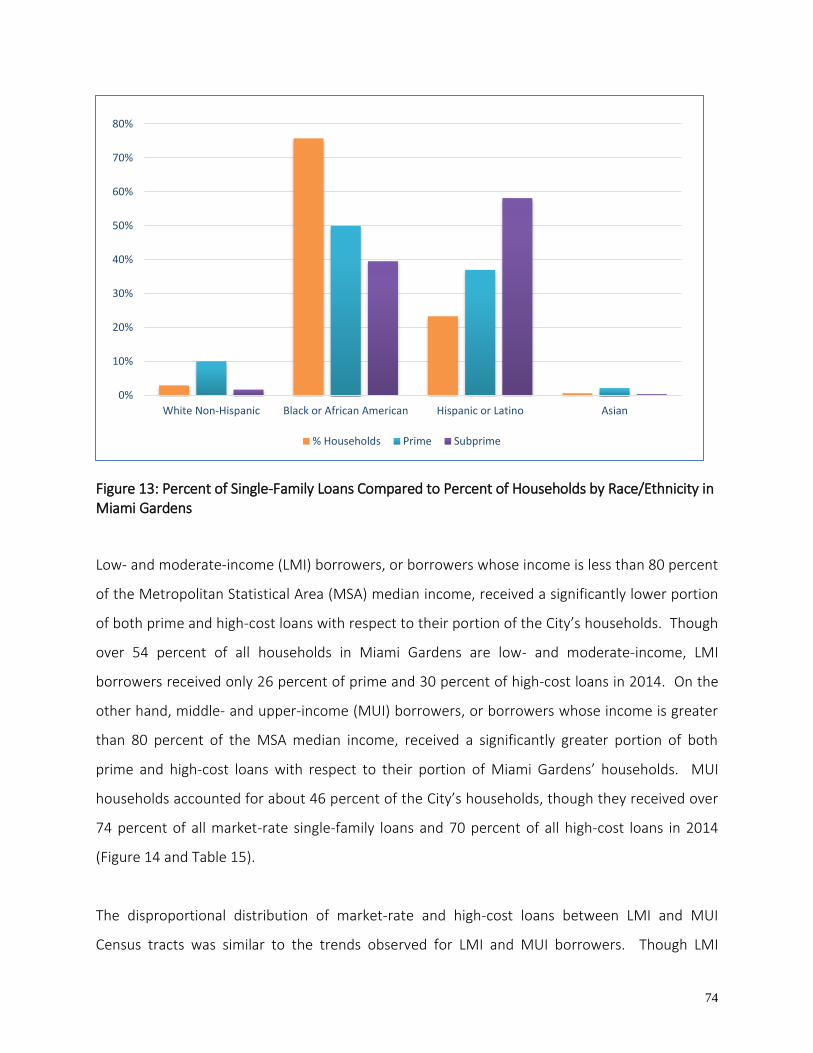
74
Figure 13: Percent of Single-Family Loans Compared to Percent of Households by Race/Ethnicity in Miami Gardens
Low- and moderate-income (LMI) borrowers, or borrowers whose income is less than 80 percent
of the Metropolitan Statistical Area (MSA) median income, received a significantly lower portion
of both prime and high-cost loans with respect to their portion of the City’s households. Though
over 54 percent of all households in Miami Gardens are low- and moderate-income, LMI
borrowers received only 26 percent of prime and 30 percent of high-cost loans in 2014. On the
other hand, middle- and upper-income (MUI) borrowers, or borrowers whose income is greater
than 80 percent of the MSA median income, received a significantly greater portion of both
prime and high-cost loans with respect to their portion of Miami Gardens’ households. MUI
households accounted for about 46 percent of the City’s households, though they received over
74 percent of all market-rate single-family loans and 70 percent of all high-cost loans in 2014
(Figure 14 and Table 15).
The disproportional distribution of market-rate and high-cost loans between LMI and MUI
Census tracts was similar to the trends observed for LMI and MUI borrowers. Though LMI
0%
10%
20%
30%
40%
50%
60%
70%
80%
White Non-Hispanic Black or African American Hispanic or Latino Asian
% Households Prime Subprime

75
Census tracts represent 21 percent of all tracts in Miami Gardens, fewer than 10 percent of
prime loans and 15 percent of high-cost loans occurred in LMI tracts. MUI Census tracts, on the
other hand, which represent approximately 79 percent of the Census tracts in Miami Gardens,
received 90 percent of the market-rate and 85 percent of the high-cost loans originated in Miami
Gardens in 2014 (Table 16).
Figure 14: Percent of Single-Family Loans Compared to Percent of Households by Income Level in Miami Gardens
0%
10%
20%
30%
40%
50%
60%
70%
80%
LMI (<80% MSA Income) MUI (>80% MSA Income)% Households Prime Subprime
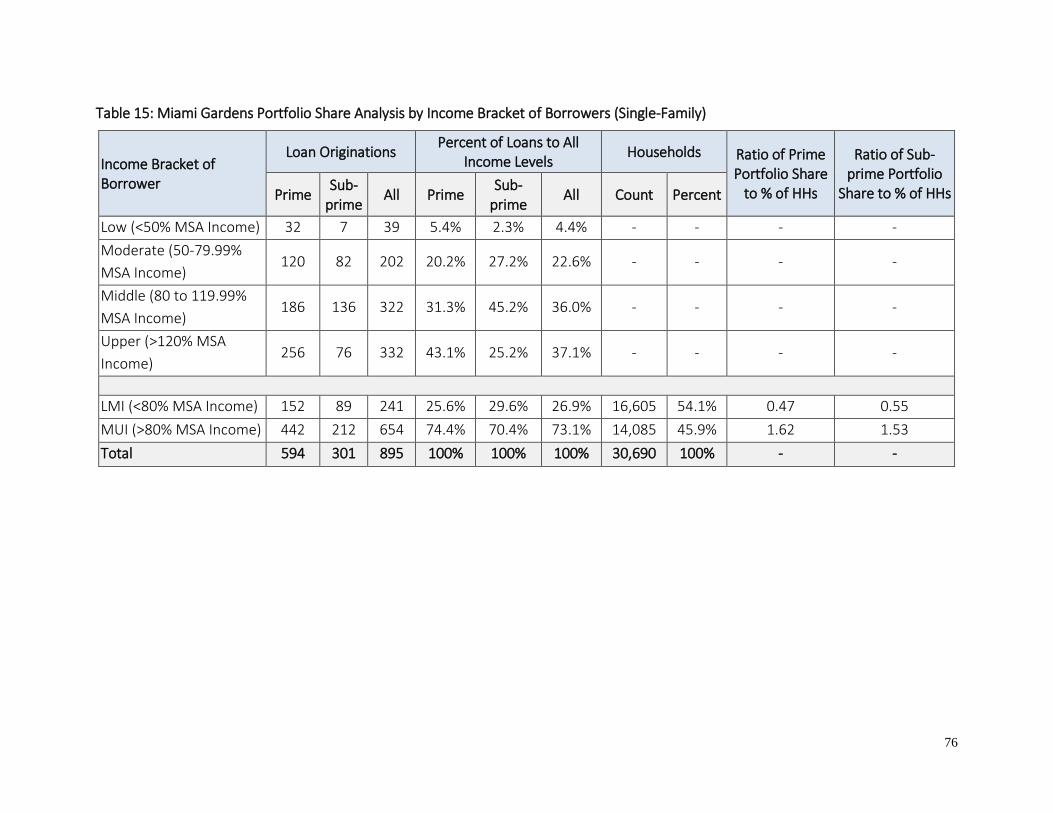
76
Table 15: Miami Gardens Portfolio Share Analysis by Income Bracket of Borrowers (Single-Family)
Income Bracket of Borrower
Loan Originations Percent of Loans to All
Income Levels Households Ratio of Prime
Portfolio Share to % of HHs
Ratio of Sub-prime Portfolio
Share to % of HHs Prime Sub-
prime All Prime
Sub-prime
All Count Percent
Low (<50% MSA Income) 32 7 39 5.4% 2.3% 4.4% - - - -
Moderate (50-79.99%
MSA Income) 120 82 202 20.2% 27.2% 22.6% - - - -
Middle (80 to 119.99%
MSA Income) 186 136 322 31.3% 45.2% 36.0% - - - -
Upper (>120% MSA
Income) 256 76 332 43.1% 25.2% 37.1% - - - -
LMI (<80% MSA Income) 152 89 241 25.6% 29.6% 26.9% 16,605 54.1% 0.47 0.55
MUI (>80% MSA Income) 442 212 654 74.4% 70.4% 73.1% 14,085 45.9% 1.62 1.53
Total 594 301 895 100% 100% 100% 30,690 100% - -
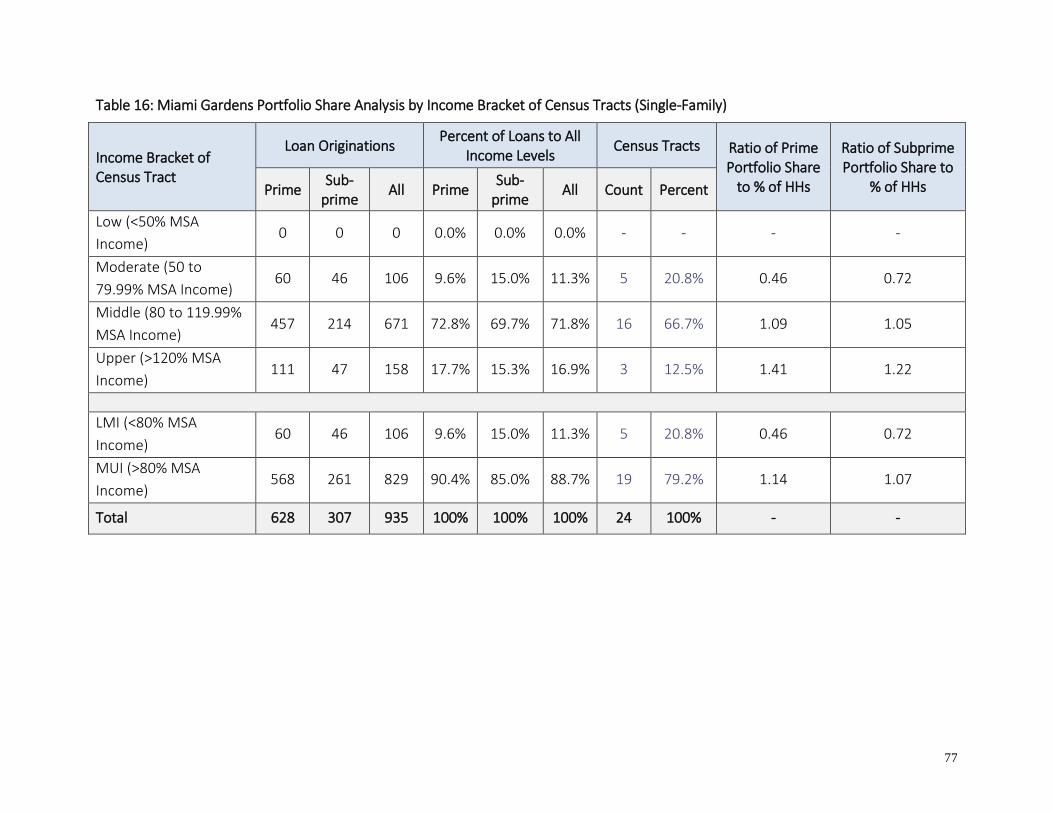
77
Table 16: Miami Gardens Portfolio Share Analysis by Income Bracket of Census Tracts (Single-Family)
Income Bracket of Census Tract
Loan Originations Percent of Loans to All
Income Levels Census Tracts Ratio of Prime
Portfolio Share to % of HHs
Ratio of Subprime Portfolio Share to
% of HHs Prime Sub-
prime All Prime
Sub-prime
All Count Percent
Low (<50% MSA
Income) 0 0 0 0.0% 0.0% 0.0% - - - -
Moderate (50 to
79.99% MSA Income) 60 46 106 9.6% 15.0% 11.3% 5 20.8% 0.46 0.72
Middle (80 to 119.99%
MSA Income) 457 214 671 72.8% 69.7% 71.8% 16 66.7% 1.09 1.05
Upper (>120% MSA
Income) 111 47 158 17.7% 15.3% 16.9% 3 12.5% 1.41 1.22
LMI (<80% MSA
Income) 60 46 106 9.6% 15.0% 11.3% 5 20.8% 0.46 0.72
MUI (>80% MSA
Income) 568 261 829 90.4% 85.0% 88.7% 19 79.2% 1.14 1.07
Total 628 307 935 100% 100% 100% 24 100% - -

78
Market Share Analysis of Single Family Lending
The share of high-cost loans out of all loans originated to Hispanics and African-Americans was
significantly greater than for white non-Hispanic borrowers. African American borrowers were
3.66 times more likely than white non-Hispanic borrowers to receive a high-cost loan (this ratio
is calculated by dividing the percent of all loans to African Americans that were high-cost, 29.5
percent, by the percent of all loans to white non-Hispanic borrowers that were high-cost, 8.1
percent). Hispanic borrowers, meanwhile, were 5.64 times more likely to receive a high-cost
loan than their white non-Hispanic counterparts (Table 17 and Figure 15).
Table 17: Miami Gardens Market Share Analysis by Race/Ethnicity of Borrower (Single-Family)
Race/Ethnicity of Borrower
Loan Originations % to that Race Ratio to White
Prime Sub-
prime All Prime
Sub-prime
Prime Sub-
prime
White Non-Hispanic 57 5 62 91.9% 8.1% 1.00 1.00
Black or African American 284 119 403 70.5% 29.5% 0.77 3.66
Hispanic or Latino 210 175 385 54.5% 45.5% 0.59 5.64
Asian 12 1 22 54.5% 4.5% 0.59 0.56
Total 568 301 869 65.4% 34.6% 1.66 10.04
Figure 15: Subprime Market Share of Single-Family Loans by Race/Ethnicity in Miami Gardens
0
1
2
3
4
5
6
0%
5%
10%
15%
20%
25%
30%
35%
40%
45%
50%
White Non-Hispanic Black or AfricanAmerican
Hispanic or Latino Asian
Disp
arity Ratio
Mar
ket
Shar
e
Subprime Disparity Ratio

79
Table 18: Miami Gardens Market Share Analysis by Income Bracket of Borrowers (Single-Family)
Income Bracket of Borrower Household
Loan Originations Percent to that Income Level
Ratio to Upper Income
Prime Subprime All Prime Subprime Prime Subprime
Low (<50% MSA
Income) 32 7 39 82.1% 17.9% 1.06 0.78
Moderate (50-79.99%
MSA Income) 120 82 202 59.4% 40.6% 0.77 1.77
Middle (80 to 119.99%
MSA Income) 186 136 322 57.8% 42.2% 0.75 1.85
Upper (>120% MSA
Income) 256 76 332 77.1% 22.9% 1.00 1.00
LMI (<80% MSA
Income) 152 89 241 63.1% 36.9% 0.93 1.14
MUI (>80% MSA
Income) 442 212 654 67.6% 32.4% 1.00 1.00
Total 628 307 935 67.2% 32.8% - -
Figure 16: Subprime Market Share of Single-Family Loans by Household Income Bracket in Miami Gardens
0.90
0.95
1.00
1.05
1.10
1.15
30%
31%
32%
33%
34%
35%
36%
37%
38%
LMI (<80% MSA Income) MUI (>80% MSA Income)
Disp
arity Ratio
Mar
ket
Shar
e
Subprime Disparity Ratio

80
While the prime/subprime gap was less significant in degree compared to lending by race, LMI
borrowers in Miami Gardens were 1.14 times more likely to receive a high-cost loan than MUI
borrowers (this is 36.9 percent divided by 32.4 percent) as of 2014 (see Table 18 and Figure 16
above).
Additionally, borrowers in LMI Census tracts were 1.38 times more likely to receive high-cost
loans than borrowers in MUI Census tracts (calculated by dividing 43.4 percent by 31.5 percent;
see Table 19).
Table 19: Miami Gardens Market Share Analysis by Income Bracket of All Census Tracts (Single-Family)
Income Bracket of Census Tract
Loan Originations Percent to that Income Level
Ratio to Upper Income
Prime Sub-
prime All Prime
Sub-prime
Prime Sub-
prime
Low (<50% MSA Income) 0 0 0 0.0% 0.0% - -
Moderate (50 to 79.99% MSA
Income) 60 46 106 56.6% 43.4% 0.81 1.46
Middle (80 to 119.99% MSA
Income) 457 214 671 68.1% 31.9% 0.97 1.07
Upper (>120% MSA Income) 111 47 158 70.3% 29.7% 1.00 1.00
LMI (<80% MSA Income) 60 46 106 56.6% 43.4% 0.83 1.38
MUI (>80% MSA Income) 568 261 829 68.5% 31.5% 1.00 1.00
Total 628 307 935 67.2% 32.8% - -
Table 20: Loan Originations to Miami Gardens Neighborhoods by Minority Share
Minority Percentage of Census Tract Population
Loan Originations As a Percent of Loans to that Minority Level
(Market Share)
Ratio of that Minority Level to 0-49% Minority
(Market Share Ratio)
Prime Sub-
prime All Prime Subprime Prime Subprime
0-49% Minority 0 0 0 0.0% 0.0% - -
50-100% Minority 3,066 4,055 7,071 43.36% 56.64% N/A N/A
Total 3,066 4,055 7,071 43.36% 56.64% N/A N/A
Finally, Table 20 shows the prime and subprime loan originations in “predominantly minority”

81
Census Tracts (50-100% minority population) in 2006, as reported in the 2008 Analysis of
Impediments. All Census tracts in Miami Gardens are predominantly minority, so Table 20 does
not show whether subprime lending is more common in Census tracts with higher minority
concentrations. High-cost loans accounted for the majority (56.6 percent) of all loans originated
to borrowers in Miami Gardens in 2006.
Denial Disparity Analysis of Single Family Lending
As indicated in Table 21 and Figure 17, African-American borrowers in Miami Gardens were
denied single family loans 34.7 percent of the time, similar to white non-Hispanic borrowers who
were rejected 32.4 percent of the time. In contrast, Hispanic borrowers were denied a much
lower 20.9 percent of time.
Table 21: Denial Rates and Disparity Ratios for Single-Family Loans by Race/Ethnicity in Miami Gardens
Race/Ethnicity of Borrower Denial Rate Ratio of that Race to
White (Denial Ratio) Applications Denials % Denied
White Non-Hispanic 145 47 32.4% 1.00
Black or African American 1,026 356 34.7% 1.07
Hispanic or Latino 636 133 20.9% 0.65
Asian 22 4 18.2% 0.56
Total 1,829 540 29.5% 0.91
Figure 17: Single-Family Loan Denial and Disparity Rates by Race/Ethnicity in Miami Gardens
0.00
0.20
0.40
0.60
0.80
1.00
1.20
0%
5%
10%
15%
20%
25%
30%
35%
40%
White Non-Hispanic Black or AfricanAmerican
Hispanic or Latino Asian
Disp
arity Ratio
M
arke
t Sh
are
Denial Rate Disparity Ratio

82
LMI applicants were more likely to be denied a single family loan compared to MUI borrowers.
LMI borrowers were denied loans 1.32 times as often as more affluent borrowers (See below -
Table 22 and Figure 18).
Table 22: Denial Rates and Disparity Ratios for Single-Family Loans by Income Bracket of Borrowers in Miami Gardens
Income Bracket of Borrower Household
Denial Rate Ratio of that Income Group to Upper
(Denial Ratio) Applications Denials % Denied
Low (<50% MSA Income) 160 82 51.3% 1.90
Moderate (50-79.99% MSA
Income) 415 126 30.4% 1.13
Middle (80 to 119.99% MSA
Income) 660 183 27.7% 1.03
Upper (>120% MSA Income) 676 182 26.9% 1.00
LMI (<80% MSA Income) 575 208 36.2% 1.32
MUI (>80% MSA Income) 1,336 365 27.3% 1.00
Total 1,911 573 30.0% -
Figure 18: Single-Family Loan Denial and Disparity Rates by Household Income in Miami Gardens
0.00
0.20
0.40
0.60
0.80
1.00
1.20
1.40
0%
5%
10%
15%
20%
25%
30%
35%
40%
LMI (<80% MSA Income) MUI (>80% MSA Income)
Disp
arity Ratio
Mar
ket
Shar
e
Denial Rate Disparity Ratio

83
Consistent with the above trends, borrowers for properties within LMI Census tracts were 1.14
times as likely to be denied a single family loan, as compared to those in MUI Census tracts
(Table 23).
Table 23: Denial Rates and Disparity Ratios for Single-Family Loans by Income Bracket of Census Tracts in Miami Gardens
Income Bracket of Census Tract
Denial Rate Ratio of that Income Group to Upper (Denial Ratio) Applications Denials % Denied
Low (<50% MSA Income) 0 0 0% -
Moderate (50 to 79.99%
MSA Income) 262 88 33.6% 1.03
Middle (80 to 119.99%
MSA Income) 1,462 420 28.7% 0.88
Upper (>120% MSA
Income) 336 110 32.7% 1.00
LMI (<80% MSA Income) 262 88 33.6% 1.14
MUI (>80% MSA Income) 1,798 530 29.5% 1.00
Total 2,060 618 30.0% -
Finally, an analysis of single family lending in Miami Gardens reveals that there were no great
disparities in home lending when gender was considered (Table 24).
It is worth noting that the quantity of loan originations, both prime and subprime, within Miami
Gardens has declined significantly since the previous 2006 AI report, with total originations down
nearly 87 percent from 2006 levels. The number of prime loans that originated in 2014 was 79
percent lower than 2006, while subprime loan originations have declined over 92 percent during
the same time period. This pattern is consistent with the impacts of the economic downturn
associated with the financial crisis of 2007-08 and the subsequent tightening of credit markets
that occurred in its aftermath.
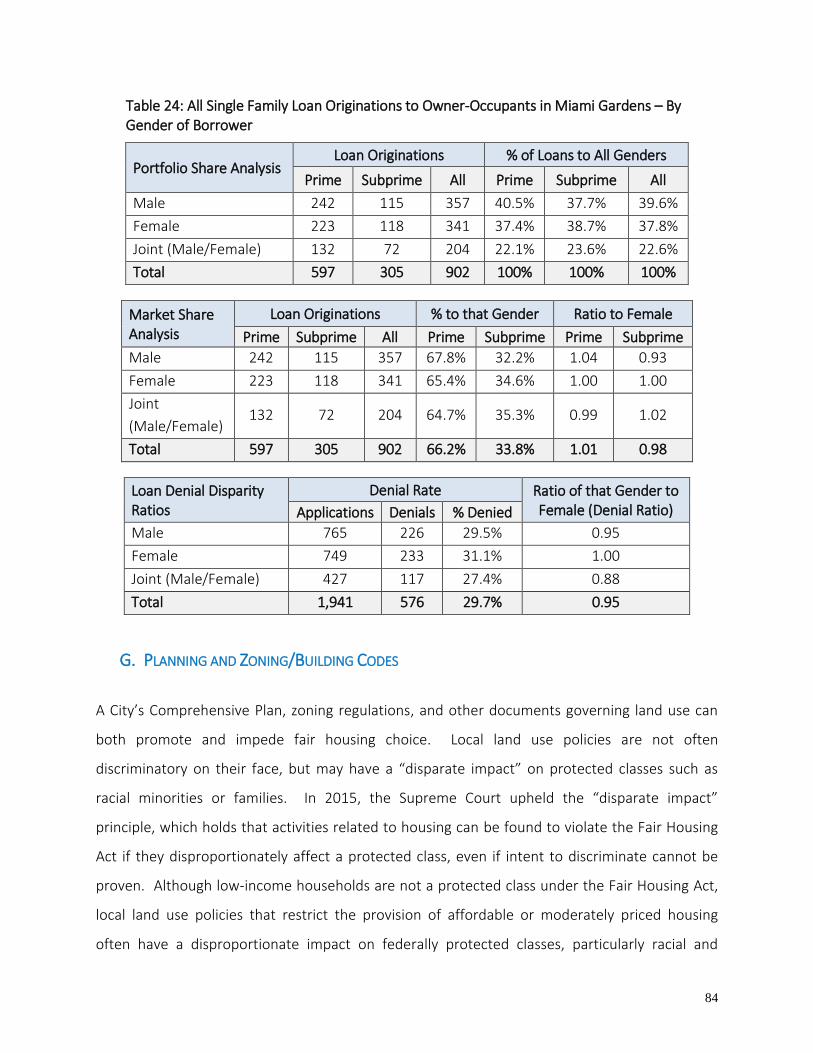
84
Table 24: All Single Family Loan Originations to Owner-Occupants in Miami Gardens – By Gender of Borrower
Portfolio Share Analysis Loan Originations % of Loans to All Genders
Prime Subprime All Prime Subprime All
Male 242 115 357 40.5% 37.7% 39.6%
Female 223 118 341 37.4% 38.7% 37.8%
Joint (Male/Female) 132 72 204 22.1% 23.6% 22.6%
Total 597 305 902 100% 100% 100%
Market Share Analysis
Loan Originations % to that Gender Ratio to Female
Prime Subprime All Prime Subprime Prime Subprime
Male 242 115 357 67.8% 32.2% 1.04 0.93
Female 223 118 341 65.4% 34.6% 1.00 1.00
Joint
(Male/Female) 132 72 204 64.7% 35.3% 0.99 1.02
Total 597 305 902 66.2% 33.8% 1.01 0.98
Loan Denial Disparity Ratios
Denial Rate Ratio of that Gender to Female (Denial Ratio) Applications Denials % Denied
Male 765 226 29.5% 0.95
Female 749 233 31.1% 1.00
Joint (Male/Female) 427 117 27.4% 0.88
Total 1,941 576 29.7% 0.95
G. PLANNING AND ZONING/BUILDING CODES
A City’s Comprehensive Plan, zoning regulations, and other documents governing land use can
both promote and impede fair housing choice. Local land use policies are not often
discriminatory on their face, but may have a “disparate impact” on protected classes such as
racial minorities or families. In 2015, the Supreme Court upheld the “disparate impact”
principle, which holds that activities related to housing can be found to violate the Fair Housing
Act if they disproportionately affect a protected class, even if intent to discriminate cannot be
proven. Although low-income households are not a protected class under the Fair Housing Act,
local land use policies that restrict the provision of affordable or moderately priced housing
often have a disproportionate impact on federally protected classes, particularly racial and
85
ethnic minorities. Moreover, Florida law prohibits discrimination in land use and development
permitting decisions based on the development’s source of financing (F.S. 760.26), which
provides a legal tool for subsidized developments facing NIMBY (Not In My Back Yard) resistance
from neighbors.
As a typical suburb dominated by single-family residential land uses, the impact of land use
policies in Miami Gardens is similar to that in other communities in Miami-Dade County.
Additionally, Miami Gardens is mostly built out, and it would be difficult to substantially change
the profile of its residential neighborhoods without extensive redevelopment. However, the City
still has a few pockets of vacant land (see Figure 19 below), and even sporadic redevelopment
opportunities can contribute significantly to fair housing choice for protected groups.
To identify land use provisions that affect fair housing choice in the City of Miami Gardens, we
reviewed the following documents:
Comprehensive Development Master Plan, Housing Element
Zoning and Land Development Code (Municipal Code Chapter 34)
Resolution No. 2008-186-873
Local Housing Assistance Plan (LHAP)
The Comprehensive Plan’s Housing Element supports the principle of permitting a variety of
housing sizes and types to meet the needs of households across the income spectrum. In
particular, the Housing Element calls for land development regulations to permit single room
occupancy (SRO) developments, allow accessory dwelling units (ADUs) in residential zoning
districts with lot sizes of 5,000 square feet or larger, and offer incentives such as density and
height bonuses for workforce housing development.

86
Figure 19: Vacant Land in Miami Gardens (prepared by the City of Miami Gardens Planning & Zoning Department, April 2013)

87
The Zoning and Land Development Code (LDC) provides a framework for incentivizing “workforce
housing,” defined as housing that is affordable to families with incomes ranging from 65% to
200% of Area Median Income. Incentives include eligibility for full or partial waivers of
permitting fees; expedited building permitting; eligibility for waived impact fees if an alternate
funding source is available to pay the fees; and possible density bonuses, reduced parking and
setback requirements, zero-lot-line housing, and street requirement reductions. However,
neither the Zoning and Land Development Code nor Resolution No. 2008-186-873, which
“form[s] the basis for these workforce housing incentive provisions” (Municipal Code §34-
182(a)), provide a specific schedule of incentives based on a development’s percentage of
workforce housing units or their targeted income brackets. Rather, the Code gives wide latitude
to the Planning and Zoning Department, the Community Development Department, and the City
Council to approve incentive packages on a case-by-case basis.
The LDC does not explicitly authorize Accessory Dwelling Units. The only mention of ADUs is in
Appendix A of the LDC, where the definition of a detached single-family residential use states
that the lot of record “is not shared with any other dwelling, except as may be provided in this
chapter for an accessory dwelling unit” (emphasis added). The provision that comes closest to
authorizing ADUs is in §34-628(h), which states that “Accessory uses [in Planned Development
districts] which are designed in a manner compatible with the planned area development and
relate to the common needs of its inhabitants shall be permitted.”
Certain other provisions mention or allude to accessory structures and uses without specifically
referring to ADUs. Section 34-89(b)(6) notes that “An application for the construction of, an
addition to or renovation of a guest house, garage apartment or other similar accessory units on
parcels zoned to permit such uses which do not create additional impacts on public facilities,”
are exempted from concurrency requirements. The definitions of “accessory building or
structure” and “accessory use” provide that they are “incidental and subordinate in purpose,
dimension, area, and extent” to the principal building or use (§34-732). Additionally, §34-310(b)
expressly prohibits accessory uses that are not specifically permitted or listed as related uses,

88
and §34-288(39) prohibits illegal subdivision of a residential unit. Similarly, the development
standard for spacing between principal buildings in §34-342 is “not applicable (only one dwelling
per lot)” (emphasis added).
The lack of clear authorization for ADUs in the LDC stands in contrast to the City’s 2013-2016
Local Housing Assistance Plan (LHAP), which lists the allowance of ADUs in residential zoning
districts as an incentive strategy. Resolution No. 2008-186-873, meanwhile, makes no mention
of ADUs.
The LDC also fails to explicitly authorize SRO developments. In residential districts, community
residential facilities with up to six residents are permitted, while those with seven or more
residents are allowed by special exception. However, community residential facilities must be
state-licensed and have intensive on-site staffing and services, whereas SRO developments are
generally envisioned as an option for living independently.
Overall, the development standards in Miami Gardens’ LDC, including maximum densities and
setback requirements, are not onerous or unusual. For example, the single-family residential
zoning district (R-1) allows a density of up to 6 units per acre, even without incentives for
workforce housing. Moreover, as shown in Figure 19 above, several large tracts of vacant land
are zoned for low-medium density and medium-density residential development. However,
some requirements for frontage, lot coverage, and minimum dwelling unit size may be more
stringent than necessary, and are not explicitly authorized to be adjusted as part of the
workforce housing incentive program. For example, the minimum size for a studio apartment is
650 square feet. However, proposed residential units in the Planned Corridor Development
district may receive moderate square footage reductions as an incentive for market-rate
development (minimum 85% of units are market-rate) or sustainable building features (§34-
531).
Local building codes also have implications for fair housing choice, especially for people with
89
disabilities who need homes with accessibility features. Miami Gardens is subject to the 2010
Florida Building Code, which integrates the 2010 Federal Americans with Disabilities Act
requirements into its Accessibility Code.
IV. ACTION TAKEN TO REDUCE IMPEDIMENTS
The City’s 2008 Analysis of Impediments identified five (5) impediments to fair housing choice
evident in the City of Miami Gardens:
1. Violations of federal, state, and local fair housing laws in the jurisdiction and immediate
surrounding areas
2. Lack of awareness of fair housing laws, issues and resources
3. Racial disparities in fair and equal lending
4. A strongly segregated housing market
5. Limited funding availability for the creation of affordable housing opportunities
The City has taken the following actions to reduce the identified impediments:
1. Violations of federal, state, and local fair housing laws in the jurisdiction and immediate
surrounding areas.
Goal: Reduce incidences of housing discrimination
Strategy: Provide fair housing training to all recipients receiving City funds for housing-
related and community-based projects.
Accomplishments: See Table 25.
2. Lack of awareness of fair housing laws, issues and resources
Goal: Educate the community about its rights and responsibilities regarding fair housing
Strategy: Educate City employees regarding responsibility to affirmatively further fair
housing. Develop a Fair Housing Educational Campaign to increase resident and landlord
awareness and knowledge of fair housing, expand fair housing information on the City’s

90
website, make fair housing information and housing discrimination brochures available for
City residents, provide fair housing information to all housing program participants,
coordinate with appropriate organizations to offer a citywide fair housing training workshop
to the general public, include the City’s commitment to affirmatively further fair housing
choice in the City’s Housing Policy Manual.
Accomplishments: See Table 26.
3. Racial disparities in fair and equal lending
Goal: Reduce discriminatory and abusive practices in lending
Strategy: Provide fair housing education and outreach workshops to housing providers.
Provide fair housing training to all recipients receiving City funds for housing-related and
community-based projects.
Accomplishments: See Table 27.
4. A strongly segregated housing market
Goal: Promote integration and diversity within the City of Miami Gardens
Strategies: Provide fair housing training to all recipients receiving City funds for housing
related and community-based projects.
Accomplishments: See Table 28.
5. Limited funding availability for the creation of affordable housing opportunities
Goal: Provide more affordable housing
Strategy: Emphasize mixed income housing in all neighborhoods. Support pre-purchase
counseling programs.
Accomplishments: See Table 29.
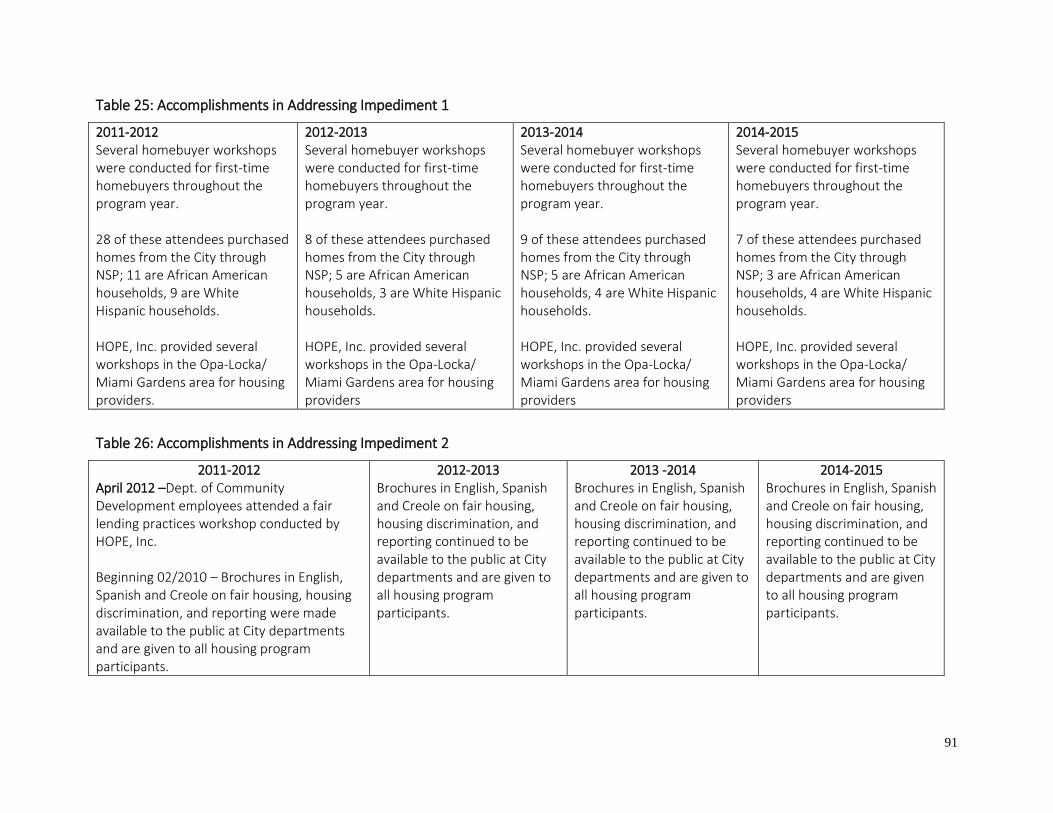
91
Table 25: Accomplishments in Addressing Impediment 1
2011-2012 Several homebuyer workshops were conducted for first-time homebuyers throughout the program year. 28 of these attendees purchased homes from the City through NSP; 11 are African American households, 9 are White Hispanic households. HOPE, Inc. provided several workshops in the Opa-Locka/ Miami Gardens area for housing providers.
2012-2013 Several homebuyer workshops were conducted for first-time homebuyers throughout the program year. 8 of these attendees purchased homes from the City through NSP; 5 are African American households, 3 are White Hispanic households. HOPE, Inc. provided several workshops in the Opa-Locka/ Miami Gardens area for housing providers
2013-2014 Several homebuyer workshops were conducted for first-time homebuyers throughout the program year. 9 of these attendees purchased homes from the City through NSP; 5 are African American households, 4 are White Hispanic households. HOPE, Inc. provided several workshops in the Opa-Locka/ Miami Gardens area for housing providers
2014-2015 Several homebuyer workshops were conducted for first-time homebuyers throughout the program year. 7 of these attendees purchased homes from the City through NSP; 3 are African American households, 4 are White Hispanic households. HOPE, Inc. provided several workshops in the Opa-Locka/ Miami Gardens area for housing providers
Table 26: Accomplishments in Addressing Impediment 2
2011-2012 April 2012 –Dept. of Community Development employees attended a fair lending practices workshop conducted by HOPE, Inc. Beginning 02/2010 – Brochures in English, Spanish and Creole on fair housing, housing discrimination, and reporting were made available to the public at City departments and are given to all housing program participants.
2012-2013 Brochures in English, Spanish and Creole on fair housing, housing discrimination, and reporting continued to be available to the public at City departments and are given to all housing program participants.
2013 -2014 Brochures in English, Spanish and Creole on fair housing, housing discrimination, and reporting continued to be available to the public at City departments and are given to all housing program participants.
2014-2015 Brochures in English, Spanish and Creole on fair housing, housing discrimination, and reporting continued to be available to the public at City departments and are given to all housing program participants.

92
Table 27: Accomplishments in Addressing Impediment 3
2011-2012 HOPE, Inc. provided several workshops in the Opa-Locka/ Miami Gardens area for housing providers. Several homebuyer workshops were conducted for first-time homebuyers throughout the program year.
2012-2013 HOPE, Inc. provided several workshops in the Opa-Locka/ Miami Gardens area for housing providers. Several homebuyer workshops were conducted for first-time homebuyers throughout the program year.
2013-2014 HOPE, Inc. provided several workshops in the Opa-Locka/ Miami Gardens area for housing providers. Several homebuyer workshops were conducted for first-time homebuyers throughout the program year.
2014-2015 HOPE, Inc. provided several workshops in the Opa-Locka/ Miami Gardens area for housing providers. Several homebuyer workshops were conducted for first-time homebuyers throughout the program year.
Table 28: Accomplishments in Addressing Impediment 4
2011-2012 Several homebuyer workshops were conducted for first-time homebuyers throughout the program year.
28 of these attendees purchased homes from the City through NSP; 11 are African American households, 9 are White Hispanic households.
2012-2013 Several homebuyer workshops were conducted for first-time homebuyers throughout the program year.
8 of these attendees purchased homes from the City through NSP; 5 are African American households, 3 are White Hispanic households.
2013-2014 Several homebuyer workshops were conducted for first-time homebuyers throughout the program year.
9 of these attendees purchased homes from the City through NSP; 5 are African American households, 4 are White Hispanic households.
2014-2015 Several homebuyer workshops were conducted for first-time homebuyers throughout the program year.
7 of these attendees purchased homes from the City through NSP; 3 are African American households, 4 are White Hispanic households.

93
Table 29: Accomplishments in Addressing Impediment 5
2011-2102 Beginning in 2009 the City began purchasing foreclosed and abandoned homes; 74 have been purchased and 49 have been sold to income eligible first-time homebuyers throughout the City. Several homebuyer workshops were conducted for first-time homebuyers throughout the program year 28 of these attendees purchased homes from the City through NSP. 11 are African American households, 9 are White Hispanic households.
2012-2103 Beginning in 2009 the City began purchasing foreclosed and abandoned homes; 74 have been purchased and 55 have been sold to income eligible first-time homebuyers throughout the City, and 2 were conveyed to non-profit entities for rental to individuals at or below 50% AMI.
Several homebuyer workshops were conducted for first-time homebuyers throughout the program year. 8 of these attendees purchased homes from the City through NSP; 5 are African American households, 3 are White Hispanic households.
2013-2014 Beginning 2009 the City began purchasing foreclosed and abandoned homes; 74 have been purchased and 64 have been sold to income eligible first-time homebuyers throughout the City, and 2 were conveyed to non-profit entities for rental to individuals at or below 50% AMI. Several homebuyer workshops were conducted for first-time homebuyers throughout the program year.
9 of these attendees purchased homes from the City through NSP; 5 are African American households, 4 are White Hispanic households.
2014-2015 Beginning 2009 the City began purchasing foreclosed and abandoned homes; 79 have been purchased and 69 have been sold to income eligible first-time homebuyers throughout the City, and 2 were conveyed to non-profit entities for rental to individuals at or below 50% AMI.
Several homebuyer workshops were conducted for first-time homebuyers throughout the program year. 7 of these attendees purchased homes from the City through NSP; 3 are African American households, 4 are White Hispanic households.
V. CONCLUSIONS AND RECOMMENDATIONS
A. IDENTIFIED IMPEDIMENTS TO FAIR HOUSING CHOICE
The Analysis of Impediments to Fair Housing Choice for the City of Miami Gardens points to
multiple and, in many cases, interrelated areas of need. These impediment issues emerged from
a thorough review of current policies and practices in both the public and private sectors,
extensive public input, and a detailed examination of socioeconomic data. Each major
impediment is summarized on the following pages, along with a brief overview of the existing
conditions surrounding each issue and proposed implementation strategies to address identified

94
resource gaps and needs.
1. Lack of sufficient affordable housing options
2. Lack of initiatives to affirmatively further fair housing
3. A strongly segregated housing market
4. Incomplete government support system for fair housing
5. Discriminatory lending practices
6. Restrictive land use and zoning regulations
Impediment 1: Lack of Sufficient Affordable Housing Options
Assessment: The supply of affordable housing in the City of Miami Gardens, both for
purchase and for rent, is inadequate to meet current and future demand. The provision of
fair housing and the availability of affordable housing are closely linked. While not strictly a
fair housing issue, the impact of affordability on housing choice cannot be overlooked.
According to the 2014 ACS, nearly 71% of renters and 59% of homeowners with a mortgage
are considered cost burdened. The shortage of affordable housing options for Miami
Gardens residents creates an impediment to fair housing choice.
Strategies:
I. Improve coordination with Countywide affordable housing efforts.
II. Collaborate with area housing developers who provide additional affordable housing
options.
III. Provide information and technical assistance on housing development programs
IV. Emphasize mixed income housing in all neighborhoods
V. Support pre-purchase counseling programs
Outcome Measures:
I. Increased number of affordable housing units developed
II. Increase in funding made available, or other financial equivalents, to affordable
housing developers
95
III. Increased visibility and activity for area lenders including Community Development
Financial Institutions (CDFIs).
Impediment 2: Lack of Initiatives to Affirmatively Further Fair Housing
Assessment: Indicators point to a general lack of fair housing awareness in the City of Miami
Gardens. There were 85 fair housing complaints in the City from 2009-2015, but they may
represent only a fraction of all instances of housing discrimination in Miami Gardens. As
survey results showed, only one of the 16 respondents who believed they had experienced
housing discrimination actually reported it, and a substantial share of respondents had little
or no knowledge of fair housing laws or processes for filing a complaint. The results of the
Fair Housing Survey conducted in the City of Miami Gardens support the need for an on-
going effort to educate the community regarding their rights under fair housing laws.
It is no longer sufficient for the government to respond after housing problems arise. In
order to affirmatively further fair housing, it is incumbent upon the City of Miami Gardens to
anticipate potential problem areas and proactively seek solutions. Recent HUD guidance
suggests broader protections for members of the LGBT community, military personnel, and
individuals with a criminal record who may be adversely affected by current fair housing
practices.
Strategies:
I. Overhaul marketing strategies for all counseling, rehabilitation, and public services
II. Ensure equal inclusion in housing programs for minorities, the LGBT community, and
other protected classes in Miami Gardens
III. Provide technical assistance in affirmative marketing to recipients of City-
administered housing development funds
IV. Provide fair housing training for City government staff, community advocates,
housing providers, and financial institutions
V. Update Limited English Proficiency plan to ensure persons with limited English
proficiency have meaningful access to all housing programs and activities, whether
96
publicly or privately provided. Deliver multi-language format presentations to
community members
Outcome Measures:
I. Increased reach of all targeted marketing efforts
II. Increase the reporting of complaints from persons who believe they have
experienced or witnessed discrimination.
III. Program participation that is reflective of the racial and ethnic composition of the
City’s low-income population
Impediment 3: A strongly segregated housing market
Assessment: The City of Miami Gardens is an extremely segregated community. The east
side of the City has a heavy concentration of African Americans – over 85% in many Census
tracts. The Hispanic population is concentrated in the western portion of the city. This type
of racial divide is specifically addressed in the new AFFH rule, which directs jurisdictions to
take meaningful actions to overcome historic patterns of segregation.
The City must affirmatively further fair housing by addressing the disparities in housing needs
and in access to opportunity, replacing segregated living patterns with truly integrated and
balanced living patterns, and create opportunity in existing concentrations of poverty. The
goal of the AFFH Final Rule is to create communities free from barriers that restrict access to
opportunity based on protected characteristics. To this end, the City of Miami Gardens must
take action across all housing-related programs and activities.
Strategies:
I. Undertake an analysis of housing utilizing the new AFH Assessment Tool
II. Encourage mixed-income development in areas with a high concentration of poverty
or a single racial group
III. Encourage development of affordable housing for low- and moderate-income
households in high-opportunity neighborhoods
97
Outcome Measures:
I. Significantly lower concentrations of poverty
II. Significantly lower concentrations of a single race within a Census tract
Impediment 4: Incomplete government support system for fair housing
Assessment: There are several factors that combine to hamper the ability of the City of
Miami Gardens to effective further fair housing. The Miami-Dade County Ordinance has not
obtained substantial equivalency certification from HUD. Such certification would present
numerous advantages such as funding availability, local complaint processing under a
substantially equivalent law, and new partnership opportunities.
Additionally, the process for residents to file and track fair housing complaints in Miami-Dade
County is opaque, with conflicting information on the respective roles of HOPE, Inc. and the
Human Rights & Fair Employment Practices Division of the Miami-Dade County Human
Resources Department in processing fair housing complaints. Information on the nature of
complaints that have been filed in Miami Gardens in recent years is not readily available.
There is also a notable lack of housing-related services in the City: there are no resources
dedicated to the homeless population, the Miami-Dade Public Housing & Community
Development waitlists for public housing are closed, and the current transportation system is
not as extensive as it could be for commuters and other residents. Additionally, in order to
maintain the City’s affordable housing stock, there is a need for increased efforts in code
enforcement and preservation of housing stock, in addition to physical surveys of external
housing conditions.
Strategies:
I. Work with Miami-Dade County to obtain substantial equivalency certification for the
County’s fair housing ordinance
II. Work with appropriate County offices, HOPE, Inc., and the HUD Miami Field Office as
necessary to improve coordination of the system for receiving and tracking fair
housing complaints.

98
III. Provide training for the City’s Mayor, Council, and Manager to ensure that the City is
affirmatively furthering fair housing in all housing and housing-related activities,
whether publicly or privately provided. Additionally, ensure that all public
stakeholders understand the City’s responsibilities under the new Affirmatively
Furthering Fair Housing regulations.
Outcome Measures:
I. Substantial equivalency certification for County fair housing ordinance
II. A streamlined and effective system for receiving and tracking fair housing complaints
III. Fully-trained governing body
Impediment 5: Discriminatory lending practices
Assessment: There are two concerns about barriers to fair lending: access to conventional
prime loans and the infusion of FHA and sub-prime lending into minority markets. Home
Mortgage Disclosure Act (HDMA) data for Miami Gardens indicate White non-Hispanic
borrowers receive a disproportionately high portion of prime loans and smaller portion of
high-cost loans, as compared to their share of Miami Garden’s households. Hispanics receive
a significantly larger portion of high-cost loans than their share of households. Additionally,
low- and moderate-income borrowers receive a disproportionately low share of all mortgage
loans.
African-American borrowers comprise the largest share of households (76 percent) in Miami
Gardens, but this borrower group receives a smaller portion of both prime and high-cost
loans, as compared to their percentage of the City’s households. African-American
borrowers are 3.66 times more likely than white non-Hispanic borrowers to receive a high-
cost loan, and Hispanic borrowers are 5.64 times more likely to receive a high-cost loan than
their White non-Hispanic counterparts.
Strategies:
I. Develop and deliver targeted marketing efforts to increase minority and low-income
participation in credit counseling and home ownership programs

99
II. Expand credit counseling programs for both potential homebuyers and existing
homeowners
III. Expand financial literacy training programs for both potential homebuyers and
existing homeowners
Outcome Measures:
I. Demonstrated record of expanded marketing efforts
II. Program participation that is reflective of the racial and ethnic composition of the
City’s low-income population
III. Increase in minority and low-income home mortgage applications
IV. Increase in minority and low-income home ownership
V. Increase in educational programming
Impediment 6: Restrictive land use and zoning regulations
Assessment: The Housing Element of Miami Gardens’ Comprehensive Plan calls for certain
progressive land use policies, such as for Accessory Dwelling Units (ADUs) and Single-Room
Occupancy (SRO) developments, that are not reflected in the Land Development Code (LDC).
Additionally, the voluntary workforce housing program lacks specificity, and some
development standards (such as minimum unit size and setbacks) may be more restrictive
than necessary. Any expansion of incentives for the development of affordable housing will
expand fair housing choice opportunities for low-income residents.
Strategies:
I. Provide a specific schedule of incentives for workforce housing
II. Ease requirements for residential development, such as minimum unit sizes and
setbacks
Outcome Measures:
I. Specific workforce housing incentives that reward developers for producing more
units and/or targeting lower income brackets

100
II. Review and relaxation of existing requirements for minimum setbacks, lot frontage,
lot coverage, building square footage, and minimum dwelling unit size
B. 2015 SUPREME COURT RULING ON FAIR HOUSING
On June 25, 2015, the Supreme Court handed down a landmark fair housing ruling that upheld
the ability to bring “disparate impact” claims under Fair Housing Act. The Fair Housing Act of
1968, an integral legislative victory of the Civil Rights Movement, protects people from
discrimination when they are renting, buying, or securing financing for housing. The case, Texas
Department of Housing and Community Affairs v. Inclusive Communities Project, centered on the
question of whether a policy or action has to be intentionally discriminatory, or merely have a
discriminatory effect, in order to qualify as a valid basis for a discrimination claim under the Act.
Inclusive Communities, a Dallas-based non-profit, claimed that the Texas Department of Housing
and Community Affairs was guilty of housing discrimination because the way in which the state
allocated Low Income Housing Tax Credits perpetuated racial segregation by limiting the
development of affordable housing to areas that were historically impoverished with high
concentrations of minorities. The state claimed that no discrimination occurred because its
intention was not to promote racial segregation but to revitalize these underserved areas by
injecting much needed capital for the development of new affordable housing. Inclusive
Communities claimed that regardless of intention, the state’s decision to fund tax-credit projects
only in minority and poverty-laden neighborhoods resulted in segregation, and thus had a
discriminatory effect (disparate impact).
Fair housing advocates across the nation watched the case closely and worried that if the
Supreme Court ruled against disparate impact claims, it would essentially “defang” the Fair
Housing Act by removing a key basis for liability. Intent is much harder to prove than effect.
Ultimately the Court ruled 5-4 to uphold the lower court decisions in favor of Inclusive
Communities, salvaging fair housing disparate impact claims.

101
C. CONCLUSION AND NOTE ON HUD’S NEW FAIR HOUSING FINAL RULE
The Fair Housing Act of 1968 directs the U.S. Department of Housing and Urban Development
and its program participants to promote fair housing and equal opportunity. The Act was
intended to ensure that every person in America has the right to fair housing, regardless of their
race, color, national origin, religion, sex, disability or familial status. This Analysis of Impediments
to Fair Housing Choice has reviewed the various factors affecting fair housing in Miami Gardens.
The City continues to make strides in affirmatively furthering fair housing and ensuring that all
citizens have equal access to decent housing options.
HUD released a final rule in July 2015 to equip communities that receive HUD funding with
reporting tools to help them meet fair housing obligations for the purpose of their use of HUD
funds. HUD’s final rule clarifies and simplifies existing fair housing obligations and creates a
more streamlined Fair Housing planning process. HUD’s final rule is a response to
recommendations of a 2010 Government Accountability Office report as well as stakeholders
and program participants who asked for clearer guidance, more technical assistance, better
compliance and more meaningful outcomes. As the final rule is implemented, HUD will work
with grantees to establish more effective local goals and priorities to address the fair housing
barriers in their community.
Additional information about the Affirmatively Furthering Fair Housing Final Rule can be retrieved
at: www.hud.gov/AFFH.

102
D. FAIR HOUSING PLAN
GOAL #1: REDUCE INCIDENCE OF HOUSING DISCRIMINATION
Fair Housing Activities Action/Agreement required Measurable Results Program/Staff Responsibility
Time Period for Completion
Provide fair housing education and outreach workshops to housing providers to foster compliance with federal, state, and local fair housing laws
Develop or update training curriculum and coordinate efforts of housing providers
Number of completed workshops/trainings and number of individuals reached
Community Development
Or Sub-recipient/
contractor
Support private enforcement of fair housing laws
Partner with local public and private fair housing agencies to coordinate most effective means of processing and referring complaints
Number of complaints referred and/or resolved
Community Development
Or Sub-recipient/
contractor
Provide fair housing and affirmative marketing training to all recipients receiving City funds for housing related and community based projects and monitor compliance, where appropriate
Identify participants, develop training curriculum, and collect materials to be distributed
Increased access to housing opportunities funded by the City
Community Development
Or Sub-recipient/
contractor
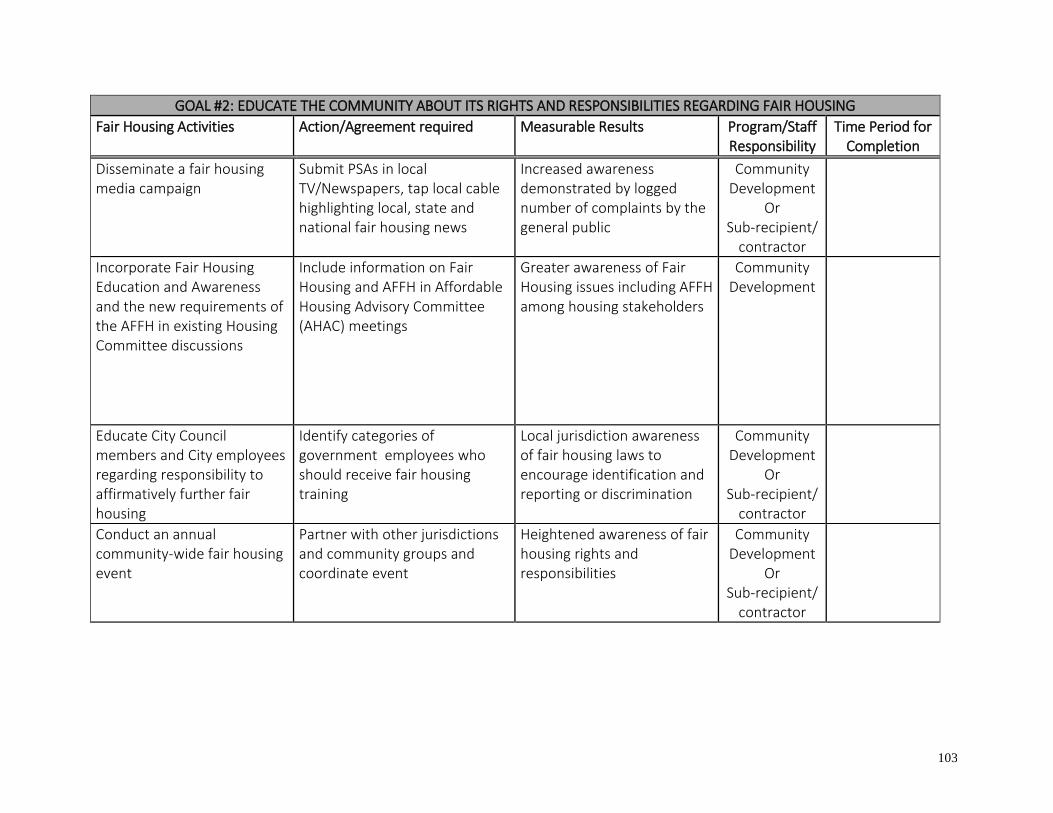
103
GOAL #2: EDUCATE THE COMMUNITY ABOUT ITS RIGHTS AND RESPONSIBILITIES REGARDING FAIR HOUSING
Fair Housing Activities Action/Agreement required Measurable Results Program/Staff Responsibility
Time Period for Completion
Disseminate a fair housing media campaign
Submit PSAs in local TV/Newspapers, tap local cable highlighting local, state and national fair housing news
Increased awareness demonstrated by logged number of complaints by the general public
Community Development
Or Sub-recipient/
contractor
Incorporate Fair Housing Education and Awareness and the new requirements of the AFFH in existing Housing Committee discussions
Include information on Fair Housing and AFFH in Affordable Housing Advisory Committee (AHAC) meetings
Greater awareness of Fair Housing issues including AFFH among housing stakeholders
Community Development
Educate City Council members and City employees regarding responsibility to affirmatively further fair housing
Identify categories of government employees who should receive fair housing training
Local jurisdiction awareness of fair housing laws to encourage identification and reporting or discrimination
Community Development
Or Sub-recipient/
contractor
Conduct an annual community-wide fair housing event
Partner with other jurisdictions and community groups and coordinate event
Heightened awareness of fair housing rights and responsibilities
Community Development
Or Sub-recipient/
contractor

104
GOAL #3: REDUCE DISCRIMINATORY AND ABUSIVE PRACTICES IN LENDING
Fair Housing Activities Action/Agreement required Measurable Results Program/Staff Responsibility
Time Period for Completion
Reduce differences in the market penetration for various racial and ethnic areas
Examine disparities and create a plan to rectify the differences
Decreased differences in market penetration amongst racial and ethnic minorities
Community Development
Or Sub-recipient/
contractor
GOAL #4: PROMOTE INTEGRATION AND DIVERSITY WITHIN THE CITY OF MIAMI GARDENS
Fair Housing Activities Action/Agreement required Measurable Results Program/Staff Responsibility
Time Period for Completion
Provide technical assistance in affirmative marketing to recipients of City-administered housing development funds
Identify and require recipients to participate in training; contract with local fair housing agency to provide training
Training provided to City-funded recipients
Community Development
Or Sub-recipient/
contractor
Provide fair housing training for City government staff, community advocates, housing providers and financial institutions
Identify and coordinate prospective participants and contract with local fair housing center
Educational workshops provided for various community groups
Community Development
Or Sub-recipient/
contractor
Provide multi-language format presentations to community members
Identify locations to provide workshops and contract with local fair housing center
Increased awareness on the part of residents
Community Development
Or Sub-recipient/
contractor

105
GOAL #5: PROVIDE MORE AFFORDABLE HOUSING
Fair Housing Activities Action/Agreement required Measurable Results Program/Staff Responsibility
Time Period for Completion
Provide information and technical assistance on housing development programs
Provide training or contract for professional services
Increase in affordable housing development
Community Development Or
Sub-recipient/contractor
Emphasize mixed income housing in all neighborhoods
Select neighborhoods being targeted for redevelopment
Increase in racially, ethnically, and economically diverse neighborhoods
Community Development Or
Sub-recipient/contractor
Support pre-purchase counseling programs
Provide training or contract for professional services
Increased diversity in City
Community Development Or
Sub-recipient/contractor
106
SIGNATURE PAGE
See Attached Resolution 2016-129-3028 City of Miami Gardens
Reviewed and accepted July 13, 2016.
107

108

109