analysis of granular flow in a pebble-bed nuclear...
TRANSCRIPT
Analysis of Granular Flow in a Pebble-Bed Nuclear Reactor
Chris H. Rycroft1, Gary S. Grest2, James W. Landry3, and Martin Z. Bazant11Department of Mathematics, Massachusetts Institute of Technology, Cambridge, MA 02139
2Sandia National Laboratories, Albuquerque, NM 87185 and3Lincoln Laboratory, Massachusetts Institute of Technology, Lexington, MA 02420
Pebble-bed nuclear reactor technology, which is currently being revived around the world, raisesfundamental questions about dense granular flow in silos. A typical reactor core is composed ofgraphite fuel pebbles, which drain very slowly in a continuous refueling process. Pebble flow ispoorly understood and not easily accessible to experiments, and yet it has a major impact onreactor physics. To address this problem, we perform full-scale, discrete-element simulations inrealistic geometries, with up to 440,000 frictional, viscoelastic 6cm-diameter spheres draining in acylindrical vessel of diameter 3.5m and height 10m with bottom funnels angled at 30◦ or 60◦. We alsosimulate a bidisperse core with a dynamic central column of smaller graphite moderator pebbles andshow that little mixing occurs down to a 1:2 diameter ratio. We analyze the mean velocity, diffusionand mixing, local ordering and porosity (from Voronoi volumes), the residence-time distribution,and the effects of wall friction and discuss implications for reactor design and the basic physics ofgranular flow.
I. INTRODUCTION
A. Background
A worldwide effort is underway to develop more eco-nomical, efficient, proliferation resistant, and safer nu-clear power [1]. A promising Generation IV reactor de-sign is the uranium-based, graphite moderated, helium-cooled very high temperature reactor [2], which of-fers meltdown-proof passive safety, convenient long-termwaste storage, modular construction, and a means ofnuclear-assisted hydrogen production and desalination.In one embodiment, uranium dioxide is contained in mi-crospheres dispersed in spherical graphite pebbles, thesize of billiard balls, which are very slowly cycled throughthe core in a dense granular flow [3, 4]. Control rods areinserted in graphite bricks of the core vessel, so there areno obstacles to pebble flow.
The pebble-bed reactor (PBR) concept, which orig-inated in Germany in the 1950s, is being revisited byseveral countries, notably China [5] (HTR-10 [6]) andSouth Africa [3] (PBMR [7]), which plan large-scale de-ployment. In the United States, the Modular PebbleBed Reactor (MPBR) [4, 8] is a candidate for the NextGeneration Nuclear Plant of the Department of Energy.A notable feature of MPBR (also present in the origi-nal South African design) is the introduction of graphitemoderator pebbles, identical to the fuel pebbles but with-out the uranium microspheres. The moderator pebblesform a dynamic central column, which serves to flattenthe neutron flux across the annular fuel region withoutplacing any fixed structures inside the core vessel. Theannular fuel region increases the power output and effi-ciency, while preserving passive safety. In the bidisperseMPBR, the moderator pebbles are smaller to reduce thepermeability of the central column and thus focus heliumgas on the outer fuel annulus. The continuous refuelingprocess is a major advantage of pebble-bed reactors over
other core designs, which typically require shutting downfor a costly dismantling and reconstruction. The randomcycling of pebbles through a flowing core also greatly im-proves the uniformity of fuel burnup.
In spite of these advantages, however, the dynamic coreof a PBR is also a cause for concern among designers andregulators, since the basic physics of dense granular flowis not fully understood. Indeed, no reliable continuummodel is available to predict the mean velocity in silosof different shapes [9], although the empirical KinematicModel [10–12] provides a reasonable fit near the orificein a wide silo [13–16]. A microscopic model for random-packing dynamics has also been proposed [17] and fittedto reproduce drainage in a wide silo [18], but a completestatistical theory of dense granular flow is still lacking.The classical kinetic theory of gases has been success-fully applied to dilute granular flows [19–21], in spiteof problems with inelastic collisions [22], but it clearlybreaks down in dense flows with long-lasting, frictionalcontacts [16, 23], as in pebble-bed reactors. Plasticitytheories from soil mechanics might seem more appropri-ate [12], but they cannot describe flows in silos of arbi-trary shape and often lead to violent instabilities [24, 25],although a stochastic flow rule [26] may resolve these dif-ficulties and eventually lead to a general theory.
For now, experiments provide important, although lim-ited, information about dense granular flows. Many ex-periments have been done on drainage flows in quasi-2dsilos where particles are tracked accurately at a trans-parent wall [9, 14–16, 27]. Some three-dimensional par-ticle tracking in granular materials and colloids has alsobeen done with magnetic resonance imaging [28], confo-cal microscopy [29], index matching with an interstitialfluid [30], and diffusing-wave spectroscopy [31], althoughthese systems are quite different from a pebble-bed re-actor core. Experimental studies of more realistic ge-ometries for PBR have mostly focused on the porositydistribution of static packings of spheres [32, 33], whichaffects helium gas flow through the core [34–36].
2
As a first attempt to observe pebble dynamics experi-mentally in a reactor model, the slow flow of plastic beadshas recently been studied in 1:10 scale models of MPBRin two different ways [37]: The trajectories of colored peb-bles were recorded (by hand) along a plexiglass wall ina half-core model, and a single radioactive tracer pebblein the bulk was tracked in three dimensions in a full-coremodel. Very slow flow was achieved using a screw mech-anism at the orifice to approximate the mean exit rateof one pebble per minute in MPBR. These experimentsdemonstrate the feasibility of the dynamic central columnand confirm that pebbles diffuse less than one diameteraway from streamlines of the mean flow. However, it isimportant to gain a more detailed understanding of peb-ble flow in the entire core to reliably predict reactor poweroutput, fuel efficiency, power peaking, accident scenariosusing existing nuclear engineering codes [38, 39].
B. Discrete-Element Simulations
Simulations are ideally suited to provide complete,three-dimensional information in a granular flow. Somesimulations of the static random packing of fuel pebblesin a PBR core have been reported [40, 41], but in thelast few years, large-scale, parallel computing technol-ogy has advanced to the stage where it is now possi-ble to carry out simulations of continuous pebble flowin a full-sized reactor geometry using the Discrete Ele-ment Method (DEM). In such simulations, each particleis accurately modeled as a sphere undergoing realisticfrictional interactions with other particles [42, 43]. Inthis paper, we present DEM simulations which addressvarious outstanding issues in reactor design, such as thesharpness of the interface between fuel and moderatorpebbles (in both monodisperse and bidisperse cores), thehorizontal diffusion of the pebbles, the geometry depen-dence of the mean streamlines, the porosity distribution,wall effects, and the distribution of “residence times” forpebbles starting at a given height before exiting the core.
Our simulations are based on the MPBR geome-try [4, 8], consisting of spherical pebbles with diameterd = 6cm in a cylindrical container approximately 10mhigh and 3.5m across. In this design there is a centralcolumn of moderating reflector pebbles, surrounded byan annulus of fuel pebbles. The two pebble types arephysically identical except that the fuel pebbles containsand-sized uranium fuel particles. Particles are continu-ously cycled, so that those exiting the container are rein-troduced at the top of the packing. In order to efficientlymaintain the central column, a cylindrical guide ring ofradius rin = 14.5d extends into the packing to z = 140d.Reflector pebbles are poured inside, while fuel pebblesare poured outside, and the guide ring ensures that twotypes do not mix together at the surface. Figure 1 showsthe two main geometries that were considered; for muchof this analysis, we have concentrated on the case whenthe exit funnel is sloped at thirty degrees, but since this
angle can have a large effect on the pebble flow, we alsoconsider the case of the when the funnel is sloped at sixtydegrees. In both cases the radius of the opening at thebottom of the funnel is rexit = 5d.
In MPBR, as in most pebble-bed reactors, the drainageprocess takes place extremely slowly. Pebbles are indi-vidually removed from the base of the reactor using ascrew mechanism, at a typical rate of one pebble perminute, and the mean residence time of a pebble is 77days. Carrying out a DEM simulation at this flow ratewould make it infeasible to collect enough meaningfuldata. However, previous experimental work by Choi etal. [16] has shown that the regime of slow, dense granu-lar flow is governed by a distinctly non-thermal picture,where particles undergo long-lasting contacts with theirneighbors, and the features of the flow are predominatelygoverned by geometry and packing constraints. In par-ticular, they observed that for a large range of hopperdrainage experiments, altering the orifice size resulted ina change in the overall flow rate, but did not alter the ge-ometry of the flow profile – the flow velocities were scaledby a constant factor. Furthermore, geometric propertiesof the flow, such as particle diffusion, were unaffectedby the overall flow rate. We therefore chose to study afaster flow regime in which pebbles drain from the reac-tor exit pipe under gravity. Our results can be relateddirectly to the reactor design by rescaling the time by anappropriate factor.
As well as the two full-scale simulations describedabove, we also considered a half-size geometry in orderto investigate how various alterations in the makeup ofthe reactor would affect the flow. In particular, we exam-ined a series of bidisperse simulations, in which the di-ameter of moderator particles in the central column wasreduced. As explained in section VIII, this has the effectof reducing the gas permeability of the central column,thus focusing the helium coolant flow on the hottest re-gion of the reactor core, in and around the fuel annulus.The purpose of the simulations is to test the feasibilityof the bidisperse PBR concept, as a function of the sizeratio of moderator and fuel pebbles, with regard to thegranular flow. It is not clear a priori under what condi-tions the dynamic column will remain stable with littleinterdiffusion of moderator and graphite pebbles.
To study this issue, we made a sequence of three runsusing a half-size reactor geometry. (The smaller core sizeis needed since the number of smaller pebbles increasesas the inverse cube of the diameter ratio.) The geometryis similar to that used above, except that the radius ofthe cylindrical container is decreased to 15d, with theguide ring at rin = 7.5d. The radius of the exit pipeis decreased to rexit = 4d. In the experiments, we keepthe diameter of the fuel pebbles fixed at d, and use d,0.8d, and 0.5d for the diameters of the moderator pebbles.The same geometry was also used to study the effectof wall friction, by making an additional run with theparticle/wall friction coefficient µw = 0.
The paper is organized as follows. In section II, we dis-

3
FIG. 1: (Color online) Snapshots of vertical cross-sections ofthe simulations for the two geometries considered in this re-port. We make use of a cylindrical coordinate system (r, θ, z)where z = 0 at the orifice. At the base of the container there isa small exit pipe of radius rexit = 5d that extends upwards toz = 10d. This connects to a conical funnel region, which hasslope thirty degrees (left) or sixty degrees (right). The con-ical wall connects to a cylindrical wall of radius rout = 29d,at z = 23.86d and z = 51.57d for the thirty and sixty degreereactor geometries respectively. Particles are poured into thecontainer up to a height of approximately z = 160d. A cylin-drical wall at rin = 14.5d extends down into the packing to aheight of z = 140d to keep the two types of pebbles mixingat the surface.
cuss the simulation technique that was used and brieflydescribe its implementation. This is followed with somebasic analysis of the velocity profiles and a comparison tothe Kinematic Model in section III. We study diffusionaround streamlines in section IV and the distribution ofporosity and local ordering in section V. Next, in sectionVI we examine the residence-time distribution of pebblesin the reactor, which is related to fuel burnup, and insection VII we show that wall friction plays an impor-tant role. In section VIII we analyze the bidisperse PBRconcept with half-size reactor simulations for a range ofpebble-diameter ratios, focusing on the mean flow, dif-fusion, and mixing. We conclude in section IX by sum-marizing implications of our study for reactor design andthe basic physics of granular flow.
II. MODELS AND METHODS
The DEM simulations are based on a modified versionof the model developed by Cundall and Strack [44] tomodel cohesionless particulates [42, 43]. Monodispersespheres with diameter d interact according to Hertzian,history dependent contact forces. For a distance r be-tween a particle and its neighbor, when the particles arein compression, so that δ = d−|r| > 0, then the two par-ticles experience a force F = Fn + Ft, where the normaland tangential components are given by
Fn =√
δ/d(knδn− γnvn
2
)(1)
Ft =√
δ/d(−kt∆st −
γtvt
2
). (2)
Here, n = r/ |r|. vn and vt are the normal and tan-gential components of the relative surface velocity, andkn,t and γn,t are the elastic and viscoelastic constants,respectively. ∆st is the elastic tangential displacementbetween spheres, obtained by integrating tangential rela-tive velocities during elastic deformation for the lifetimeof the contact, and is truncated as necessary to satisfy alocal Coulomb yield criterion |Ft| ≤ µ |Fn|. Particle-wallinteractions are treated identically, though the particle-wall friction coefficient µw is set independently.
For the monodispersed system, the spheres have diam-eter d = 6cm, mass m = 210g and interparticle frictioncoefficient µ = 0.7, flowing under the influence of gravityg = 9.81ms−1. For the bi-dispersed systems, the modera-tor particles have diameter 0.8d or 0.5d. The particle-wallfriction coefficient µw = 0.7 except in one case where wemodel a frictionless wall, µw = 0.0. For the current sim-ulations we set kt = 2
7kn, and choose kn = 2× 10⁵mg/d.While this is significantly less than would be realisticfor graphite pebbles, where we expect kn > 1010mg/d,such a spring constant would be prohibitively computa-tionally expensive, as the time step scales as δt ∝ k
−1/2n
for collisions to be modeled effectively. Previous simu-lations have shown that increasing kn does not signifi-cantly alter physical results [43]. We use a time step ofδt = 1.0 × 10⁻⁴τ and damping coefficients γn = 50τ−1
and γt = 0.0, where τ =√
d/g = 0.078s. All measure-ments are expressed in terms of d, m and τ .
The initial configurations are made by extending theinner cylinder from 140d to the bottom of the container,adding a wall at the bottom of the container to stop par-ticles from draining, and pouring in moderator pebblesinto the inner cylinder and fuel pebbles between the in-ner and outer cylinders until the reactor was loaded. Thebottom wall is then removed, the inner cylinder is raisedto 140d, and particles are allowed to drain out of thecontainer. As noted above, particles are recycled withmoderator particles reinserted within the inner cylinder,and fuel particles between the inner and outer cylinders.All results presented here are after all the particles havecycled through the reactor at least once. The number ofmoderator and fuel particles was adjusted slightly from

4
the initial filling so that the level at the top of the reac-tor is approximately equal. For the full scale simulationwith a thirty degree outlet, the total number of pebblesis 440,000 with 105,011 moderator pebbles and 334,989fuel pebbles, while for the sixty degree outlet, the to-tal number of pebbles is 406,405 with 97,463 moderatorand 308,942 fuel pebbles. For the former case, a millionsteps took approximately 13 hours on 60 processors onSandia’s Intel Xenon cluster.
For the bidispersed simulations the total number ofpebbles is 130,044, 160,423, and 337,715 for the diame-ter of the moderator particles equal to d, 0.8d and 0.5drespectively. As the diameter of the moderator pebblesis decreased the number of particles required rapidly in-creases, since it scales according to the inverse of thediameter cubed.
A snapshot of all the particle positions is recorded ev-ery 5τ = 0.39s. For the thirty degree reactor geometry wecollected 1,087 successive snapshots, totaling 24.9Gb ofdata, while for the sixty degree reactor geometry, we col-lected 881 successive snapshots, totaling 18.7Gb of data.A variety of analysis codes written in Perl and C++ wereused to sequentially parse the snapshot files to investigatedifferent aspects of the flow. We also created extendeddata sets, with an additional 440 snapshots for the thirtydegree geometry, and 368 snapshots for the sixty degreegeometry, for examining long residence times in sectionVI.
III. MEAN-VELOCITY PROFILES
A. Simulation Results
Since we have a massive amount of precise data aboutthe positions of the pebbles, it is possible to reconstructthe mean flow in the reactor with great accuracy. How-ever care must be taken when calculating velocity profilesto ensure the highest accuracy. Initial studies of the datashowed that crystallization effects near the wall can cre-ate features in the velocity profile at a sub-particle level,and we therefore chose a method that could resolve this.
By exploiting the axial symmetry of the system, oneonly need to find the velocity profile as a function ofr and z only. The container is divided into bins andthe mean velocity is determined within each. A particlewhich is at xn at the nth timestep and at xn+1 at the (n+1)th timestep, makes a velocity contribution of (xn+1 −xn)/∆t in the bin which contains its midpoint, (xn+1 +xn)/2.
In the z direction, we divide the container into strips1d across. However, in the r direction we take an alter-native approach. Since the number of pebbles between aradius of r and r + ∆r is proportional to r∆r, dividingthe container into bins of a fixed width is unsatisfactory,since the amount of data in bins with high r would bedisproportionately large. We therefore introduce a newcoordinate s = r2. The coordinate s covers the range
0 5 10 15 20 25
r (units of d)
10
20
30
40
50
60
0 5 10 15 20 25
z(u
nit
sofd)
r (units of d)
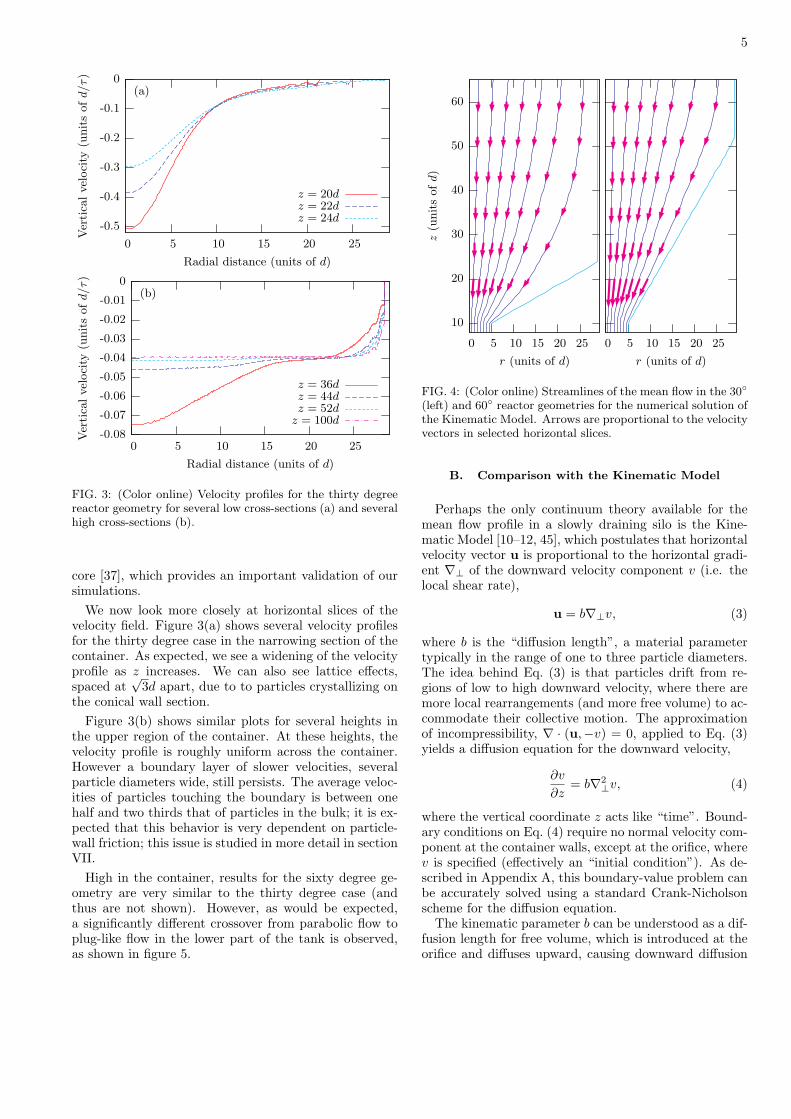
FIG. 2: (Color online) Computed streamlines of the meanflow in the 30◦ (left) and 60◦ reactor geometries. Arrowsare proportional to the velocity vectors in selected horizontalslices.
0 < s < r2out, and we divide the container into regions
that are equally spaced in s, of width 1d2. The numberof pebbles in each bin is therefore roughly equal, allowingfor accurate averaging in the bulk and high resolution atthe boundary.
This result yields extremely accurate velocity profilesin the cylindrical region of the tank. However, it fails tocapture crystallization effects in the conical region: sincethe particles are aligned with the slope of the walls areaveraged over a strip in z of width 1d, any effects aresmeared out across several bins. We therefore scaled theradial coordinate to what it would be if the particle wasin the center of the strip. Specifically, if the radius ofthe container is given by R(z), a particle at (rn, zn) isrecorded as having radial coordinate rnR(z)/R(zn). Inthe cylindrical region of the tank this has no effect, whilein the conical region, it effectively creates trapezoid-shaped bins from which it is easy to see crystallizationeffects which are aligned with the wall.
The streamlines of the mean flow are shown in Fig. 2in the two geometries. Streamlines are computed by La-grangian integration of the DEM velocity field, startingfrom points at a given height, equally spaced in radius.In each geometry, there is a transition from a nonuni-form converging flow in the lower funnel region to anearly uniform plug flow in the upper cylindrical region,consistent with the standard engineering picture of silodrainage [12]. In the wider funnel, there is a region ofmuch slower flow near the sharp corner at the upper edgeof the funnel. Our results for both geometries are quiteconsistent with particle-tracking data for quasi-2d silos ofsimilar shapes [9] and half-cylinder models of the MPBR
5
-0.5
-0.4
-0.3
-0.2
-0.1
0(a)
0 5 10 15 20 25
Ver
tica
lvel
oci
ty(u
nit
sofd/τ)
Radial distance (units of d)
z = 20dz = 22dz = 24d
-0.08
-0.07
-0.06
-0.05
-0.04
-0.03
-0.02
-0.01
0(b)
0 5 10 15 20 25
Ver
tica
lvel
oci
ty(u
nit
sofd/τ)
Radial distance (units of d)
z = 36dz = 44dz = 52d
z = 100d
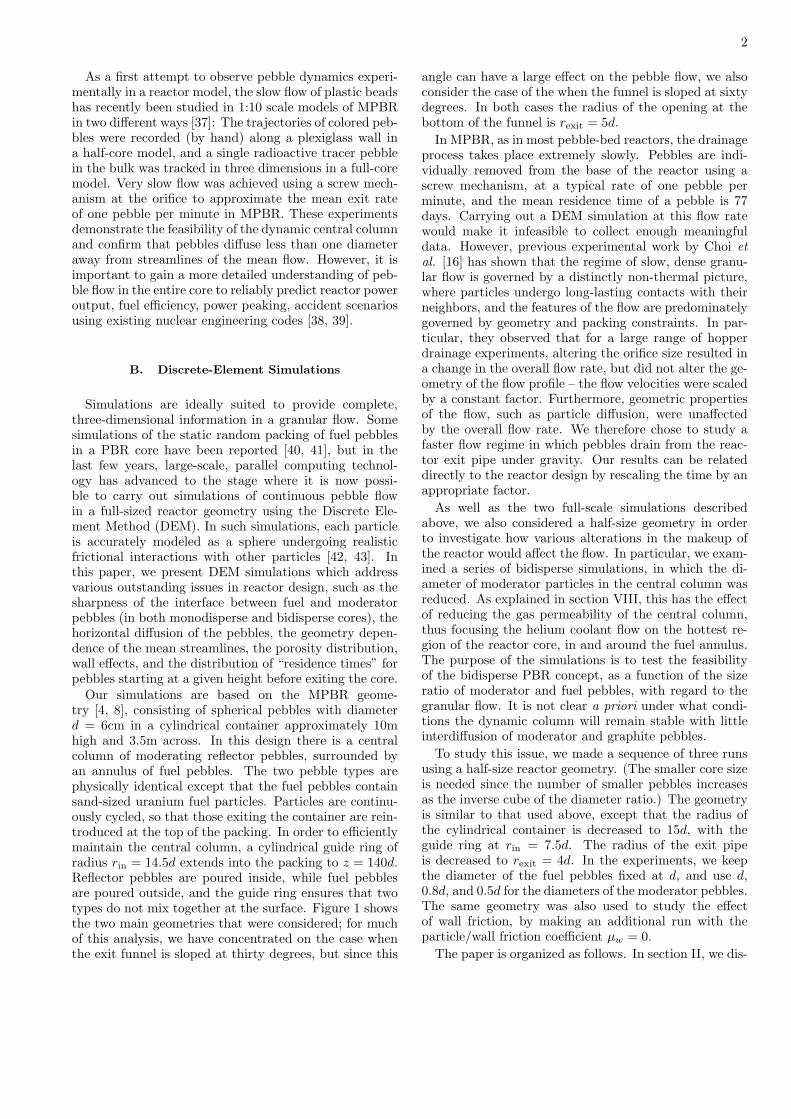
FIG. 3: (Color online) Velocity profiles for the thirty degreereactor geometry for several low cross-sections (a) and severalhigh cross-sections (b).
core [37], which provides an important validation of oursimulations.
We now look more closely at horizontal slices of thevelocity field. Figure 3(a) shows several velocity profilesfor the thirty degree case in the narrowing section of thecontainer. As expected, we see a widening of the velocityprofile as z increases. We can also see lattice effects,spaced at
√3d apart, due to to particles crystallizing on
the conical wall section.Figure 3(b) shows similar plots for several heights in
the upper region of the container. At these heights, thevelocity profile is roughly uniform across the container.However a boundary layer of slower velocities, severalparticle diameters wide, still persists. The average veloc-ities of particles touching the boundary is between onehalf and two thirds that of particles in the bulk; it is ex-pected that this behavior is very dependent on particle-wall friction; this issue is studied in more detail in sectionVII.
High in the container, results for the sixty degree ge-ometry are very similar to the thirty degree case (andthus are not shown). However, as would be expected,a significantly different crossover from parabolic flow toplug-like flow in the lower part of the tank is observed,as shown in figure 5.
0 5 10 15 20 25
r (units of d)
10
20
30
40
50
60
0 5 10 15 20 25
z(u
nit
sofd)
r (units of d)
FIG. 4: (Color online) Streamlines of the mean flow in the 30◦
(left) and 60◦ reactor geometries for the numerical solution ofthe Kinematic Model. Arrows are proportional to the velocityvectors in selected horizontal slices.
B. Comparison with the Kinematic Model
Perhaps the only continuum theory available for themean flow profile in a slowly draining silo is the Kine-matic Model [10–12, 45], which postulates that horizontalvelocity vector u is proportional to the horizontal gradi-ent ∇⊥ of the downward velocity component v (i.e. thelocal shear rate),
u = b∇⊥v, (3)
where b is the “diffusion length”, a material parametertypically in the range of one to three particle diameters.The idea behind Eq. (3) is that particles drift from re-gions of low to high downward velocity, where there aremore local rearrangements (and more free volume) to ac-commodate their collective motion. The approximationof incompressibility, ∇ · (u,−v) = 0, applied to Eq. (3)yields a diffusion equation for the downward velocity,
∂v
∂z= b∇2
⊥v, (4)
where the vertical coordinate z acts like “time”. Bound-ary conditions on Eq. (4) require no normal velocity com-ponent at the container walls, except at the orifice, wherev is specified (effectively an “initial condition”). As de-scribed in Appendix A, this boundary-value problem canbe accurately solved using a standard Crank-Nicholsonscheme for the diffusion equation.
The kinematic parameter b can be understood as a dif-fusion length for free volume, which is introduced at theorifice and diffuses upward, causing downward diffusion

6
-0.45
-0.4
-0.35
-0.3
-0.25
-0.2
-0.15
-0.1
-0.05
0
0 5 10 15 20 25
Ver
tica
lvel
oci
ty(u
nit
sofd/τ)
Radial distance (units of d)
z = 25dz = 35dz = 45d
FIG. 5: (Color online) Velocity profiles for the 60◦ reactorgeometry (heavy lines), with a comparison to the KinematicModel for b = 3d (thin lines).
of particles. It was originally proposed that free volume iscarried by voids [10, 45], which displace single particlesas they move, but a more realistic mechanism involvescooperative particle motion due to diffusing “spots” ofdelocalized free volume [17]. The Spot Model can pro-duce accurate flowing packings in wide silos [18], and theKinematic Model can be derived as the continuum limitof the simplest case where spots drift upward at constantvelocity (due to gravity) while undergoing independentrandom walks, although more general continuum equa-tions are also possible for different spot dynamics. Afirst-principles mechanical theory of spot dynamics is stilllacking (although it may be based on a stochastic refor-mulation of Mohr-Coulomb plasticity [26]), so here wesimply try a range of b values and compare to the DEMflow profiles.
Consistent with a recent experimental study of quasi-2d silos [9], we find reasonable agreement between theKinematic Model predictions and the DEM flow profiles,but the effect of the container geometry is not fully cap-tured. In the converging flow of the funnel region, thestreamlines are roughly parabolic, as predicted by theKinematic Model and found in many experiments [9, 13–16]. For that region, it is possible to choose a singlevalue (b = 3d) to achieve an acceptable fit to the DEMflow profiles for both the 30◦ and 60◦ funnel geometries,as shown in figure 5.
In spite of the reasonable overall fit, the KinematicModel has some problems describing the DEM results. Itfails to describe the several particle thick boundary layerof slower velocities seen in the DEM data. In the originalmodel, b depends only on the properties of the granularmaterial, but we find that it seems to depend on the ge-ometry; the best fit to the 30◦ DEM data is b ≈ 2.5d,while the best fit for the 60◦ DEM data is b ≈ 3.0d. Suchdiscrepancies may partly be due to the boundary layers,since in the lower section of the container the conicalwalls may have an appreciable effect on the majority ofthe flow. We also find that the Kinematic Model fails
to capture the rapid transition from converging flow toplug flow seen in the DEM data. This is shown clearlyby comparing the streamlines for the Kinematic Modelin figure 4 with those for DEM. Streamlines for the Kine-matic Model are roughly parabolic, and no single value ofb can capture the rapid change from downward stream-lines to converging streamlines seen in DEM.
The difficulty in precisely determining b is also a com-mon theme in experiments, although recent data suggeststhat a nonlinear diffusion length may improve the fit [9].Perhaps a more fundamental problem with the KinematicModel is that it cannot easily describe the rapid crossoverfrom parabolic converging flow to uniform plug flow seenin both geometries our DEM simulations; we will returnto this issue in section V.
IV. DIFFUSION AND MIXING
Nuclear engineering codes for PBR core neutronicstypically assume that pebbles flow in a smooth laminarmanner along streamlines, with very little lateral diffu-sion [38, 39]. Were such significant diffusion to occuracross streamlines, it could alter the core compositionin unexpected ways. In the MPBR design with a dy-namic central column [8], diffusion leads to the unwantedmixing of graphite pebbles from the central reflector col-umn with fuel pebbles from the outer annulus, so it mustbe quantified. Simulations and experiments are crucial,since diffusion in slow, dense granular flows is not fullyunderstood [17].
Particle-tracking experiments on quasi-2d silos [16] andhalf-cylinder MPBR models [37] have demonstrated verylittle pebble diffusion in slow, dense flows, but the obser-vations were made near transparent walls, which couldaffect the flow, e.g. due to ordering (see below). Three-dimensional tracking of a radioactive tracer in a cylindri-cal MPBR model has also shown very little diffusion, atthe scale of a single pebble diameter for the duration ofthe flow [37]. Here, we take advantage of the completeinformation on pebble positions in our DEM simulationsto study core diffusion and mixing with great accuracy.
We collected extensive statistics on how much pebblesdeviate from the mean-flow streamlines during drainage.Consistent with theoretical concepts [17], experimentshave demonstrated that the dynamics are strongly gov-erned by the packing geometry, so that diffusion can mostaccurately be described by looking at the mean-squaredhorizontal displacement away from the streamline, as afunction of the distance dropped by the pebble (not time,as in molecular diffusion), regardless of the flow rate. Mo-tivated by the importance of quantifying mixing at thefuel/moderator interface in the dynamic central columnof MPBR, we focus on tracking pebbles passing throughz = 110d with |r − 15d| < 0.16d. The variance of the rcoordinate of the particles as they fall to different heightsin z can be calculated. From this, we can determine theamount of radial diffusion, defined as the increase in the

7
0
0.05
0.1
0.15
0.2
0.25
10 20 30 40 50 60 70 80 90 100
Radia
ldiff
usi
on
(unit
sofd2)
Vertical coordinate (units of d)
30◦ data, r = 15d60◦ data, r = 15d30◦ data, r = 25d
FIG. 6: (Color online) Radial diffusion of particles aboutstreamlines of the mean flow as a function of height, z, inboth reactor geometries for pebbles starting at z = 110d inan annulus of radius r = 15d, at the edge of the dynamiccentral column in MPBR. For the 30◦ geometry, we also showdata for pebbles near the wall at r = 25d.
variance of r of the tracked particles from the varianceat the initial height.
The diffusion data for both reactor geometries is shownin figure 6. We see that for large values of z in the cylin-drical part of the container, the pebbles undergo essen-tially no diffusion; this is to be expected, since we haveseen that in this area the packing is essentially plug-like,and particles are locked in position with their neighbors.However for lower values of z the amount of radial spread-ing begins to increase, as the particles experience somerearrangement in the region corresponding to converg-ing flow. Note however that the scale of this mixing isvery small, and is much less than a pebble diameter. Theheight where the amount of diffusion begins to increase isapproximately z = 35d in the 30◦ geometry and z = 50din the 60◦ geometry. In the 30◦ geometry, this transitionis significantly above the height of the interface betweenconical and cylindrical walls, while in the 60◦ geometry,the transition is almost level with the interface. Thissuggests that while the container geometry may play arole in diffusion and velocity profiles, it is a lower-ordereffect. For very small values of z, there is a decrease inthe variance of the radial coordinate, since the pebblesmust converge on the orifice as they exit the container.
We applied a similar analysis for different initial val-ues of r, and found very similar results over the range0 < r < 25d. However, for particles close to the con-tainer boundary, very different behavior is observed, asshown by the third line in figure 6 for particles with|r − 25d| < 0.10d. In this region, the particles undergorearrangement, and this causes a (piecewise) linear in-crease in the mean-squared displacement with distancedropped, which corresponds to a constant local diffusionlength. There is also evidence of a sharp transition in theboundary-layer diffusion length, which increases signifi-cantly as pebbles pass the corner into the converging-flow
region of the funnel.
V. PACKING STATISTICS
A. Pebble Volume Fraction
Pebble-bed experiments [32, 33] and simulations [40,41] of static sphere packings in cylinders have revealedthat there are local variations in porosity near walls,at the scale of several pebble diameters, but there hasbeen no such study of flowing packings, averaging overdynamic configurations. Similar findings would have im-portant implications for helium flow in the core, since thelocal gas permeability is related to the porosity [34–36].
First, we study the distribution of local volume frac-tion (% of volume occupied by pebbles) throughout thecontainer, averaged in time. (The porosity is one minusthe volume fraction.) Random close packing of spherescorresponds to a volume fraction in the range 55% - 63%,while flows occur in a somewhat more restricted range.The lower bound is approximately set by random loosepacking, where rigidity percolation sets [46], while theupper bound is near the jamming point [47] or the max-imally random jammed state [48], where flow cannot oc-cur.
The best way to determine the volume fraction on a lo-cal scale is to use a Voronoi tessellation, which uniquelyassigns a polygonal volume to each pebble, formed byintersecting the planes bisecting the lines between differ-ent pebble centers. Widely-used algorithms (such as theone found in Matlab) compute Voronoi cells using thedual Delaunay tessellation, but our algorithm efficientlycomputes the Voronoi cells directly, plane-by-plane. Oneof the advantages of this direct method (to be describedin detail elsewhere) is that it allows us to approximatethe Voronoi cells of particles near the walls with a highdegree of accuracy, by cutting the Voronoi cell with theappropriate planes. The local packing fraction in a smallregion can be found by taking the ratio of the particlevolume in that region to the ratio of the Voronoi volume.Such a method can be used to define local density evendown to the scale of a single particle, but for this work wecompute local density by averaging on a scale of severalparticle diameters.
Figure 7 shows density snapshots for cross sectionsthrough the thirty degree and sixty degree reactor ge-ometries, based on computing the local density at a par-ticular point by averaging over the Voronoi densities ofparticles within a radius of 2.2d. Figure 8 shows densityplots over the entire flow of the data, but using a smalleraveraging radius of 0.8d. Many interesting features arevisible, which corroborate our other results. High in thecenter of the container, we see that the local packing frac-tion is mostly close to 63%, suggesting that the plug-likeregion is in a nearly jammed and rigid state. This is con-sistent with our earlier data showing nearly uniform plugflow with no significant diffusion or mixing.

8
FIG. 7: Plots of local volume fraction (1− porosity) in a ver-tical cross section for the thirty degree reactor geometry (left)and the sixty degree reactor geometry (right), calculated usinga Voronoi cell method. Volume fractions of 50%, 57%, 60%,and 63% are shown using the colors of red, yellow, dark blue,and cyan respectively. Colors are smoothly graded betweenthese four values to show intermediate volume fractions. Highin the bulk of the container, the packing fraction is approx-imately 63%, apart from in a small region of lower densityat rin = 14.5d, corresponding to packing defects introducedby the guide ring. In both geometries a sharp reduction indensity is observed in a region above the orifice, where par-ticles in the parabolic flow region are forced to undergo localrearrangements.
We also observe two annular lines of lower densitypropagating down from the guide ring, which form dueto wall effects on the guide ring itself (see below) and areadvected downward. The fact that these subtle artifactsof the guide-ring constraints are felt far down in the flowfurther demonstrates that very little diffusion or shear-ing occurs in the upper region. There are also similarlower-density regions along the walls, related to partialcrystallization described in more detail below.
It is also clear in both geometries, especially the 30◦model, that there is a fairly sharp transition between theupper region of nearly rigid plug flow and a less denselower region of shear flow in the funnel. Similar featuresare in the velocity profiles described above, but the tran-sition is much more sharp, at the scale of at most a fewparticles, for the local packing fraction. These sudden
FIG. 8: Time-averaged plots of the local volume fraction,using the same color scheme as figure 7.
variations in material properties and velocities are rem-iniscent of shock-like discontinuities in Mohr-Coulombplasticity theories of granular materials [12, 24]. It seemsno such existing theory can be applied to the reactorflows, but our results suggest that plasticity conceptsmay be useful in developing a continuum theory of densegranular flow [26].
B. Local Ordering and Porosity
As noted above, previous simulation studies of local or-dering near walls have focused on static packings in sim-plified cylindrical geometries (without the funnel, outletpipe, or guide ring) [40, 41], while we compute averagestatistics for slowly flowing packings in realistic full-scalereactor models. To take a closer look at ordering nearwalls, we study the number density profile in horizon-tal slices at different heights. The container is dividedinto bins in the same way as discussed previously andthe number density in a bin is obtained by counting thenumber of times a particle center lies within that bin.
Figure 9(a) shows a sequence of number density pro-files for several low values of z in the thirty degree re-actor geometry. At all four heights, lattice effects areclearly visible and quite similar to those observed in ex-
9
0
1
2
3
4
5
(a)
0 5 10 15 20 25
Num
ber
den
sity
Radial distance (units of d)
z = 14dz = 18dz = 22dz = 26d
0
0.5
1
1.5
2
2.5
3
3.5
4
(b)
0 5 10 15 20 25
Num
ber
den
sity
Radial distance (units of d)
z = 30dz = 38dz = 60d
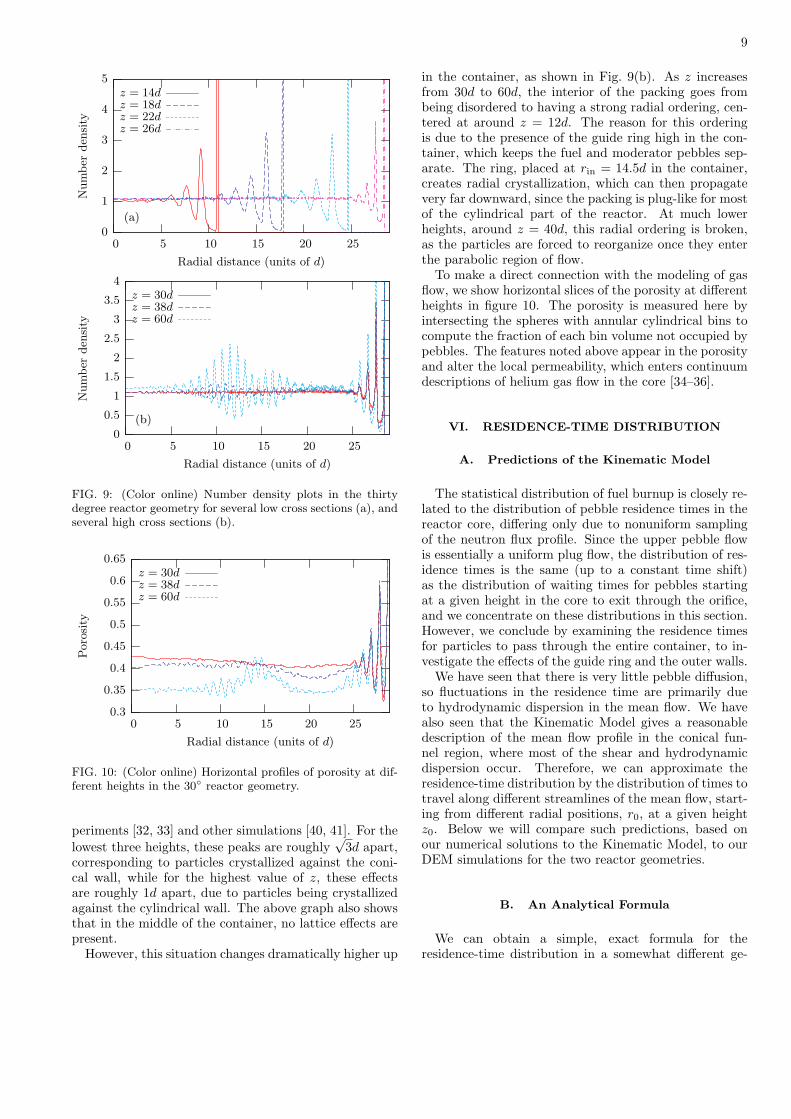
FIG. 9: (Color online) Number density plots in the thirtydegree reactor geometry for several low cross sections (a), andseveral high cross sections (b).
0.3
0.35
0.4
0.45
0.5
0.55
0.6
0.65
0 5 10 15 20 25
Poro
sity
Radial distance (units of d)
z = 30dz = 38dz = 60d
FIG. 10: (Color online) Horizontal profiles of porosity at dif-ferent heights in the 30◦ reactor geometry.
periments [32, 33] and other simulations [40, 41]. For thelowest three heights, these peaks are roughly
√3d apart,
corresponding to particles crystallized against the coni-cal wall, while for the highest value of z, these effectsare roughly 1d apart, due to particles being crystallizedagainst the cylindrical wall. The above graph also showsthat in the middle of the container, no lattice effects arepresent.
However, this situation changes dramatically higher up
in the container, as shown in Fig. 9(b). As z increasesfrom 30d to 60d, the interior of the packing goes frombeing disordered to having a strong radial ordering, cen-tered at around z = 12d. The reason for this orderingis due to the presence of the guide ring high in the con-tainer, which keeps the fuel and moderator pebbles sep-arate. The ring, placed at rin = 14.5d in the container,creates radial crystallization, which can then propagatevery far downward, since the packing is plug-like for mostof the cylindrical part of the reactor. At much lowerheights, around z = 40d, this radial ordering is broken,as the particles are forced to reorganize once they enterthe parabolic region of flow.
To make a direct connection with the modeling of gasflow, we show horizontal slices of the porosity at differentheights in figure 10. The porosity is measured here byintersecting the spheres with annular cylindrical bins tocompute the fraction of each bin volume not occupied bypebbles. The features noted above appear in the porosityand alter the local permeability, which enters continuumdescriptions of helium gas flow in the core [34–36].
VI. RESIDENCE-TIME DISTRIBUTION
A. Predictions of the Kinematic Model
The statistical distribution of fuel burnup is closely re-lated to the distribution of pebble residence times in thereactor core, differing only due to nonuniform samplingof the neutron flux profile. Since the upper pebble flowis essentially a uniform plug flow, the distribution of res-idence times is the same (up to a constant time shift)as the distribution of waiting times for pebbles startingat a given height in the core to exit through the orifice,and we concentrate on these distributions in this section.However, we conclude by examining the residence timesfor particles to pass through the entire container, to in-vestigate the effects of the guide ring and the outer walls.
We have seen that there is very little pebble diffusion,so fluctuations in the residence time are primarily dueto hydrodynamic dispersion in the mean flow. We havealso seen that the Kinematic Model gives a reasonabledescription of the mean flow profile in the conical fun-nel region, where most of the shear and hydrodynamicdispersion occur. Therefore, we can approximate theresidence-time distribution by the distribution of times totravel along different streamlines of the mean flow, start-ing from different radial positions, r0, at a given heightz0. Below we will compare such predictions, based onour numerical solutions to the Kinematic Model, to ourDEM simulations for the two reactor geometries.
B. An Analytical Formula
We can obtain a simple, exact formula for theresidence-time distribution in a somewhat different ge-
10
ometry using the Kinematic Model, as follows. The sim-ilarity solution to Eq. (4) for a wide, flat bottomed silodraining to a point orifice at z = 0 is
u(r, z) = − Qr
2bz2e−r2/4bz (5)
v(r, z) =Q
bze−r2/4bz (6)
where u and v are the radial (horizontal) and downwardvelocity components and Q is a constant proportionalto the total flow rate through the orifice. (This is justthe classical Green function for the diffusion equation intwo dimensions, where z acts like “time”.) A slightlymore complicated solution is also possible for a parabolicsilo, but let us focus on the simplest case of Eqs. (5)-(6), which is a good approximation for a wide parabolicfunnel, where the velocity near the walls is small, i.e.R >
√4bz0. A more detailed analysis is not appropriate
here, since a simple analytical solution does not exist forthe actual reactor geometry of a conical funnel attachedto straight cylinder.
For the flow field in Eqs. (5)-(6), the trajectory of aLagrangian tracer particle along a streamline is given by
dr
dt= u(r, z), r(t = 0) = r0 (7)
dz
dt= −v(r, z), z(t = 0) = z0 (8)
Combining these equations and integrating, we find thatthe streamlines are parabolae, z/z0 = (r/r0)2, and thatthe residence time for a pebble starting at (r0, z0) is
τ0(r0, z0) =bz2
0
2Qer2
0/4bz0 . (9)
Now we consider pebbles that are uniformly dis-tributed at a height z0 in a circular cross section of radiusR in the flow field Eqs. (5)-(6. The probability distribu-tion for the residence time of those pebbles is
p(τ |z0, R) =∫ R
0
δ(τ − τ0(r0, z0))2πr0dr0
πR2(10)
=
0 for τ < τmin(z0)4bz0/R2τ for τmin < τ < τmax
0 for τ > τmax(z0, R)(11)
where
τmin = τ0(0, z0) =bz2
0
2Q(12)
τmax = τ0(R, z0) =bz2
0
2QeR2/4bz0 (13)
Once again, this solution is strictly valid for an infinitelywide and tall silo draining to a point orifice, and it isroughly valid for a parabolic funnel, z/z0 = (r/R)2, as anapproximation of a conical funnel in the actual reactor
geometry. We can further approximate the effect of anearly uniform flow of speed v0 to describe the uppercylindrical region by simply adding (z − z0)/v0 to theresidence time for a starting point z > z0.
Although this analysis is for a modified geometry, wewill see that it captures the basic shape of the residence-time distributions from the DEM simulations in a simpleformula (11). The probability density is sharply peakednear the shortest residence time, τmin, corresponding topebbles near the central axis traveling the shortest dis-tance at the largest velocity. The longer distance and(more importantly) the smaller velocity at larger radialpositions cause strong hydrodynamic dispersion, result-ing a fat-tailed residence-time density which decays like1/t, up to a cutoff τmax.
C. Simulation Results
For the DEM reactor simulations, we calculate the dis-tribution of times it takes for particles to drop from sev-eral different values of z0, adding in a weighting factor totake into account that shorter residence times are pref-erentially observed in the data set.
Since we are primarily interested in the radioactiveburnup, we concentrate on the residence times for thefuel pebbles, but for comparison, we also report re-sults for the moderator pebbles. Figure 11(a) shows theresidence-time probability densities for pebbles startingat z = 40d, 55d, 70d to exit the container for the 30◦reactor geometry. The distributions for the moderatorpebbles are quite narrow, showing all particles exit overa short time window. In contrast, the distributions forthe fuel pebbles exhibit fat tails, as expected qualita-tively from the Kinematic Model approximation (11) fora parabolic geometry. A closer analysis of the data con-firms that the longest waiting times are associated withpebbles passing close to the walls, especially near thecorner between the conical and cylindrical wall sections,although there are no completely stagnant regions.
Figure 11(b) shows corresponding plots for the 60◦ re-actor geometry. In general, the residence-time densitieshave similar shapes as for the 30◦ geometry, but theyare much narrower and exhibit a small secondary peakfar into the tail. Examining movies shows that this extrapeak is due to a boundary layer of particles, roughly one-pebble thick, touching the 60◦ conical wall sliding downat a speed lower than the nearby bulk. This extra sourceof hydrodynamic dispersion could not be easily capturedby a continuum model for the mean flow. A simple wayto eliminate it would be to replace add an outer annu-lus of moderator pebbles (controlled by another guidering at the top), which would flow more slowly along thewalls, leaving the fuel pebbles in a more uniform flowwith smaller fluctuations. Another possibility would beto reduce the wall friction, which makes the flow moreuniform, as discussed in the following section.
Figure 12 investigates the accuracy of the Kinematic

11
0
0.0005
0.001
0.0015
0.002
0.0025
0.003
(a)
0 500 1000 1500 2000
Fre
quen
cyden
sity
Residence time (units of τ)
z = 40dz = 55dz = 70d
0
0.001
0.002
0.003
0.004
0.005
0.006
0.007
(b)
0 200 400 600 800 1000 1200 1400 1600
Fre
quen
cyden
sity
Residence time (units of τ)
z = 40dz = 50dz = 60d
FIG. 11: (Color online) Residence-time probability densitiesfor the time it takes particles to drop from a specific height zout of the container, for the thirty degree reactor geometry (a)and sixty degree reactor geometry (b) for fuel pebbles (heavylines) and for moderator pebbles (thin lines).
0
0.0005
0.001
0.0015
0.002
0.0025
0.003
0 500 1000 1500 2000 2500
Fre
quen
cyden
sity
Residence time (units of τ)
DEMKinematic Model
Analytic
FIG. 12: (Color online) Comparison of the residence timedistributions between DEM simulation, numerical solution ofthe Kinematic Model, and the analytic formula.
Model in predicting the DEM residence-time distribu-tion. The total residence-time distribution for both fueland moderator pebbles to exit the reactor from z = 40din the 30◦ geometry is shown, and is compared with twopredictions from the Kinematic Model, one making use ofthe analytic formula (11), and one making use of the nu-
merical solution of the velocity profile. We use of thevalue b = 2.5d and calibrate the total flow to matchthe total flow from the DEM data. Both the numeri-cal solution and the analytic formula can roughly cap-ture the overall shape of the DEM distribution, althoughneither achieves a good quantitative agreement, particu-larly in the tails. Since the analytic formula assumes allstreamlines are parabolic, it fails to take into account theslow-moving particles that stay close to the wall, and ittherefore predicts a cut-off in the residence time distri-bution which is much shorter than some of the observedresidence times in the DEM simulation. The numeri-cal solution of the Kinematic Model accounts for thisand provides a better match, although it is clear that amodel correctly accounting for the flow of pebbles nearthe container walls may be required in order to achievehigh accuracy.
D. Residence times for the entire container
We also considered the distribution of times for theparticles to pass through the entire container. While theflow in the upper part of the reactor is essentially plug-like, boundary effects near the container walls and on theguide ring can have an appreciable effect on the pebbleresidence times, which we study here. Since it takes along time for particles to pass through the entire con-tainer we made use of the two extended data sets, con-sisting of 1,427 snapshots for the thirty degree geometryand 1,249 snapshots for the sixty degree geometry.
Figure 13 shows the time distributions for pebbles topass through the entire container. Apart from a largepositive time shift, the curves are similar in form to thosein Fig. 11. However, for both geometries, we see sec-ond small peaks in the distributions for the moderatorpebbles, corresponding to a slow-moving boundary layerof pebbles touching the guide ring. The sixty degreecurve for the fuel pebbles also exhibits several undula-tions corresponding to multiple layers of pebbles crys-tallized against the outer wall, each moving at differentspeeds.
VII. WALL FRICTION
The behavior of pebbles near the walls is of significantinterest to reactor design, and to look into this further,we investigated the effect of wall friction by comparingtwo simulations runs in the half-size geometry, with wallfriction coefficients µw = 0 and µw = 0.7. All otheraspects of the simulation, including the interparticle in-teractions, were kept the same.
Figures 14 and 15 show comparisons of flow stream-lines and velocity profiles respectively for the two sim-ulations. We see that the µw = 0 simulation results ina significantly larger flow speed, with a mass flow rateof 104mτ−1, as opposed to 59.6mτ−1 for µw = 0.7. As

12
0
0.0005
0.001
0.0015
0.002
0.0025
0.003
0.0035
2500 3000 3500 4000 4500 5000
Fre
quen
cyden
sity
Residence time (units of τ)
30◦ geometry60◦ geometry
FIG. 13: (Color online) Distribution of times to pass throughthe entire container for fuel pebbles (heavy lines) and moder-ator pebbles (thin lines).
0 2 4 6 8 10 12 14
r (units of d)
10
15
20
25
30
35
0 2 4 6 8 10 12 14
z(u
nit
sofd)
r (units of d)
FIG. 14: (Color online) Streamlines for the half-size, monodis-perse geometries with wall friction (left) and without wall fric-tion (right). Arrows are proportional to the velocity vectorsin selected horizontal slices.
would be expected, removing wall friction also removesthe boundary layer of slower velocities at the wall, cre-ating an almost perfectly uniform velocity profile high inthe reactor. This also has the effect of increasing radialordering effects, and we can see from figure 16 that thenumber density profile is more peaked close to the wall.Figure 16 also shows that the radial ordering created bythe guide ring is also significantly enhanced. While thisis due in part to the more plug-like flow allowing packingeffects to propagate further down, it is also due to thefrictionless guide ring initially creating radial ordering.Thus it may be possible to tune the material propertiesof the guide ring (or the roughness of its walls) to enhanceor reduce the radial ordering effects.
-0.3
-0.25
-0.2
-0.15
-0.1
-0.05
0
0 2 4 6 8 10 12 14
Ver
tica
lvel
oci
ty(u
nit
sofd/τ)
Radial distance (units of d)
z = 30d, µ = 0.7z = 30d, µ = 0
z = 18d, µ = 0.7z = 18d, µ = 0
FIG. 15: (Color online) Comparison of velocity profiles forsimulations with and without wall friction for two differentheights.
0
2
4
6
8
10
0 2 4 6 8 10 12 14
Num
ber
den
sity
Radial distance (units of d)
µw = 0.7µw = 0
FIG. 16: (Color online) Comparison of number density pro-files at z = 60d for simulations with and without wall friction.
Removing wall friction also has the effect of increasingradial ordering effects near the wall. Perhaps most sur-prisingly, removing wall friction results in a significantalteration of the flow in the interior of the packing, asshown by the two velocity profiles in figure 15 for z = 18d.While both velocity profiles must converge upon the ori-fice, we see that the velocity profile for the µw = 0.7case is significantly more curved than that for µw = 0.This also has the effect of preferentially speeding up therelative flux of fuel pebbles: with wall friction, the fuelpebbles make up 71.5% of the total mass flux, but with-out wall friction, this increases to 74.7%.
VIII. BIDISPERSITY
A. The Bidisperse PBR Concept
The two-pebble design of MPBR with a dynamic cen-tral moderator column has various advantages over asolid graphite central column (as in the revised PBMRdesign). For example, it flattens the neutron flux profile,

13
size
spent fuel
fresh fuel
sorter
annular
fuel zone
of high gas
CORE
REACTOR
PEBBLE−BED
BIDISPERSE
cylindrical
ring
guideadjustable
pebbles
permeability
permeability
largersmallergraphite
pebblesfuel
graphite zone
of low gas
recycled fuel
fuel
sorter
FIG. 17: Schematic diagram of the pebble flow in a bidisperseMPBR design.
while preserving a very simple core vessel without anyinternal structures, which would be subjected to extremeradiation and would complicate the granular flow. It alsoallows the widths of the moderator column and fuel an-nulus to be set “on the fly” during reactor operation,simply by adjusting the guide ring at the top.
A drawback of the dynamic moderator column, how-ever, is its porosity, which allows the passage of thehelium-gas coolant, at the highest velocity (along thecentral axis). In most PBR designs, high-pressure he-lium gas is introduced from a reservoir above the core,through holes in the graphite bricks which make up thecore vessel. The gas then flows through the core andexits through holes in the graphite bricks of the conicalfunnel to another reservoir at high temperature. To im-prove the thermal efficiency and power output, it wouldbe preferable to focus the gas flow on the fuel annulusand the interface with the moderator column, where themost heat is generated. This is automatically achievedwith a solid graphite column, but there is a very simpleway to shape the gas flow in a similar way with a dynamiccolumn, while preserving its unique advantages.
The idea is to make the graphite moderator pebbles inthe central column smaller than the fuel pebbles in theouter annulus, as shown in Fig. 17. (This also helps withsorting of fuel and moderator pebbles as they exit thecore.) In standard continuum models of flow in porousmedia [34–36], the permeability of the packing scales withthe square of the pebble diameter (or pore size), so re-ducing the diameter of the moderator pebbles can greatlyreduce the gas flow (e.g. by a factor of four for half-diameter pebbles). This argument holds everywhere that
the packing is statistically the same, in the monodispersepackings of the fuel annulus and the moderator column,which have the same porosity. At the interface betweenthe two regions, we have seen in Figures 7 and 10 thatthe porosity is enhanced for a monodisperse core due tothe guide ring, although a bidisperse interface will havedifferent structure. In summary, if helium gas is intro-duced outside the guide ring in a bidisperse core, it canbe made to pass almost entirely through the fuel annulusand the interface with the moderator column.
B. Simulation Results
The only question regarding the feasibility of the bidis-perse core is the stability of the central column over timeand the possibility of enhanced diffusion of the smallmoderator pebbles into the annulus of larger fuel peb-bles. In other systems, such as rotating drums [49–51],vibrated buckets [52, 53], and draining silos [15], bidis-perse granular materials display a tendency to segregate(rather than mix) during dynamics, but there is currentlyno general theory which could be applied to our reactorgeometry. Therefore, our DEM simulations provide auseful means to address this important question.
Figure 18 shows snapshots of vertical cross sections forthe three different bidisperse simulations that were runin the half-size geometry. As shown in the diagram, thecentral column remains stable and coherent in all threecases, and very little mixing between the two types ofpebbles is visible. Figure 19 shows a comparison of thevelocity profiles from the three simulations for two dif-ferent heights. It is reassuring to see that the bidispersesimulations do not significantly differ from the monodis-perse simulation, although we do see a slightly higheroverall flow rate in the bidisperse systems: we see totalmass flow rates of 59.6mτ−1, 60.8mτ−1, and 65.0mτ−1
for the monodisperse, 0.8:1, and 0.5:1 simulations respec-tively.
The velocity profiles are slightly more curved in thebidisperse central core; this is particularly apparent inthe 0.5:1 simulation. This leads to a small cusp in thevelocity profile near the interface between the two typesof particles which may lead to adverse mixing effects. Thefaster flow also leads to a significantly larger turnaroundof the moderator pebbles. In the monodisperse system,the moderator pebbles comprise 28.5% of the total massflux, but this is increased to 31.7% in the 0.8:1 bidispersesimulation, and 42.6% in the 0.5:1 bidisperse simulation.
To investigate the amount of mixing of the central col-umn, we used a technique similar to that described insection IV. At z = 110d all moderator particles withr > 8d are marked, and their radial diffusion is then cal-culated as a function of z. The results are shown in figure20: in the cylindrical section of the packing, there is verylittle difference between the three simulations, but in thearea of convergent flow, we see that bidispersity leads tosignificantly more mixing. However, even for the 0.5:1

14
FIG. 18: (Color online) Snapshots of vertical cross-sectionsfor the bidisperse simulations. From left to right, the moder-ator pebbles have diameters 1d, 0.8d, and 0.5d while the fuelpebbles are of constant size 1d.
simulation, the scale of diffusion is still smaller than asingle particle diameter, and essentially the central col-umn remains stable.
Due to computational limitations, we were unable toinvestigate smaller size ratios in the reactor geometries,so we carried out simulations in a smaller container witha 0.3:1 size ratio and found dramatically different be-havior: During drainage, the central column became un-stable, and the small particles penetrated many particlediameters into the packing of larger particles. We expectthat there is a fundamental crossover in behavior sim-ply due to geometry of amorphous packings, when themoderator pebbles become small enough to pass throughthe gaps between the densely packed fuel pebbles. Anin-depth study of this phenomenon remains a subject offuture work. For now, we can safely recommend a di-ameter ratio of 0.5:1, which reduces the dynamic centralcolumn’s permeability by a factor of four without intro-ducing any significant diffusion of moderator pebbles intothe fuel annulus.
-0.18
-0.16
-0.14
-0.12
-0.1
-0.08
-0.06
-0.04
-0.02
0
0 2 4 6 8 10 12 14
Ver
tica
lvel
oci
ty(u
nit
sofd/τ)
Radial distance (units of d)
Monodisperse0.8:10.5:1
FIG. 19: (Color online) Comparison of velocity profiles forthe three bidisperse simulations. The three flatter curves arecalculated at z = 30d in the plug-like flow region while theother three were taken at z = 22d in the parabolic flow region.
0
0.05
0.1
0.15
0.2
0.25
0.3
0.35
10 20 30 40 50 60
Radia
ldiff
usi
on
(unit
sofd2)
Vertical coordinate (units of d)
Monodisperse0.8:10.5:1
FIG. 20: (Color online) Comparison of particle diffusion forthe three bidisperse simulations.
IX. CONCLUSIONS
A. Pebble-Bed Reactor Core Design
Using DEM simulations, we have analyzed many as-pects of granular flow in pebble-bed reactor cores of di-rect relevance for design and testing. We close by sum-marizing some key conclusions.
The mean flow profile exhibits a smooth transitionfrom a nearly uniform plug flow in the upper cylindri-cal region to a nonuniform, converging flow in the lowerfunnel region, consistent with recent experiments [9, 37].There are no stagnant regions in the 30◦ and 60◦ con-ical funnels considered in this study, although the flowis slower near the corner at the top of the funnel, espe-cially in the former case. Moreover, the wider 30◦ funnelhas a boundary mono-layer of slower pebbles partiallycrystallized on the wall.
The only available continuum theory for such flows, thesimple Kinematic Model [10–12, 45], gives a reasonablequalitative picture of the flow profiles, although it cannot

15
capture discrete boundary-layer effects. As in other ex-periments on similar geometries [9], the Kinematic Modeldoes not quantitatively predict the dependence of theflow profile on geometry. We suggest that it be used toget a rough sense of the flow profile for a given core ge-ometry prior to (much more computationally expensive)DEM simulations and/or experiments.
We have quantified the degree of pebble mixing in thecore. Although there is some horizontal diffusion in thefunnel region, pebbles depart from the streamlines of themean flow by less than one pebble diameter prior to ex-iting the core.
We have demonstrated that the “mixing layer” be-tween the central moderator column and the outer fuelannulus, which appears in prior models [39], can be re-duced to the thickness of one pebble diameter by sepa-rating moderator and fuel pebbles with a guide ring atthe ceiling (to eliminate mixing by surface avalanches),consistent with experiments on MPBR models [37]. Weconclude that the dynamic central column of moderatorpebbles is a sound concept, which should not concernregulators.
We have constructed Voronoi tessellations of our flow-ing packings to measure the profile of volume fraction(or porosity) and found some unexpected features whichwould affect coolant gas flow through the core. The bulkof the core, in the plug-flow region of the upper cylinder,has a volume fraction near the jamming point (63%),but there is a sharp transition to less dense packings(55−60%) in the funnel region, due to shear dilation. Wealso observe lower volume fractions in this range at themoderator/fuel interface in the upper cylinder, below theguide ring, and lower volume fractions (50−55%) againstthe walls. These narrow regions of increased porosity(and thus, increased permeability) would allow faster he-lium gas flow.
We have also studied local ordering in the flowing pack-ings and find evidence for partial crystallization withinseveral pebble diameters of the walls, consistent with pre-vious experiments [32, 33] and simulations [40, 41]. Suchordering on the walls of the guide ring, then advecteddown through the core, is responsible for the increasedporosity of the moderator/fuel interface.
We have varied the wall friction in our DEM simula-tions and observe that it can affect the mean flow, evendeep into the bulk. Reducing the wall friction increasesradial ordering near the walls and makes the flow profilemore uniform.
Since diffusion is minimal, the probability distributionof pebble residence times is dominated by advection inthe mean flow. Therefore, we have made predictions us-ing the Kinematic Model, numerically for the conical-funnel reactor geometries, and analytically for a wideparabolic funnel. The model predicts a fat-tailed (∼ 1/t)decay of the residence-time density due to hydrodynamicdispersion in the funnel region.
Our DEM simulations predict that the 60◦ conical fun-nel results in a narrower residence-time distribution than
the 30◦ funnel, which has more hydrodynamic dispersion.The steeper 60◦ funnel also exhibits a boundary layer ofslower, partially crystallized pebbles near the wall whichlead to an anomalous bump far in the tail of residence-time distribution. These results have important implica-tions for non-uniformity in the burnup of fuel pebbles.
We have introduced the concept of a bi-disperse corewith smaller moderator pebbles in the dynamic centralcolumn than in the outer fuel annulus, in order to fo-cus the helium gas flow on the fuel. Our DEM simula-tions demonstrate that there is negligible pebble mixingat the interface for diameter ratios as small as 0.5:1, forwhich the permeability of the moderator column is re-duced by a factor of four. We conclude that the bidis-perse MPBR design is sound and will produce a stablemoderator-pebble column of greatly reduced gas perme-ability.
A natural next step would be to combine our full-scaleDEM model for the pebble flow with existing computa-tional approaches to reactor core physics [38, 39], whichrely on pebble flow as an empirical input. More accuratestudies of gas flow in the core could also be done, start-ing from our complete pebble packings, or the averagequantities such as the porosity. With such computationaltools, one should be able to reliably test and develop newreactor designs.
B. Basic Physics of Dense Granular Flow
We have noted a number of favorable comparisons be-tween our simulations and experiments in similar geome-tries [9, 32, 33, 37], which provides further validation ofthe Discrete-Element Method as a realistic means of sim-ulating granular materials. As such, it is interesting toconsider various implications of our results for the the-ories of dense granular flow, since the simulations probethe system at a level of detail not easily attained in ex-periments.
Our conclusions about the Kinematic Model are simi-lar to those of a recent experimental study [9]: The modeldescribes the basic shape of the flow field in the converg-ing region, but fails to predict the nearly uniform plugflow in the upper region with vertical walls or the precisedependence on the funnel geometry. It also cannot de-scribe boundary-layers due to partial crystallization nearwalls or incorporate wall friction, which we have shownto influence the entire flow profile.
On the other hand, there is no other continuummodel available for dense silo drainage, except for Mohr-Coulomb plasticity solutions for special 2d geometries,such as a straight 2d wedge without any corners [12],so it is worth trying to understand the relative successof the Kinematic Model for our 3d reactor geometriesand how it might be improved. A cooperative micro-scopic mechanism for random-packing dynamics, basedon “spots” of diffusing free volume, has recently beenproposed, which yields the mean flow of the Kinematic

16
Model as the special case of independent spot randomwalks with uniform upward drift from the orifice (dueto gravity) [17]. Under the same assumptions, the SpotModel has also been shown to produce rather realisticsimulations of flowing packings in wide silos (comparedto DEM simulations) [18], where the Kinematic Model isknown to perform well [13–16]. This suggests that somemodification of the spot dynamics, such as spot interac-tions and/or nonuniform properties coupled to mechani-cal stresses, and an associated modification of the Kine-matic Model in the continuum limit, may be possible tobetter describe general situations.
From a fundamental point of view, perhaps the mostinteresting result is the profile of Voronoi volume fraction(or porosity) in our flowing random packings in Figure 7.Although the mean velocity in Figure 2 shows a fairlysmooth transition from the upper plug flow to the lowerconverging flow, the volume fraction reveals a sharp tran-sition (at the scale of 1−3 particles) from nearly jammed“solid” material in the upper region (63%) to dilated,sheared “liquid” material in the lower region (57-60%).The transition line emanated from the corners betweenthe upper cylinder and the conical funnel. We are notaware of any theory to predict the shape (or existence)of this line, although it is reminiscent of a “shock” in thehyperbolic equations of 2d Mohr-Coulomb plasticity [12].
Our measurements of diffusion and mixing providesome insights into statistical fluctuations far from equilib-rium. Consistent with the experiments in wide quasi-2dsilos [16], we find that diffusion is well described geomet-rically as a function of the distance dropped, not time(as in the case of thermal molecular diffusion). As aclear demonstration, there is essentially no diffusion aspebbles pass through the upper core, until they cross thetransition to the funnel region, where the diffusion re-mains small (at the scale of one pebble diameter) andcooperative in nature. The behavior in the funnel is con-sistent with the basic Spot Model [17], but a substantialgeneralization would be needed to describe the transitionto the upper region of solid-like plug flow, perhaps usingconcepts from plasticity theory [26].
We view silo drainage as a fundamental unsolved prob-lem, as interesting and important as shear flow, which hasreceived much more attention in physics. The challengewill be to find a single theory which can describe bothshear cells and draining silos. Our results for pebble-bedreactor geometries may provide some useful clues.
X. ACKNOWLEDGEMENTS
This work was supported by the U. S. Departmentof Energy (grant DE-FG02-02ER25530) and the NorbertWeiner Research Fund and the NEC Fund at MIT. Workat Sandia was supported by the Division of MaterialsScience and Engineering, Basic Energy Sciences, Officeof Science, U. S. Department of Energy. Sandia is a mul-tiprogram laboratory operated by Sandia Corporation, a
Lockheed Martin Company, for the U.S. Department ofEnergy’s National Nuclear Security Administration un-der contract DE-AC04-94AL85000.
APPENDIX A: NUMERICAL SOLUTION OFTHE KINEMATIC MODEL
In the Kinematic Model for drainage the vertical down-ward velocity u in the container is assumed to follow adiffusion equation of the form
∂v
∂z= b∇2
⊥v
where ∇2⊥ is the horizontal Laplacian. By exploiting the
axial symmetry, v can be treated as a function of z andr only. In cylindrical coordinates the Laplacian is
∂v
∂z= b
1r
∂
∂r
(r∂v
∂r
)= b
∂2v
∂r2+ b
1r
∂v
∂r.
The radial velocity component is given by
u = b∂v
∂r
and by enforcing that the velocity field at the wall mustbe tangential to the wall, we can obtain boundary con-ditions for solving v.
To solve the above equation in a cylinder is straight-forward, since we can make use of a rectangular grid.The boundary condition reduces to vr = 0 at the wall.However, to solve this equation in the reactor geometry,we must also consider the complication of the radius ofthe wall, R, being a function of z. To ensure accurateresolution in the numerical solution of v at the wall, weintroduce a new coordinate λ = r/R(z), η = z, whichthen allows us to solve for u over the range 0 < λ < 1.Under this change of variables, the partial derivativestransform according to
∂
∂r=
1R(η)
∂
∂λ
∂
∂z=
∂
∂y− λR′(η)
R(η)∂
∂λ.
In the transformed coordinates
R2vη =b
λvλ + bvλλ + λRR′vλ.
To ensure differentiability at r = 0, we use the boundarycondition
∂v
∂λ
∣∣∣∣λ=0
= 0, (A1)

17
and by ensuring zero normal velocity at the wall we findthat
∂v
∂λ
∣∣∣∣λ=1
= −vR′R
b. (A2)
To numerically solve this partial differential equation,we make use of the implicit Crank-Nicholson integrationscheme. We write vn
j = v(j∆λ, n∆η), and solve in therange j = 0, 1, . . . , N where N = ∆λ−1. Away from theend points, the Crank-Nicholson scheme tells us that
vn+1j − vn
j
∆η=
b
2∆λ2R2
(vn+1
j+1 − 2vn+1j + vn+1
j−1 + vnj+1
−2vnj + vn
j−1
)+
(b
4j∆λ2R2+
jR′
4R
)×
(vn+1
j+1 − vn+1j−1 + vn
j+1 − vnj−1
),
where all references to R and R′ are evaluated at η =∆η(j + 1
2 ). If j = 0, then by reference to equation A1,we find that
vn+10 − vn
0
∆η=
b
∆λ2R2
(vn+11 − vn+1
0 + vn1 − vn
0
).
Similarly, for j = N , by reference to equation A2, we seethat effectively
vnN+1 − vn
N−1
2∆λ= −vn
NR′R
b
and hence
vn+1N − vn
N
∆η=
b
∆λ2R2
(vn+1
N−1 − vn+1N + vn
N−1 − vnN
)−
((2N + 1)R′
2R+
R′2
2b
) (vn+1
N + vnN
).
If we write vn = (vn0 , vn
1 , . . . , vnN )T , then the above nu-
merical scheme can be written in the form Svn+1 = Tvn
where S and T are tridiagonal matrices; this system canbe efficiently solved by recursion in O(N) time. Theabove scheme was implemented in C++, and gives ex-tremely satisfactory results, even with a relatively smallnumber of gridpoints.
[1] See, e.g., http://gif.inel.gov, http://nuclear.inel.gov.[2] K. Fukuda, J. Kendall, J. Kupitz, D. Matzner, E. Mulder,
P. Pretorius, A. Shenoy, S. Shiozawa, W. Simon, Y. Sun,et al., Tech. Rep. IAEA-TECDOC–1198, InternationalAtomic Energy Agency, Vienna, Austria (2001).
[3] D. Nicholls, Nuclear News 44 (2001).[4] D. Talbot, MIT Technology Review pp. 54–59 (2002).[5] S. Reiss, Wired Magazine 12.09 (2004).[6] S. Hu and R. Wang, in Proceedings of the 2nd Inter-
national Topical Meeting on High Temperature ReactorTechnology, Beijing, China (Institute for Nuclear andNew Energy Technology, 2004).
[7] Http://www.pbmr.com.[8] Http://web.mit.edu/pebble-bed.[9] J. Choi, A. Kudrolli, and M. Z. Bazant, J. Phys.: Con-
densed Matter 17, S2533 (2005).[10] J. Mullins, J. Appl. Phys. 43, 665 (1972).[11] R. M. Nedderman and U. Tuzun, Powder Technology 22,
243 (1979).[12] R. M. Nedderman, Statics and Kinematics of Granular
Materials (Nova Science, 1991).[13] U. Tuzun and R. M. Nedderman, Powder Technolgy 23,
257 (1979).[14] A. Medina, J. A. Cordova, E. Luna, and C. Trevino,
Physics Letters A 220, 111 (1998).[15] A. Samadani, A. Pradhan, and A. Kudrolli, Phys. Rev.
E 60, 7203 (1999).[16] J. Choi, A. Kudrolli, R. R. Rosales, and M. Z. Bazant,
Phys. Rev. Lett. 92, 174301 (2004).[17] M. Z. Bazant, Mechanics of Materials (2005), (to ap-
pear).[18] C. H. Rycroft, M. Z. Bazant, G. S. Grest, and J. W.
Landry (2005), preprint.
[19] S. B. Savage, J. Fluid Mech. 92, 53 (1979).[20] J. T. Jenkins and S. B. Savage, J. Fluid Mech. 130, 187
(1983).[21] J. R. Prakash and K. K. Rao, J. Fluid Mech. 225, 21
(1991).[22] L. P. Kadanoff, Rev. Mod. Phys. 71, 435 (1999).[23] V. V. R. Natarajan, M. L. Hunt, and E. D. Taylor, J.
Fluid Mech. 304, 1 (1995).[24] D. G. Schaeffer, J. Diff. Eq. 66, 19 (1987).[25] E. B. Pitman and D. G. Schaeffer, Commun. Pure. Appl.
Math. 40, 421 (1987).[26] K. Kamrin and M. Z. Bazant, preprint.[27] A. Medina, J. Andrade, and C. Trevino, Physics Letters
A 249, 63 (1998).[28] D. E. Mueth, G. F. Debregeas, G. S. Karczmar, P. J.
Eng, S. R. Nagel, and H. M. Jaeger, Nature 406, 385(2000).
[29] E. R. Weeks, J. C. Crocker, A. C. Levitt, A. Schofield,and D. A. Weitz, Science 287, 627 (2000).
[30] J.-C. Tsai and J. P. Gollub, Phys. Rev. E 70, 031303(2004).
[31] M. Menon and D. J. Durian, Science 275, 1920 (1997).[32] J. S. Goodling, R. I. Vachon, W. S. Stelpflug, and S. J.
Ying, Powder Technology 35, 23 (1983).[33] A. J. Sederman, P. Alexander, and L. F. Gladden, Pow-
der Technology 117, 255 (2001).[34] Y. Cohen and A. B. Metzner, AIChE Journal 27, 705
(1981).[35] D. Vortmeyer and J. Schuster, Chemical Engineering Sci-
ence 38, 1691 (1983).[36] S. M. White and C. L. Tien, Warme- und
Stoffubertragung 21, 291 (1987).[37] A. Kadak and M. Z. Bazant, in Proceedings of the 2nd

18
International Topical Meeting on High Temperature Re-actor Technology, Beijing, China (Institute for Nuclearand New Energy Technology, 2004).
[38] W. K. Terry, H. D. Gougar, and A. M. Ougouag, Annalsof Nuclear Energy 29, 1345 (2002).
[39] H. D. Gougar, W. K. Terry, and A. M. Ougouag, in Pro-ceedings of the Conference on High-Temperature Reac-tors, Petten, NL (International Atomic Energy Agency,Vienna, Austria, 2002).
[40] C. du Toit, in Proceedings of the Conference on High-Temperature Reactors, Petten, NL (International AtomicEnergy Agency, Vienna, Austria, 2002).
[41] A. M. Ougouag, J. J. Cogliati, and J.-L. Kloosterman,in Proceedings of the Topical Meeting on Mathematicsand Computation, Avignon, France (American NuclearSociety, LaGrange Park, IL, 2005).
[42] L. E. Silbert, D. Ertas, G. S. Grest, T. C. Halsey,D. Levine, and S. J. Plimpton, Phys. Rev. E 64, 051302(2001).
[43] J. W. Landry, G. S. Grest, L. E. Silbert, and S. J. Plimp-
ton, Phys. Rev. E 67, 041303 (2003).[44] P. A. Cundall and O. D. L. Strack, Geotechnique 29, 47
(1979).[45] J. Litwiniszyn, Rheol. Acta 2/3, 146 (1958).[46] G. Y. Onoda and E. G. Liniger, Phys. Rev. Lett. 64,
2727 (1990).[47] C. S. O’Hern, S. A. Langer, A. J. Liu, and S. R. Nagel,
Phys. Rev. Lett. 88, 075507 (2002).[48] S. Torquato, T. M. Truskett, and P. G. Debenedetti,
Phys. Rev. Lett. 84, 2064 (2000).[49] M. Newey, J. Ozik, S. M. van der Meer, E. Ott, and
W. Losert, Europhys. Lett. 66, 205 (2004).[50] Z. S. Khan, W. A. Tokaruk, and S. W. Morris, Europhys.
Lett. 66, 212 (2004).[51] Z. S. Khan and S. W. Morris, Phys. Rev. Lett. 94, 048002
(2005).[52] T. Shinbrot and F. J. Muzzio, Phys. Rev. Lett. 81, 4365
(1998).[53] T. Shinbrot, Nature 429, 352 (2004).