analysis of fragmentation and disturbance regimes … bhatt et al.pdf · 2015-04-27 · analysis of...
TRANSCRIPT

Tropical Ecology 56(3): 275-288, 2015 ISSN 0564-3295
© International Society for Tropical Ecology
www.tropecol.com
Analysis of fragmentation and disturbance regimes in south Gujarat
forests, India
G. D. BHATT1, S. P. S. KUSHWAHA
1*, S. NANDY
1, KIRAN BARGALI
2, P. S. NAGAR
3 & D. M. TADVI
3
1Forestry and Ecology Department, Indian Institute of Remote Sensing, ISRO,
Dehradun 248001, Uttarakhand, India
2Department of Botany, Kumaun University, Nainital 263001, Uttarakhand, India
3Department of Botany, M.S. University of Baroda, Vadodara 391110, Gujarat, India
Abstract: Forests, world over, have degraded, fragmented, and depleted as human
population has swelled. In the present study, the forest fragmentation and the disturbance
regimes were assessed in south Gujarat using satellite image-based forest and land use
mapping followed by landscape analysis using Spatial Landscape Modelling (SPLAM) software.
The on-screen visual interpretation of Resourcesat-1 LISS-III imagery facilitated in mapping of
9 forest and 12 non-forest classes. The observations revealed that 51.68 % of the forest area had
low fragmentation while the rest had medium to high fragmentation. Among the vegetation
types, 62.84 % of Tropical Moist Mixed Deciduous (TMMD) and 54.88 % of Tropical Mixed Dry
Deciduous (TMDD) forests had low level of fragmentation whereas 15.5 % mangrove forest had
high fragmentation. The study also showed that 72.53 % of the total forest area had low
disturbance. High disturbance was noticed in Riverine forest (22.78 %) while TMMD forest was
found to be less disturbed than TMDD forest. District-wise analysis revealed that forests of
Valsad, Navsari and Bharuch were highly disturbed as well as fragmented whereas forests of
The Dangs, Surat and Narmada had low disturbance and fragmentation. The study
demonstrated important role of remote sensing, GIS, and SPLAM in forest/land use mapping
and disturbance regimes and fragmentation status assessment.
Resumen: Los bosques del mundo entero se han degradado, fragmentado y empobrecido
conforme la población humana ha aumentado. En el presente estudio se evaluó la fragmentación
de los bosques y los regímenes de disturbio en el sur de Guyarat mediante la cartografíade los
bosques y el uso de la tierra basado en imágenes de satélite, seguido de análisis del paisaje
usando el programa Spatial Landscape Modelling (SPLAM). La interpretación visual en
pantalla de las imágenes Resourcesat-1 LISS-III facilitó en la cartografía de 9 clases de bosque
y 12 clases no forestales. Las observaciones mostraron que 51.68 % de la superficie forestal
estaba poco fragmentada, mientras que la fragmentación en el resto varió entremedia y alta.
Entre los tipos de vegetación, 62.84 % del bosquetropical húmedo caducifolio mixto (TMMD) y
54.88 % del bosque tropical mixto seco deciduo (TMDD) tenían un nivel bajo de fragmentación,
mientras que en 15.5 % del manglar la fragmentación fuealta. El estudio también mostró que
72.53 % de la superficie forestal estaba poco perturbada. Se registró perturbación alta en el
bosque ribereño (22.78 %), mientras que se encontró que el bosque TMMD estaba
menosperturbado que el bosque TMDD. Un análisis por distritos reveló que los bosques de
Valsad, Navsari y Bharuchestaban fuertemente perturbados y fragmentados, mientras que los
bosques de The Dangs, Surat y Narmadateníanniveles bajosde perturbación y fragmentación. El
estudio demostró el importante papel de la percepción remota, los SIG y el programa SPLAM
para la cartografía del uso forestal y de la tierra, así comoen la evaluación de los regímenes de
*Corresponding Author; e-mail: [email protected]
276 ANALYSIS OF FRAGMENTATION AND DISTURBANCE REGIMES
disturbio y el estado de fragmentación.
Resumo: Por todo o mundoas florestas têm-se degradado, fragmentado e empobrecido com
o aumento da da população humana. No presente estudo, a fragmentação florestal e os regimes
de perturbação foram avaliados no sul de Gujarat usando como base imagens de satélite da
floresta e o mapeamento do uso do solo, seguido de análise da paisagem com recurso ao software
de Modelação Espacial da Paisagem (SPLAM). A interpretação visual no monitor da imagemda
floresta usando o Resourcesat-1 LISS-III facilitou o mapeamento de 9 classes de floresta e 12
classes não-florestais. As observações mostraram que 51,68 % da área de floresta apresentava
baixa fragmentação, enquanto o restantorevelou uma fragmentação média a alta. Entre os tipos
de vegetação, 62,84 % da floresta Tropical Mista Húmida Decídua (TMMD) e 54,88 % da
floresta Tropical Mista Seca Decídua (TMDD) apresentavam baixo nível de fragmentação,
enquanto que 15,5 % do mangal apresentava alta fragmentação. O estudo também mostrou que
72,53 % da área total de floresta foi sugeita a baixa perturbação. Alta perturbação foi notado
naFloresta Ribeirinha (22,78 %), enquanto a floresta TMMD revelou ter sido menos perturbada
que a TMDD. A análise por Distrito mostrou que as florestas de Valsad, Navsari e Bharuch
foram altamente perturbadas, assim como fragmentadas, enquanto que as florestas de The
Dangs, Surat e Narmada apresentavam baixa perturbação e fragmentação. O estudo
demonstrou o papel importante dos sistemas de detecção remota GIS e SPLAM, no mapeamento
da floresta / uso da terra e dos regimes de perturbação e avaliação do estado de fragmentação.
Key words: GIS, landscape, land use, remote sensing, SPLAM, vegetation type.
Introduction
Forests in India have been used by the people
over millennia for a variety of purposes and
practices (Lele & Hegde 1997; Uma Shankar et al.
1998). Of these, the livestock grazing, non-timber
forest product, fodder, medicine, food, timber,
resin, dye, fuel, oil, tannin, and other forest
products collection are historic and continuing
uses of the forest (Banerjee 1995; Bhat et al. 2001;
FAO 2006). Among various causes of forest
fragmentation and degradation, the live-stock
grazing, fuelwood, fodder extraction, and burning
for cultivation are recognized as the chronic
disturbances (Singh 1998) with substantial impact
on flora, fauna, soil, water and the micro-climate
(Tilman & Lehman 2001). The extraction,
exceeding regeneration, depletes forest ecosystems.
The pressure on forests has steadily increased
with an ever-increasing human population in the
country. The quantitative studies on the landscape
level impacts of disturbance on the forests in India
are relatively few (Shahabuddin & Prasad 2004).
Majority of the studies have focused on the
impacts either on vegetation (Kumar & Shaha-
buddin 2005; Madhusudan 1999; Sagar et al. 2003;
Uma Shankar et al. 1998), soil (Sahani & Behera
2001), or wildlife (Madhusudan 2000). No study
involving landscape level assessment of the
disturbance regimes and the forest fragmentation
is known from this part of India.
The geospatial technology, including remote
sensing, geographic information system (GIS) and
global positioning system (GPS), involving acqui-
sition and analysis of the remote sensing data to
extract meaningful information, has developed
substantially in the past four decades (Mas 1999).
Remotely-sensed data has been used in the past
for a variety of purposes such as forest cover
monitoring (NRSA 1983), land use / land cover
mapping and monitoring (Kushwaha 1990; Kumar
& Mathur 2014) stand volume assessment (Köhl &
Kushwaha 1994), biomass estimation (Pandey et
al. 2010; Roy & Ravan 1996), wildlife habitat
evaluation (Kushwaha & Roy 2002; Nandy et al.
2012; Singh & Kushwaha 2011), etc. An effort was
made in late nineties to use remote sensing data
for nationwide rapid biodiversity characterization
and a three-pronged method involving satellite
imagery, landscape analysis and field inventory of
biodiversity was developed for the first time in
India and implemented (Roy & Tomar 2000).
Several studies have subsequently used the metho-
dology to characterize biological richness in the
country (Kushwaha et al. 2005; Nandy &
Kushwaha 2010).

BHATT et al. 277
Forests in India are subjected to various
disturbance regimes and majority of them are
anthropogenic. Disturbance, a common and wide-
spread phenomenon in our anthropocentric world,
is defined as a discrete event with the passage of
time that modifies landscapes, ecosystems, commu-
nities and the populations (Forman & Godron
1986). The disturbance also leads to processes like
fragmentation, degradation, depletion, species
migration, and extinction. The impact of the
disturbance regimes on the landscapes can be well
understood by analyzing the spatial and temporal
nature of the disturbance (White & Pickett 1985).
At landscape level, disturbance is related to patch
structure and spatial arrangement of patches, and
determines the fate of patches, their size, and the
duration. Severe disturbance generally has depre-
ssing effect on the biodiversity, but intermediate
disturbance seems to enhance diversity in any
system (Moloney & Levin 1996).
Disturbance, which is a major driver of the
landscape dynamics, acts at all spatio-temporal
levels. Human-induced disturbance differs from
natural disturbance, especially in the extent,
severity and the frequency. When capacity of the
landscape to assimilate the human disturbance is
overwhelmed, the disturbance process is trans-
formed into a stress process, which reduces bio-
diversity. Human activity has widespread impact
on biodiversity, affecting ecological entities from
species to whole communities and the ecosystems,
though heterogeneity in the landscape can some-
times be due to moderate disturbance (Li &
Reynolds 1994). The disturbance regimes,
however, can be quantified by using different
indices, i.e., degree of fragmentation, fractal
dimension, contagion, juxtaposition, evenness and
patchiness (Patel 1997). In this study, we studied
the status of the disturbance regimes and the
forest fragmentation in south Gujarat, India.
Materials and methods
Study area
Biogeographically, Gujarat province can be
divided into four major zones viz., the Indian
desert, the semi-arid, the Western Ghats, and the
coastal areas. It is bounded in the north by
Rajasthan, in the east by Madhya Pradesh, in
south by Maharashtra provinces, and in the west
by international boundary of Pakistan. The
Arabian Sea lies on its western and south-western
sides with two gulfs- the Gulf of Kachchh and the
Gulf of Khambhat. The south Gujarat (21°14'-
22°49' N and 72° 22' - 74°15' E) consists of seven
districts viz., Valsad, Navsari, The Dangs, Surat,
Bharuch, Narmada, and Vadodara, covering a
geographical area of 31,495 km2 (Fig. 1). The
plains of south Gujarat are watered by Purna, Par,
Damanganga, Auranga, Kolak, Ambica, Darota,
Narmada, and Tapi rivers. The region shows a
typical sub-humid to humid climate (Anonymous
2006). The mean annual temperature is about 26
°C and the mean summer and winter tempe-
ratures are 41 and 22 °C respectively with 70 - 75 %
mean relative humidity. The average annual
rainfall varies from 1300 - 2200 mm (Patel 1997).
The major forest types in the south Gujarat
are: Moist Teak Forest (3B/C1(b,c)), Southern Moist
Mixed Deciduous Forest (3B/C2), Southern
Secondary Moist Mixed Deciduous Forest (3B/2S1),
Mangrove Forest (4B/TS1) and Mangrove Scrub
(4B/TS2), Dry Teak Forest (5A/C1(b)), Southern Dry
Tropical Riverine Forest (5/IS1) and Desert Thorn
Forest (6B/C1) (Champion & Seth 1968). The main
tree species are: teak (Tectona grandis L.f.), sadad
(Terminalia crenulata Roth.), shisham (Dalbergia
sissoo Roxb.), khair (Acacia catechu L.f. (Willd.),
timru (Diospyros melanoxylon Roxb.), mahuda
(Madhuca longifolia var. latifolia (Roxb.) A.
Chev.), dhavdo (Anogeissus latifolia Roxb. ex DC.
Wall ex Bedd.), khakhar (Butea monosperma
(Lam.) Taub.), kalam (Mitragyna parvifolia (Roxb.)
Korth.), bondarao (Lagerstroemia parviflora
Roxb.), billi (Aegle marmelos (L.) Correa. ex Roxb.),
moina (Lannea coromandelica (Houtt.) Merr., etc.
The critically endangered species are Sterculia
guttata Roxb., Toona ciliata M. Roem. and
Wrightia dolichocarpa Bahadur & Bennet. The
endangered species are Casearia championii
Thwaites, Tamrix aphylla (L.) H. Karst., Melia
dubia Cav., and Ficus nervosa B. Heyne ex Roth.
The vulnerable species are Firmiana colorata
(Roxb.) R. Br., Boswellia serrata Roxb. ex Colebr.,
Garuga pinnata Roxb., Ceriops tagal (Perr.) C.B.
Rob., and Ehretia laevis Roxb (Ambasta 1986).
The main faunal species found in south
Gujarat forests are panther (Panthera pardus L.),
sloth bear (Melursus ursinus Shaw), chinkara
(Gazella bennetti Sykes), and grey hornbill
(Ocyceros birostris Scopoli) (Anonymous 2006). The
study area is rich from biodiversity point of view
(IIRS 2011). It has three wildlife sanctuaries
(WLS) - Jambughoda WLS in Vadodara district,
Shoolpaneshwar WLS in Narmada district, and
Purna WLS in The Dangs district, and Vansda
National Park in Navsari district. Physiogra-

278 ANALYSIS OF FRAGMENTATION AND DISTURBANCE REGIMES
Fig. 1. Location of the study area in India.
Table 1. Satellite imagery used in the study.
Satellite
Sensor Bands Spatial
resolution (m)
Path-row Date of pass
Resourcesat-1 LISS-III Band-1
(0.52 - 0.59 µm) Green
Band-2
(0.62-0.68 µm) Red
Band-3
(0.77-0.86 µm) NIR
Band-4
(1.55-1.70 µm) SWIR
23.5 93-56 19 Oct.
& 04 May 2006
-do- -do- -do- -do- 93-57 19 Oct. & 10 Apr.
2006 -do- -do- -do- -do- 94-56 24 Oct. & 09 May
2006 -do- -do- -do- -do- 94-57 24 Oct. & 09 May
2006
-do- -do- -do- -do- 94-58 24 Oct. & 15 Apr.
2006 -do- -do- -do- -do- 95-57 10 Oct. & 20 Apr.
2006
BHATT et al. 279
phically, the area is divided into two parts: the
western part comprising coastal plain (locally
known as kantha vistar) and the eastern part
comprising hills (dungar vistar). The elevation
ranges from 100 to 1000 m, the highest peak being
1000 m at Saputara in The Dangs district.
Vegetation type and land use mapping
Twelve Resourcesat-1 LISS-III satellite
imagery- six belonging to October-November (wet
season) and another six belonging to April-May
(dry season) 2006 were used for the present study
(Fig. 2). Image details are given in Table 1. Dark
pixel subtraction technique was used to minimize
the haze in the images (Lillesand et al. 2007). The
satellite imagery was geo-referenced using Land-
sat ETM+ orthorectified images (UTM projection
and WGS 84 datum) and nearest neighborhood
resampling method. The images were mosaiced
using feather overlap function of ERDAS Imagine
and the study area (31,495 km2) was extracted.
The overall methodology is shown in Fig. 3. All
vegetation type and land use categories were field-
visited (Table 2) and their location was recorded
using a Trimble Juno-SB GPS receiver. The two-
season satellite data facilitated in vegetation type
and land use (Fig. 4) mapping using on-screen
interpretation technique. Two-season satellite data
was used to derive phenological inferences, which
helped in forest and land use types mapping. All
forest types described by the Champion & Seth
(1968) for south Gujarat could be mapped. The
accuracy of the classification was field-verified
using 131 randomly distributed points. A confusion
matrix was generated in the process.
A semi-expert Spatial Landscape Modelling
(SPLAM) software was developed in-house in
Windows environment for landscape analysis. The
SPLAM was customized in the ArcInfo using Arc
Macro Language (AML) and the libraries of the
GRID module. A new toolbar, ArcObjects was
developed in ArcMap for landscape analysis
(Jeganathan & Narula 2006). The vegetation type/
land use map was used as input to SPLAM. A
disturbance index (DI), indicative of the distur-
bance regimes, was calculated as a function of
fragmentation, porosity, patchiness, interspersion,
juxtaposition and biotic disturbance. For frag-
mentation computation, the forest types and land
uses were reclassified into forest and non-forest
categories. A user grid cell of 500 m x 500 m was
moved through the spatial data layer for deriving
the number of patches within the grid cell. A look-
up table (LUT) was generated to keep the
normalized patch data per cell in the range of 0 to
10. Porosity (Po) (Forman & Godron 1986) is the
measure of number of patches or density of
patches within a particular type, regardless of
patch size:
n
iiCpPo
1
(1)
where, n is number of patches and Cpi is the
number of closed patches of ith cover class.
Table 2. Area under different vegetation/land use
categories.
Vegetation type/land use Area (km2) Area (%)
Teak mixed moist deciduous
forest 243.01 0.77
Teak mixed dry deciduous forest 4718.54 14.98
Mangrove forest 32.90 0.10
Mangrove scrub 75.40 0.24
Riverine forest 0.16 0.0004
Ravine thorn forest 144.29 0.46
Forest plantation 19.53 0.06
Degraded forest 0.36 0.0011
Scrub 912.38 2.90
Prosopis juliflora scrub 257.85 0.82
Grassland 19.10 0.06
Orchard 4.56 0.01
Agriculture 20452.35 64.94
Barren land 77.03 0.24
Mine 72.49 0.23
Mudflat 109.30 0.35
Salt-affected land 605.43 1.92
Salt pan 169.50 0.54
Waterbody 3021.55 9.59
Wetland 33.09 0.11
Settlement 526.19 1.67
Total 31,495.00 100.00
Patchiness is a measure of the density of
patches of all types or number of clusters in a
given mask. In other words, it is measure of the
number polygons over a particular area (Romme
1982):
1001
NP
n
iiD
(2)
where, N is the number of boundaries between
adjacent cells, and D is the dissimilarity value for

280 ANALYSIS OF FRAGMENTATION AND DISTURBANCE REGIMES
ith boundary between adjacent cells.
Interspersion (Int) is measured as a count of
dissimilar neighbors with respect to central pixel.
In other words, it is measurement of the spatial
intermixing (Lyon 1983) of the vegetation types:
n
ii NSFInt
1
(3)
where,
n
j j
inArea
EdgeSF
1 2
Edge - the length of edge, in both x and y
directions and Area- the area of the jth polygon
formed by groups in the ith vegetation types/land
uses.
Juxtaposition is defined as measure of
proximity of the vegetation (Lyon 1983). Its measure-
ment includes relative weight assigned by the
importance of the adjacency of two cover types.
The added weight in juxtaposition gives the correct
perspective in ultimately deriving the disturbance
index:
n
i
i
iJux
JuxDJux
1 max
(4)
where, Juxmax is the average total weight edge
per habitat unit, Di is edge desirability weight for
each cover type combination based on the field
data and Juxi is length of edge between
combinations of vegetation types/land uses on
either side of an edge.
The disturbance in any forest area is directly
related to the access by the people to forest for
Fig. 2. False colour composite of the study area.

BHATT et al. 281
various purposes. Infrastructure such as roads,
railway lines and settlements are key access
elements, which act as drivers of disturbance.
Topographic maps were used to extract the road,
rail, and settlement features. Variable distance
buffers were created to address the proximity issue
with the hypothesis that greater the distance
lesser the disturbance. The buffers of varying
distances were generated for calculation of the
disturbance index through a probabilistic weight-
based linear additive model:
6543211
wtBDwtJuxwtIntwtwt iiiiii
n
iiiii wtFragPPoDI
(5)
where, DI = Disturbance index, Po = Porosity,
P = Patchiness, Frag = Fragmentation, Int =
Interspersion, Jux = Juxtaposition, BD = Biotic
Disturbance.
Three classes of fragmentation and distur-
bance regimes viz., low, medium and high were
computed by interpreting the histogram and the
area under each category was calculated. The
values were classified using cluster principle.
Histogram is a graphical tool to explore the
statistical distribution of classes and clusters in
attribute space (Apan 1997). The fragmentation
and disturbance index maps were intersected with
the vegetation type/land use map to derive at
forest type - wise status of fragmentation and
Fig. 3. The methodology.
Satellite Data (IRS P6 LISS-III)
Radiometric/Geometric Corrections
Vegetation Type/Land Use Map (Final)
Topographic Map
Landscape Analysis using SPLAM (Fragmentation, Porosity, Patchiness, Interspersion,
Juxtaposition, Biotic Disturbance)
Disturbance Index
Study Area Extraction
Ground Truthing
On-Screen Visual Interpretation
Field Checking and Corrections
Set
tlem
ent,
Roa
d an
d R
ail B
uffe
r
Vegetation Type/Land Use Map (Interim)
Accuracy Assessment
282 ANALYSIS OF FRAGMENTATION AND DISTURBANCE REGIMES
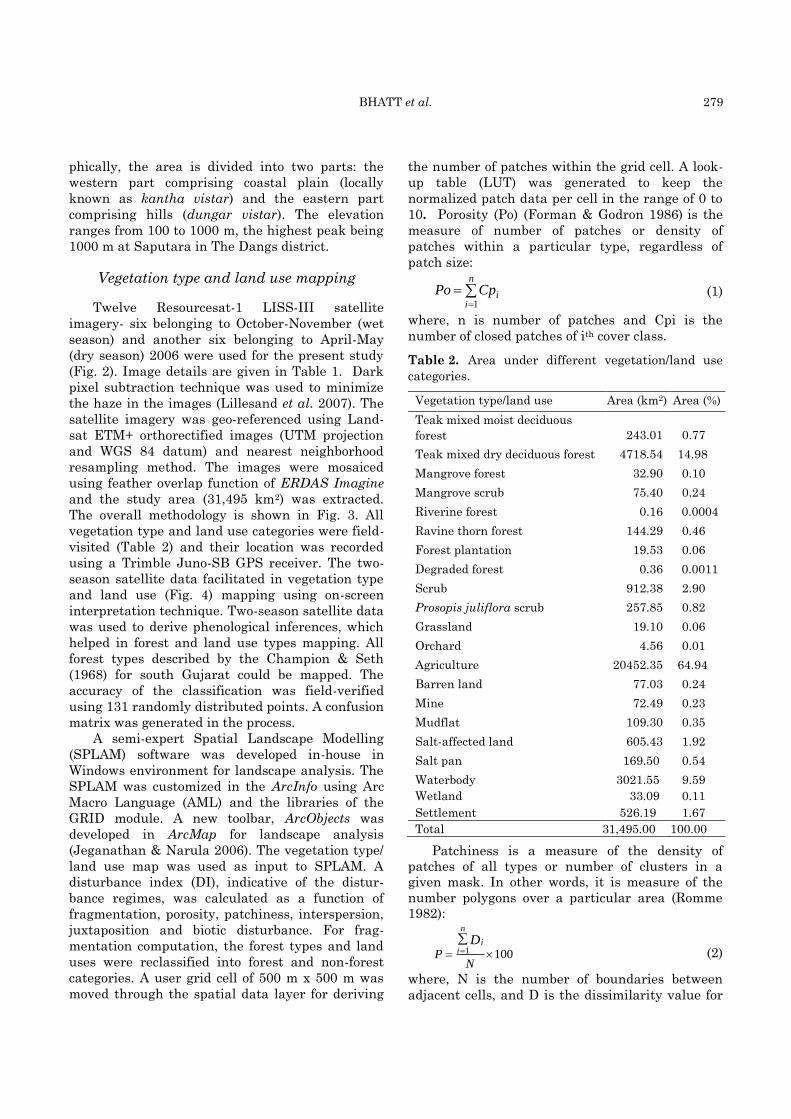
Fig. 4. Vegetation type/land use map.
disturbance index. The district-wise status of
fragmentation and disturbance index was also
worked out.
Results and discussion
The on-screen visual interpretation method
facilitated in overall mapping of 21 categories of
vegetation types and land uses (Fig. 4). The
maximum forest area (4718.54 km2 or 14.98 %)
was covered by Teak Mixed Dry Deciduous Forest
whereas Riverine Forest covered minimum area
(0.16 km2 or 0.0004 %). The maximum area in land
use category was covered by agriculture (20452.35
km2 or 64.94 %) and minimum by wetland (33.09
km2 or 0.11 %). Table 2 shows the area under
different vegetation types and the land uses in the
study area. The forest classes viz., Teak Mixed
Moist Deciduous (TMMD) Forest, Teak Mixed Dry
Deciduous (TMDD) Forest, Mangrove Forest, Man-
grove scrub, Riverine Forest, Ravine Thorn Forest,
Degraded Forest, Prosopis juliflora scrub, and the

BHATT et al. 283
284 ANALYSIS OF FRAGMENTATION AND DISTURBANCE REGIMES
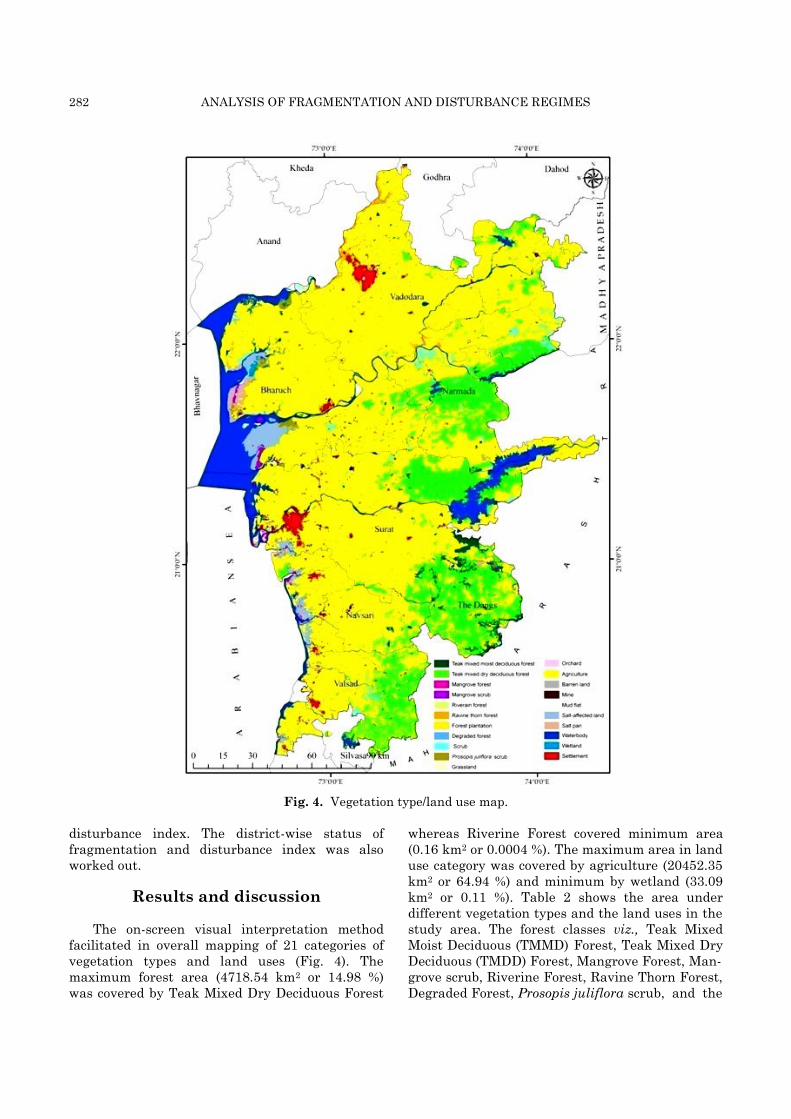
Fig. 5. Fragmentation map.
forest plantation, together covered 17.44 % of the
geographical area. The overall classification
accuracy was 87.78 % (Khat = 0.85) (Table 3).
Fig. 5 illustrates the levels of forest
fragmentation in the study area. It was observed
that 51.68 % of forest area was under low
fragmentation while the rest of the area fell under
medium to high fragmentation (Table 4) though
the area under medium fragmentation was quite
high. If proper conservation measures are
not taken, the area under this category might
increase. High fragmentation was observed around
the settlements and along the roads. The study
also revealed that 62.84 % of TMMD and 54.88 %
TMDD forests had low level of fragmentation.
High level of fragmentation was observed in
Mangrove forest (15.5 %) followed by Ravine Thorn
forest (10.47 %). It was also observed that 83.59 %
of forest plantation, 75.74 % of Ravine Thorn
Forest, and 75.34 % of P. juliflora scrub had
medium fragmentation. More than 85 % of the
Mangrove Forest, forest plantation and Ravine
Thorn Forest had medium to high fragmentation.

BHATT et al. 285
Fig. 6. Disturbance index map.
Fig. 6 shows the different levels of forest
disturbance in south Gujarat forests. The level of
disturbance in different vegetation types is
indicated in Table 5. An area equivalent to 72.53 %
of the total forest area had low disturbance,
indicating that most of the forest areas were
intact. The disturbance levels also showed that
22.99 % and 4.48 % of forest areas respectively
were medium and highly disturbed. It was
observed that 76.18 % of TMDD forest, 72.91 % of
Mangrove scrub and 68.28 % of TMMD forest had
low level of disturbance. High level of disturbance
was observed in Riverine forest (22.78 %) followed
by Mangrove forest (18.53 %) and P. juliflora scrub
(16.36 %). The study also revealed that 97.51 % of
degraded forest had medium level of disturbance
followed by Riverine forest (77.22 %) and P.
juliflora scrub (49.07 %). All degraded forest and
Riverine forests were found to be under medium to
high disturbance category, indicating these forest
categories as the most disturbed ones in the study
area.
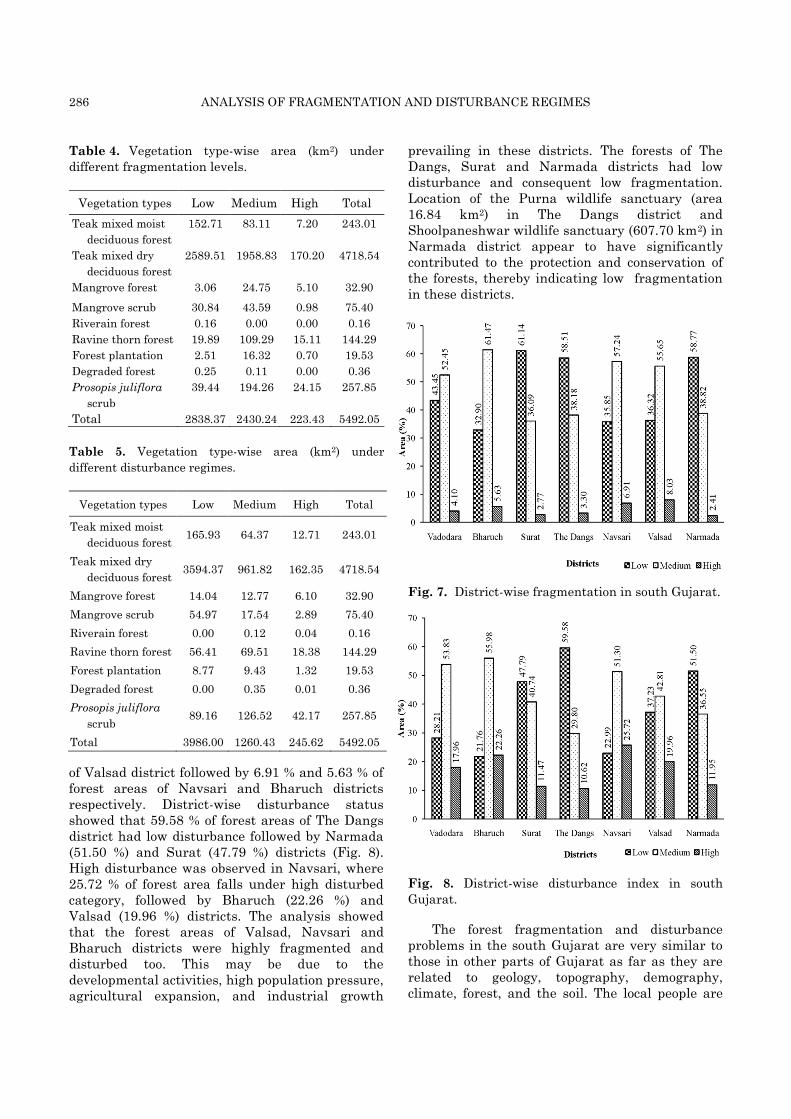
Among districts, low fragmentation was
observed in the forests of Surat followed by
Narmada and The Dangs (Fig. 7). It was noticed
that 61.14 % of forests of Surat district had low
fragmentation whereas in Narmada and The
Dangs districts, low fragmentation covered 58.77 %
and 58.51 % of the forests respectively. High
fragmentation was observed in 8.03 % forest area
286 ANALYSIS OF FRAGMENTATION AND DISTURBANCE REGIMES
Table 4. Vegetation type-wise area (km2) under
different fragmentation levels.
Vegetation types Low Medium High Total
Teak mixed moist
deciduous forest
152.71 83.11 7.20 243.01
Teak mixed dry
deciduous forest
2589.51 1958.83 170.20 4718.54
Mangrove forest 3.06 24.75 5.10 32.90
Mangrove scrub 30.84 43.59 0.98 75.40
Riverain forest 0.16 0.00 0.00 0.16
Ravine thorn forest 19.89 109.29 15.11 144.29
Forest plantation 2.51 16.32 0.70 19.53
Degraded forest 0.25 0.11 0.00 0.36
Prosopis juliflora
scrub
39.44 194.26 24.15 257.85
Total 2838.37 2430.24 223.43 5492.05
Table 5. Vegetation type-wise area (km2) under
different disturbance regimes.
Vegetation types Low Medium High Total
Teak mixed moist
deciduous forest 165.93 64.37 12.71 243.01
Teak mixed dry
deciduous forest 3594.37 961.82 162.35 4718.54
Mangrove forest 14.04 12.77 6.10 32.90
Mangrove scrub 54.97 17.54 2.89 75.40
Riverain forest 0.00 0.12 0.04 0.16
Ravine thorn forest 56.41 69.51 18.38 144.29
Forest plantation 8.77 9.43 1.32 19.53
Degraded forest 0.00 0.35 0.01 0.36
Prosopis juliflora
scrub 89.16 126.52 42.17 257.85
Total 3986.00 1260.43 245.62 5492.05
of Valsad district followed by 6.91 % and 5.63 % of
forest areas of Navsari and Bharuch districts
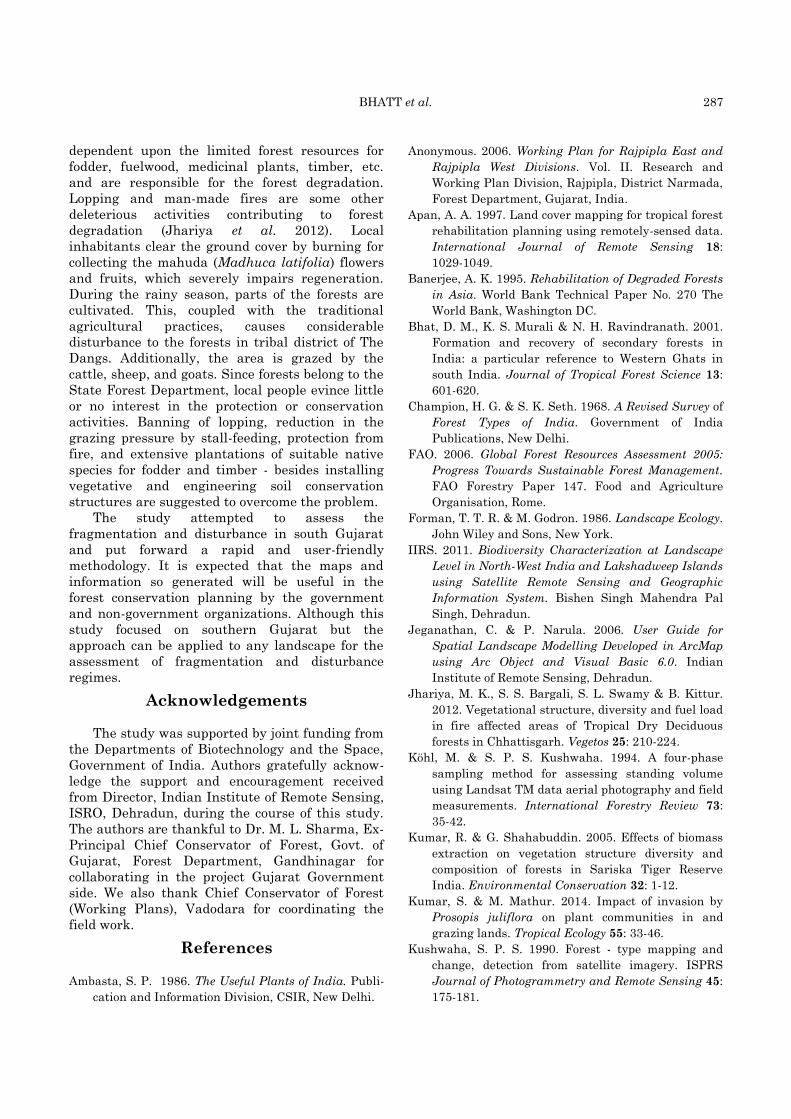
respectively. District-wise disturbance status
showed that 59.58 % of forest areas of The Dangs
district had low disturbance followed by Narmada
(51.50 %) and Surat (47.79 %) districts (Fig. 8).
High disturbance was observed in Navsari, where
25.72 % of forest area falls under high disturbed
category, followed by Bharuch (22.26 %) and
Valsad (19.96 %) districts. The analysis showed
that the forest areas of Valsad, Navsari and
Bharuch districts were highly fragmented and
disturbed too. This may be due to the
developmental activities, high population pressure,
agricultural expansion, and industrial growth
prevailing in these districts. The forests of The
Dangs, Surat and Narmada districts had low
disturbance and consequent low fragmentation.
Location of the Purna wildlife sanctuary (area
16.84 km2) in The Dangs district and
Shoolpaneshwar wildlife sanctuary (607.70 km2) in
Narmada district appear to have significantly
contributed to the protection and conservation of
the forests, thereby indicating low fragmentation
in these districts.
Fig. 7. District-wise fragmentation in south Gujarat.
Fig. 8. District-wise disturbance index in south
Gujarat.
The forest fragmentation and disturbance
problems in the south Gujarat are very similar to
those in other parts of Gujarat as far as they are
related to geology, topography, demography,
climate, forest, and the soil. The local people are
BHATT et al. 287
dependent upon the limited forest resources for
fodder, fuelwood, medicinal plants, timber, etc.
and are responsible for the forest degradation.
Lopping and man-made fires are some other
deleterious activities contributing to forest
degradation (Jhariya et al. 2012). Local
inhabitants clear the ground cover by burning for
collecting the mahuda (Madhuca latifolia) flowers
and fruits, which severely impairs regeneration.
During the rainy season, parts of the forests are
cultivated. This, coupled with the traditional
agricultural practices, causes considerable
disturbance to the forests in tribal district of The
Dangs. Additionally, the area is grazed by the
cattle, sheep, and goats. Since forests belong to the
State Forest Department, local people evince little
or no interest in the protection or conservation
activities. Banning of lopping, reduction in the
grazing pressure by stall-feeding, protection from
fire, and extensive plantations of suitable native
species for fodder and timber - besides installing
vegetative and engineering soil conservation
structures are suggested to overcome the problem.
The study attempted to assess the
fragmentation and disturbance in south Gujarat
and put forward a rapid and user-friendly
methodology. It is expected that the maps and
information so generated will be useful in the
forest conservation planning by the government
and non-government organizations. Although this
study focused on southern Gujarat but the
approach can be applied to any landscape for the
assessment of fragmentation and disturbance
regimes.
Acknowledgements
The study was supported by joint funding from
the Departments of Biotechnology and the Space,
Government of India. Authors gratefully acknow-
ledge the support and encouragement received
from Director, Indian Institute of Remote Sensing,
ISRO, Dehradun, during the course of this study.
The authors are thankful to Dr. M. L. Sharma, Ex-
Principal Chief Conservator of Forest, Govt. of
Gujarat, Forest Department, Gandhinagar for
collaborating in the project Gujarat Government
side. We also thank Chief Conservator of Forest
(Working Plans), Vadodara for coordinating the
field work.
References
Ambasta, S. P. 1986. The Useful Plants of India. Publi-
cation and Information Division, CSIR, New Delhi.
Anonymous. 2006. Working Plan for Rajpipla East and
Rajpipla West Divisions. Vol. II. Research and
Working Plan Division, Rajpipla, District Narmada,
Forest Department, Gujarat, India.
Apan, A. A. 1997. Land cover mapping for tropical forest
rehabilitation planning using remotely-sensed data.
International Journal of Remote Sensing 18:
1029-1049.
Banerjee, A. K. 1995. Rehabilitation of Degraded Forests
in Asia. World Bank Technical Paper No. 270 The
World Bank, Washington DC.
Bhat, D. M., K. S. Murali & N. H. Ravindranath. 2001.
Formation and recovery of secondary forests in
India: a particular reference to Western Ghats in
south India. Journal of Tropical Forest Science 13:
601-620.
Champion, H. G. & S. K. Seth. 1968. A Revised Survey of
Forest Types of India. Government of India
Publications, New Delhi.
FAO. 2006. Global Forest Resources Assessment 2005:
Progress Towards Sustainable Forest Management.
FAO Forestry Paper 147. Food and Agriculture
Organisation, Rome.
Forman, T. T. R. & M. Godron. 1986. Landscape Ecology.
John Wiley and Sons, New York.
IIRS. 2011. Biodiversity Characterization at Landscape
Level in North-West India and Lakshadweep Islands
using Satellite Remote Sensing and Geographic
Information System. Bishen Singh Mahendra Pal
Singh, Dehradun.
Jeganathan, C. & P. Narula. 2006. User Guide for
Spatial Landscape Modelling Developed in ArcMap
using Arc Object and Visual Basic 6.0. Indian
Institute of Remote Sensing, Dehradun.
Jhariya, M. K., S. S. Bargali, S. L. Swamy & B. Kittur.
2012. Vegetational structure, diversity and fuel load
in fire affected areas of Tropical Dry Deciduous
forests in Chhattisgarh. Vegetos 25: 210-224.
Köhl, M. & S. P. S. Kushwaha. 1994. A four-phase
sampling method for assessing standing volume
using Landsat TM data aerial photography and field
measurements. International Forestry Review 73:
35-42.
Kumar, R. & G. Shahabuddin. 2005. Effects of biomass
extraction on vegetation structure diversity and
composition of forests in Sariska Tiger Reserve
India. Environmental Conservation 32: 1-12.
Kumar, S. & M. Mathur. 2014. Impact of invasion by
Prosopis juliflora on plant communities in and
grazing lands. Tropical Ecology 55: 33-46.
Kushwaha, S. P. S. 1990. Forest - type mapping and
change, detection from satellite imagery. ISPRS
Journal of Photogrammetry and Remote Sensing 45:
175-181.
288 ANALYSIS OF FRAGMENTATION AND DISTURBANCE REGIMES
Kushwaha, S. P. S. & P. S. Roy. 2002. Geospatial
technology for wildlife habitat evaluation. Tropical
Ecology 43: 137-150.
Kushwaha, S. P. S., P. Padmanaban, D. Kumar & P. S.
Roy. 2005. Geospatial modeling of biological
richness in Barsey Rhododendron Sanctuary in
Sikkim Himalaya. Geocarto International 20: 63-68.
Lele, S. & G. T. Hegde. 1997. Potential herb layer
production and grazing effects in anthropogenic
savannahs in the moist tropical forests of the
Western Ghats of India. Tropical Grassland 31:
574-587.
Li, H. & J. F. Reynolds. 1994. A simulation experiment
to quantify spatial heterogeneity in categorical map.
Ecology 75: 36-55.
Lillesand, T. M., R. W. Kiefer & J. W. Chipman. 2007.
Remote Sensing and Image Interpretation. 6th edn.
John Wiley and Sons, New York.
Lyon, J. G. 1983. Landsat derived land cover
classification for locating potential kestrel nesting
habitat. Photogrammetry Engineering & Remote
Sensing 42: 245-250.
Madhusudan, M. D. 1999. Recovery of wild large
herbivores following livestock decline in a tropical
Indian wildlife reserve. Journal of Application
Ecology 41: 858-869.
Madhusudan, M. D. 2000. Sacred Cows and the Protected
Forests: A Study of Livestock Presence in Indian
Wildlife Reserves. CERC Technical Report 5. Centre
for Ecological Research and Conservation. Mysore.
Mas, J. 1999. Monitoring land cover changes: a com-
parison of change detection techniques. Inter-
national Journal of Remote Sensing 20: 139-152.
Moloney, K. A. & S. A. Levin. 1996. The effects of
disturbance architecture on landscape-level popu-
lation dynamics. Ecology 77: 375-394.
Nandy, S. & S. P. S. Kushwaha. 2010. Geospatial
modelling of biological richness in Sunderbans.
Journal of the Indian Society of Remote Sensing 38:
431-440.
Nandy, S., S. P. S. Kushwaha & P. Gaur. 2012.
Identification of Swamp deer (Cervus duvauceli
duvauceli Cuvier) potential habitat in Jhilmil Jheel
Conservation Reserve, Uttarakhand, India using
multi-criteria analysis. Environmental Management
49: 902-914.
NRSA. 1983. Forest Cover Monitoring in India Using
Landsat Imagery for the Periods, 1972-75 and 1980-
82. National Remote Sensing Agency, Department
of Space, Govt. of India, Hyderabad.
Pandey, U., S. P. S. Kushwaha, T. S. Kachhwaha,
P. Kunwar & V. K. Dadhwal. 2010. Potential of
Envisat ASAR data for woody biomass assessment.
Tropical Ecology 51: 117-124.
Patel, P. P. 1997. Ecoregions of Gujarat. Gujarat Ecology
Commission, Vadodara, Gujarat, India.
Romme, W. H. 1982. Fire and landscape diversity in
sub-alpine forests of Yellowstone National Park.
Ecological Monographs 52: 199-221.
Roy, P. S. & S. Tomar. 2000. Biodiversity charac-
terization at landscape level using geospatial
modeling technique. Biological Conservation 95:
95-109.
Roy, P. S. & S. A. Ravan. 1996. Biomass estimation
using satellite remote sensing data- an investigation
on possible approaches for natural forest. Journal of
Bioscience 21: 535-561.
Sagar, R., A. S. Raghubanshi & J. S. Singh. 2003. Tree
species composition, dispersion and diversity along
a disturbance gradient in a dry tropical forest region
of India. Forest Ecology and Management 186:
61-71.
Sahani, U. & N. Behera. 2001. Impact of deforestation
on soil physicochemical characteristics, microbial
biomass and microbial activity of tropical soil. Land
Degradation & Development 12: 93-105.
Shahabuddin, G. & S. Prasad. 2004. Assessing ecological
sustainability of non-timber forest produces
extraction: the Indian scenario. Conservation &
Society 2: 235-250.
Singh, A. & S. P. S. Kushwaha. 2011. Refining logistic
regression models for wildlife habitat suitability
modeling - a case study with muntjak and goral in
the Central Himalayas, India. Ecological Modelling
222: 1354-1366.
Singh, S. P. 1998. Chronic disturbance, a principal cause
of environmental degradation in developing
countries. Environmental Conservation 25: 1-2.
Tilman, D. & C. Lehman. 2001. Human-caused environ-
mental change: impacts on plant diversity and
evolution. Proceedings of the National Academy of
Sciences of the United States of America 98:
5433-5440.
Uma Shankar, K. S. Murali, R. Uma Shaanker, K. N.
Ganeshaiah & K. S. Bawa. 1998. Extraction of non-
timber forest products in the forests of Biligiri
Rangan Hills India. 4. Impact on floristic diversity
and population structure in a thorn scrub forest.
Economic Botany 52: 302-315.
White, P. S. & S. T. A. Pickett. 1985. Natural
disturbance and patch dynamics: an introduction.
pp. 3-13. In: J. A. Pickett & P. S. White (eds.) The
Ecological of Natural Disturbance and Patch
Dynamics. Academic Press, New York.
(Received on 05.10.2012 and accepted after revisions, on 02.11.2013)