analysis of expression patterns: the scope of the problem
TRANSCRIPT

59
Analysis of expression patterns: The scope ofthe problem, the problem of scope
Yidong Chena, Zohar Yakhinib, Amir Ben-Dorb,Edward Doughertyc, Jeffrey M. Trenta andMichael Bittnera,∗aCancer Genetics Branch, National Human GenomeResearch Institute, NIH, Bethesda, MD 20892, USAbChemical and Biological Systems Department,Agilent Laboratories, Palo Alto, CA 94304, USAcDepartment of Electrical Engineering, Texas A & MUniversity, College Station, TX 77843, USA
Studies of the expression patterns of many genes simulta-neously lead to the observation that even in closely relatedpathologies, there are numerous genes that are differentiallyexpressed in consistent patterns correlated to each sampletype. The early uses of the enabling technology, microarrays,was focused on gathering mechanistic biological insights.The early findings now pose another clear challenge, findingways to effectively use this kind of information to developdiagnostics.
1. Introduction
The profiling of transcription patterns is a centraland long-standing tool in molecular biology. Recently,it has become possible to gather this kind of data formany genes simultaneously, allowing a wider view ofthe transcriptional activity of a particular cell type ortissue [1,2]. The fundamental assumption concerningthe utility of such transcript abundance profiles is thattranscription profiles convey information about the pro-cesses operating in a cell of a given type or state. Theview obtained is limited to those parts of operationsdirectly influencing the transcriptional activity of thecell. Still, it is obvious that even a clear and completelisting of the variances in transcription between the op-
∗Address for correspondence: Michael Bittner, NHGRI/NIH,Building 49, Room 4A52, 9000 Rockville Pike, Bethesda, MD20850, USA. Tel.: +1 301 496 7980; Fax: +1 301 402 3241; E-mail:[email protected].
erations of a healthy cell and those of a diseased cellof the same type would provide useful information. Ata minimum, those differences that are most extremecould provide useful markers to differentiate the dis-eased cells from the healthy ones in routine diagnos-tic testing. In some cases, this information could con-ceivably be much more useful. In the field of oncol-ogy, our particular area of interest, the variances mightpoint to some difference that could be exploited to killor terminally differentiate the cancerous cells throughsome form of treatment. These tantalizing possibilitieshave led many researchers to pursue the development ofmethods for gathering and analyzing expression data.
The experiences gained through these early effortshave begun to outline useful approaches to the collect-ing and analyzing expression profile data and to identifythe most serious obstacles to realizing the desired ben-efits. This review will summarize some of the strengthsof data viewing and analysis approaches used to date,and sketch some of the approaches and limitations tothe development of more powerful forms of analysis.
2. Methods of analysis
2.1. Clustering/correlation
As might be expected, the first attempts to harness theinformation provided in profiles centered on the mostreadily detected forms of relationships in these kindsof observations, simple correlation of similarities [3].The typical way to view similarities is to perform aclustering operation. This type of comparison is meantas a very preliminary way to look at data, a way ofdiscovering trends. The methods do not offer any esti-mate of the way in which the variance arising from thesystem biology or the measurement procedure will af-fect the reproducibility of the resulting groupings. Ad-ditionally, the similarity measurement steps used fre-quently incorporate averaging and normalization stepsthat make it impossible to compare the resulting setsof similarity measurements in a quantitative fashion.
Disease Markers 17 (2001) 59–65ISSN 0278-0240 / $8.00 2001, IOS Press. All rights reserved

60 Y. Chen et al. / Analysis of expression patterns: The scope of the problem, the problem of scope
In spite of these drawbacks, the use of correlation andclustering has a rich history in mathematics and engi-neering, and a large and growing number of the extantapproaches to clustering data are being examined in thecontext of expression profile analysis. They provide avery quick way to see the most evident relationships,and when supplemented with other forms of analysisor connections to prior knowledge can help identifydifferences in expression worth further consideration.
2.2. Gene by gene correlation
At the start of efforts to gather transcription profiles,there were two simple expectations for clustering re-sults, both based on historical knowledge of transcrip-tional regulation. The first was that genes respondingto a given type of signal, such as a fundamental changein metabolism, would be identifiable in data from asample series that spanned such a transition, due to thesimilarity of their transcriptional response to the signal.This was quickly demonstrated in yeast undergoing adiauxic shift [4]. Many subsequent experiments in avariety of systems have demonstrated that correlatingsimilarities of response can be a very powerful way ofgrouping genes involved in processes such as serumresponse [5], or cell cycling [6,7]. Very complex datasets containing mixtures of developmental time-courseand mutant analysis series have been shown to allowclustering along functional lines [8].
A further power of this form of correlation is itspower to group genes whose expression is driven bythe same kinds of cis-regulatory sites. Demonstrationsof the clustering of genes sharing known or new cis-regulatory sites have been presented in several studiesof transcription dynamics associated with the yeast cellcycle [6,9]. While these results provide a demonstra-tion of the competence of clustering to disclose explicitco-regulation, both these studies, and one examiningtranscription during meiosis [10] suggest cautious ex-pectations for the extent of utility of clustering in dis-closing cis-regulatory sharing. Even in yeast, it ap-pears to be difficult to identify a large fraction of themotifs that must be in place. Clustering paired withpromoter sequence searching is most useful for thoseelements that have the least ambiguity and the greatestlength. This signal to noise constraint makes the clusterand search strategy likely to be most useful in identi-fying genes sharing already discovered cis-regulatoryelements in multi-cellular organisms. This is due totheir large genome size, their typically short and vari-able cis-regulatory sequences and their highly combi-
natorial use of these regulators (extensively reviewedby Davidson in [11]).
The results of a number of systematic informaticsefforts can also be expected to enhance the kinds ofinsight that correlation can provide. Various efforts toassociate the currently available knowledge of genes’functions and relationships with other genes are underdevelopment. One approach that has already reacheda fairly high level of sophistication is the productionof gene ontologies [12]. This is a large, collaborativeeffort that seeks to provide curated information aboutthe biological role of genes in many different organ-isms using a unitary set of classifiers (controlled vo-cabulary). As the human gene ontology becomes morecomplete, it can be used to provide a summary viewof the various biological activities represented in a par-ticular cluster. Known genes in other species couldsupplement this process by suggesting that a humanEST of unknown function that is related by sequence tothe known gene may have a function that makes sensein the context of the cluster in which it falls. Simi-lar aid in deciphering function may become availablefrom a less supervised, indexing approach to evaluatinggene functions. One example of this type of approachis the High-density Array Pattern Interpreter program(http://array.ucsd.edu/tools.htm). This program usescontrolled terminology hierarchies, based on the Na-tional Library of Medicine’s Medical Subject Head-ings, to delineate how genes have been described in thepublished literature. In general, any further character-ization that can be associated with a gene is likely toimprove the odds of estimating whether a gene witha biologically interesting expression pattern should befurther studied as a candidate marker or target.
2.3. Sample by sample correlation
The second a priori expectation for expression pat-terns was that it would be possible to discern differingtypes of healthy and pathological cells by consideringthe overall profile of similarities and differences acrossmany genes. There have been many demonstrations ofthe use of overall transcription similarity measures togroup samples into their previously known classes [13–15]. There have also been demonstrations of the prac-ticality of using this strategy to discover classes withinsamples that could not be subdivided in this fashionby conventional measurements [16–18]. Surveying theuses of this strategy, it has become apparent that thereare both differing biological bases driving the separa-
Y. Chen et al. / Analysis of expression patterns: The scope of the problem, the problem of scope 61
tions and a wide spectrum in the number of genes thatstrongly contribute to the separation.
One clear component of the separation between celltypes, a “tissue of origin” component arises from theparticular differentiation state of the cells being stud-ied. It is easy to imagine that vastly different cell types,such as muscle versus neuron, would show consider-able differences in their expression of specialized geneproducts and be readily classified based on those differ-ences. It was less easy to predict that even lymphomasarising from close relatives in the B-cell lineage havea large number of transcriptional differences that canbe easily exploited for classification [16]. Some otherways in which surprising degrees of variation have beenseen are evident in a study of tumor material from breastcancer [17]. A very clear finding of this study was thedistinctiveness of individual tumors. Primary tumorsand their metastases were found to have the highestdegree of similarity in this study, which encompasseda variety of breast tumor types. That a tumor growingat a distant site and time than its primary is much moresimilar to its primary than to another metastasis aris-ing from the same type of tissue implies that there isa large “space” of transcriptional settings available toa developing tumor. It also implies that the “position”the tumor occupies in that space is well separated fromthat chosen by other tumors of similar origin.
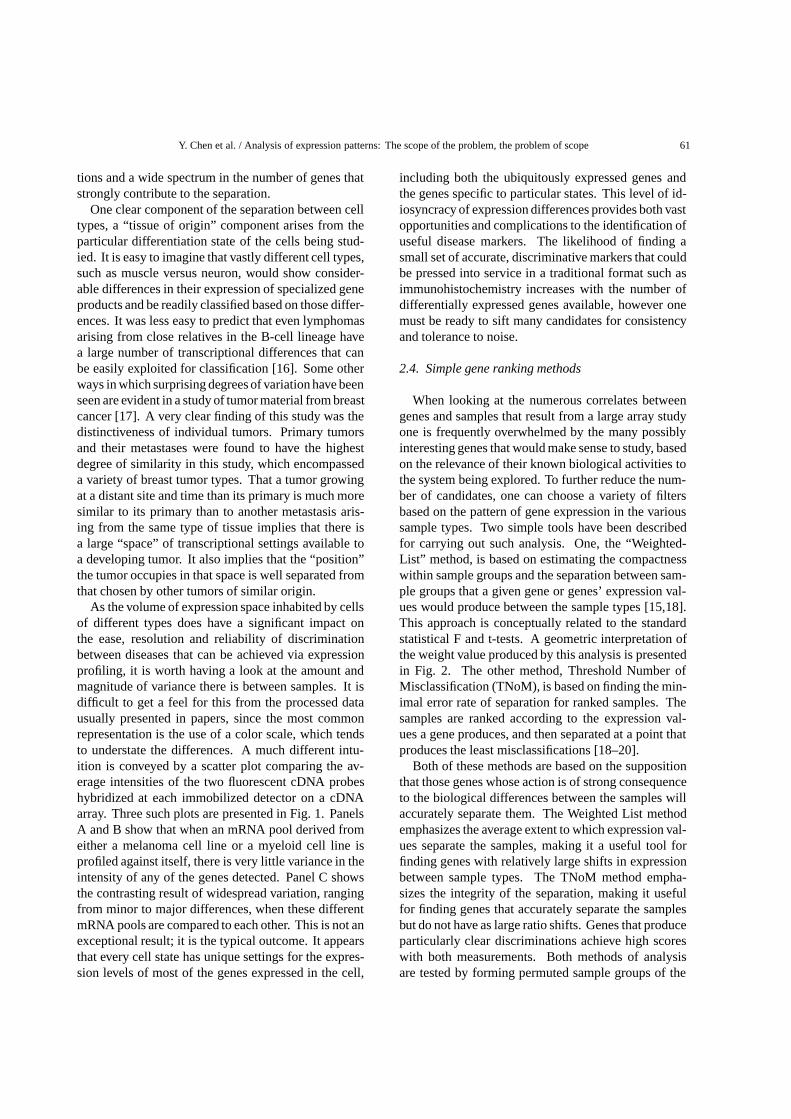
As the volume of expression space inhabited by cellsof different types does have a significant impact onthe ease, resolution and reliability of discriminationbetween diseases that can be achieved via expressionprofiling, it is worth having a look at the amount andmagnitude of variance there is between samples. It isdifficult to get a feel for this from the processed datausually presented in papers, since the most commonrepresentation is the use of a color scale, which tendsto understate the differences. A much different intu-ition is conveyed by a scatter plot comparing the av-erage intensities of the two fluorescent cDNA probeshybridized at each immobilized detector on a cDNAarray. Three such plots are presented in Fig. 1. PanelsA and B show that when an mRNA pool derived fromeither a melanoma cell line or a myeloid cell line isprofiled against itself, there is very little variance in theintensity of any of the genes detected. Panel C showsthe contrasting result of widespread variation, rangingfrom minor to major differences, when these differentmRNA pools are compared to each other. This is not anexceptional result; it is the typical outcome. It appearsthat every cell state has unique settings for the expres-sion levels of most of the genes expressed in the cell,
including both the ubiquitously expressed genes andthe genes specific to particular states. This level of id-iosyncracy of expression differences provides both vastopportunities and complications to the identification ofuseful disease markers. The likelihood of finding asmall set of accurate, discriminative markers that couldbe pressed into service in a traditional format such asimmunohistochemistry increases with the number ofdifferentially expressed genes available, however onemust be ready to sift many candidates for consistencyand tolerance to noise.
2.4. Simple gene ranking methods
When looking at the numerous correlates betweengenes and samples that result from a large array studyone is frequently overwhelmed by the many possiblyinteresting genes that would make sense to study, basedon the relevance of their known biological activities tothe system being explored. To further reduce the num-ber of candidates, one can choose a variety of filtersbased on the pattern of gene expression in the varioussample types. Two simple tools have been describedfor carrying out such analysis. One, the “Weighted-List” method, is based on estimating the compactnesswithin sample groups and the separation between sam-ple groups that a given gene or genes’ expression val-ues would produce between the sample types [15,18].This approach is conceptually related to the standardstatistical F and t-tests. A geometric interpretation ofthe weight value produced by this analysis is presentedin Fig. 2. The other method, Threshold Number ofMisclassification (TNoM), is based on finding the min-imal error rate of separation for ranked samples. Thesamples are ranked according to the expression val-ues a gene produces, and then separated at a point thatproduces the least misclassifications [18–20].
Both of these methods are based on the suppositionthat those genes whose action is of strong consequenceto the biological differences between the samples willaccurately separate them. The Weighted List methodemphasizes the average extent to which expression val-ues separate the samples, making it a useful tool forfinding genes with relatively large shifts in expressionbetween sample types. The TNoM method empha-sizes the integrity of the separation, making it usefulfor finding genes that accurately separate the samplesbut do not have as large ratio shifts. Genes that produceparticularly clear discriminations achieve high scoreswith both measurements. Both methods of analysisare tested by forming permuted sample groups of the

62 Y. Chen et al. / Analysis of expression patterns: The scope of the problem, the problem of scope
Fig. 1. Scatter-plots of average channel intensity per gene. The average red (y-axis) and green (x-axis) intensities at each immobilized genedetector element on an array of approximately 7000 genes is plotted. A) RNA from cell line ML1 used for both channels. B) RNA from cell lineUACC903 used for both channels. C) RNA from UACC 903 used for red channel, RNA from cell line ML1 used for green channel. (From [22]).
same size as the authentic sample sets, but with ran-domized membership. Running and scoring a thousandsuch permuted sets provides an empirical estimate ofthe highest expected weight or TNoM value in a ran-dom collection of biological samples, providing a use-ful estimate of the lower limit on values that are sig-nificant. Figure 3 is a diagram showing this kind ofanalysis applied to a fairly homogeneous subset of 19melanomas versus 12 melanomas having much greaterdiversity in their expression profiles [17]. The blackline depicts the actual number of genes able to sepa-rate the samples with the indicated level of accuracy(on the x-axis). The gray line depicts the expectednumber of such separating genes when 19 samples arechosen uniformly at random and designated as a class.The error bars indicate the 95% confidence intervalfor these numbers, under the same stochastic model.The difference between the authentic sample curve andthe permuted sample/theoretical curve shows that thereare many genes whose expression pattern aligns withthe sample sets in a very non-random way. A simi-lar differential is seen with the Weighted List results.Sharp overabundance of informative or highly separat-ing genes is also observed in other studies such as [14–16].
Other approaches to finding highly discriminativegenes include ones where methods similar or identi-cal to those used in formal statistical sample classi-fication are explored. Examples include studies ofdifferences in gene expression between acute myeloidleukemia (AML) and acute lymphoblastic leukemia(ALL) [14], and between breast tumors arising in pa-tients with or without the breast cancer predisposing
mutations BRCA1 or BRCA2. The methods utilizedin these studies explored the results of allowing largernumbers of genes to participate to varying extents in adecision about what class a given sample was in. Suchstudies provide another way of probing the robustnessof the differentiation in expression patterns. An esti-mate of the consistency and robustness of the differ-entiation is achieved by serially building the decisionfunction using all of the samples save one, for all ofthe N-1 sample sets, a process known as leave-one-out-cross-validation. The results may be further queriedto determine whether a significant fraction of identicaldeciding genes are employed in all sets and whetherthe classification is approximately equally accurate inall cases. Forming permuted sample groups with ran-domized membership and reconstituting and re-scoringa classifier, as above, allows estimation of the signifi-cance of the achieved classification.
These and many other approaches to finding dis-criminating genes for further study in mechanistic ordiagnostic settings are in the early phases of develop-ment. A more refined sense of their practical utilitywill emerge as experimental determination of the im-portance of the high scoring genes to the phenotypicdifferences between the sample sets is carried out.
2.5. Classification
The ability to employ microarray methodology tocarry out formal diagnostic classification of tissue isa reasonable long-term goal, given the demonstratedability of the method to discern differences in the pat-terns of gene expression between normal and healthy

Y. Chen et al. / Analysis of expression patterns: The scope of the problem, the problem of scope 63
Fig. 2. Weighted Discriminator Method. Assuming K categories (or clusters) for a set of samples, a discriminative weight for each gene canbe evaluated by w = Average(BD) / (Average(WD) + a) where Average(BD) is the average of the between cluster Euclidean distance for allpairs of clusters (total of (K*K-1)/2 pairs), and Average(WD) is the weighted average of the within-cluster distance (weighted by the number ofsamples in the cluster). The within-cluster distance is the average distance of all pairs of samples in the cluster. a is a small constant to preventzero denominator case. (See http://www.nhgri.nih.gov/DIR/Microarray/discriminative.html).
tissue, and between differing types of diseased tissue.At the present there appear to be two main obstacles tomaking profiling a sufficiently practical form of diag-nostic to find wide use. The first difficulty is an ana-lytical one. How can very good candidate diagnosticpanels be rapidly developed from profile data? Theideal panel would be one that used a very small numberof genes, each of which provided at least some uniqueinformation (i.e. information that was not equivalentto the contribution of the other genes) and which wasrelatively insensitive to the levels of biological varianceand measurement noise routinely encountered.
The problems associated with finding small classi-fier gene sets that meet robustness and uniqueness cri-teria, using expression-profiling data, have been con-cisely reviewed by Dougherty [21]. The general ba-sis of the problem is that expression studies tend to be
carried out as surveys aimed at developing insight intothe biological mechanics of pathology. In studies ofhuman tissue the goal has been to sample the broad-est number of genes possible with the limited numberof tissue samples and microarrays available. A con-sequence of this strategy has been that in most cases,there are neither sufficient numbers of samples nor suf-ficient numbers of replications of data sets to get goodestimates of the error rates over the general populationof the various genes in classification. Given small sam-ple sets and large numbers of genes being sampled, itbecomes possible to identify many small sets of genesfor which the estimated error of classification is zero.In many cases, this estimate will not be markedly im-proved by small-sample-numbervalidation procedures,such as leave-one-out cross-validation. As was men-tioned in the Gene Ranking section above, there are

64 Y. Chen et al. / Analysis of expression patterns: The scope of the problem, the problem of scope
Fig. 3. Threshold Number of Misclassifications data from melanoma study [18]. The black line shows the number of genes in the original data setcapable of producing the given number of misclassifications. The gray line is the result if the samples in the sets containing 19 and 12 membersare permuted. Error bars show the calculated 95% confidence interval for the same size data set if gene expression behavior is independent andrandom relative to the samples.
many genes whose differences in expression pattern arealigned with differences in sample type in a very simpleway, being more highly expressed in one sample typethan the other. This produces a considerable overlapof the information content in relation to sample typein these sets of genes with the attendant problem thatcombining these genes in a classifier can easily lead todecreased performance via increased noise. An urgentneed is therefore some readily computable analysis ofthe data that will help identify the most noise-resistantand least redundant classifier gene sets.
In addition to the problems of designing a classifierand choosing the genes that will provide the highestaccuracy in the classifier, there are pragmatic problemsthat further complicate the use of expression profilingas a diagnostic. The primary analyte in the technique ismRNA, which is much less stable than DNA or protein,placing considerable constraints on sample collection.The methods of converting the mRNA into a species
that can be detected and scored is very sensitive to theintegrity of the mRNA and to contaminants that co-purify with the mRNA during sample preparation. Thetechnique, as now practiced, requires significantly morecells than many diagnostics, and could be confoundedby the presence or variable content of cells other thandisease cells in the sample. Were the technology to beused in diagnosis, its focus would need to be shiftedfrom breadth of examination toward precision. Thestarting point for practical diagnosis would be a small,specialized set of genes, not as many genes as possi-ble, with sufficient replicates of this set to provide therequired degree of measurement precision.
3. Conclusion
Expression profiles can be seen to provide a richsource of data on the differential expression of genes

Y. Chen et al. / Analysis of expression patterns: The scope of the problem, the problem of scope 65
between cell states. Early results have demonstratedthat it is possible to find many genes that exhibit state-dependent patterns of expression, even between closelyrelated pathologies. The expression studies carried outto date have been of sufficiently limited scope to pro-vide the large amounts of data needed for confidentdesign of classifiers based on expression data, how-ever even with limited data the trends are encouraging.Technologic improvements will continue to increasethe precision and reproducibility of measurement thatcan be achieved. Larger studies designed to support thedevelopment of disease markers will no doubt be un-dertaken. In the shorter term, a good analytic methodfor identifying robust candidate classifier gene panelsbased on smaller sample number could be developed.With such a tool, it may be possible to use limitedinformation to construct immunohistochemical assays,usable within the sphere of current diagnostic practice.
References
[1] M. Schena, D. Shalon, R.W. Davis and P.O. Brown, Quan-titative monitoring of gene expression patterns with a com-plementary DNA microarray, Science 270(5235) (1995), 467–470.
[2] D.J. Lockhart, H. Dong AND M.C. Byrne et al., Expressionmonitoring by hybridization to high-density oligonucleotidearrays, Nat Biotechnol 14(13) (1996), 1675–1680.
[3] M.B. Eisen, P.T. Spellman, P.O. Brown and D. Botstein, Clus-ter analysis and display of genome-wide expression patterns,Proc Natl Acad Sci USA 95(25) (1998), 14863–14868.
[4] J.L. DeRisi, V.R. Iyer and P.O. Brown, Exploring the metabolicand genetic control of gene expression on a genomic scale,Science 278(5338) (1997), 680–686.
[5] V.R. Iyer, M.B. Eisen and D.T. Ross et al., The transcriptionalprogram in the response of human fibroblasts to serum, Science283(5398) (1999), 83–87.
[6] P.T. Spellman, G. Sherlock and M.Q. Zhang et al., Compre-hensive identification of cell cycle-regulated genes of the yeastSaccharomyces cerevisiae by microarray hybridization, Mol
Biol Cell 9(12) (1998), 3273–3297.[7] P. Tamayo, D. Slonim and J. Mesirov et al., Interpreting pat-
terns of gene expression with self-organizing maps: methodsand application to hematopoietic differentiation, Proc NatlAcad Sci USA 96(6) (1999), 2907–2912.
[8] A. Ben-Dor, R. Shamir and Z. Yakhini, Clustering gene ex-pression patterns, J Comput Biol 6(3–4) (1999), 281–297.
[9] S. Tavazoie, J.D. Hughes, M.J. Campbell, R.J. Cho and G.M.Church, Systematic determination of genetic network archi-tecture, Nat Genet 22(3) (1999), 281–285.
[10] M. Primig, R.M. Williams and E.A. Winzeler et al., The coremeiotic transcriptome in budding yeasts, Nat Genet 26(4)(2000), 415–423.
[11] E.H. Davidson, Genomic Regulatory Systems in Developmentand Evolution, Academic Press, London, 2001.
[12] M. Ashburner, C.A. Ball and J.A. Blake et al., Gene ontol-ogy: tool for the unification of biology. The Gene OntologyConsortium, Nat Genet 25(1) (2000), 25–29.
[13] J. Khan, R. Simon and M. Bittner et al., Gene expression pro-filing of alveolar rhabdomyosarcoma with cDNA microarrays,Cancer Res 58(22) (1998), 5009–5013.
[14] T.R. Golub, D.K. Slonim and P. Tamayo et al., Molecularclassification of cancer: class discovery and class predictionby gene expression monitoring, Science 286(5439) (1999),531–537.
[15] I. Hedenfalk, D. Duggan and Y. Chen et al., Gene-expressionprofiles in hereditary breast cancer, N Engl J Med 344(8)(2001), 539–548.
[16] A.A. Alizadeh, M.B. Eisen and R.E. Davis et al., Distinct typesof diffuse large B-cell lymphoma identified by gene expressionprofiling, Nature 403(6769) (2000), 503–511.
[17] C.M. Perou, T. Sorlie and M.B. Eisen et al., Molecular portraitsof human breast tumours, Nature 406(6797) (2000), 747–752.
[18] M. Bittner, P. Meltzer and Y. Chen et al., Molecular classifi-cation of cutaneous malignant melanoma by gene expressionprofiling, Nature 406(6795) (2000), 536–540.
[19] A. Ben-Dor, L. Bruhn and N. Friedman et al., Tissue classi-fication with gene expression profiles, J Comput Biol 7(3–4)(2000), 559–583.
[20] A. Ben-Dor, N. Friedman and Z. Yakhini, Scoring genes forrelevance, Palo Alto, Agilent Technologies, 1999.
[21] E.R. Dougherty, Small sample issues for microarray-basedclassification, Comp Funct Genom 2 (2001), 28–34.
[22] Y. Jiang, J. Lueders, A. Glatfelter, C. Gooden and M. Bittner,in: Profiling human gene expression with cDNA microarrays.Current Protocols in Human Genetics, N. Dracopoli, ed., JohnWiley & Sons, New York, 2000.

Submit your manuscripts athttp://www.hindawi.com
Stem CellsInternational
Hindawi Publishing Corporationhttp://www.hindawi.com Volume 2014
Hindawi Publishing Corporationhttp://www.hindawi.com Volume 2014
MEDIATORSINFLAMMATION
of
Hindawi Publishing Corporationhttp://www.hindawi.com Volume 2014
Behavioural Neurology
EndocrinologyInternational Journal of
Hindawi Publishing Corporationhttp://www.hindawi.com Volume 2014
Hindawi Publishing Corporationhttp://www.hindawi.com Volume 2014
Disease Markers
Hindawi Publishing Corporationhttp://www.hindawi.com Volume 2014
BioMed Research International
OncologyJournal of
Hindawi Publishing Corporationhttp://www.hindawi.com Volume 2014
Hindawi Publishing Corporationhttp://www.hindawi.com Volume 2014
Oxidative Medicine and Cellular Longevity
Hindawi Publishing Corporationhttp://www.hindawi.com Volume 2014
PPAR Research
The Scientific World JournalHindawi Publishing Corporation http://www.hindawi.com Volume 2014
Immunology ResearchHindawi Publishing Corporationhttp://www.hindawi.com Volume 2014
Journal of
ObesityJournal of
Hindawi Publishing Corporationhttp://www.hindawi.com Volume 2014
Hindawi Publishing Corporationhttp://www.hindawi.com Volume 2014
Computational and Mathematical Methods in Medicine
OphthalmologyJournal of
Hindawi Publishing Corporationhttp://www.hindawi.com Volume 2014
Diabetes ResearchJournal of
Hindawi Publishing Corporationhttp://www.hindawi.com Volume 2014
Hindawi Publishing Corporationhttp://www.hindawi.com Volume 2014
Research and TreatmentAIDS
Hindawi Publishing Corporationhttp://www.hindawi.com Volume 2014
Gastroenterology Research and Practice
Hindawi Publishing Corporationhttp://www.hindawi.com Volume 2014
Parkinson’s Disease
Evidence-Based Complementary and Alternative Medicine
Volume 2014Hindawi Publishing Corporationhttp://www.hindawi.com