analysis of exchange rate-foreign trade relationship with...
TRANSCRIPT

International Journal of Academic Research in Business and Social Sciences 2017, Vol. 7, No. 10
ISSN: 2222-6990
157 www.hrmars.com
Analysis of Exchange Rate-Foreign Trade Relationship with Asymmetric Causality Tests: Sample of Gaziantep
İbrahim ÇÜTCÜ Asist. Prof., Department of Economics, Hasan Kalyoncu University, Gaziantep, Turkey
Email: [email protected]
Mehmet Vahit EREN
Asist. Prof., Department of Economics, Kilis 7 Aralık University, Kilis, Turkey Email: [email protected]
DOI: 10.6007/IJARBSS/v7-i10/3368 URL: http://dx.doi.org/10.6007/IJARBSS/v7-i10/3368
Abstract Aim of this study is that testing the existence of exchange rate-foreign trade relationship. Also, it aims to analyze direction of the relationship via different economic tests by using two models which include monthly data of 2002:01-2016:02 periods. According to Hatemi-J co-integration and asymmetric causality test findings, it is accepted that there is causality and long termed relationship with structural break between exchange rate and importation. Also, with the aim of determining the existence of causality relationship, advanced time varying asymmetric causality test is used. Periodical relations are found. Keywords: Exportation, Exchange Rate, Asymmetric Causality, Importation, Gaziantep. INTRODUCTION Globalization fact has a great important place in world markets especially after 1980s. Firms and countries try to find methods which allow them to use their resources at optimum level to be able to get ahead of their competitors in global competition. Foreign trade which includes importation and exportation activities is an important factor, also. Becoming an important country in terms of foreign trade creates a positive effect not only in world market but also in domestic market for so many microeconomic indicators. Foreign trade serves so many macroeconomic aims such as assuring economic stability, protection from foreign competition, removing payment difficulties, solving market failures, bring-in to public treasury and benefit from monopoly power in foreign market. It also can be used for objectives of foreign policy especially for social and political reasons in foreign markets. There are so many factors with wide execution area which effect foreign trade activities. While these factors can be originated from domestic market such as inflation, interest rates, public supports, it can also be originated from foreign-based such as exchange rate, tariffs and foreign demand. Among these factors, especially exchange rate is a factor originated from both domestic and foreign market. It is also an important cost element in global competition. Especially, stabilization in exchange rate in countries like Turkey, the one with high external

International Journal of Academic Research in Business and Social Sciences 2017, Vol. 7, No. 10
ISSN: 2222-6990
158 www.hrmars.com
debt and most of its export is based on raw material and semi-manufactured products, is a very effective factor for expenditure, pricing and competition. Exchange rate policy of a country affects its macro-economic goals. While increase in exchange rate react positively by exporters because it raises sales revenue in national currency, for import suppliers negative reactions are seen because cost of the products which are brought in foreign currency from abroad rises with the increase in currency. Despite this known general theory, effects of exchange rates on foreign trade balance could not be understood totally in a short and long term. This situation is becoming more uncertain especially in the underdeveloped and developing countries which don’t have developed capital market and without sufficient capital movements. In this study, relationship between exchange rate and foreign trade is examined via sample of Gaziantep. Gaziantep which is the biggest city of Southeastern Anatolia Region in terms of population and development is also one of the biggest cities of Turkey in terms of population, development, exportation, taxation and employment. According to results of 2015 Address-based Population Registration System prepared by Turkish Statistical Institute, population of Gaziantep is 1.931.836 people. Approximately %89, 18 of the population is urban population and %10, 82 of it is rural population. In 2015, Gaziantep allowed 46.438 immigrants and 44.438 people migrate from the city. Net migration speed of the city is 1,07 (TUIK, 2016). Gaziantep which is above the average of Turkey in terms of development is an important industrial city. The reason behind the selection of Gaziantep is intensity of its socio-economic factors. Gaziantep is the 8th biggest city of Turkey with its approximately 2 million populations. There are 1.270 active exporter firms and they export their products to 172 countries. Despite market shrinkage recently, Gaziantep has exchange rate above Turkey’s average. The city implements %5 of total exportation of Turkey and it is the 6th biggest exportation city. Moreover it is seen as the gate of Middle East markets. Data about this city which is the biggest and the most developed city of Southeastern Region of Anatolia is analyzed in this study. Gaziantep that is the leader in production of machine-made carpet, pistachio, plastic bag and yarn is 6. in exportation ranking. Also, it has 57 firms in ISO (Istanbul Chamber of Industry) 1000 (GTO, 2016). Despite some problems such as country-wide decrease in exportation rate and increase in foreign trade deficit, as seen in Table 1, Gaziantep has positive results in trade and on the contrary of Turkey’s economy, it has foreign trade surplus.
Table 1. Foreign Trade Data of Gaziantep Province (TUIK, 2016)
Date Export (X) Import (M) External Balance (X-M)
2010 3.518 3.430 88
2011 4.759 4.723 36
2012 5.579 5.053 526
2013 6.515 5.608 907
2014 6.658 5.808 850
2015 6.322 4.877 1.445

International Journal of Academic Research in Business and Social Sciences 2017, Vol. 7, No. 10
ISSN: 2222-6990
159 www.hrmars.com
In spite of problems in frontier trade with neighboring countries such as Syria and Iraq, export volume is always on the rise in Gaziantep. This study uses monthly data between 2002:01-2016:02 periods. It tests exchange rates and foreign trade relationship with co-integration and causality tests. In this context, it is interpreted with results which are obtained by using Hatemi-J co-integration and asymmetric causality tests with structural break, asymmetric causality test that changes in time and suggestion policies. The main distinctive feature of this study is micro-size area and it is tried to be guessed with different causality tests. LITERATURE REVIEW When the relationship between exchange rate and foreign trade is analyzed in earlier studies in literature, it is seen that there is no consensus about the direction of interaction. Reasons for this situation are socio-economic structure of countries included in sample, differences in foreign trade policies and different economic analysis can affect results. Also, it is seen that in the large part of the studies, J Curve is tested with Marshal-Lerner condition. In the study of Brada and Mendez (1988) in which they analyze the relationship between fluctuation and foreign trade, they found a relationship with positive direction between two variables by using horizontal section analyses. Sukar (1998) has analyzed USA exportation and exchange rate-extraneous income relationship by using co-integration tests and error correction models. He concluded that there is direct relationship between exportation and extraneous income while there is inverse relationship between exportation and exchange rate. Bahmani-Oskooee and Niroomand (1998) search the validity of Marshall-Lerner condition with EKK and Johansen Co-Integration methods. In the study, 30 countries which include developed countries are analyzed by using 1960-1992 period data. It is concluded that Marshal-Lerner condition realized in long term and devaluation affects trade balance in a positive way. In the study of Arize (1995) in which he analyzed effect of the exchange rate on USA exportation over reel export, reel extraneous income and exchange rate; three variable model with error recovery model, he concluded that increase in exchange rate is an obstructor for trade. Koch and Rosensweigh (1992) searched the effect of changes in dollar on USA foreign trade rate by using co-integration test. They found that dollar does not have as powerful effect on trade as it is expected. Kulkarni (1996) searched Marshal-Lerner condition with J Curve Hypothesis for Egypt and Ghana. He concluded that effect of devaluation on foreign trade balance is in compliance with its assumptions. Zhang (1996), Chinn and Lee (2002) for the analyses of China used co-integration analyses- Granger causality and assumptions of VAR. However, they could not reach J Curve supportive results. When the studies about relationship between exchange rate- foreign trade balance of Turkey are analyzed, some results are seen. In the study of Alptekin (2009) which he used reel exchange rate, foreign trade volume and current accounts deficit variables with VAR model, he concluded that there is no relationship among variables. Also, he decided that any change in reel exchange rate does not affect foreign trade volume. Zengin and Terzi (1995) tested the relationship among exchange rate, importation, exportation, foreign trade balance by using Engle-Granger co-integration test in different terms. They found that there is no relationship among the variable neither in a short nor long term. Study of

International Journal of Academic Research in Business and Social Sciences 2017, Vol. 7, No. 10
ISSN: 2222-6990
160 www.hrmars.com
Karagöz and Doğan (2005) includes 1995-2004 period by using time series methodology. They founded that there is no relationship between exchange rate and importation, exportation variables but they concluded that 2001 devaluation has meaningful effect on exchange rate. In the VAR analyses of Sivri and Usta (2001) which is conducted on stable series among the reel exchange rate and export series, they could not find any causality from exchange rate to importation or exportation. Ay and Özşahin (2007) analyzed the effect of changes in reel exchange rate on foreign trade balance with the data of 1995-2007 periods. According to findings, they indicated that one of the most important explanatory variables of exportation and importation indices is reel exchange rate. In the study of Yamak and Korkmaz (2005) validity of Marshall-Lerner condition is analyzed with VAR model. In the analysis reel exchange rate and foreign trade balance are used and they reached that Marshal-Lerner condition has been observed except the 2011 crisis period. In the study of Vergil and Erdoğan (2009), it is concluded that by using quartiles after ARDL co-integration tests predictions, Marshall-Lerner condition has been provided. Also, according to predictions derived by using Almon polynomial model, they concluded that J Curve is valid for Turkey. When studies conducted on this issue are analyzed, it is seen that Marshall-Lerner condition is valid. In terms of empirical evaluation, using new econometric methods such as unit root with structural break and co-integration tests for the aim of this study makes different it from former studies. ECONOMETRIC ANALYSIS In this part of the study, data set, econometric model, methodology and result of the analysis is going to be introduced. Data Set and Econometric Model In this study, monthly data of Gaziantep, 2002:01-2016:02 periods are involved in analysis. While importation and exportation data is obtained from the database of TUIK (Turkish Statistical Institute), exchange rate data is obtained from TCMB (Central Bank of the Turkish Republic) EVDS (Electronic Data Transfer System) database. Within the scope of this study, two model forecast are predicted. As dependent variable exportation (X) in first model, importation (M) in second model is used. As independent variable, exchange rate (EXC) is used. Relevant importation and exportation series logarithm are taken and by adjusting seasonally, models are established. Relevant established models;
(1)
(2)
Methodology Time series can be stable in different periods around different deterministic trends. These differences can be originated from structural breaks which occur in constant term or slope. Battle, natural disaster, peace, policy changes, terrorist incidents and economic crisis can be reason for relevant breaks. Unit root analyses which are made without bothering those

International Journal of Academic Research in Business and Social Sciences 2017, Vol. 7, No. 10
ISSN: 2222-6990
161 www.hrmars.com
structural breaks can come up with misleading and stable series can occur as nonstationary series according to those tests (Yıldırım et. al., 2013:83). Lee and Strazicich (2003) have developed unit root test which searches for two structural breaks in series. Model A searches for the existence of two structural breaks in averages of series while Model C searches for the existence of two structural breaks in average and trends of series. In the case that obtained test statistic is higher than critical value in terms of absolute value, unit root basic hypothesis with structural break is rejected. If it is lower, then it is accepted. In equations numbered (3) and (4), respectively equations about Model A and Model C are shown.
MODEL A 1 1 1
1
1 2 (3)k
t t t t j t j t
j
y K y t DU DU d y
MODEL C 1 1 2 2 2
1
1 1 2 2 (4)k
t t t t t t t j t j t
j
y K y t DU DT DU DT DT d y
1(5)
0t
TB
Other
tDU
0
(6)t
TB
Other
t TB tDT
Here, first difference operator is white noise with t , 2 variance term; and Tt .....1 shows
the time. jty term makes disturbance term white noise and successive nondependent one.
tDU is a dummy variable. Null hypothesis of Model A shows that serial is nonstationary with
one break in level while alternative hypothesis shows that serial is stable with one break in level. On the other hand, null hypothesis of Model C shows that serial is nonstationary with one break in level and curve while alternative hypothesis shows that serial is stable with one break in level and curve. Developed co-integration test which is prepared by Gregory and Hansen (1996) for the existence of single structural break is enlarged by allowing existence of two structural break in 2008 by Hatemi-J. Hatemi-J expressed the effect of two structural break in both stable and curve by considering the equation number 7 (Eren and Aydın, 2016:221);
0 1 1 2 2 0 1 1 2 2' ' 't t t t t t t t ty D D x D x D x u (7)
In equation, while α0 shows the constant term before structural alteration, α1 shows the first structural alteration. α2 shows the change in constant term because of second structural alteration. While β0 shows curve parameter before the structural alteration, β1 shows the effect of first structural alteration on curve and β2 parameter shows the effect of second structural alteration. yt is dependent variable, xt is independent variable vector. In model, t > [nτ1] andt > [nτ2] are dummy variables defined as if t > [nτ1] , D1t = 1; if not 0. If t > [nτ2] , D2t = 1; if not 0. τ1 and τ2 terms express unknown indicators which show structural break times and their value change between 0 and 1 (Hatemi-J, 2008:499). With the aim of testing main hypothesis which shows no co-integration relationship among variables in Hatemi-J test, ADF*, Zt and Zα test statistics are used (Yılancı and Öztürk:2010:267).

International Journal of Academic Research in Business and Social Sciences 2017, Vol. 7, No. 10
ISSN: 2222-6990
162 www.hrmars.com
Granger causality test analyze whether second serial provides useful information in the projection of a serial (Özcan, 2015:186). In this context, this test’s results can be misleading because it does not give reactions similar to positive and negative shocks of asymmetric causality test developed by Hatemi-J (2012)(Hatemi-J, 2012:448). Hatemi-J causality test (2012) is decomposed form of positive and negative shocks of Hacker and Hatemi-J (2006) bootstrap Granger causality test. It tests causality relationship among shocks (Arı, 2015:29). It is possible to explain model as such (Sungur et. al., 2016:181-182): Suppose that causality analysis between two integrated series such as Y1t and y2t is tested:
1 1 1 1 1,0 1
1
i
t t t i
i
y y y
(8)
2 2 1 2 2,0 2
1
i
t t t i
i
y y y
(9)
If positive and negative shocks are shown as in equation (6):
1 1( ,0),i imaks 1 1min( ,0),i i
2 2( ,0),i imaks 2 2min( ,0)i i (10)
It can be stated as 1 1 1i i i and
2 2 2i i i . In this information assumption, it is possible
to reorganize equalities number (8) and number (9):
1 1 1 1 1,0 1 1
1 1
i i
t t t i i
i i
y y y
2 2 1 2 2,0 2 2
1 1
i i
t t t i i
i i
y y y
(11)
Positive and negative shocks which take part in each variable can be expressed as equation (12) in cumulative form:
1 1
1
t
i i
i
y
, 1 1
1
t
i i
i
y
, 2 2
1
t
i i
i
y
, 2 2
1
t
i i
i
y
(12)
Supposing that in Hatemi-J (2012) test ty variable equal to
1 2( , )t ty y pair, causality relationship
between these components is tested via following p delayed Vector Autoregressive (VAR) model:
1 1 1...t t p p ty A y A y u
(13)
In time, some changes among variables can occur in symmetrical/asymmetrical Granger causality relationship. Causality relationship can change in time with the effect of global economy and political events. Through time-varying causality analysis, stability of causality relationship can be tested (Eren and Aydın, 2016:223). Time-varying symmetrical/asymmetrical causality test is developed by Yılancı and Bozoklu (2014) and Arslantürk et. al. (2011), Eren and Aydın (2016) made use of this relevant test in their studies.

International Journal of Academic Research in Business and Social Sciences 2017, Vol. 7, No. 10
ISSN: 2222-6990
163 www.hrmars.com
First of all, it should be decided on sub-sample size that analyze is going to be applied for time-varying asymmetrical causality. As stated in Brooks and Hinich’s (1998) studies, observation size should be large enough to be able to carry out the test validly. In this study, number of observations will be 30.In other words, asymmetrical causality analysis will be applied in 30 month sub-samples. If we need to give information about time-varying asymmetrical causality test’s general operation conditions; first Hatemi-J causality test is applied. Later on, first observation is eliminated, and then relevant test is applied to second observation (30+1) and range of observation. Test is continued by eliminating first observation in each stage and adding new observation to the last observation until last observation in data range is used. To be able to test relevance of obtained test statistics, acquired test statistics in each observation range are normalized with bootstrap critical value (Yılancı and Bozoklu, 2014:215).The point to be emphasized here is that not only Wald test statistics but also bootstrap critical values can change in time. Thus, acquired test statistics in each observation range is normalized with %10 bootstrap critical value acquired in this observation range. To be able to interpret acquired Wald test statistics, values are shown in graphs. In graph, values stated above the line ‘’1’’ show that main hypothesis, which shows there is no asymmetrical Granger causality, should be rejected (Yılancı, 2014:79). In other words, it shows the existence of causality relationship. Test statistics calculated according to time-varying symmetrical causality test results are obtained with 10000 iterations by using bootstrap and determined with Hatemi-J information criterion. FINDINGS With the aim of making comparisons before estimating co-integration and causality relationships among variables, unit root test results which do not consider the break are shown. With this aim, it is applied to unit root tests developed by Augmented Dickey-Fuller (1979) (ADF) and Philips-Perron (1988).
Table 2. Results of the ADF and PP Unit Root Tests
Note: *, ** and *** values shows relevance respectively on the level of%1, %5 and %10.Values in parenthesis shows the proper time lag length of kernel ‘’Barlettkernel’’ method for PP,
Leve
l
Variables ADF PP
Firs
t D
iffe
ren
ces
Variables ADF PP
Co
nst
an
t
EXC 1.31(2)
[0.9987] 1.38(3)
[0.9989] EXC
-9.35(1) [0.0000]*
-8.90(4) [0.0000]*
X -2.31(2) [0.1677]
-1.62(13) [0.4677]
X -13.88(1) [0.0000]*
-27.75(9) [0.0000]*
M -2.35(1) [0.1554]
-1.93(11) [0.3145]
M -19.18(0) [0.0000]*
-20.10(5) [0.0000]*
Co
nst
an
t+Tr
end
EXC -0.24(2) [0.9915]
-0.30(3) [0.9901]
EXC -9.66(1)
[0.0000]* -8.94(7)
[0.0000]*
X -1.75(2) [0.7231]
-3.69(6) [0.0256]**
X -14.13(1) [0.0000]*
-30.84(12) [0.0001]*
M -3.51(1)
[0.0408]** -4.01(4)
[0.0100]** M
-19.26(0) [0.0000]*
-21.04(7) [0.0000]*

International Journal of Academic Research in Business and Social Sciences 2017, Vol. 7, No. 10
ISSN: 2222-6990
164 www.hrmars.com
Akaike statistic information criterion for ADF and bandwidth ‘’Newey West bandwidth’’ method. When the time lag length is zero, it shows Dickey-Fuller test. Values in square brackets show possibility values. According to ADF unit root test results, it is seen that all variables in model with constant, variables out of M in model with constant and trend are not stable in level values. When their first variance is calculated [I(1)], all variables in both model become stable. When Phillips and Perron unit root test results are observed, it is concluded that all variables in model with constant, variables out of X and M in model with constants and trend are not stable. When their first variance is calculated [I(1)], it is seen that both model do not include unit root.
Table 3. Results of the Lee-Strazicich Unit Root Test
Model A Model C
Variables Min. t stat. Break 1 Break 2 Min. t stat Break 1 Break 2 EXC -2.41(6) 2007:09 2009:03 -6.00(9)** 2007:07 2013:12 X -4.01(12)** 2005:11 2013:05 -5.88(12)** 2008:12 2014:01 M -3.11(12) 2007:11 2013:05 -4.78(12) 2005:02 2010:11
Note:*, ** and *** values shows relevance respectively on the level of%1, %5 and %10.Values in parenthesis show delay number selected by Akaike Information Criterion. Lee-Strazicich (2003:1084) for Model A, %1, %5 and %10 critical values respectively are 4.545, -3.842 and -3.504, for Model C critical values which belong to EXC and X are for %1, %5 and %10 respectively -6.42, -5.65 and -5.32; critical values which belong to M variable are -6.41, -5.74 and -5.32. Maximum time lag is calculated according to Schwert (1989) and found as 14. For EXC serial at the level of %5 significance, it is concluded that test statistical value is smaller than critical values in terms of absolute value for Model A, so series include unit root. For Model C, because test statistical value is higher than critical values in term of absolute value, it is concluded that serial is stable with structural break. When periods with structural break are analyzed, it is seen that July 2007 coincide with electoral period. So, instability and breaks in currency and finance market are expected factors for this period. In December 2013, as the results of 10 ministers assignment period because of revision in government party’s council of ministers and corruption investigations about some ministers, 4. Cabinet revision come true. Similar political instabilities can be said to cause important breaks in exchange rates and markets. It has been concluded that the series is stationary with structural breaks because the test statistical value of x series for Model C and Model A (at 5% significance level) is greater than the critical values in terms of the absolute value. When having a look at the periods including structural breaks, as for 2005 November, dead people as a result of the explosions in South-eastern Anatolia Region and statements of Danish Prime Minister Rasmussen and EU officials against Turkey due to the press release happened during the visit of Denmark of the Prime Minister of that time and freedom of expression problem can be interpreted as managerial instability of the country.In May 2013, US-based developments lead to breaks in exchange rate and, accordingly, in exports performance. During the stated period, investigation
International Journal of Academic Research in Business and Social Sciences 2017, Vol. 7, No. 10
ISSN: 2222-6990
165 www.hrmars.com
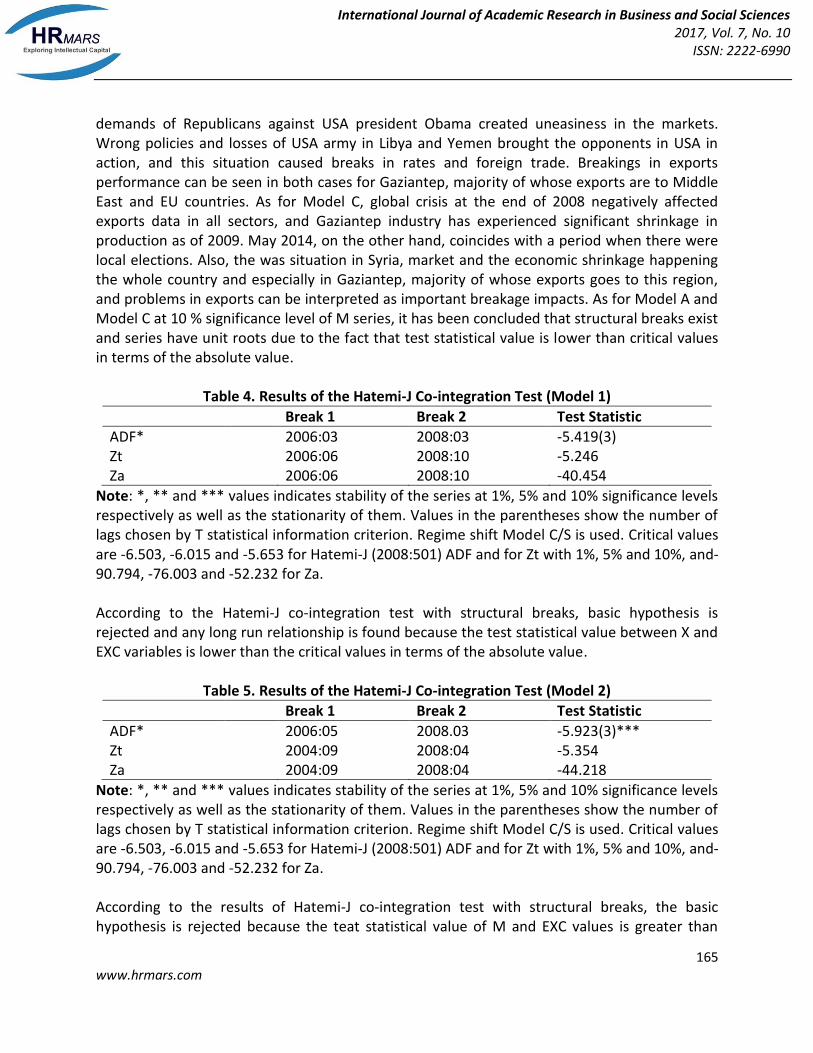
demands of Republicans against USA president Obama created uneasiness in the markets. Wrong policies and losses of USA army in Libya and Yemen brought the opponents in USA in action, and this situation caused breaks in rates and foreign trade. Breakings in exports performance can be seen in both cases for Gaziantep, majority of whose exports are to Middle East and EU countries. As for Model C, global crisis at the end of 2008 negatively affected exports data in all sectors, and Gaziantep industry has experienced significant shrinkage in production as of 2009. May 2014, on the other hand, coincides with a period when there were local elections. Also, the was situation in Syria, market and the economic shrinkage happening the whole country and especially in Gaziantep, majority of whose exports goes to this region, and problems in exports can be interpreted as important breakage impacts. As for Model A and Model C at 10 % significance level of M series, it has been concluded that structural breaks exist and series have unit roots due to the fact that test statistical value is lower than critical values in terms of the absolute value.
Table 4. Results of the Hatemi-J Co-integration Test (Model 1)
Break 1 Break 2 Test Statistic
ADF* 2006:03 2008:03 -5.419(3) Zt 2006:06 2008:10 -5.246 Za 2006:06 2008:10 -40.454
Note: *, ** and *** values indicates stability of the series at 1%, 5% and 10% significance levels respectively as well as the stationarity of them. Values in the parentheses show the number of lags chosen by T statistical information criterion. Regime shift Model C/S is used. Critical values are -6.503, -6.015 and -5.653 for Hatemi-J (2008:501) ADF and for Zt with 1%, 5% and 10%, and-90.794, -76.003 and -52.232 for Za. According to the Hatemi-J co-integration test with structural breaks, basic hypothesis is rejected and any long run relationship is found because the test statistical value between X and EXC variables is lower than the critical values in terms of the absolute value.
Table 5. Results of the Hatemi-J Co-integration Test (Model 2)
Break 1 Break 2 Test Statistic
ADF* 2006:05 2008.03 -5.923(3)*** Zt 2004:09 2008:04 -5.354 Za 2004:09 2008:04 -44.218
Note: *, ** and *** values indicates stability of the series at 1%, 5% and 10% significance levels respectively as well as the stationarity of them. Values in the parentheses show the number of lags chosen by T statistical information criterion. Regime shift Model C/S is used. Critical values are -6.503, -6.015 and -5.653 for Hatemi-J (2008:501) ADF and for Zt with 1%, 5% and 10%, and-90.794, -76.003 and -52.232 for Za. According to the results of Hatemi-J co-integration test with structural breaks, the basic hypothesis is rejected because the teat statistical value of M and EXC values is greater than

International Journal of Academic Research in Business and Social Sciences 2017, Vol. 7, No. 10
ISSN: 2222-6990
166 www.hrmars.com
critical values in terms of the absolute value, and a long term relationship is found with two structural transformations. The armed assault to State Council in May 2006, when we see structural breaks, and approximately 15% increase in the dollar rate can cause breaks for the long run relationship. When we have a look at May 2008, we see that recession in USA and EU countries before the global financial crisis, and the uneasiness in the domestic market resulted from the detained soldiers, academicians and journalists within the scope of Ergenekon investigation can cause breaks in the long term relationship between imports and exchange rate. The absence of a co-integration relationship in the first model leads to an expectation that there is not a causality relationship, either. Additionally, the detection of a co-integration relationship in the second model leads to an expectation that there is also at least a unidirectional causality relationship.
Table 6. Results of the Hatemi-J Asymmetric Causality Test (Model 1)
T Statistic %1 %5 %10
EXC+X+ 1.093 9.981 6.249 4.743
X+EXC+ 0.186 10.766 6.302 4.725
EXC- X- 0.549 9.737 6.196 4.663
X-EXC- 3.768 9.828 6.032 4.677
Note:notation indicates the null hypothesis that there is no causality. *, ** and *** values represent the causality relationship between the variables at 1 %, 5 %, and 10 % significance levels respectively. Bootstrap number is 10.000. According to the results of Hatemi-J asymmetric causality test, which analyzes through distinguishing negative and positive shocks, given in Table 6,the hypothesis claiming that any causality relationship does not exist between EXC series and X series, used as the indicator of exports, in positive and negative shocks is rejected. Namely, there is not any causality relationship between the mentioned variables due to the fact that t statistical value is lower than the critical value.
Table 7. Results of the Hatemi-J Asymmetric Causality Test (Model 2)
T Statistic %1 %5 %10 EXC+
M+ 1.168 9.734 6.200 4.767 M+EXC+ 5.090*** 10.884 6.505 4.914
EXC- M- 0.003 9.699 6.265 4.832
M-EXC- 2.250 10.126 6.492 4.883
Note:notation indicates the null hypothesis that there is no causality. *, ** and *** values represents the causality relationship between the variables at 1 %, 5 %, and 10 % significance levels respectively. Bootstrap number is 10.000. According to the results of Hatemi-J asymmetric causality test, which analyzes through distinguishing negative and positive shocks, given in Table 7, the hypothesis claiming that there is a causality relationship from M series, which is used as the indicator of imports, to EXC in

International Journal of Academic Research in Business and Social Sciences 2017, Vol. 7, No. 10
ISSN: 2222-6990
167 www.hrmars.com
positive and negative shocks is rejected. In other words, a unidirectional causality relationship exists between the stated variables in positive shocks as t statistical value is greater than10 % significance level. The causality test results have met the expectation emerged after co-integration analysis. Namely, any causality relationship could not be found in the first model as there is not, either, co-integration relationship, and an unidirectional causality relationship was found in the second model as a long term relationship was detected. Time varying asymmetric causality test, which is more developed, was used due to the ability and/or inability of identification of the unidirectional causality relationship for the both model.
Figure 1. Results of the A Time-Varying Asymmetic Causality Test (Model 1)
Table 6 shows that there is not a causality relationship from the positive shocks in exchange rate to positive shocks in exports and to negative shocks with the same direction. Figure 1 verifies this result for a great part of its interval. For the positive shocks, financial crises abroad (2008, 2011) and Gaziantep's exports break record in 2013 reveals the causality relationship between the two variables. In terms of negative shocks, the chaos happening in Syria since 2011 is thought to impact the relationship of the two variables.

International Journal of Academic Research in Business and Social Sciences 2017, Vol. 7, No. 10
ISSN: 2222-6990
168 www.hrmars.com
Figure 2. Results of the A Time-Varying Asymmetic Causality Test (Model 2)
Table 7 shows that there is a causality relationship from positive shocks in imports to positive shocks in exchange rate. Figure 2 verifies this result for a significant part of its time interval. Causality relationships exist between variables in positive and negative shocks, and positive shocks reveals the causality relationships between 2008 global finance and 2011 Euro Zone debt crises. As for the negative shocks, the increase of exchange rate since the last quarter of 2015 is thought to affect imports. CONCLUSION It is known that in macroeconomics theories and international economics literature, fluctuation has effects on foreign trade. Especially, value change of national currency in exchange rate equivalent in terms of production costs and global competition is important for balance of foreign trade and accordingly for current deficit problem. In developing countries such as Turkey because of foreign-dependent exportation, small changes in exchange rates can create important macroeconomics effects. This situation is also supported by study results. It is

International Journal of Academic Research in Business and Social Sciences 2017, Vol. 7, No. 10
ISSN: 2222-6990
169 www.hrmars.com
concluded that there is a positive relationship between exchange rate and foreign trade in 2002:1-2016:2 term in Gaziantep. Except political and structural problems of the terms with structural breaks, this relationship is observed locally. To be able to being more powerful in global competition, stable macroeconomics policies should be applied. For the consistent exchange rates, being successful in interest policies is so important for foreign capital. Also, fulfilling political instability of region and producing peaceful solutions in foreign trade are going to gain much more confidence especially in international markets. Beside interest policies, supporting foreign trade sectors with structural reforms has great importance for region and the country in terms of global competition. This study tested the relationship between exchange rate and import & export representing foreign trade for the period covering 2002: 01 – 2016: 02 in Gaziantep. Firstly, stationary of values was tested, and it found that they contain unit root at level values and they become stationary when they are first differenced. According to the analysis of unit roots with structural breaks, structural transformation happened on the dates 2007: 07 and 2013: 12 in exchange rate serial, on the dates 2005: 11, 2013: 05, 2008: 12, 2014: 01 in exports variable. Also, it was detected that there is not significant breaks in the imports parameter. The long-term relationship between variables was examined with the help of two structural break tests; any significant break could not be found for the first model, while breaks were found on the dates 2006: 05 – 2008: 03 for the second model according to ADF test results. Finally, the causality relationship between variables was examined, and causality relationship could not be found in the first model according to the Hatemi-J (2012) asymmetric causality test results. There is a unidirectional causality relationship from imports to exchange rate in positive shocks. Time-varying symmetric causality test, which is more developed, was used to see whether there is a relationship between variables as for these results, and periodical relationships were detected. When the findings of this study are compared with other studies, it is seen that it supports Brada and Mendez (1988), Arize (1995), Kulkarni (1996), Ay and Özşahin (2007), Yamak and Korkmaz (2005), Vergil and Erdoğan (2009) studies. However, it contradicts with Koch and Rosensweigh (1992), Zhang (1996), Chinn and Lee (2002), Alptekin (2009), Zengin and Terzi (1995) studies. Consequently, it is seen that there is a positive relationship between foreign trade and exchange rate during the period covering 2002: 01 – 2016: 02 in Gaziantep and this relationship is supported with the reforms. The main distinctive characteristic of this study conducted to determine the relationship between foreign trade and exchange rate is the place; it is conducted in a city (Gaziantep) instead of a country. Also, the relationship between foreign trade and exchange rate is tried to be estimated with the help of unit root with structural break, Hatemi-J cointegration test and time-varying causality tests. Also, because of the same reason, it is expected to draw attention of policy implementers in Gaziantep. REFERENCES Alptekin, V. (2009). Türkiye’de Dış Ticaret - Reel Döviz Kuru İlişkisi: Vektör Otoregresyon (Var)
Analizi Yardımıyla Sınanması. Niğde Üniversitesi İİBF Dergisi, 2(2), ss.132-149.

International Journal of Academic Research in Business and Social Sciences 2017, Vol. 7, No. 10
ISSN: 2222-6990
170 www.hrmars.com
Arı, A. (2015). World Oil Prices and Agricultural Commodity Prices In Turkey: Evidence From Symmetric and Asymmetric Causality Test. Journal of Applied Research In Finance and Economics, 1(1), pp.25-35.
Arize, C.A. (1995). The Effects of Exchange - Rate Volatility on U.S. Exports: An Empirical Investigation. Southern Economic Journal, 62(1), pp.34-43.
Arslantürk, Y., Balcılar, M. & Özdemir, Z. A. (2011). Time-Varying Linkages between Tourism Receipts and Economic Growth in a Small Open Economy. Economic Modelling, 28(1-2), pp.664-671.
Ay, Ahmet & Özşahin, Ş. (2007). J Eğrisi Hipotezinin Testi: Türkiye Ekonomisinde Reel Döviz Kuru ve Dış Ticaret Dengesi İlişkisi. Uludağ Üniversitesi İktisadi ve İdari Bilimler Fakültesi Dergisi, 26(1), ss. 1-23
Bahmani-Oskooee, M. & Niroomand, F. (1998). Long Run Price Elasticities and the Marshall-Lerner Condition Revisited. Economics Letters, 61(1), pp.101-109.
Brada, J. C. & Mendez, J. A. (1988). Exchange Rate Risk, Exchange Rate Regime and the Volume of International Trade. Kyklos, 41, pp.263 – 280.
Brooks, C. & Hinich, M. J. (1998). Episodic Nonstationarity in Exchange Rates. Applied Economics Letters, 5(11), pp.719-722.
Chinn, M. D. & Lee,J. (2002). Current Account and Real Exchange Rate Dynamics in the G-7 Countries. IMF Working Paper, (#WP/02/130).
Dickey, D. A. & Fuller,W. A. (1981). Likelihood Ratiostatistics For Autoregressive Time Series with A Unit Root.Econometrica, 49(4), pp.1057-1072.
Eren, M. V. & Aydın, H. İ. (2016). Türkiye’de Enerji Tüketimi-Kalkınma İlişkisi: Zamanla Değişen Simetrik Nedensellik Analizi. H. İ. Aydın ve Y. E. Özer, (Ed).Kalkınma Üzerine Ekonomi-Politik Yazılar. Ankara: Orion Kitabevi.
GTO (Gaziantep Ticaret Odası) (2016). Türkiye Ekonomisinde Gaziantep’in Yeri. http://www.gto.org.tr/Ekonomi-icerik-19.html (07.04.2016)
Hacker, R.S. & Hatemi-J, A. (2006). Testing for Causality between Integrated Variables Using Asymptotic and Bootstrap Distributions: Theoryand Application. Applied Economics, 38(13), pp.1489-1500.
Hatemi-J, A. (2008). Tests For Cointegration With Two Unknown Regime Shifts With An Application to Financial Market Integration. Empirical Economics, 35(3), pp.497-505.
Hatemi-J, A. (2012). Asymmetric Causality Tests With An Application. Empirical Economics, 43(1), pp.447-456.
Karagöz, M. & Doğan, Ç., (2005). Döviz Kuru Dış Ticaret İlişkisi: Türkiye Örneği. Fırat Üniversitesi Sosyal Bilimler Dergisi, 15(2),ss.219-228.
Koch, P. D. & Rosensweigh J. A. (1992). The Dollar and the US Terms of Trade. Journal of Macroeconomics, 14, pp.467-486
Kulkarni, K. G. (1996). The J-curve Hypothesis and Currency Devaluation: Cases of Egypt and Ghana. Journal of Applied Business Research, Laramie, Spring, 12, pp.101-109
Lee, J. & Strazicich, M. C., (2003). Minimum Lagrange Multiplier Unit Root Test with Two Structural Breaks. The Review of Economics and Statistics (85), pp.1082-1089.

International Journal of Academic Research in Business and Social Sciences 2017, Vol. 7, No. 10
ISSN: 2222-6990
171 www.hrmars.com
Özcan, C. C. (2015). Turizm Gelirleri-Ekonomik Büyüme İlişkisinin Simetrik ve Asimetrik Nedensellik Yaklaşımı ile Analizi: Türkiye Örneği. Erciyes Üniversitesi İktisadi ve İdari Bilimler Fakültesi Dergisi, (46), ss.177-199.
Phillips, P.C.B. & Perron, P. (1988). Testing for A Unit Root in time Series Regression. Biometrika, 75(2), pp.335-346.
Schwert, G. W. (1989). Tests for Unit Roots: A Monte Carlo Investigation. Journal of Business & Economics Statistics, 7(2), pp. 147-159.
Sivri, U. & Usta, C. (2001). Reel Döviz Kuru, İhracat ve İthalat Arasındaki İlişki. Uludağ Üniversitesi İ.İ.B.F. Dergisi, 19(4), ss.1-11.
Sukar, A. (1998). Real Effective Exchange Rates And Export Adjustment In The U.S.. Quarterly Journal Of Business and Economics, 37(1), pp.3-12.
Sungur, O., Aydın, H. İ. & Eren, M. V. (2016). Türkiye’de Ar-ge, İnovasyon, İhracat ve Ekonomik Büyüme Arasındaki İlişki: Asimetrik Nedensellik Analizi. Süleyman Demirel Üniversitesi İktisadi ve İdari Bilimler Fakültesi Dergisi, 21(1), ss.173-192.
TCMB (2016). Kurlar. http://evds.tcmb.gov.tr/ (06.04.2016). Toda, H. Y. & Yamamoto, T. (1995). Statistical Inference in Vector Autoregressions With Possibly
Integrated Processes. Journal of Econometrics, 66(2),pp.225-250. TUIK (2016). Dış Ticaret İstatistikleri. http://www.tuik.gov.tr/PreTablo.do?alt_id=1046
(06.04.2016). TUIK (2016). Nüfus İstatistikleri. http://www.tuik.gov.tr/UstMenu.do?metod=temelist
(06.04.2016). Vergil, H. & Erdoğan, S. (2009). Döviz Kuru-Ticaret Dengesi İlişkisi: Türkiye Örneği. ZKÜ Sosyal
Bilimler Dergisi, 5(9), ss.35–57 Yamak, R. ve Korkmaz,A. (2005). Reel Döviz Kuru ve Dış Ticaret Dengesi İlişkisi: Kritik
Elastikiyetler (Marshall-Lerner) Şartı. İstanbul Üniversitesi İktisat Fakültesi Ekonometri ve İstatistik Dergisi, (2), ss.11-29.
Yılancı, V. & Öztürk, Z. A. (2010). Türkiye ile En Büyük Beş Ticaret Ortağının Hisse Senedi Piyasaları Arasındaki Entegrasyon İlişkisinin Analizi: Yapısal Kırılmalı Birim Kök ve Eşbütünleşme Analizi. Erciyes Üniversitesi İktisadi ve İdari Bilimler Fakültesi Dergisi, (36), ss.261-279.
Yılancı, V. (2014). Zaman Serileri Analizi Sakarya Ekonometri Semineri. 2014 Ders Notları. Yılancı, V. & Bozoklu, Ş. (2014). Türk Sermaye Piyasasında Fiyat ve İşlem Hacmi İlişkisi: Zamanla
Değişen Asimetrik Nedensellik Analizi. Ege Akademik Bakış, 14(2), ss.211-220. Yıldırım, K., Mercan,M. & Kostakoğlu, S. F.(2013). Satın Alma Gücü Paritesinin Test Edilmesi:
Zaman Serisi ve Panel Veri Analizi. Eskişehir Osmangazi Üniversitesi İİBF Dergisi, 8(3), ss.75-95.
Zengin, A. & Terzi, H. (1995). Türkiye’de Kur Politikası, İthalat, İhracat ve Dış Ticaret Dengesi İlişkisinin Ekonometrik Analizi. Gazi Üniversitesi İ.İ.B.F Dergisi, 11(1-2), ss.247-266.
Zhang, Z. (1996). The Exchange Value of the Renminbi and China’s Balance of Trade: an Empirical Study. NBER Working Papers Series, No:5771.