analysis of exceptional events contributing to high …
TRANSCRIPT

SOUTH COAST AIR QUALITY MANAGEMENT DISTRICT
PLANNING, RULE DEVELOPMENT, AND AREA SOURCES
ANALYSIS OF EXCEPTIONAL EVENTS CONTRIBUTING TO HIGH PM10 CONCENTRATIONS
IN THE SOUTH COAST AIR BASIN ON OCTOBER 13, 2008
Final Report August 5, 2010
Authors
Kevin R. Durkee Senior Meteorologist
Shoreh Cohanim
Air Quality Specialist
Reviewed By: Michael Laybourn, Air Quality Specialist
Tracy A. Goss, P.E., Program Supervisor, PM Strategies Joseph C. Cassmassi, Planning and Rules Manager
Elaine Chang, Deputy Executive Officer


i
TABLE OF CONTENTS TABLE OF CONTENTS ....................................................................................................................................................i
List of Figures .................................................................................................................................................................... ii
List of Tables ...................................................................................................................................................................... ii
1 INTRODUCTION .................................................................................................................................................... 1
1.1 Purpose ................................................................................................................................................................. 1
1.2 Organization of this Document ............................................................................................................................. 2
1.3 Exceptional Events Rule Background ................................................................................................................... 3
1.4 Geographic Setting ................................................................................................................................................ 5
1.5 Regulatory Measures ............................................................................................................................................. 8
1.6 Historical Perspective of PM10 in the South Coast Air Basin ............................................................................ 10
2 HIGH WIND EXCEPTIONAL EVENT ANALYSIS ......................................................................................... 13
2.1 Event Summary: October 13, 2008 .................................................................................................................... 13
Flagging of Data ....................................................................................................................................................... 13
Exceptional Event Criteria Summary ....................................................................................................................... 14
Affects Air Quality .............................................................................................................................................. 14 Is Not Reasonably Controllable or Preventable .................................................................................................. 15 Was a Natural Event ............................................................................................................................................ 16
Causal Connection .................................................................................................................................................... 17
Concentration was in Excess of Normal Historical Fluctuations ............................................................................. 17
The “But For” Test ................................................................................................................................................... 18
Reasonable Measures ............................................................................................................................................... 19
Public Notification ................................................................................................................................................... 20
Checklist of Exceptional Event Requirements ......................................................................................................... 21
2.2 Detailed Event Analysis ...................................................................................................................................... 22
PM Summary ............................................................................................................................................................ 22
Meteorological Setting ............................................................................................................................................. 33
Wildfire Analysis ..................................................................................................................................................... 37
Windblown Dust Analysis ........................................................................................................................................ 38
Conclusion ................................................................................................................................................................ 49

ii
LIST OF FIGURES Figure 1-1 ............................................................................................................................................................................. 6
Figure 1-2 ............................................................................................................................................................................. 7
Figure 1-3 ............................................................................................................................................................................. 8
Figure 1-4 ........................................................................................................................................................................... 12
Figure 2-1 ........................................................................................................................................................................... 25
Figure 2-2 ........................................................................................................................................................................... 27
Figure 2-3 ........................................................................................................................................................................... 38
Figure 2-4 ........................................................................................................................................................................... 39
Figure 2-5 ........................................................................................................................................................................... 40
Figure 2-6 ........................................................................................................................................................................... 43
Figure 2-7 ........................................................................................................................................................................... 44
Figure 2-8 ........................................................................................................................................................................... 46
LIST OF TABLES Table 1-1 ............................................................................................................................................................................ 11
Table 2-1 ............................................................................................................................................................................ 23
Table 2-1 (continued) ........................................................................................................................................................ 24
Table 2-2 ............................................................................................................................................................................ 26
Table 2-3 ............................................................................................................................................................................ 29
Table 2-4 ............................................................................................................................................................................ 29
Table 2-5 ............................................................................................................................................................................ 31
Table 2-5 (continued) ........................................................................................................................................................ 32
Table 2-6 ............................................................................................................................................................................ 42
Table 2-7 ............................................................................................................................................................................ 48

Introduction
1
ANALYSIS OF EXCEPTIONAL EVENTS CONTRIBUTING TO HIGH PM10 CONCENTRATIONS
IN THE SOUTH COAST AIR BASIN ON OCTOBER 13, 2008
1 INTRODUCTION
1.1 Purpose
This document substantiates the request by the South Coast Air Quality Management District (AQMD) to flag a violation of the 150 μg/m3 PM10 24-hour National Ambient Air Quality Standard (NAAQS) in the South Coast Air Basin (Basin) as exceptional events under the U.S. Environmental Protection Agency (EPA) Regulation for the Treatment of Data Influenced by Exceptional Events (40 CFR, sections 50.1 & 51.14)1. Natural events caused exceedances of the federal standard at one Federal Equivalent Method (FEM) Tapered Element Oscillating Microbalance (TEOM) continuous monitor on Monday, October 13, 2008, with a midnight-to-midnight 24-hour average concentration of 199 μg/m3 at the Anaheim air monitoring station in Orange County (AQS Site Code 060590007). This was not a sampling day for the Federal Reference Method (FRM) filter samplers. The measured PM10 was primarily crustal material from windblown dust due to a strong Santa Ana wind event; the PM2.5 24-hour NAAQS was not exceeded with the AQMD FRM filter samplers on this day.
AQMD began submitting PM10 data from Beta Attenuation Monitor (BAM) and TEOM continuous instruments to the EPA Air Quality System (AQS) database, starting with 2008. The Anaheim TEOM event on October 13, 2008 was the only PM10 NAAQS violation recorded at any station in the South Coast Air Basin, in either the FRM or FEM monitoring, during 2008 or 2009. AQMD has requested that the Basin be redesignated to attainment and flagging this data in AQS will alleviate any potential concerns in the redesignation evaluation.
The elevated particulate matter concentration observed on October 13. 2008 occurred as a result of entrainment of fugitive windblown dust from very high winds that impacted much of the Basin. AQMD has submitted the hourly PM10 data from the Anaheim
1 EPA 2007. Treatment of Data Influenced by Exceptional Events; Final Rule. 40 CFR Parts 50 and 51; Federal Register Vol. 72, No. 55; March 22, 2007. http://www.smartpdf.com/register/2007/Mar/22/13560A.pdf

Introduction
2
monitor on this day to the EPA AQS database and has placed the appropriate AQS flags throughout the day to indicate that the data was affected by exceptional events due to high winds. This flagging indicates that the ambient air quality data was influenced by the windblown dust related emissions and insures that the data is properly represented in the regulatory process.
1.2 Organization of this Document
This document is designed to provide summary information to the public as well as the specific detailed analyses to meet the requirements of Exceptional Events Rule. Section 1, Introduction, describes the purpose, exceptional event criteria, background of the Exceptional Event Rule and background information related to high wind events in the Basin, including:
• the geographic setting; • the regulatory measures, showing that continuing reasonable controls are in effect
in the Basin and that ongoing public education programs and event forecasting and notification plans are in place;
• an overview of high PM10 events in the Basin, including a historical perspective of PM10 exceptional events.
Section 2 describes the analysis of the PM10 NAAQS violation on October 13, 2008 that occurred due to high winds. The Event Summary, Section 2.1, summarizes the PM10 measurements and conditions that caused the NAAQS violation and documents how the natural event/episode satisfies the criteria of the Exceptional Events Rule, that is,
• Affects Air Quality; and • Is Not Reasonable Controllable or Preventable; • Is either a natural event or an event caused by human activity that is unlikely to
recur at a particular location. Further discussion in the Event Summary includes:
• the causal connection between the high wind event and the measured PM10; • how the measured concentration was in excess of the normal historical
fluctuations, including background; • how there would have been no exceedance “but for” the high wind event (the “But
For” Test); • that reasonable measures to control PM10 were in effect on the event day and how
a public notification and education process was implemented to warn the public before and during the event through forecasts, advisories and real-time air quality data.

Introduction
3
Following the Event Summary section, Section 2.2, the Detailed Event Analysis describes the analysis that led to the conclusions presented in the Event Summary section, including:
• a summary of the particulate measurements; • the meteorological setting; • conclusions.
Supporting materials for the October 13, 2008 PM10 analysis beyond what is included in the Section 2 are provided in a separate Appendix. This includes:
A.1 Meteorological Observations A.2 National Weather Service Weather Forecast Discussions A.3 National Weather Service Short Term Forecasts A.4 National Weather Service Fire Weather Forecast A.5 National Weather Service Non-Precipitation Warnings A.6 National Climatic Data Center Event Records A.7 Links and Press Articles A.8 Wildfire Information A.9 NOAA Satellite Services Division Smoke Text Products A.10 AQMD Forecasts and Advisories A.11 National Weather Service 500 MB Analyses A.12 National Weather Service Mean Sea Level Pressure/Surface Analyses
1.3 Exceptional Events Rule Background
Since 1977, EPA has implemented policies to address the treatment of ambient air quality monitoring data that has been affected by exceptional or natural events. In July 1986, EPA issued a document entitled Guideline on the Identification and Use of Air Quality Data Affected by Exceptional Events, introducing a flagging system to identify air quality measurements influenced by exceptional events that, if left unidentified, could lead to possible misinterpretation or misuse of the data. In 1996, EPA developed a guidance document entitled Areas Affected by PM-10 Natural Events, which provided criteria and procedures for States to request special treatment (i.e., flagging for exclusion from standard compliance consideration) for data affected by natural events (e.g., wildfire, high wind events, and volcanic and seismic activities). EPA approved several requests made by AQMD, through the California Air Resources Board (CARB), to apply the Natural Events Policy in order to flag violations of the 24-Hour PM10 NAAQS in the Coachella Valley for natural events that involved uncontrollable high winds. Air quality has continued to improve through implementation of best available control measures, required by AQMD rules. AQMD also protects the public through the issuance of area-specific air quality forecasts and episode notifications in the South

Introduction
4
Coast Air Basin and the portions Riverside County under AQMD jurisdiction in the Salton Sea Air Basin (Coachella Valley) and the Mojave Desert Air Basin.
On March 14, 2007, EPA promulgated a formal rule, entitled: The Treatment of Data Influenced by Exceptional Events, known as the Exceptional Events Rule. Exceptional events are unusual or naturally occurring events that can affect air quality but are not reasonably controllable or preventable using techniques that tribal, state or local air agencies may implement in order to attain and maintain the NAAQS. These events are flagged in the EPA AQS database as exceptional events. The data remains available to the public but are not counted toward attainment status. The EPA rulemaking:
• ensures that air quality measurements are properly evaluated and characterized with regard to their causes;
• identifies reasonable actions that should be taken to address the air quality and public health impacts caused by these types of events;
• avoids imposing unreasonable planning requirements on state, local and tribal air quality agencies related to violations of the NAAQS due to exceptional events;
• ensures that the use of air quality data, whether afforded special treatment or not, is subject to full public disclosure and review.
The Exceptional Events Rule does not require States to submit formal mitigation plans; however, States must provide public notice, public education, and must provide for implementation of reasonable measures to protect public health when an event occurs.
In the preamble of the Exceptional Event Rule, EPA specifically includes High Wind Events in the list of examples of exceptional events, classified as Natural Events. The Rule defines Natural Events as follows:
It is important to note that natural events, which are one form of exceptional events according to this definition, may recur, sometimes frequently (e.g., western wildfires). For the purposes of this rule, EPA is defining ‘‘natural event’’ as an event in which human activity plays little or no direct causal role to the event in question. We recognize that over time, certain human activities may have had some impact on the conditions which later give rise to a ‘‘natural’’ air pollution event. However, we do not believe that small historical human contributions should preclude an event from being deemed ‘‘natural.’’

Introduction
5
1.4 Geographic Setting
Southern California’s South Coast Air Basin (Basin), shown in Figures 1-1 and 1-2, consists of 10,743 square miles and consists of Orange County and the non-desert portions of Los Angeles, Riverside and San Bernardino Counties. The population of the Basin is approximately 16 million people, with approximately 11 million gasoline powered vehicles and 300,000 diesel vehicles. The coastal plain contains most of the population of the Basin, which is surrounded by tall mountains, including the San Gabriel Mountains to the north, the San Bernardino Mountains to the northeast, and the San Jacinto Mountains to the east. The coastal range of the Santa Ana Mountains separates the inland part of Orange County from Riverside County. The proximity of the Pacific Ocean to the west has a strong influence on the climate, weather patterns and air quality of the Basin. The mountains also have a significant impact on the wind patterns of the Basin. Offshore winds flow down slope and are warmed and dried by compressional heating, gaining momentum through the passes and canyons. Northeasterly winds, known as Santa Ana winds, typically account for the highest wind events in the Basin, occurring several times each year. Onshore high-wind events also occur with the strongest winds typically occurring in the mountains and deserts.
Figure 1-3 shows the PM10 monitors in the Basin, including the 24-hour FRM SSI samplers and the continuous Beta Attenuation Monitor (BAM) and Tapered Element Oscillating Microbalance (TEOM) samplers.

Introduction
6
FIGURE 1-1
Map of the South Coast Air Basin Showing Air Monitoring Stations and Forecast Areas

Introduction
7
FIGURE 1-2
Map of South Coast Air Basin with Selected Cities and Topography

Introduction
8
FIGURE 1-3
Map of South Coast Air Basin PM10 Monitors
1.5 Regulatory Measures
AQMD has implemented regulatory measures to control emissions from fugitive dust sources and open burning in the South Coast Air Basin. Implementation of Best Available Control Measures (BACM) in the Basin has been carried out through AQMD Rule 403 (Fugitive Dust), as well as source-specific rules. With its approvals of the South Coast PM10 Attainment Plans in the State Implementation Plan (SIP), EPA has concluded that this control strategy represents BACM and Most Stringent Measures (MSM) for each significant source category, and that the implementation schedule was as expeditious as practicable.
AQMD Rule 403 establishes best available fugitive dust control measures to reduce fugitive dust emissions associated with agricultural operations, construction/demolition activities (including grading, excavation, loading, crushing, cutting, planing, shaping or ground breaking), earth-moving activities, track-out of bulk material onto public paved roadways, and open storage piles or disturbed surface areas.
PM10 MonitoringSSIBAMTEOM

Introduction
9
AQMD Rule 1156, Further Reductions of Particulate Emissions from Cement Manufacturing Facilities, is a source-specific rule that applies to all operations, including material handling, storage and transport at cement manufacturing facilities. It restricts visible emissions from facility operations, open piles, roadways and unpaved areas and requires enclosed systems for loading, unloading and transfer of materials. Other operations must employ wind fencing and wet suppression systems or be enclosed with permitted control equipment.
AQMD Rule 1157, PM10 Emissions Reductions from Aggregate and Related Operations, is a source-specific rule applicable to all permanent and temporary aggregate and related operations that produce sand, gravel, crushed stone or quarried rocks. Like Rule 1156, this rule restricts the discharge of fugitive dust emissions into the atmosphere through plume opacity tests and limiting visible plume travel to within 100 feet of the operation. This rule requires: prompt removal of material spillage; stabilization of piles with dust suppressants; the control of loading, unloading, transferring, conveyors, and crushing or screening activities with dust suppressants or other control methods; stabilization of unpaved roads, parking and staging areas; sweeping of paved roads; and the use of track-out control systems.
AQMD Rule 1158, Storage, Handling, and Transport of Coke, Coal and Sulfur, is a source-specific rule that applies to any facility that produces, stores, handles, transports or uses these materials. This rule restricts visible emissions and requires that piles be maintained in enclosed storage and that unloading operations be conducted in enclosed structures with water spray systems or venting to permitted air pollution control equipment. It also has specific requirements to control emissions from roadways, other facility areas, and conveyors and the loading of materials.
AQMD Rule 1186, PM10 Emissions from Paved and Unpaved Roads and Livestock Operations, requires rapid removal of paved road dust accumulations and establishes a treatment schedule for unpaved roads, street sweeper procurement standards, and design standards for new road construction. AQMD Rule 1186.1, Less-Polluting Sweepers, requires procurement of alternative-fueled equipment when governmental agencies replace street sweepers.
AQMD Rule 444, Open Burning, ensures that open burning is conducted in a manner that minimizes emissions and impacts, and that smoke is managed to protect public health and safety. This rule requires authorization for agricultural and prescribed fire, limited to days that are predicted to be meteorologically conducive to smoke dispersion and that will not contribute to air quality that is unhealthy for sensitive groups or worse. It also restricts residential and waste burning.
AQMD Rule 445, Wood Burning Devices, reduces pollution from wood-burning fireplaces and other devices through requirements for new construction, curtailment of wintertime wood burning in specified areas when poor air quality is forecast and

Introduction
10
restriction of the sale of unseasoned firewood. The AQMD Healthy Hearths program provides public education on how to reduce air pollution from wood burning and encourages the conversion to natural gas burning fireplaces through an incentive program.
1.6 Historical Perspective of PM10 in the South Coast Air Basin
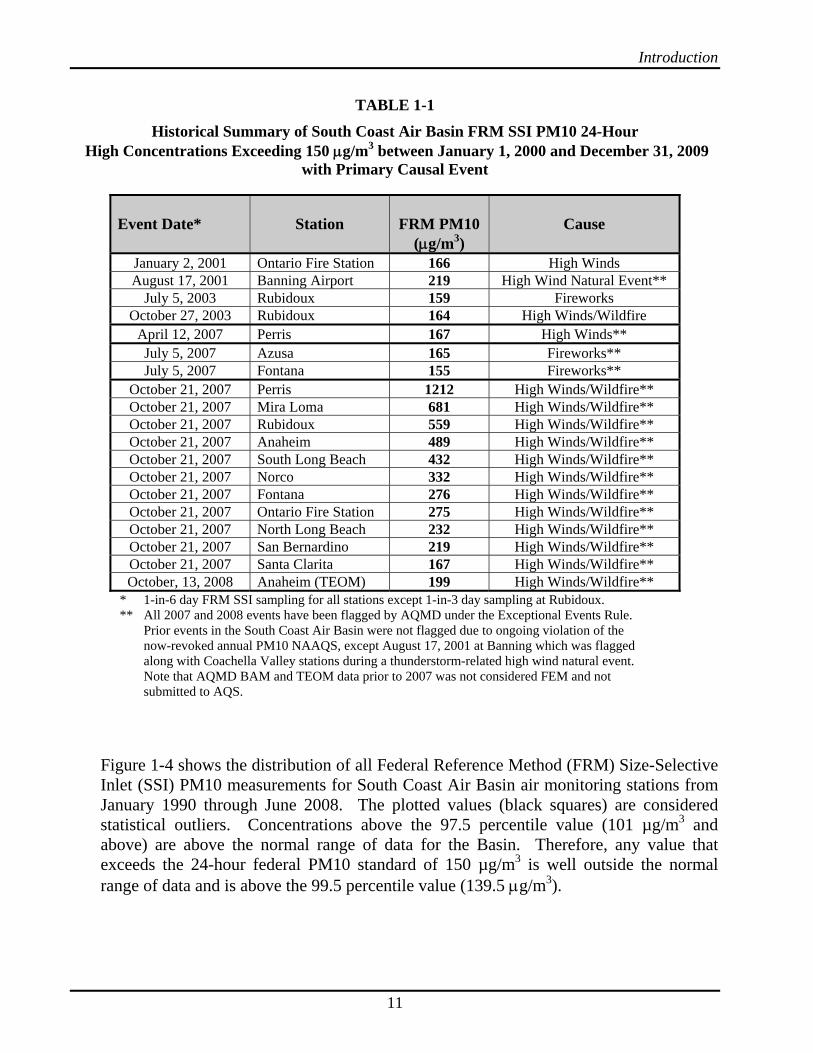
Table 1-1 summarizes the days with high PM10 in the South Coast Air Basin, defined as days exceeding 150 μg/m3, between January 1, 2000 and December 31, 2008. The events prior to 2007 were not flagged for exclusion under the EPA Natural Events Policy, except for August 17, 2001 at Banning Airport which was flagged as a high wind natural event along with the Coachella Valley stations (Indio and Palm Springs) due to thunderstorm winds. All the 24-hour PM10 NAAQS violations that occurred in 2007 have been flagged as requesting exclusion under the EPA Exceptional Events Policy. Since 2000, no 24-hour NAAQS violations occurred in the South Coast Air Basin that were not associated with strong winds, wildfire or fireworks events. Throughout the nine-year period, seven days exceeded the 150 μg/m3 NAAQS concentration at air monitoring stations in the Basin, for an overall average of just under 0.8 violations per year basin-wide. Except for the exceedances on July 5, 2003 and July 5, 2007, related to fireworks, all NAAQS violations in the Basin were associated with high wind natural events, several of which fanned large wildfires.
Introduction
11
TABLE 1-1
Historical Summary of South Coast Air Basin FRM SSI PM10 24-Hour High Concentrations Exceeding 150 μg/m3 between January 1, 2000 and December 31, 2009
with Primary Causal Event
Event Date*
Station
FRM PM10
(μg/m3)
Cause
January 2, 2001 Ontario Fire Station 166 High Winds August 17, 2001 Banning Airport 219 High Wind Natural Event**
July 5, 2003 Rubidoux 159 Fireworks October 27, 2003 Rubidoux 164 High Winds/Wildfire
April 12, 2007 Perris 167 High Winds** July 5, 2007 Azusa 165 Fireworks** July 5, 2007 Fontana 155 Fireworks**
October 21, 2007 Perris 1212 High Winds/Wildfire** October 21, 2007 Mira Loma 681 High Winds/Wildfire** October 21, 2007 Rubidoux 559 High Winds/Wildfire** October 21, 2007 Anaheim 489 High Winds/Wildfire** October 21, 2007 South Long Beach 432 High Winds/Wildfire** October 21, 2007 Norco 332 High Winds/Wildfire** October 21, 2007 Fontana 276 High Winds/Wildfire** October 21, 2007 Ontario Fire Station 275 High Winds/Wildfire** October 21, 2007 North Long Beach 232 High Winds/Wildfire** October 21, 2007 San Bernardino 219 High Winds/Wildfire** October 21, 2007 Santa Clarita 167 High Winds/Wildfire** October, 13, 2008 Anaheim (TEOM) 199 High Winds/Wildfire**
* 1-in-6 day FRM SSI sampling for all stations except 1-in-3 day sampling at Rubidoux. ** All 2007 and 2008 events have been flagged by AQMD under the Exceptional Events Rule.
Prior events in the South Coast Air Basin were not flagged due to ongoing violation of the now-revoked annual PM10 NAAQS, except August 17, 2001 at Banning which was flagged along with Coachella Valley stations during a thunderstorm-related high wind natural event. Note that AQMD BAM and TEOM data prior to 2007 was not considered FEM and not submitted to AQS.
Figure 1-4 shows the distribution of all Federal Reference Method (FRM) Size-Selective Inlet (SSI) PM10 measurements for South Coast Air Basin air monitoring stations from January 1990 through June 2008. The plotted values (black squares) are considered statistical outliers. Concentrations above the 97.5 percentile value (101 µg/m3 and above) are above the normal range of data for the Basin. Therefore, any value that exceeds the 24-hour federal PM10 standard of 150 µg/m3 is well outside the normal range of data and is above the 99.5 percentile value (139.5 μg/m3).

Introduction
12
Quantiles PM10 (µg/m3) 100.0% maximum 1212.0 99.5% 139.5 97.5% 101.0 90.0% 73.0 75.0% quartile 54.0 50.0% median 38.0 25.0% quartile 26.0 10.0% 16.0 2.5% 10.0 0.5% 5.0 0.0% minimum 0.0
Moments PM10 (µg/m3)
Mean 42.472396 Std Dev 26.819924
Std Err Mean 0.1930991 upper 95% Mean 42.850887 lower 95% Mean 42.093905
N 19291
FIGURE 1-4 Distribution of SSI PM10 Concentrations throughout the South Coast Air Basin
from January 1990 through June 2008 (Square symbols show statistically outlying PM10 concentrations)
0 100 200 300 400 500 600 700 800 900 1000 1100 1200
PM10 (µg/m3)

October 13, 2008 Exceptional Event
13
2 HIGH WIND EXCEPTIONAL EVENT ANALYSIS
2.1 Event Summary: October 13, 2008
Violations of the PM10 NAAQS were recorded at the South Coast Air Basin Anaheim monitoring station on October 13, 2008, due to high winds. The 24-hour mass concentration at Anaheim was measured with a federal equivalent method (FEM) Tapered Element Oscillating Microbalance (TEOM) continuous monitor, with a midnight-to-midnight 24-hour average concentration of 199 μg/m3. This was not a sampling day for the Federal Reference Method (FRM) filter measurements in the Basin. While no other PM10 measurements exceeded the federal standard level (150 μg/m3), other stations in the Basin had elevated concentrations during the same period. This event meets the criteria for high wind natural events as defined in the EPA Exceptional Events Rule.
A strong Santa Ana wind event developed on October 13th, causing very high northerly through easterly winds in the mountains and deserts, especially through and below the wind-favored passes and canyons in the Basin. National Weather Service (NWS) weather stations measured extremely high peak wind gusts throughout the day in areas upwind of the high AQMD PM10 stations, including: 87 mph by in the Santa Ana Mountains of Orange County (Freemont Canyon RAWS); 87 mph in the San Gabriel Mountains of Los Angeles County (Chilao RAWS); 79 mph in the Malibu Hills of Los Angeles County; 61 mph at Ontario International Airport in San Bernardino County; 55 mph at Corona Airport in Riverside County; 51 mph at Chino Airport in San Bernardino County and 41 mph at the Santa Ana – John Wayne Airport in Orange County.
Due to the widespread winds, sources of the windblown dust were both natural areas, particularly from the mountains and deserts, and BACM-controlled anthropogenic sources. The timing of the this event is verified with the high wind observations and reports of reduced visibility and blowing sand and dust, in conjunction with the hourly TEOM and BAM PM10 measurement data from nearby monitors in the Basin, when available. With the weight of evidence provided, AQMD concludes that the PM10 exceedances would not have occurred without the high winds and wind-entrained dust.
Flagging of Data
AQMD has submitted the PM10 data from this monitor to the EPA AQS database and has placed the appropriate flags on the data indicating that the data was affected by exceptional events due to high winds (Flag RJ, requesting exclusion due to high winds). To exclude the midnight to midnight 24 hour average, each individual hour of the Anaheim TEOM data was flagged individually. While wildfires also may have contributed to this exceedance, windblown dust was the primary contributor to the measured PM10 at Anaheim. Since only one flag can be submitted for each station exceedance, this is most appropriate for the PM10 on this day. Such flagging ensures

October 13, 2008 Exceptional Event
14
that the air quality data is properly represented in the overall air quality planning process.
Exceptional Event Criteria Summary
40 CFR 50.1(j) of the Exceptional Events Regulation defines an exceptional event as an event that:
• affects air quality; • is not reasonably controllable or preventable; • is either an event caused by human activity that is unlikely to recur at a particular
location or a natural event; and • is determined by the EPA Administrator in accordance with the Exceptional
Events Rule to be an exceptional event.
The following sections describe how the first three criteria are met for the October 13, 2008 high wind and wildfire natural events.
Affects Air Quality
For an event to qualify as an exceptional event, it is necessary to show that the event affected air quality. This criterion can be met by establishing that the event is associated with a measured exceedance in excess of normal historical fluctuations, including background. The demonstration of a clear causal relationship is necessary to establish that the event affected air quality and is also a separate requirement.
The documentation provided herein for the October 13, 2008 natural event provides the required information to establish a causal connection between the high winds throughout southern California and the high PM10 concentrations measured throughout the Basin. The exceptionally high 199 µg/m3 24-hour averaged PM10 concentration measured at Anaheim shows that air quality was affected. As shown in Table 2-2 and Figure 2-2, the 24-hour PM10 concentrations were relatively low on the days before and after the high wind event. The hourly PM10 concentrations in the Basin increased rapidly as the winds spiked in the morning, as is shown in Figure 2-1, Figure 2-6 and the wind observation tables (Appendix, A.1). As was shown previously in Section 1.6, in 18 years of analyzed data, high PM10 concentrations exceeding the 24-hour NAAQS do not often occur in the Basin and fall into less than the top 0.5 percent of the data. In the past 10 years, all eight days with PM10 24-hour NAAQS violations in the Basin were due to exceptional events, including strong winds, wildfire and fireworks displays. Only one other violation of the NAAQS has been recorded for the Anaheim air monitoring station during that 10-year period, the 489 µg/m3 that occurred during an extreme, Basin-wide high wind event with wildfires on October 21, 2007.

October 13, 2008 Exceptional Event
15
Section 2.2, Detailed Event Analysis, includes meteorological data showing a clear correlation between strong, gusty winds and increased hourly PM10 in the Basin. The supporting documentation also includes a National Weather Service (NWS) forecasts and advisories of high winds and windblown dust, as well as National Climatic Data Center (NCDC) storm damage reports and newspaper accounts. The measured exceedance on October 13, 2008, at Anaheim, is in excess of normal fluctuations, as is discussed further below.
Is Not Reasonably Controllable or Preventable
This requirement is met by demonstrating that despite reasonable and appropriate measures in place, the October 13, 2008 wind event caused the NAAQS violation. During this event, there were no other unusual PM10-producing activities occurring in the Basin and anthropogenic emissions were approximately constant before, during and after the event. In addition, reasonable and appropriate measures were in place, as has been described in Section 1.5, Regulatory Measures. October 13 was designated an agricultural and prescribed wildland “no-burn” day, in accordance with AQMD rule 444. The PM2.5 24-hour averages at all stations in the Basin, including Anaheim, were well below the 24-hour PM2.5 NAAQS and the PM10 was estimated to be composed of 87% PM-Coarse particles (PM10-2.5) and only 13 percent PM2.5. This shows that mostly crustal material comprised the PM10 mass and not transported or locally generated urban pollution or combustion sources.
A survey of the AQMD complaint records and inspection reports for Anaheim and all other areas of the Basin indicated no evidence of unusual particulate emissions on October 13, 2008 other than related to the strong winds. The complaints are summarized in Table 2-7 from the AQMD Clean Air Support System (CLASS) database for complaints and compliance actions. Due to the windy conditions, AQMD compliance staff responded to 17 complaints related to windblown dust on October 13. Most were in Riverside and San Bernardino County, but two were in Orange County with no further compliance action taken. No Notices of Violation or Notices to Comply were issued in the Basin for fugitive dust on this day. Several complaints were directly related to the strong winds and windblown dust that overwhelmed the strict fugitive dust controls that are enforced in the Basin. The control methods were generally effective throughout the Basin, but were apparently overwhelmed in several instances by the strong, gusty winds, causing windblown dust and sand to be entrained in the atmosphere.
Three wildfires were reported in southern California on October 13, fanned by the strong, dry Santa Ana winds, two in the San Gabriel Mountains north of the San Fernando Valley and one at Camp Pendleton in the north coastal part of San Diego County. Only one of these, the Marek Fire, was active during the early morning hours when the hourly PM10 concentrations spiked at Anaheim. Also, the northeasterly

October 13, 2008 Exceptional Event
16
wind flows throughout the period, make it unlikely the smoke or ash from the fires contributed significantly to the PM10 measured at Anaheim. Crustal material from windblown dust was the primary component of the measured PM10, as confirmed by comparing with the PM2.5 measured on this day. Prescribed, agricultural or residential burning did not appear to have added any significant amount of PM10 to the concentrations measured in the Basin; these activities were not permitted on this day. The PM2.5 portion of PM10, which would indicate combustion sources, was very small throughout the Basin. PM10 was emitted from some BACM-controlled sources (mainly agricultural and construction activities) as BACM controls were locally overwhelmed by the high winds. Natural particulate sources areas also contributed to the measured PM10, particularly the upwind mountain and desert areas.
Was a Natural Event
According to the Exceptional Event Rule, ambient particulate matter concentrations due to dust being raised by unusually high winds will be treated as due to uncontrollable natural events where (1) the dust originated from non-anthropogenic sources, or (2) the dust originated from anthropogenic sources within the State that are determined to be reasonable well controlled at the time the event occurred, or from anthropogenic sources outside the State. Based on previous analyses of windblown dust in the Coachella Valley and the Basin, wind gusts over 22 mph are sufficient to entrain windblown dust in the atmosphere. In the preamble to the Exceptional Events Rule, EPA also explains states must provide appropriate documentation to substantiate why the level of wind speed associated with the event in question should be considered unusual for the affected area during the time of year that the event occurred. On average, the strong wind conditions that lead to PM10 exceedances due to high wind natural events occur less than three times per year, for the entire South Coast Air Basin. EPA also notes in the Exceptional Event Rule that natural events (e.g., high winds, wildfires, etc.) may recur, sometimes frequently. The event on October 13, 2008 was a natural event in which human activity played little or no direct causal role. A portion of the wind-entrained dust originated from anthropogenic sources, including some agricultural operations and construction activities, that are well controlled in the Basin as described in Section 1.5, Regulatory Measures.
The analysis of the meteorological setting, including weather charts, pressure gradients and satellite imagery, indicates the potential for very strong winds in the Basin on October 13, 2008. Wind speeds in and the Basin, including in Orange Riverside and San Bernardino Counties upwind of Anaheim were very high throughout the morning on this day causing high PM10 concentrations at Anaheim. Anaheim lies downwind of a geographic corridors for Santa Ana wind events, were windblown particulates are most likely. This first Santa Ana wind event of the season

October 13, 2008 Exceptional Event
17
brought unusually strong winds. Soil moisture was very dry due to rainfall well below normal for the year to date, providing dust to blow and contributing to the wildfire potential. Sustained high wind speeds that were recorded at National Weather Service (NWS) weather stations reached: 55 mph at the Chilao RAWS station in the Los Angeles County mountains; 48 mph at the Freemont Canyon RAWS in the Santa Ana Mountains of Orange County; 40 mph at Corona Airport in Riverside County; 29 mph at Chino Airport in San Bernardino County; 37 mph at Ontario International Airport in San Bernardino County; 36 mph at the Malibu Hills RAWS in coastal Los Angeles County; and 26 mph at the Santa Ana – John Wayne Airport in Orange County. As was noted previously, significantly higher wind gusts were also measured through the day with peak gusts to over 87 mph recorded in the mountains of both Los Angeles and Orange Counties. The weather observations support the presence of windblown dust through the morning with blowing dust and visibilities as low as 1.75 miles reported. In addition, NWS forecast discussions and wind warnings, NCDC storm event record reports and newspaper articles also describe strong winds and blowing dust in southern California, providing substantial weight-of-evidence for the sequence of events.
Causal Connection
This documentation shows a clear causal connection between the PM10 measured at the AQMD air monitoring stations and the high winds on October 13, 2008. The winds in the Basin increased in the morning, causing increased hourly PM10, as measured with the available TEOM PM10 monitors. The causal connection is demonstrated by the dramatic increase in hourly PM10 concentrations that coincided with the transport of dust entrained by strong, gusty winds. This is illustrated well in Figure 2-6.
Concentration was in Excess of Normal Historical Fluctuations
The 199 μg/m3 24-hour PM10 concentration measured at Anaheim on October 13, 2008 is higher than the 99.5 percentile value of 139.5 μg/m3 for all South Coast Air Basin FRM measurements since 1990, as shown previously in Section 1.6, Figure 1-4. Concentrations above the 97.5 percentile value (101.0 µg/m3 and above) are outside the normal range of the data. Therefore any value that exceeds the 24-hour federal PM10 standard of 150 µg/m3 is clearly in excess of the normal historical fluctuations of data for the Basin. All concentrations exceeding the federal 24-hour PM10 standard in the Basin since at least January 1, 2000 can be attributed to events that would quality as exceptional events, as was shown previously in Table 1-1. The 199 μg/m3 Anaheim concentration measured on October 13, 2008 is the second highest valid PM10 24-hour concentration measured at Anaheim since before 2000 and it is clearly in excess of

October 13, 2008 Exceptional Event
18
normal historical fluctuations. With the exception of the FRM sample from the October 21, 2007 high wind event, no other days exceeded the PM10 24-hour NAAQS at Anaheim during that period of 10 years.
The “But For” Test
To qualify as an exceptional event, it is necessary to demonstrate that there would have been no exceedance “but for” the event. To meet this “but for” requirement, it must first be shown that no unusual anthropogenic activities occurred in the affected area that could have resulted in the exceedances, besides the high wind event. Activities that generate anthropogenic PM10 were approximately constant in the Basin immediately preceding, during and after the event. Activity levels in the Basin were typical for the time of year and PM10 emissions control programs were being implemented, not only for fugitive dust-generating activities, but also for agricultural burning in the Basin. Furthermore, due to the forecasts for high winds on October 13, the AQMD compliance teams were ready to act quickly to fugitive dust complaints to minimize emissions and to enforce mitigation methods like watering and soil stabilization.
Vehicular traffic, cooking and residential fires do not directly cause PM10 24-hour NAAQS violations in the Basin. Activity levels in the Basin were typical for the time of year and PM10 emissions control programs were being implemented, for fugitive dust-generating activities, as well as open burning. With the unsettled conditions on October 13, such emissions would not contribute significantly to the PM10 measured. There were reasonable and appropriate measures in place to control PM10 in the Basin on October 13, 2008, including AQMD Rules 403, 444, 445, 1156, 1157, 1158 and 1186. Moreover, EPA has approved AQMD’s BACM demonstration for all significant sources of PM10 in the Basin.
Examining the make-up of the PM10 in the Basin on this day using PM2.5 data, the coarse particles (PM10-2.5), which are associated with windblown dust, represent well over 75% of the total PM10 mass collected in the Basin. The three wildfires that were burning in the Basin, one of which started on October 12 and two other after the high hourly PM10 concentrations started, were not the primary cause of the high PM10. PM2.5 remained relatively low throughout the Basin on this day with no exceedance of the 24-hour NAAQS. While there were no PM10 filters collected on this day for laboratory analyses for soluble potassium, an indicator of wood smoke, the predominance of coarse particles, the timing of the fires and the lack of supporting wind directions to bring smoke to Anaheim provide support the conclusion that while there could have been a minor contribution from the wildfires, it was relatively small portion of the PM10 measured.
October 13, 2008 Exceptional Event
19
Based on the data provided in this report, AQMD concludes that there would not have been exceedances of the PM10 NAAQS in the Basin on October 13, 2008 if high winds were not present. Even if the extreme 99.5 percentile concentration for the Basin, 139.5 μg/m3, were used as the background concentration to compare to the measured PM10 concentrations, the particulate contribution from the high wind event clearly caused these exceedances. The causal connection of the measured PM10 and the strong winds in the Basin, and throughout southern California, along with the high contribution of fugitive dust to the PM10 mass indicate that but for the high wind event this NAAQS violation would not have occurred.
Reasonable Measures
AQMD issued daily air quality forecasts on October 12 and 13, 2008, each valid for the following day, with same-day updates. The air quality forecast for October 13 issued in the morning of October 12 warned of high-Moderate and Unhealthy for Sensitive Groups Air Quality Index (AQI) levels due to windblown dust in the favored areas through and below canyons and passes. The same-day forecast update issued in the morning of October 13 warned the public of the air quality in the Basin and the Coachella Valley that was predicted to reach the Unhealthy for Sensitive Groups AQI level in 25 forecast areas and the Unhealthy AQI level in four forecast areas, due to increased PM10 particulates in association with the windblown dust and increased PM2.5 in the vicinity of the wildfires (see Appendix, Section A.10). Good ventilation and deep afternoon mixing were predicted for the Basin and, given the time of year, air quality would be expected to be in the Good range, except for the wind event and the fires.
AQMD issued a Smoke Advisory for degraded air quality (Appendix, A.10) on October 12 due to the Marek Fire. In the morning of October 13, AQMD issued a Smoke and Windblown Dust Advisory for the ongoing wildfire and the windblown dust and that had already been measured early in the morning. Smoke Advisories were issued through the next week as new fires started in the following days and wildfire smoke continued to impact the Basin. AQMD encourages public awareness of the health impacts of particulate matter through the AQMD website, informational brochures, public meetings and conferences, and press releases. Real-time air quality data, AQI maps and daily air quality forecasts and episode notifications are available through the AQMD website (http://www.aqmd.gov) and through the Interactive Voice Response (IVR) telephone system (1-800-CUT-SMOG). Forecasts and air quality notifications can be received by email (http://aqmd.enviroflash.info/) or by FAX and many schools, recreational facilities, sports organizations and individuals subscribe to these services. AQMD forecasts and current data are also available through the U.S. EPA AirNow system (http://www.airnow.gov) and data is available through the California Air Resources Board website (http://www.arb.ca.gov/aqd/aqdpage.htm).

October 13, 2008 Exceptional Event
20
Public Notification
The South Coast Air Quality Management District (AQMD) has prepared this documentation to demonstrate that this exceedance was due to high-wind natural events, in accordance with the EPA Exceptional Event Rule. Upon transmittal of this document to the California Air Resources Board (ARB), this document will be posted on the AQMD website for public hearings, notices and meetings (http://www.aqmd.gov/pubinfo/public_notices.htm), requesting review and comment by the public for a minimum of 30 days. Public comments should be directed to:
Mr. Kevin Durkee, Senior Meteorologist South Coast Air Quality Management District 21865 Copley Drive, Diamond Bar, CA 91765 Email: [email protected].

October 13, 2008 Exceptional Event
21
Checklist of Exceptional Event Requirements
AQMD Flagging of Data
Exceptional Event Criteria Summary:
Affects Air Quality
Is Not Reasonably Controllable or Preventable
Was a Natural Event
Causal Connection
Concentration in Excess of Normal Historical Fluctuations
The “But For” Test
Reasonable Measures
Public Notification *
* This document will be posted on the AQMD website for a 30 days public comment period

October 13, 2008 Exceptional Event
22
2.2 Detailed Event Analysis
PM Summary
On October 13, 2008, the FEM TEOM PM10 sampler at Anaheim measured high concentrations for several consecutive hours in the morning, causing an exceptionally high 24-hour average concentration of 199 μg/m3 for the day (midnight to midnight). Table 2-1 summarizes the hourly and 24-hour averaged continuous PM10 concentrations at Anaheim and the nearby Long Beach and Central Los Angeles stations on October 12 and 13. Figure 2-1 shows this data graphically from 1200 PST on October 12 through October 13, and also includes the Rubidoux and Lake Elsinore stations in Riverside County and the San Bernardino station in San Bernardino County. As compared to the previous day, the hourly PM10 at Anaheim on October 13 was elevated from the start of the day and first reached over 150 μg/m3 for the 0300 PST hour. The concentrations remained over 150 μg/m3 through the 1000 PST hour, with a peak of 767 μg/m3 during the 0900 PST hour. The hourly PM10 concentrations were somewhat elevated through the rest of the day, but did not exceed 150 μg/m3.
At Long Beach, the nearest monitoring station to Anaheim, the TEOM peaked during the same time period, but only exceeded 150 μg/m3 for five hours with a peak of 386 μg/m3 and no 24-hour NAAQS violation. Central Los Angeles also peaked to 266 μg/m3 during this period, but only exceeded 150 μg/m3 for two hours with no 24-hour violation. Lake Elsinore and San Bernardino and, to a lesser extent, Rubidoux, also had PM10 spikes during the same morning period. Unlike the Orange and Los Angeles County stations, the inland Empire stations also had elevated concentrations with gusty winds in the afternoon. None of these stations exceeded the 24-hour NAAQS, although San Bernardino was close with midnight-to-midnight averaged concentration of 144 μg/m3.

October 13, 2008 Exceptional Event
23
TABLE 2-1
Hourly BAM and TEOM PM10 Measurements at the AQMD Anaheim, Long Beach and Central Los Angeles Air Monitoring Stations Between 0000 PST October 12 and 1200 PST October 14, 2008
Anaheim Monitoring Station Long Beach Monitoring Station Los Angeles Monitoring Station DATE HOUR
(PST) TEOM Hourly
PM10 (μg/m3)
24-Hour PM10 (μg/m3)(midnight to midnight)
TEOM Hourly
PM10 (μg/m3)
24-Hour PM10 (μg/m3)(midnight to midnight)
BAM Hourly PM10 (μg/m3)
24-Hour PM10 (μg/m3)(midnight to midnight)
10/12/08 0000 28 45.0 36 28.9 29 37.4 0100 31 28 62 0200 21 15 50 0300 23 24 25 0400 25 26 29 0500 45 27 20 0600 102 24 13 0700 113 30 39 0800 139 29 102 0900 76 24 72 1000 48 35 55 1100 24 23 71 1200 21 26 57 1300 8 29 58 1400 32 28 54 1500 28 31 16 1600 40 42 0 1700 37 35 0 1800 33 30 6 1900 36 30 3 2000 42 30 24 2100 28 29 22 2200 51 31 32 2300 48 31 59
10/13/08 0000 98 199.1 28 124.4 28 85.4 0100 121 28 32 0200 114 31 27 0300 249 36 22 0400 296 100 39 0500 329 248 55 0600 579 308 107 0700 519 386 225 0800 566 368 266 0900 767 213 137 1000 273 135 99 1100 137 115 90 1200 99 79 118 1300 58 68 128 1400 44 78 119 1500 126 80 96 1600 48 97 68 1700 38 101 65 1800 40 89 47 1900 44 82 40 2000 48 86 56 2100 90 69 72

October 13, 2008 Exceptional Event
24
TABLE 2-1 (continued) Hourly BAM and TEOM PM10 Measurements at the AQMD Anaheim,
Long Beach and Los Angeles Air Monitoring Stations Between 0000 PST October 12 and 1200 PST October 14, 2008
Anaheim Monitoring Station Long Beach Monitoring Station Los Angeles Monitoring Station DATE HOUR
(PST) BAM Hourly PM10 (μg/m3)
24-Hour PM10 (μg/m3)(midnight to midnight)
BAM HourlyPM10 (μg/m3)
24-Hour PM10 (μg/m3)(midnight to midnight)
BAM Hourly PM10 (μg/m3)
24-Hour PM10 (μg/m3)(midnight to midnight)
2200 56 77 60 2300 39 83 53
10/14/08 0000 31 55.9 76 52.9 62 74.5 0100 34 57 74 0200 65 55 94 0300 53 50 85 0400 49 51 73 0500 76 55 84 0600 69 79 87 0700 104 88 100 0800 52 80 168 0900 46 58 127 1000 46 57 113 1100 42 44 117
1200 36 27 87

October 13, 2008 Exceptional Event
25
FIGURE 2-1
Time Series of Hourly BAM/TEOM FEM PM10 (µg/m3) from 1200 PST October 12 through October 13, 2008
Table 2-2 shows the daily 24-hour averaged PM10 concentrations from FRM (SSI) and BAM or TEOM continuous measurements for air monitoring stations in the Basin with available data between October 9 and 16, 2008. The AQMD FRM PM10 filter samples are collected on a 1-in-6 day schedule, except at Riverside-Rubidoux and Indio where 1-in-3 day data is collected. The only exceptionally high PM10 concentration measured during this period throughout the South Coast Air Basin was the 199 μg/m3 TEOM PM10 on October 13 at Anaheim. However, several other areas of the Basin had elevated PM10 concentrations, indicating that those areas that are prone to high winds during Santa Ana events were also affected by this wind event. The FEM PM10 concentrations at Anaheim on October 13 at were up to 4 times that measured on the sampling days before and after that day. This indicates the impact of the natural event on the October 13 PM10 air quality, resulting in the higher than typical PM10 concentrations above the federal standard level at Anaheim. Figure 2-2 shows the BAM/TEOM daily 24-hour average concentrations for the Basin monitoring sites for the
0
100
200
300
400
500
600
700
800
900
12 13 14 15 16 17 18 19 20 21 22 23 0 1 2 3 4 5 6 7 8 9 10 11 12 13 14 15 16 17 18 19 20 21 22 23
PM10
(µg/
m3 )
Time (PST)
Long Beach TEOM Los Angeles BAM Anaheim TEOM
Rubidoux TEOM Lake Elsinore TEOM San Bernardino TEOM

October 13, 2008 Exceptional Event
26
period October 6 through October 20, 2008 (a week before and after October 13), illustrating the concentration peaks at all locations on October 13, 2008 due to the high winds.
TABLE 2-2
24-Hour SSI and BAM PM10 Measurements (μg/m3) for Anaheim and Nearest South Coast Air Monitoring Stations (Mission Viejo, Los Angeles, Long Beach)
Before and After October 13, 2008
Monitoring Site 24-Hour PM10 (μg/m3) Date (2008)
Station Type 9-Oct 10-Oct 11-Oct 12-Oct 13-Oct 14-Oct 15-Oct 16-Oct
Anaheim PM10 SSI FRM 38 46
Anaheim PM10 BAM 36.8 24.7 45.0 199.1 55.9 43.7 45.4
Mission Viejo PM10 SSI FRM 38 17
Mission Viejo PM10 BAM
Los Angeles PM10 SSI FRM 43 36
Los Angeles PM10 BAM 64.1 34.8 37.4 85.4 74.5 52.3 53.9
Long Beach PM10 SSI FRM 32 45
Long Beach PM10 BAM 45.6 26.9 28.9 124.4 52.9 37.4 37.1

October 13, 2008 Exceptional Event
27
FIGURE 2-2
BAM/TEOM Daily 24-Hour PM10 Concentrations (µg/m3) Measured in the South Coast Air Basin between October 6 and October 20, 2008
Table 2-3 shows BAM and FRM 24-hour PM2.5 measurements from October 7 through 19, 2008, at stations throughout Los Angeles and Orange Counties in the Basin. The PM2.5 concentrations were relatively low on October 13, with Anaheim measuring the FRM and BAM PM2.5 concentrations of 10.0 and 25.0 μg/m3, respectively. No stations in the Basin exceeded the 35 μg/m3 24-hour PM2.5 NAAQS on October 13, or for three days before and after that date, even with fires in the northern San Fernando Valley and later at Camp Pendleton in San Diego County. This is because the offshore winds blew the smoke toward the west and offshore. The 24-hour BAM PM2.5 on October 9 exceeded the NAAQS at Los Angeles and Burbank, with smoke from a fire at Camp Pendleton in San Diego County on that day that was transported to the north by a coastal eddy offshore. In addition, persistent dense fog through the morning caused some suspect high BAM and TEOM PM2.5 readings; note that the FRM PM2.5 at those stations was much lower on October 9.
0
20
40
60
80
100
120
140
160
180
200
10/6 10/7 10/8 10/9 10/10 10/11 10/12 10/13 10/14 10/15 10/16 10/17 10/18 10/19 10/20
24-H
our A
vera
ge C
onc.
, µg/
m3
DateAnaheim Long Beach Los Angeles GlendoraRubidoux Lake Elsinore Fontana San Bernardino
Federal
October 13

October 13, 2008 Exceptional Event
28
The relatively low PM2.5 measurements on October 13 provide evidence that the high PM10 measured at Anaheim was due to coarse particles, with a relatively small contribution from smoke and other fine particles in the PM2.5 size range. By comparing the 24-hour PM10 and PM2.5 mass from the same stations, the percentage of PM10 attributed to PM-Coarse (PM10-2.5) is high on October 13 and higher than the surrounding days (Table 2-4). PM-Coarse accounts for 87 percent of the Anaheim PM10, indicating that the source of the high PM10 throughout the Basin on October 13 was primarily crustal material due to windblown dust and not combustion related particles.

October 13, 2008 Exceptional Event
29
TABLE 2-3 24-hour FRM and BAM PM2.5 Measurements in Los Angeles and Orange Counties between
October 7 and October 19, 2008 (concentrations exceeding 35 μg/m3 are highlighted in bold type)
Monitoring Site 24-Hour PM2.5 (μg/m3) Date (2008)
Location Type Oct. 7
Oct. 8
Oct.9
Oct.10
Oct.11
Oct.12
Oct.13*
Oct.14
Oct. 15
Oct. 16
Oct.17
Oct.18
Oct.19
Anaheim FRM 12.6 17.9 13.6 6.5 7.4 10.0 9.2 9.9 11.6 14.8 Anaheim BAM 23.5 24.6 33.6 27.9 18.0 19.0 25.0 27.2 22.9 16.4 18.3 17.1 16.8 Central Los Angeles FRM 10.4 15.5 18.5 12.6 3.4 7.3 13.0 20.8 11.5 12.8 14.7 12.4 17.0 Central Los Angeles BAM 20.3 27.8 36.4 31.4 11.4 13.0 18.5 31.7 22.1 16.5 18.0 18.4 23.0 Lynwood FRM 17.2 9.7 16.8 10.4 Pico Rivera FRM 17.0 8.1 12.8 14.0 Burbank FRM 16.6 7.0 9.6 14.2 Burbank BAM 21.4 24.6 36.0 28.9 15.5 18.0 18.2 31.5 24.8 15.0 17.0 19.4 23.0 Reseda FRM 16.5 3.3 10.3 10.6 Pasadena FRM 16.0 6.6 3.3 12.1 Azusa FRM 6.3 8.5 19.8 14.3 3.8 11.1 14.5 17.3 Glendora BAM 4.9 5.9 21.0 16.4 3.5 3.4 6.0 11.2 6.8 7.5 11.4 17.4 17.2 North Long Beach FRM 13.0 14.7 16.5 13.0 5.8 9.2 17.2 16.8 14.8 13.5 14.5 9.2 13.1 South Long Beach FRM 12.4 14.6 11.5 5.0 8.0 15.0 17.4 15.8 15.5 16.7 8.8 13.9 Mission Viejo FRM 17.5 6.5 5.4 9.3
* October 13 was not a scheduled 1-in-3 FRM PM2.5 sampling day. Central Los Angeles, North Long Beach, South Long Beach and Anaheim FRM samplers measure every day.
TABLE 2-4
Percentage of 24-Hour PM10 Attributed to PM-Coarse (PM10-2.5) from Collocated BAM/TEOM Measurements between October 6 and October 19, 2008
Monitoring Site 24-Hour PM-Coarse (PM10-PM2.5)/PM10 (%) Date (2008)
Location Type Oct. 7
Oct. 8
Oct. 9
Oct.10
Oct.11
Oct.12
Oct.13
Oct.14
Oct. 15
Oct. 16
Oct.17
Oct.18
Oct.19
Anaheim BAM 29.2 38.6 22.6 24.2 27.2 57.8 87.4 51.4 47.6 63.9 58.4 45.1 39.7 Central Los Angeles BAM 54.2 48.8 38.4 51.1 67.3 69.4 57.5 57.8 69.4 70.5 58.7 50.5

October 13, 2008 Exceptional Event
30
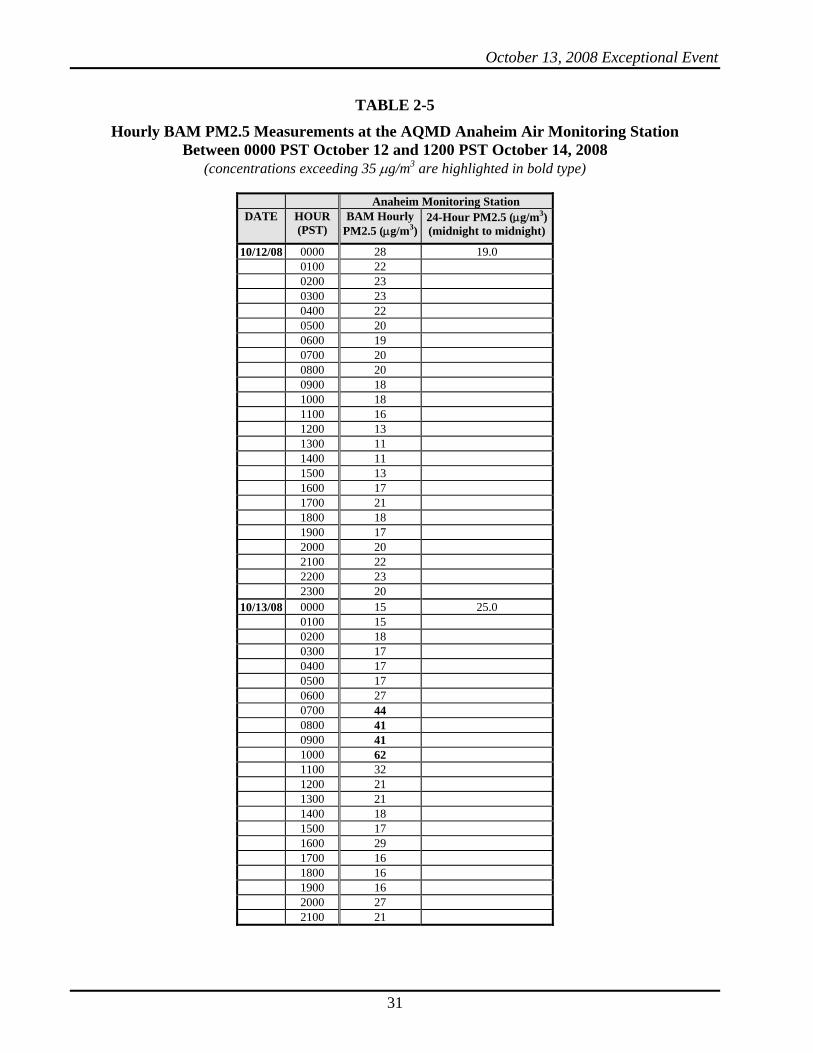
Since October 13 was not a 1-in-6 routine FRM filter sampling day, no speciated chemical analysis of the sulfate, nitrate and chloride components of PM10 filter is available on this day. Likewise, no potassium or other smoke indicators could be analyzed to gain additional insight on the smoke contribution. Table 2-5 shows the hourly BAM PM2.5 concentrations at Anaheim. The hourly PM2.5 values increased to greater than 35 μg/m3 for four hours from 0700 through 1000 PST in the morning of October 13. The hourly BAM PM2.5 peaked at 62 μg/m3 at 1000 PST, when the PM10 concentration was 273 μg/m3. At this time the PM10 was still 77% coarse particles. This is consistent with the period of high PM10 when the windblown dust increased the PM10, but PM2.5 remained a small fraction of the hourly PM10 throughout the day. While smoke from the fire that started the previous day in the northern San Fernando Valley may have contributed to the PM10 NAAQS violation, it is unlikely that the smoke contribution was significant.
October 13, 2008 Exceptional Event
31
TABLE 2-5
Hourly BAM PM2.5 Measurements at the AQMD Anaheim Air Monitoring Station Between 0000 PST October 12 and 1200 PST October 14, 2008
(concentrations exceeding 35 μg/m3 are highlighted in bold type)
Anaheim Monitoring Station DATE HOUR
(PST) BAM Hourly
PM2.5 (μg/m3)24-Hour PM2.5 (μg/m3)(midnight to midnight)
10/12/08 0000 28 19.0 0100 22 0200 23 0300 23 0400 22 0500 20 0600 19 0700 20 0800 20 0900 18 1000 18 1100 16 1200 13 1300 11 1400 11 1500 13 1600 17 1700 21 1800 18 1900 17 2000 20 2100 22 2200 23 2300 20
10/13/08 0000 15 25.0 0100 15 0200 18 0300 17 0400 17 0500 17 0600 27 0700 44 0800 41 0900 41 1000 62 1100 32 1200 21 1300 21 1400 18 1500 17 1600 29 1700 16 1800 16 1900 16 2000 27 2100 21

October 13, 2008 Exceptional Event
32
TABLE 2-5 (continued) Hourly BAM PM2.5 Measurements at the AQMD Anaheim and Los Angeles
Between 0000 PST October 12 and 1200 PST October 14, 2008
Anaheim Monitoring Station DATE HOUR
(PST) BAM Hourly
PM2.5 (μg/m3)24-Hour PM2.5 (μg/m3)(midnight to midnight)
2200 26 2300 27
10/14/08 0000 20 27.2 0100 19 0200 14 0300 29 0400 30 0500 28 0600 32 0700 28 0800 29 0900 23 1000 23 1100 20 1200 16

October 13, 2008 Exceptional Event
33
Meteorological Setting
An upper level trough of low pressure moved through California, between October 9 and 11. The low pressure system did not create much rain in California during this period, but temperatures were cool throughout the state. By Sunday, October 12, the backside of the trough was over California, providing upper level support for a developing strong Santa Ana wind event. The strong pressure gradients that developed between the high and low pressure aloft created strong winds. The National Weather Service (NWS) 500 millibar (MB) analyses every 12 hours between 0400 PST on October 12 and 0400 PST on October 14 are shown in the Appendix, Section A.11. The winds over California at the 500 MB pressure level started out northwesterly in the morning of October 12 with speeds to 81 mph (70 knots), then became more northerly by the morning of Monday, October 13 with speeds to 57 mph (50 knots). The strong northerly flows aloft allowed coupled with strong northeasterly surface pressure gradients, to enhance the offshore surface flows.
The passage of the low pressure trough aloft brought the first strong cold front of the season at the surface. Section A.12 in the Appendix shows the NWS sea-level pressure analyses, every three hours between 1600 PST on October 12 and 0100 PST on October 14. By 1600 PST October 12, the surface low and cold front was over the northeastern border of New Mexico and high pressure was building over northern Nevada, increasing the northerly gradients. By 0100 PST on October 13, the high pressure over Nevada had increased to 1033 MB, strengthening the gradient flows across California. By 0700 PST, the area of high pressure had expanded and peaked at 1037 MB. The strength of the high pressure remained nearly the same through the rest of the day, while the broad area of high pressure slowly moved to the east, causing the winds to shift from northerly to northeasterly, then easterly throughout the day. The strong pressure gradients caused strong winds, especially in southern California as the flow of cold air from the area of high pressure further enhanced the winds as it flowed across the mountains. Some gusty winds had already been observed on October 12, but they increased considerable in the early morning of October 13.
This is the classic Santa Ana wind pattern that brings strong winds to southern California. High pressure builds over the Great Basin in the cold air behind the front with lower pressure off the southern California coast. This pressure gradient creates strong north through northeasterly winds, enhanced by thermal gradients due denser cold air over the Great Basin. The relatively cool air from the Great Basin deserts flows over the southern California mountains, gaining momentum on the lee side. The downslope flow causes compressional warming and drying of the air in the Basin. This combination of strong wind, high temperatures and low relative humidities make these Santa Ana conditions highly conducive to wildfires in southern California.
The National Weather Service had predicted this first strong Santa Ana event of the season well in advance and Governor Schwarzenegger issued a press release on October

October 13, 2008 Exceptional Event
34
10 to prepare the state for Santa Ana winds and the associated wildfire potential (see Appendix A.7).
The surface winds on October 13 started out northerly in the morning, shifting to the northeast through the day and more easterly by the end of the day as the surface high pressure shifted eastward behind the trough. Temperatures in southern California on October 13 were warm for this time of year, reaching the low 80˚F range even along the coast. The air was very dry, especially in the windy areas; relative humidities in the Basin fell into the teens even in coastal areas. One wildfire started on October 12 and two more would start throughout the day on October 13. Although lighter, the offshore winds continued for the next few days and the temperatures increased further. With hot, dry conditions contributing to the growth of these wildfires and others over the next several days, the largest fires were not controlled for nearly two weeks.
The AQMD Meteorology Section routinely analyzes sea-level pressure gradients in southern California to assess winds and air pollution potential. The Summation Pressure Gradient (SPG) is a good indicator of the strength of the flow and whether it is onshore (positive) or offshore (negative), where
SPG = (SAN-LAS)2 + (LGB-DAG)3 + (RIV-DAG)4
In the morning of October 12, the 0700 PST SPG was -5.5 MB, indicating moderate offshore flow. At the same time in the morning of October 13, the SPG strengthened to -14.7 MB, indicating a moderate offshore gradient. The gradient was enhanced by the upper level pattern and thermal gradient as described above, to create a strong wind event, especially for several hours through the morning of October 13.
The AQMD Meteorology Section predicted high winds for October 13 in the Coachella Valley for AQMD Rule 403.1, which requires specific actions in this area when wind gusts exceed 25 mph. While there are no other AQMD rule requirements to forecast winds in the Basin, the daily forecast discussion by AQMD issued on October 12 for Monday, October 13 predicted the strong winds. A smoke advisory was already in effect in the morning of October 12 and the strong winds were prominent in the forecast discussion, as follows:
SMOKE ADVISORY for Sunday: Concentrations of fine particulates may reach Unhealthy for Sensitive Groups or higher in areas of Los Angeles County directly impacted by smoke from a wildfire in the Angeles National Forest north of Pacoima.
Monday will be mostly clear, windy and warmer as the offshore Santa Ana winds strengthen. Gusty winds through and below canyons and passes will cause elevated
2 Sea Level Pressure difference between San Diego and Las Vegas 3 Sea Level Pressure difference between Long Beach and Daggett 4 Sea Level Pressure difference between Riverside and Daggett

October 13, 2008 Exceptional Event
35
particulate concentrations due to windblown dust and possibly continued wildfire activity.
PM10 predictions were increased throughout the Basin for October 13 and agricultural and prescribed burning was prohibited with a No-Burn declaration for the entire Basin. AQMD issued a Smoke and Windblown Dust Advisory in the morning of October 13, reproduced in the Appendix, Section A.10, that warned of the likelihood of strong Santa Ana winds causing high PM10 concentrations in several areas of the Basin, including Central Orange County (Forecast Area 17, including Anaheim), as follows:
In addition, strong Santa Ana winds will likely cause PM10 concentrations to reach Unhealthy for Sensitive Groups concentrations or higher in areas throughout the Basin downwind of the winds areas. This includes any areas where windblown dust is visible, especially through and below passes and canyons, until the winds subside. Wind prone areas are likely to include: the San Bernardino Valley (Areas 32, 33, 34, 35), Riverside County Valleys (Areas 22, 23, 24, 25, 26), Orange County (Areas 16, 17, 18, 19, 20) and the Los Angeles County northern and southern coastal areas (Areas 2 and 4).
Temperature profiles through this period of high winds from the San Diego and Point Mugu radiosondes and the AQMD Radar Wind Profiler (RWP) Radio Acoustic Sounding Systems (RASS) indicate surface-based temperature inversions, which are common with offshore wind events. This allowed winds aloft to more readily mix to the surface.
The Appendix to this document (Sections A.2 through A.6) contains the forecast discussions, short-term forecasts (nowcasts), fire weather forecasts, warnings and significant wind reports, as available from the NWS Los Angeles/Oxnard and San Diego Forecast Offices, whose areas of responsibility cover the Basin and much of southern California. These show that the strong Santa Ana wind event was well predicted in advance, warning the public of potentially damaging winds and windblown dust and sand, along with reduced visibilities.
NWS advisories and warnings for high winds (Appendix, Section A.5) were already in place on October 12, extending through Tuesday, October 14, or longer. A Wind Advisory is issued by NWS when sustained winds of 30 to 39 mph are expected for 1 hour or longer. A High Wind Warning is issued when sustained winds of 40 mph or more are expected for 1 hour or longer, or for wind gusts of 58 mph or more with no time limit. NWS Oxnard issued High Wind Warnings on October 12, extending through the period for the Los Angeles and Ventura County Mountains and Wind Advisories for the Santa Monica Mountains, the Ventura County coastal and interior valleys, the Santa Clarita Valley, the Los Angeles County San Fernando Valley, and the Ventura and Los Angeles County coasts, including Downtown Los Angeles. NWS San Diego issued High Wind Warnings for the San Bernardino and Riverside County valleys (Inland Empire) and the Santa Ana mountains and foothills and Wind Advisories for the San Bernardino County mountains, Orange County coastal areas, the Riverside County

October 13, 2008 Exceptional Event
36
mountains, the San Diego County mountains, and the San Diego County valleys, In short, High Wind Advisories and Warnings were in place for most of the South Coast Air Basin and much of southern California to warn the public of this high wind event. Northeasterly winds with sustained speeds in the 35 to 45 mph range were predicted throughout the region, along with damaging gusts to 70 mph, especially in the mountains and below passes and canyons in the Inland Empire. Hazardous driving conditions were predicted, especially through and below canyons and passes, as well as blowing dust and sand with reduced visibility, broken tree limbs and downed power lines.

October 13, 2008 Exceptional Event
37
Wildfire Analysis
Three significant wildfires burned in Southern California on October 13. The Marek Fire had started at approximately 0100 PST on Sunday, October 12 in the Angeles National Forest in Little Tujunga and Kagel Canyons and Lakeview Terrace (north of the San Fernando Valley in Los Angeles County). In the morning of October 13 the Skyview Terrace Mobile Home Park burned, destroying 38 residences and damaging 6 others. In Dexter Canyon two residences were destroyed and two more were damaged. In Lower Lopez Canyon, one residence was damaged, two commercial buildings were destroyed and another damaged. When it was contained on October 16, 4,824 acres had burned.
The Sesnon Fire started at approximately 0930 PST in the morning of October 13 on Oat Mountain north of Porter Ranch, from a downed electrical distribution line. It quickly grew to the Twin Lakes and Indian Hills areas, crossing from Los Angeles County into Ventura County. When it was contained on October 18, 14,703 acres had burned, 15 residences and 63 outbuildings were destroyed and 11 residences were damaged. On October 13, Governor Schwarzenegger declared a State of Emergency in Los Angeles and Ventura Counties due to these wildfires.
The Juliet Fire started at approximately 0949 PST on October 13 on the southeast portion of Camp Pendleton Marine Base, near Oceanside in San Diego County. This brush fire quickly burned 4,026 acres and was fully contained in the morning of October 14.
The fires burned hot initially, sending smoke high into the atmosphere to be blown offshore by the strong northeasterly Santa Ana winds. Air quality degradation measured by the AQMD air monitoring stations was small, but there were reports of smoke from the communities of the San Fernando Valley near the fires. AQMD issued Smoke Advisories starting on October 12 for nearly two weeks as these and other fires burned on the following days. These are can be found in the Appendix, Section A.10. Satellite imagery show the smoke being blown toward the west with the strong winds and out over the ocean on both October 12 and 13, with little recirculation apparent to Anaheim. While some contribution to the PM10 measured at Anaheim is possible from the smoke and ash from the fires, especially the Marek Fire that started on October 12, the Sesnon and Juliet fires did not start until after the peak hourly PM10 was measured.

October 13, 2008 Exceptional Event
38
Windblown Dust Analysis
Figure 2-3 shows the NASA MODIS Aqua high-resolution satellite image at approximately 1330 PST in the afternoon of October 12. Smoke in the image appears more white or grey while dust appears more brown. The offshore flow is clearly seen in this image in the smoke and dust blowing from the land over the ocean. Smoke is visible from the Marek fire, blowing from the northeast and over the ocean past Santa Catalina, San Nicolas and San Clemente Islands. Some windblown dust appears to be accompanying the smoke offshore. Some smoke is also evident from a fire north of Point Piedras Blancas near San Simeon. Windblown dust is evident offshore of Point Conception, San Diego County and Baja California.
FIGURE 2-3 NASA MODIS Aqua True Color Satellite Image near 1330 PST on October 12, 2008

October 13, 2008 Exceptional Event
39
Figure 2-4 shows the MODIS Terra satellite image from approximately 1030 PST in the morning of October 13. A more significant narrow plume of smoke and windblown dust is seen from the area of the Marek and Sesnon Fires, blowing toward the southwest over the California Bight and curling in the outer waters. A significant plume of windblown dust is visible, blowing to the southwest across San Pedro, Long Beach, Anaheim, and offshore to Santa Catalina Island. The hourly PM10 concentrations at Anaheim and other nearby stations peaked about an hour before this image. Smoke from the Juliet Fire in San Diego is not evident; that fire had just starting at this time. Any dust blowing in Riverside or San Bernardino County cannot be distinguished from the land background at this time.
FIGURE 2-4 NASA MODIS Terra True Color Satellite Image at approximately 1030 PST on October
13, 2008 Diagonal line through offshore due to composite of two passes

October 13, 2008 Exceptional Event
40
Figure 2-5 shows the MODIS Aqua satellite image from approximately 1330 PST in the afternoon of October 13, with the Marek and Sesnon fires mapped in red. The fires have grown considerably at this time and a long plume of smoke is blowing toward the southwest over Malibu and widening downwind in the California Bight. A windblown dust plume is still evident south of Long Beach, but it has widened and is not as dense as it was at 1030 PST, consistent with the reduction in wind speeds and PM10 measured in the Basin by this time. A faint, broad plume of smoke and windblown dust is evident off the coast near Camp Pendleton.
FIGURE 2-5 NASA MODIS Aqua True Color Satellite Image at approximately 1330 PST on October
13, 2008

October 13, 2008 Exceptional Event
41
The NWS offices in Oxnard and San Diego issued high wind warnings and wind advisories on October 12, continuing through the day on October 13 (Appendix, Sections A.2 through A.5). NWS routine METAR and RAWS weather stations reported extremely high peak wind gusts and sustained winds at numerous locations throughout the morning of October 13. Table 2-6 summarizes the highest winds of October 13. Complete weather observations through the period are listed in the Appendix, Section A.1. The winds were high throughout the day, but nearly all stations measured the highest speeds in the morning, near the time when the peak PM10 hourly values were measured in the Basin. As is typical of strong Santa Ana wind events, the highest wind speeds were in the San Gabriel and San Bernardino Mountains in the north part of the Basin, the Santa Monica Mountains, and the Santa Ana Mountains in Orange County, as well as the passes and canyons on the lee side of the mountains. The strongest gusts recorded on October 13 were 87 mph at both Chilao in the San Gabriel Mountains and Freemont Canyon in the Santa Ana mountains of Orange County, with sustained winds to 55 and 48 mph, at Chilao and Freemont Canyon, respectively.
Several of the METAR stations that report visibility and weather conditions noted reduced visibilities and either haze or blowing dust. The Ontario International Airport, in San Bernardino County below Cajon Pass, reported reduced visibilities down to 1.75 miles along with strong, gusty winds, haze and blowing dust between the 0153 and 1053 PST observation times. Chino Airport, upwind of Anaheim in southwestern San Bernardino County, reported restricted visibility to one mile with haze, dust and windblown dust, along with gusty winds between the 0253 PST and 1453 PST observations. Corona Airport, in Riverside County to the east of Anaheim, reported restricted visibility to 2.5 miles with haze between the 0456 and 1056 PST observations. Fullerton Airport, in Orange County to the north of Anaheim reported haze with visibilities as low as 4 miles between the 0453 and 0853 observations.

October 13, 2008 Exceptional Event
42
TABLE 2-6
Peak Wind Gusts and Sustained Wind Speeds (mph) Measured in Southern California on October 13, 2008 with Time of Occurrence (PST)
Station Location Peak
Wind Gust (mph)
Time of Peak Gust
(PST)
Peak Sustained Wind Speed
(mph)
Time (PST)
Chilao RAWS (Angeles National Forest) 87 0900 55 0900
Freemont Canyon RAWS (Santa Ana Mountains, Orange
County) 87 0900 48 0500
Malibu Hills RAWS (north coastal Los Angeles County) 79 0900 36 0700
Camp Nine RAWS (Angeles National Forest, Los
Angeles County) 73 0600
0800 32 0400
Warm Springs RAWS (north of Castaic, Los Angeles
County) 67 0200 40 0100
Leo Carrillo RAWS (north coastal Los Angeles County at
Ventura County border) 65 1000 25 0900
Whitaker Peak RAWS (LA County Mountains, south of
Pyramid Lake) 61 1000 37 0800
Ontario International Airport (San Bernardino County) 61 0700 37 0800
Corona Airport (Riverside County) 55 1016 40 0900
Newhall Pass RAWS (Santa Clarita area, Los Angeles
County) 53 1100
1300 26 1000
Saugus RAWS (Santa Clarita area, Los Angeles
County) 53 13 28 1100
Chino Airport (San Bernardino County) 51 1000 29 0900
Devore RAWS (near Cajon Pass, San Bernardino
County) 50 0500 25 1000
Sandberg (northern LA County Mountains,
near Gorman) 46 1100 31 0200
0500
Santa Ana – John Wayne Airport (Orange County) 41 0900 26 0200
0800 Riverside Municipal Airport
(Riverside County) 38 0900 18 0400 0800

October 13, 2008 Exceptional Event
43
Figure 2-6 shows the hourly TEOM data from the Anaheim air monitoring station, along with the wind speeds from Anaheim and the Freemont Canyon RAWS site in the Orange County Santa Ana Mountains. This clearly shows that the peak hourly PM10 concentrations occurred in the morning associated with the peak wind speeds and gusts. Note that while the Anaheim air monitoring station wind speeds are elevated at this time, all the Anaheim wind speeds are below 25 mph. This indicates that the PM10 was transported from the windier mountains passes and canyons and not locally generated in the immediate vicinity of the Anaheim station.
FIGURE 2-6 Hourly TEOM PM10 (µg/m3) from Anaheim with Hourly Winds Speeds (mph)
from Anaheim and the Freemont Canyon RAWs with Peak Hourly Gusts (Freemont) or Peak 1-minute Average Wind Speed Winds (Anaheim)
on October 13, 2008
0
100
200
300
400
500
600
700
800
900
0
10
20
30
40
50
60
70
80
90
0 1 2 3 4 5 6 7 8 9 10 11 12 13 14 15 16 17 18 19 20 21 22 23
Ana
heim
TEO
M PM10
(µg/m
3 )
Wind Speed (m
ph)
Time (PST)Anaheim Hourly TEOM PM10 Anaheim Hourly Wind SpeedAnaheim 1‐Minute Wind Speed Freemont Canyon RAWS Wind SpeedFreemont Canyon RAWS Gust

The AQclose toWhen inorthea(25 m/soperatioto near displayethroughclose todiminiseasterly
QMD Radaro Anaheim, t was resto
asterly winds) near 370on until 08063 mph (2ed graphica
h the lower o the coast hed somew
y with the S
Hourly
r Wind Prowas not op
ored at apprds were me0 feet abov00 PST. St8 m/s) at apally in Figuatmospherin Orange
what until thanta Ana w
y Winds Plot
ofiler (RWPperating on roximately easured throve ground ltarting at 0pproximateure 2-7. Itre in the ear
County. Ahe evening
wind conditi
FIGtted from th
on Oc
44
P) at Irvine,October 120730 PST ough the lolevel (1139800 PST Irely 3400 fet demonstrarly morningAfter 0900
g, although ions through
GURE 2-7he AQMD Ictober 13, 2
October
, the Orang2 or the earin the morn
ower atmos m AGL) f
rvine recordet AGL (10ates that thg, even at t
0 PST the hthey remaih the day.
Irvine Rada008
r 13, 2008 E
ge County urly morningning of Octsphere, peakfor the halfded hourly 000 m AGLhe winds althe Irvine uhourly profined and no
ar Wind Pro
Exceptional E
upper air stag of Octobetober 13, stking at 56 f-hour perioaveraged w
L). This daoft were st
upper air stafiler winds ortheasterly
ofiler
Event
ation er 13. trong mph
od of winds ata is trong ation aloft
y and

October 13, 2008 Exceptional Event
45
Much of the windblown dust generated in the mountains and deserts of Riverside and San Bernardino Counties, as well as the Santa Ana Mountains in Orange County, was deposited downwind, with the air monitoring stations through those counties all measuring elevated PM10 through the morning hours. Figure 2-8 shows the back trajectories calculated using the NOAA Hybrid Single Particle Lagrangian Integrated Trajectory (HYSPLIT) model with the 40 km grid resolution EDAS North American Model (NAM) meteorological data. Each chart shows the origin of the air mass over a 12-hour period that reached the Anaheim monitoring station, every hour on October 13 between midnight and 1200 PST when the winds and hourly PM10 concentrations were highest. The trajectories show that the air mass that impacted these stations initially came primarily from the north, over Nevada, shifting to come from the northeast over the mountains of southern California. The back trajectories also show the likelihood that windblown dust from the mountains and high deserts impacted the Basin stations, along with dust generated within the Basin from the gusty local winds.

October 13, 2008 Exceptional Event
46
FIGURE 2-8 24-Hour Back Trajectories Reaching the Anaheim Air Monitoring Stations every hour
between 0000 PST (0800 UTC) and 1200 PST (2000 UTC) October 13 from NOAA HYSPLIT Model using EDAS Meteorological Inputs
(HYSPLIT Use Agreement: http://www.ready.noaa.gov/ready/hysplit_agreement.html)

October 13, 2008 Exceptional Event
47
A survey of the AQMD complaint records and inspection reports for the Basin indicated no evidence of unusual particulate emissions on October 13, 2008, other than related to the windblown dust event. The complaints are summarized in Table 2-7 from the AQMD CLean Air Support System (CLASS) database for complaints and compliance actions. Due to the windy conditions, AQMD Compliance staff responded to 14 complaints related to windblown dust, including one in Anaheim. No Notices of Violation or Notices to Comply were issued in the Basin for fugitive dust violations on this day. The control methods were generally effective throughout the Basin, but were apparently overwhelmed in several instances by the strong, gusty winds, causing windblown dust and sand to be entrained in the atmosphere.
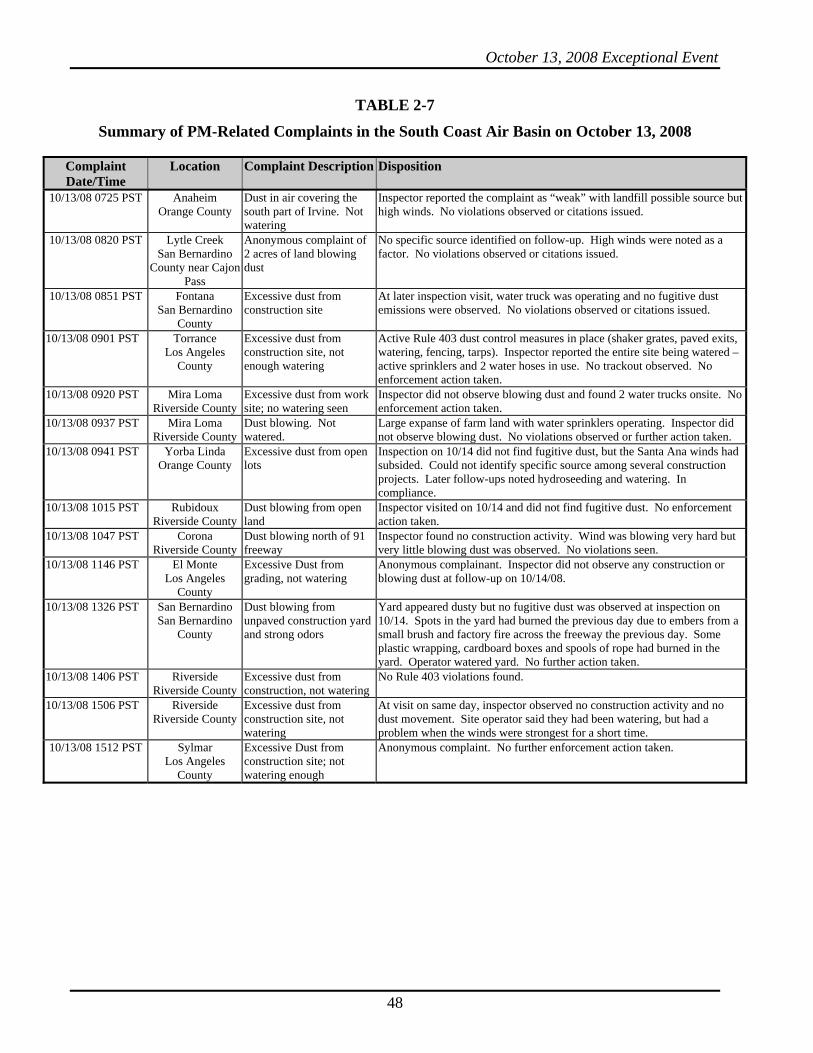
October 13, 2008 Exceptional Event
48
TABLE 2-7
Summary of PM-Related Complaints in the South Coast Air Basin on October 13, 2008
Complaint Date/Time
Location Complaint Description Disposition
10/13/08 0725 PST Anaheim Orange County
Dust in air covering the south part of Irvine. Not watering
Inspector reported the complaint as “weak” with landfill possible source but high winds. No violations observed or citations issued.
10/13/08 0820 PST Lytle Creek San Bernardino
County near Cajon Pass
Anonymous complaint of 2 acres of land blowing dust
No specific source identified on follow-up. High winds were noted as a factor. No violations observed or citations issued.
10/13/08 0851 PST Fontana San Bernardino
County
Excessive dust from construction site
At later inspection visit, water truck was operating and no fugitive dust emissions were observed. No violations observed or citations issued.
10/13/08 0901 PST Torrance Los Angeles
County
Excessive dust from construction site, not enough watering
Active Rule 403 dust control measures in place (shaker grates, paved exits, watering, fencing, tarps). Inspector reported the entire site being watered – active sprinklers and 2 water hoses in use. No trackout observed. No enforcement action taken.
10/13/08 0920 PST Mira Loma Riverside County
Excessive dust from work site; no watering seen
Inspector did not observe blowing dust and found 2 water trucks onsite. No enforcement action taken.
10/13/08 0937 PST Mira Loma Riverside County
Dust blowing. Not watered.
Large expanse of farm land with water sprinklers operating. Inspector did not observe blowing dust. No violations observed or further action taken.
10/13/08 0941 PST Yorba Linda Orange County
Excessive dust from open lots
Inspection on 10/14 did not find fugitive dust, but the Santa Ana winds had subsided. Could not identify specific source among several construction projects. Later follow-ups noted hydroseeding and watering. In compliance.
10/13/08 1015 PST Rubidoux Riverside County
Dust blowing from open land
Inspector visited on 10/14 and did not find fugitive dust. No enforcement action taken.
10/13/08 1047 PST Corona Riverside County
Dust blowing north of 91 freeway
Inspector found no construction activity. Wind was blowing very hard but very little blowing dust was observed. No violations seen.
10/13/08 1146 PST El Monte Los Angeles
County
Excessive Dust from grading, not watering
Anonymous complainant. Inspector did not observe any construction or blowing dust at follow-up on 10/14/08.
10/13/08 1326 PST San Bernardino San Bernardino
County
Dust blowing from unpaved construction yard and strong odors
Yard appeared dusty but no fugitive dust was observed at inspection on 10/14. Spots in the yard had burned the previous day due to embers from a small brush and factory fire across the freeway the previous day. Some plastic wrapping, cardboard boxes and spools of rope had burned in the yard. Operator watered yard. No further action taken.
10/13/08 1406 PST Riverside Riverside County
Excessive dust from construction, not watering
No Rule 403 violations found.
10/13/08 1506 PST Riverside Riverside County
Excessive dust from construction site, not watering
At visit on same day, inspector observed no construction activity and no dust movement. Site operator said they had been watering, but had a problem when the winds were strongest for a short time.
10/13/08 1512 PST Sylmar Los Angeles
County
Excessive Dust from construction site; not watering enough
Anonymous complaint. No further enforcement action taken.
October 13, 2008 Exceptional Event
49
Conclusion There is a strong causal connection between the high PM10 measured in the Basin on October 13 and the strong Santa Ana high wind event, supported by the meteorological conditions. An upper level trough and frontal system preceded the development of a strong pressure gradient between the high pressure that developed in the northwestern United States and the low pressure in southern California. This brought strong northerly winds in the evening of October 12 that shifted to northerly and easterly directions through the day on October 13 as the Great Basin high expanded eastward. The pressure gradients were very strong and extremely high wind gusts were measured throughout the day in the areas that favor northeasterly winds, especially the mountains surrounding the Basin and through and below canyons and passes. The synoptic weather pattern aloft and thermal structure also supported the strong Santa Ana wind event.
The 24-hour PM10 concentrations at Anaheim were extreme for this station and for the Basin, in the top 99.5 percentile of the Basin data. Peak wind gusts to 87 mph were recorded in the San Gabriel Mountains in Los Angeles County and Santa Ana Mountains in Orange County, with averaged sustained winds as high as 55 mph in the San Gabriel Mountains. Wind gusts in the low land areas of the Basin on the lee side of the mountains and upwind of Anaheim reached 61 mph at Ontario, 55 mph at Corona Airport and 41 mph at Santa Ana – John Wayne Airport. NWS observations of reduced airport visibilities, blowing dust, news accounts and National Climatic Data Center (NCDC) storm damage event reports also support the windblown dust analysis. Due to the widespread winds, sources of the windblown dust included both natural, undisturbed areas, particularly in the mountains and high deserts, and BACM-controlled anthropogenic sources. The timing of the this event is verified with the high wind observations and reports of reduced visibility and blowing sand and dust, in conjunction with the hourly TEOM PM10 measurements from available monitors. These show a strong correlation between the high winds and high hourly PM10 concentrations.
The strong winds on October 13 fanned a total of 3 wildfires. These were analyzed for their contribution to the PM10 measurements. Overall, the fires contributed only a small fraction to the PM10 measured as shown by the relatively low concentrations of PM2.5. The wind direction in relation to the fires and the timing of the fires in relation to the timing of the high hourly PM10 concentrations at Anaheim shows that it is unlikely that the smoke had a large impact at this station. The contribution of the larger crustal particles (PM-Coarse) was significantly greater than that from the smaller combustion particles (PM2.5). Much of the smoke on this day was blown offshore by the strong winds.
If not for the high wind event and the associated wind-entrained dust, the PM10 NAAQS violations measured at Anaheim on October 13 would not have occurred. Therefore, with the weight of evidence provided, AQMD staff recommends the flagging of the PM10 NAAQS violation on October 13, 2008 as an exceptional event due to high winds in the U.S. EPA Air Quality System (AQS) database.