analysis of education systems performance in european
TRANSCRIPT
Informatics in Education 2018 Vol 17 No 2 245ndash263copy 2018 Vilnius UniversityDOI 1015388infedu201813
245
Analysis of Education Systems Performance in European Countries by Means of PCA-DEA
Audrone JAKAITIENE Antanas ZILINSKAS Dovile STUMBRIENEInstitute of Data Science and Digital Technologies Vilnius universityAkademijos str 4 LT-08663 Vilniuse-mail audronejakaitiene antanaszilinskas dovilestumbrienemiivult
Received July 2018
Abstract Many countries have focused on the improvement of education system performance Small number of studies consider system of a country as unit of assessment where indicators represent all levels of education system In the paper we propose the methodology for the per-formance analysis of education systems as a whole hybridizing Data Envelopment Analysis and Principal Component Analysis Its applicability is illustrated by the analysis of the data collected for 29 European countries In the analysis we used publicly available data from EUROSTAT and OECD which European Commission uses for the performance monitoring of education in Euro-pean Union No prior assumptions were made or expert judgements included We demonstrated good performance of the method on limited data set The proposed methodology of hybrid Data Envelopment Analysis and Principal Component Analysis allows researchers analyse education systems quantitatively The recommendations for improvements and assessment of real world education systems should be based on the analysis of a sufficiently large data set comprehensively representing the considered education systems
Keywords data envelopment analysis principal component analysis education systems perfor-mance
1 Introduction
Performance assessment of education systems plays a vital role worldwide The Euro-pean Commission monitors the performance of education systems in Member States according the strategic framework ldquoEducation and Training 20201rdquo (ET2020) However the importance of performance of education systems are still underestimated The evalu-ation of schools is a widely researched topic but limited number of papers analyse the education sector as a whole (not only school level analysis) Also there are not so many
1 For more information httpseur-lexeuropaeulegal-contentENTXTuri=celex52009XG0528(01)
A Jakaitiene A Zilinskas D Stumbriene246
papers whose focus on multi-country comparisons (Witte and Loacutepez-Torres 2017) This topic is especially urgent because of structural reforms of education systems in the new EU countries Enlargement of the EU and accession of new member states in 2004ndash2013 was the beginning of the development of education systems in the new EU countries along the similar lines like in the Western countries Post-communist countries in Eu-rope after the structural reforms do not composed one type of education system and moved in different directions (Beblavy et al 2011 Želvys et al 2017) Taking into account that there is no one way to improve the education systems in all EU countries it is important to estimate the performance of each country and to provide guidelines that particular country should follow to improve her performance of education system As pointed out (Silva and Camanho 2017) measuring performance in absolute terms is often less valuable than making comparisons with other countries and provide examples of good education practices that under-performance countries should follow to improve their performance of education systems Data Envelopment Analysis (DEA) have been proved as appropriate for the analysis of different sectors of the education systems It is natural to investigate the applicability of DEA methodology to the analysis of an educa-tion system of a country as a whole
DEA proposed by Charnes Rhodes and Cooper (Charnes et al 1979) is a widely used technique to analyse relative performance of systems in a large variety of fields The original DEA model allows total exibility of the weights ie each decision mak-ing unit (DMU) maximizes its efficiency score given the inputs consumed and the outputs attained The exibility of the weightsrsquo selection is strength and weakness of a DEA as it allows some indicators to be assigned a zero weight Due to full exibility many DMUs will be able to achieve the maximum DEA efficiency score (Liu et al 2006) DEA loses discriminatory power when the number of indicators increase com-pared with the number of the DMUs Also the large dimension of the data set and correlations among indicators reduce the discrimination power of DEA and introduces bias (Nunamaker 1985 Dyson et al 2001) The first attempt to restrict the exibility of the weights and improve the discriminatory power of the DEA model was made by Thompson et al (Thompson et al 1990) They improved the discrimination between the DMUsrsquo efficiency scores by defining ranges of acceptable weights Assurance re-gions and Cone-ratio constraints are often used to restrict the weights and improve the discrimination power of the DEA These techniques requires prior information which is often difficult to attain (Adler and Golany 2001) For the increase of discriminatory power of DEA Torgersen et al proposed slack-adjusted efficiency measure for the ranking of efficient units (Torgersen et al 1996) The two-stage method did not use any prior information
Other way dealing with discrimination issue the dimension reduction of indicators before running DEA Principal components analysis (PCA) could be employed where original number of indicators would be replaced by smaller number of principal compo-nents with a minimal loss of information (Adler and Golany 2001) The idea to combine PCA and DEA was developed independently by Ueda and Hoshiai (Ueda and Hoshiai 1997) and Adler and Golany (Adler and Golany 2001 Adler and Golany 2002) They showed that PCA can improve discriminatory power in DEA which often fails when
Analysis of Education Systems Performance in European Countries by 247
there are too many of indicators in relation to the number of DMUs and give more reli-able efficiency measurement in small samples
The use of PCA-DEA approach for performance assessment can be found in different fields (aviation (Adler and Golany 2001) manufacturing (Azadeh et al 2007 Potildeldaru et al 2014) logistics (Andrejić et al 2013 Chen et al 2016 Jiang and Fu 2009) ecol-ogy (Liang et al 2009 Nieswand et al 2009) agriculture (Dong et al 2016) finance (Jothimani et al 2017) health (Annapoorni and Prakash 2017)) To our knowledge there is one paper (Adler and Golany 2002) where hybrid PCA and DEA approach was applied for education data (assessed performance of seven university departments)
For the selection of an appropriate DEA method we perform a preprocessing of the available data Since the number of indicators selected is relatively large with respect to the number of countries analysed involvement of PCA seems rational The analysis of the Pareto frontier of the data set encouraged the application of convexity assumptions based methods Since the analysis is oriented to aid structural reforms the proportional improvement of indicators is not a concern Thus PCA and the Additive Model based DEA were hybridised and investigated
The objective of the study is to analyse performance of education systems by means of hybrid PCA and DEA approach We quantitatively analyse performance of educa-tion systems in 29 European countries For the analysis we use publicly available data for year 2013 2014 and 2015 No prior information or expert judgement were used in the analysis
The rest of the paper is organised as follows we present the data analysed first next we describe methodology of PCA-DEA then we provide numerical example and discus-sion with conclusions finalise the paper
2 Available Data
As described above European Commission has The Education and Training Monitor initiative for monitoring and fostering performance of education systems in EU Seven key indicators are selected for the monitoring and benchmarks reached by 2020 are set (ET20202) In the analysis we use 6 out of 7 key indicators as learning mobility indica-tor still waits for appropriate compilation of cross-national data (Flisi et al 2014) We added two additional indicators for the reflection of a wider range of learning activities (the higher-achievement in reading maths science and the minimum necessary qualifi-cations to actively participate in social and economic life) In the further text detones the th indicator for th country The titles of variables and detailed description are the following
1 Early leavers from education and training (the percentage of the population aged 18ndash24 with at most lower secondary education and who were not in further education or training during the last four weeks preceding the survey)
2 httpseur-lexeuropaeulegal-contentENTXTuri=celex52009XG0528(01)
A Jakaitiene A Zilinskas D Stumbriene248
2 Tertiary education attainment (the share of the population aged 30ndash34 years who have successfully completed tertiary-level education) 3 Early childhood education and care (the share of the population aged 4 to the age when the compulsory education starts who are participating in early educa-tion) 4 Employment rate of recent graduates (the share of employed graduates (20ndash34 years) having left education and training 1ndash3 years before the reference year) 5 Adult participation in lifelong learning (participation rate of adults (25ndash64 years) in education and training in last 4 weeks) 6 Low achievement in reading maths and science (the percentage of the PISA (The Programme for International Student Assessment) average score in reading mathematics and science below Level 2) 7 Top achievement in reading maths and science (the percentage of the PISA average score in reading mathematics and science at Level 5 or 6) 8 Upper secondary or tertiary education attainment (the percentage of people at aged 25ndash64 who have successfully completed at least upper secondary educa-tion)
All variables were extracted from EUROSTAT and OECD (The Organisation for Economic Co-operation and Development) databases for 29 European countries over 2013ndash2015 year European Commission monitors performance of 28 European countries (EU-28) we used 26 out of 28 countries because Cyprus and Malta have insufficiently data set also we added three European countries (Iceland Norway and Switzerland) that are not in European Union Missing data were replaced with the most recent year available The indicators were adjusted as the profit type the larger the better so that higher values of all indicators correspond to better performance The values of indicators 1 and 6 were converted using the complement to 100 percent The data used in the study is provided in Appendix Tables 7 8 and 9
Education performance can be analysed as the degree to which an education sys-tem achieve desired goals and effects In the context of education systems in Euro-pean countries goals and effects might be represented in terms of education systems achievement according to the framework ET2020 an education system that contributes to greater levels of these achievement is considered more effective than another educa-tion system
From Table 1 we see that on average all variables except 6 and 7 indicate better performance of European countries in 2015 compare to 2013 An average the target of 1 is already reached in 2014 however at country level there are some countries those have not reached the target The performance of education systems should be improved with respect to 2ndash6 variables in almost all countries The correlation analysis for selected variables revealed that some of variables are medium to high correlated (see Appendix Table 10) which indicates that PCA application is plausible Next we describe hybrid PCA and DEA approach which was employed to quantify the performance of each country in the analysis The selected indicators will serve as output indicators only in DEA
Analysis of Education Systems Performance in European Countries by 249
Table 1Descriptive statistics of analysed indicators for 29 European countries with ET2020 targets
1 2 3 4 5 6 7 8
ET2020 targets 900 400 950 820 150 850 - -
2013 Mean 896 388 913 741 125 802 88 791Std 50 93 79 122 90 71 34 120DevMedian 903 423 941 758 100 808 89 818Max 961 526 1000 898 314 918 153 934Min 764 225 714 396 20 600 19 398
2014 Mean 902 405 917 751 124 785 83 798Std 47 88 70 116 93 71 31 114DevMedian 910 423 944 774 96 802 88 827Max 973 533 1000 890 319 898 132 933Min 781 239 724 440 15 595 20 433
2015 Mean 902 414 920 764 127 785 83 802Std 43 89 69 112 94 71 31 111DevMedian 908 434 950 787 97 802 88 827Max 972 576 1000 921 321 898 132 935Min 800 253 738 450 13 595 20 451
3 Analysis of Data by Means of PCA-DEA
Because of different historical obstacles economical and political conditions the achievements of different countries with respect of the considered criteria are quite dif-ferent The comparison of these achievements is a problem of multicriteria evaluation In the present section we will analyse data about education systems by means of DEA For the convenience of references here the terminology of DEA will be used Let = 129 denote the vectors the components of which 0 = 18 are criteria representing the efficiency of -th DMU These criteria represent the perfor-mance of the education system of the corresponding country The values of for the considered years are given in Appendix Tables 7 8 and 9 As explained in the previous section performance is an increasing function of all criteria The crudest evaluation is the partition of the set = 129 into subsets of dominating (Pareto optimal) and dominated vectors We have applied a standard algorithm to find Pareto optimal vectors for the data analysed The Pareto optimal vectors are defined by the shorthand of names of the corresponding countries in Table 2 for each year
The obtained results show that only a third of DMUs are not Pareto-optimal In the case when Pareto optimal points belong to the convex hull of the data set the application of a standard DEA technique eg CCR (Cooper et al 2006) defines the unit efficiency
A Jakaitiene A Zilinskas D Stumbriene250
of all Pareto optimal DMUs In our case this happens as shown by the results of a nu-merical experiment The results of the experiment although itself not very interesting encourages the application of methods based on convexity assumptions Therefore the convex hull based frontier can be preferred against the free disposal hull frontier For the discussion on potential disadvantages of the weighted sum aggregation of criteria in the case of non-convex feasible objective region we refer to (Pardalos et al 2017)
For the discrimination of the Pareto optimal DMUs additional assumptions should be made with respect to the involved criteria Several DEA methods have been proposed where the different treatment of criteria is implied implicitly by formulating restrictions for weights in the DEA models This idea is implemented in the assurance region (Thompson et al 1986) and cone-ratio methods (Charnes et al 1990) However in the considered problem we do not have rational argument to substantiate a magnitude of restrictions
An alternative option is to aggregate criteria potentially reducing the scatter of data in the criteria space Principal component analysis is widely used for reducing dimensional-ity of data in various applications The hybridization of PCA with DEA has been proposed quite recently (Ueda and Hoshiai 1997) and yet thoroughly investigated and applied (Adler and Golany 2002 Adler and Berechman 2001 Adler and Golany 2001 Adler and Yazhemsky 2010 Azadeh et al 2007 Potildeldaru et al 2014 Chen et al 2016 Annapoorni and Prakash 2017 Jothimani et al 2017) This hybrid method seems attractive since a priori does not require any assumptions about relations between the considered criteria
We have applied an algorithm of PCA to the data in the three considered years Since the first four components explain about 90 of variance (see Table 3) they are consid-ered as representing the data sufficiently well As we see in Fig 1 according to the first and the second principal coordinates all Pareto optimal countries (marked as diamond) except Croatia come into one group
Table 3Variance explained by principal components
PC1 PC2 PC3 PC4 PC5 PC6 PC7 PC8
2013 4631 2600 1042 712 615 214 137 0482014 4830 2525 873 721 581 285 143 0422015 4616 2434 1166 726 606 279 130 043
Table 2The countriesrsquo performance vectors of which are non-dominated
2013 CZEPOL
DNK SVN
DEUSVK
ESTFIN
IRL GBR
FRA SWE
LVA ISL
LTU NOR
LUX CHE
NLD AUT
2014 BEL NLD
CZE AUT
DNK POL
DEU SVN
EST FIN
IRL SWE
FRA GBR
HRV ISL
LVA NOR
LTU CHE
LUX
2015 BEL HUN
CZE NLD
DNK AUT
DEU POL
EST SVN
IRL FIN
FRA SWE
HRV GBR
LVA ISL
LTU NOR
LUX CHE
Analysis of Education Systems Performance in European Countries by 251
Further we apply DEA for the projection of the original data to the subspace de-fined by four eigenvectors of the covariance matrix (computed by means of a PCA algorithm) For the details we refer to (Adler and Golany 2001) where an excellent description of the algorithm is presented The four dimensional projections of data are denoted by
~ = 129 The attention should be paid to the unfavorable results
of PCA where some elements of the transformed data sets are negative Recall that the data with negative elements is not appropriate in the context of the original formulation of the DEA problems However alternative DEA models have been developed which are translation invariant (Banker et al 1984 Ali and Seiford 1990) We will use the so called Additive Model which maintains translation invariance in the analysis of entirely output data (Ali and Seiford 1990) Let us note that the Additive Model is also used in (Adler and Golany 2001)
Since we consider entirely the output data the Additive Model is defined as the fol-lowing problem of linear programming
data sets are negative Recall that the data with negative elements is notapprpriate in the context of the original formulation of the DEA problemsHowever alternative DEA models have been developed which are translationinvariant [Banker et al 1984 Ali and Seiford 1990] We will use the so calledAdditive Model which maintains translation invariance in the analysis of entirelyoutput data [Ali and Seiford 1990] Let us note that the Additive Model is alsoused in [Adler and Golany 2001]Since we consider entirely the output data the Additive Model is defined as
the following problem of linear programming
maxΛ s+
zi = e s+ i = 1 29 (1)
Y Λ minus s+ = Yi
eΛ = 1
Λ ge 0 s+ ge 0
where Y = (Y1 Y2 Y29) e = (1 1)T
The solution of (1) zi is equal to the L1 (city block) distance from the vectorYi to the efficiency frontier ie to the Pareto optimal segment of the convexenvelop of the data vectors Thus the equality zi = 0 is valid for the efficientDMUs Correspondingly the non-zero distance is a measure of inefficiency Thevalues of zi for all DMUs are summarized in Table 4 and together with slacksfor each of four constraints of the linear programming problem (1) are providedin Appendix Tables 11 12 13The distance from Yi to the efficiency frontier can be used as a criterion for
ranking the inefficient DMUs The non-zero slacks show the potential improve-ment quantities along directions of principal components However these po-tential efficiency improvements does not have proper interpretation To obtainestimates of potential efficiency improvements with respect of original criteriathe slacks can be expressed in terms of original data using loadings of principalcomponents However this problem has no unambiguous solution For examplethe PCA coordinates of vectors in the original space are obtained by linear pro-jecting where a rdquoshadow effectrdquo can emerge The mutual distances of of imagescan be better preserved using non-linear projecting methods eg Multidimen-sional Scaling (MDS) [Borg and Groenen 1997 Zilinskas and Zilinskas 2006]The attractive idea of hybridization of DEA and MDS however is very new andstill not matureTherefore we have applied an alternative option to express desired improve-
ments for non-efficient DMUs Let Λi denote the optimal vector of weightscorresponding to the solution of linear programming problem (1) with Yi as lefthand side of the constraints where zi gt 0 Since the i-th DMU is inefficient itsimprovement seems desirable A reasonable target to achieve can be formulatedas
Yi =
29j=1
λi j Yj (2)
where λi j j = 1 29 are components of Λi
8
(1)
where ~= (
~1
~2
~29) = (11)
The solution of (1) is equal to the 1 (city block) distance from the vector ~ to
the efficiency frontier ie to the Pareto optimal segment of the convex envelop of the data vectors Thus the equality = 0 is valid for the efficient DMUs Correspondingly the non-zero distance is a measure of inefficiency The values of for all DMUs are
Fig 1 The first and the second principal coordinates (2015 year)
A Jakaitiene A Zilinskas D Stumbriene252
summarized in Table 4 and together with slacks for each of four constraints of the linear programming problem (1) are provided in Appendix Tables 11 12 13
The distance from ~ to the efficiency frontier can be used as a criterion for ranking
the inefficient DMUs The non-zero slacks show the potential improvement quantities along directions of principal components However these potential efficiency improve-ments does not have proper interpretation To obtain estimates of potential efficiency improvements with respect of original criteria the slacks can be expressed in terms of original data using loadings of principal components However this problem has no un-ambiguous solution For example the PCA coordinates of vectors in the original space are obtained by linear projecting where a ldquoshadow effectrdquo can emerge The mutual distances of images can be better preserved using non-linear projecting methods eg Multidimensional Scaling (MDS) (Borg and Groenen 1997 Žilinskas and Žilinskas 2006) The attractive idea of hybridization of DEA and MDS however is very new and still not mature
Therefore we have applied an alternative option to express desired improvements for non-efficient DMUs Let
data sets are negative Recall that the data with negative elements is notapprpriate in the context of the original formulation of the DEA problemsHowever alternative DEA models have been developed which are translationinvariant [Banker et al 1984 Ali and Seiford 1990] We will use the so calledAdditive Model which maintains translation invariance in the analysis of entirelyoutput data [Ali and Seiford 1990] Let us note that the Additive Model is alsoused in [Adler and Golany 2001]Since we consider entirely the output data the Additive Model is defined as
the following problem of linear programming
maxΛ s+
zi = e s+ i = 1 29 (1)
Y Λ minus s+ = Yi
eΛ = 1
Λ ge 0 s+ ge 0
where Y = (Y1 Y2 Y29) e = (1 1)T
The solution of (1) zi is equal to the L1 (city block) distance from the vectorYi to the efficiency frontier ie to the Pareto optimal segment of the convexenvelop of the data vectors Thus the equality zi = 0 is valid for the efficientDMUs Correspondingly the non-zero distance is a measure of inefficiency Thevalues of zi for all DMUs are summarized in Table 4 and together with slacksfor each of four constraints of the linear programming problem (1) are providedin Appendix Tables 11 12 13The distance from Yi to the efficiency frontier can be used as a criterion for
ranking the inefficient DMUs The non-zero slacks show the potential improve-ment quantities along directions of principal components However these po-tential efficiency improvements does not have proper interpretation To obtainestimates of potential efficiency improvements with respect of original criteriathe slacks can be expressed in terms of original data using loadings of principalcomponents However this problem has no unambiguous solution For examplethe PCA coordinates of vectors in the original space are obtained by linear pro-jecting where a rdquoshadow effectrdquo can emerge The mutual distances of of imagescan be better preserved using non-linear projecting methods eg Multidimen-sional Scaling (MDS) [Borg and Groenen 1997 Zilinskas and Zilinskas 2006]The attractive idea of hybridization of DEA and MDS however is very new andstill not matureTherefore we have applied an alternative option to express desired improve-
ments for non-efficient DMUs Let Λi denote the optimal vector of weightscorresponding to the solution of linear programming problem (1) with Yi as lefthand side of the constraints where zi gt 0 Since the i-th DMU is inefficient itsimprovement seems desirable A reasonable target to achieve can be formulatedas
Yi =
29j=1
λi j Yj (2)
where λi j j = 1 29 are components of Λi
8
denote the optimal vector of weights corresponding to the solution of linear programming problem (1) with
~ as left hand side of the constraints
where 0 Since the -th DMU is inefficient its improvement seems desirable A rea-sonable target to achieve can be formulated as
(2)
data sets are negative Recall that the data with negative elements is notapprpriate in the context of the original formulation of the DEA problemsHowever alternative DEA models have been developed which are translationinvariant [Banker et al 1984 Ali and Seiford 1990] We will use the so calledAdditive Model which maintains translation invariance in the analysis of entirelyoutput data [Ali and Seiford 1990] Let us note that the Additive Model is alsoused in [Adler and Golany 2001]Since we consider entirely the output data the Additive Model is defined as
the following problem of linear programming
maxΛ s+
zi = e s+ i = 1 29 (1)
Y Λ minus s+ = Yi
eΛ = 1
Λ ge 0 s+ ge 0
where Y = (Y1 Y2 Y29) e = (1 1)T
The solution of (1) zi is equal to the L1 (city block) distance from the vectorYi to the efficiency frontier ie to the Pareto optimal segment of the convexenvelop of the data vectors Thus the equality zi = 0 is valid for the efficientDMUs Correspondingly the non-zero distance is a measure of inefficiency Thevalues of zi for all DMUs are summarized in Table 4 and together with slacksfor each of four constraints of the linear programming problem (1) are providedin Appendix Tables 11 12 13The distance from Yi to the efficiency frontier can be used as a criterion for
ranking the inefficient DMUs The non-zero slacks show the potential improve-ment quantities along directions of principal components However these po-tential efficiency improvements does not have proper interpretation To obtainestimates of potential efficiency improvements with respect of original criteriathe slacks can be expressed in terms of original data using loadings of principalcomponents However this problem has no unambiguous solution For examplethe PCA coordinates of vectors in the original space are obtained by linear pro-jecting where a rdquoshadow effectrdquo can emerge The mutual distances of of imagescan be better preserved using non-linear projecting methods eg Multidimen-sional Scaling (MDS) [Borg and Groenen 1997 Zilinskas and Zilinskas 2006]The attractive idea of hybridization of DEA and MDS however is very new andstill not matureTherefore we have applied an alternative option to express desired improve-
ments for non-efficient DMUs Let Λi denote the optimal vector of weightscorresponding to the solution of linear programming problem (1) with Yi as lefthand side of the constraints where zi gt 0 Since the i-th DMU is inefficient itsimprovement seems desirable A reasonable target to achieve can be formulatedas
Yi =
29j=1
λi j Yj (2)
where λi j j = 1 29 are components of Λi
8
where
data sets are negative Recall that the data with negative elements is notapprpriate in the context of the original formulation of the DEA problemsHowever alternative DEA models have been developed which are translationinvariant [Banker et al 1984 Ali and Seiford 1990] We will use the so calledAdditive Model which maintains translation invariance in the analysis of entirelyoutput data [Ali and Seiford 1990] Let us note that the Additive Model is alsoused in [Adler and Golany 2001]Since we consider entirely the output data the Additive Model is defined as
the following problem of linear programming
maxΛ s+
zi = e s+ i = 1 29 (1)
Y Λ minus s+ = Yi
eΛ = 1
Λ ge 0 s+ ge 0
where Y = (Y1 Y2 Y29) e = (1 1)T
The solution of (1) zi is equal to the L1 (city block) distance from the vectorYi to the efficiency frontier ie to the Pareto optimal segment of the convexenvelop of the data vectors Thus the equality zi = 0 is valid for the efficientDMUs Correspondingly the non-zero distance is a measure of inefficiency Thevalues of zi for all DMUs are summarized in Table 4 and together with slacksfor each of four constraints of the linear programming problem (1) are providedin Appendix Tables 11 12 13The distance from Yi to the efficiency frontier can be used as a criterion for
ranking the inefficient DMUs The non-zero slacks show the potential improve-ment quantities along directions of principal components However these po-tential efficiency improvements does not have proper interpretation To obtainestimates of potential efficiency improvements with respect of original criteriathe slacks can be expressed in terms of original data using loadings of principalcomponents However this problem has no unambiguous solution For examplethe PCA coordinates of vectors in the original space are obtained by linear pro-jecting where a rdquoshadow effectrdquo can emerge The mutual distances of of imagescan be better preserved using non-linear projecting methods eg Multidimen-sional Scaling (MDS) [Borg and Groenen 1997 Zilinskas and Zilinskas 2006]The attractive idea of hybridization of DEA and MDS however is very new andstill not matureTherefore we have applied an alternative option to express desired improve-
ments for non-efficient DMUs Let Λi denote the optimal vector of weightscorresponding to the solution of linear programming problem (1) with Yi as lefthand side of the constraints where zi gt 0 Since the i-th DMU is inefficient itsimprovement seems desirable A reasonable target to achieve can be formulatedas
Yi =
29j=1
λi j Yj (2)
where λi j j = 1 29 are components of Λi
8
= 129 are components of
data sets are negative Recall that the data with negative elements is notapprpriate in the context of the original formulation of the DEA problemsHowever alternative DEA models have been developed which are translationinvariant [Banker et al 1984 Ali and Seiford 1990] We will use the so calledAdditive Model which maintains translation invariance in the analysis of entirelyoutput data [Ali and Seiford 1990] Let us note that the Additive Model is alsoused in [Adler and Golany 2001]Since we consider entirely the output data the Additive Model is defined as
the following problem of linear programming
maxΛ s+
zi = e s+ i = 1 29 (1)
Y Λ minus s+ = Yi
eΛ = 1
Λ ge 0 s+ ge 0
where Y = (Y1 Y2 Y29) e = (1 1)T
The solution of (1) zi is equal to the L1 (city block) distance from the vectorYi to the efficiency frontier ie to the Pareto optimal segment of the convexenvelop of the data vectors Thus the equality zi = 0 is valid for the efficientDMUs Correspondingly the non-zero distance is a measure of inefficiency Thevalues of zi for all DMUs are summarized in Table 4 and together with slacksfor each of four constraints of the linear programming problem (1) are providedin Appendix Tables 11 12 13The distance from Yi to the efficiency frontier can be used as a criterion for
ranking the inefficient DMUs The non-zero slacks show the potential improve-ment quantities along directions of principal components However these po-tential efficiency improvements does not have proper interpretation To obtainestimates of potential efficiency improvements with respect of original criteriathe slacks can be expressed in terms of original data using loadings of principalcomponents However this problem has no unambiguous solution For examplethe PCA coordinates of vectors in the original space are obtained by linear pro-jecting where a rdquoshadow effectrdquo can emerge The mutual distances of of imagescan be better preserved using non-linear projecting methods eg Multidimen-sional Scaling (MDS) [Borg and Groenen 1997 Zilinskas and Zilinskas 2006]The attractive idea of hybridization of DEA and MDS however is very new andstill not matureTherefore we have applied an alternative option to express desired improve-
ments for non-efficient DMUs Let Λi denote the optimal vector of weightscorresponding to the solution of linear programming problem (1) with Yi as lefthand side of the constraints where zi gt 0 Since the i-th DMU is inefficient itsimprovement seems desirable A reasonable target to achieve can be formulatedas
Yi =
29j=1
λi j Yj (2)
where λi j j = 1 29 are components of Λi
8
Table 4The distances to the efficiency frontier
Country 2013 2014 2015 Country 2013 2014 2015
PRT 00 00 00 FRA 107 145 137ESP 00 00 00 LUX 38 94 140GRC 00 00 00 BEL 170 177 156ISL 00 00 00 POL 298 242 194NOR 00 00 00 LVA 260 284 257IRL 00 00 00 AUT 423 268 287DNK 00 00 00 DEU 267 354 299CHE 00 00 00 ITA 497 407 343SWE 46 00 00 HUN 450 469 451FIN 28 00 00 CZE 545 500 465EST 118 106 00 HRV 775 500 539NLD 00 90 24 SVK 735 690 692GBR 74 93 46 BGR 724 688 724SVN 316 154 116 ROU 828 791 798LTU 00 00 131
Analysis of Education Systems Performance in European Countries by 253
4 Numerical Example
The methodology described in the previous section is illustrated by its application in formulating targets to the inefficient DMUs For a numerical example let consider Bul-garian (BLG) and Latvia (LVA) We propose to define a peer by (2) where
data sets are negative Recall that the data with negative elements is notapprpriate in the context of the original formulation of the DEA problemsHowever alternative DEA models have been developed which are translationinvariant [Banker et al 1984 Ali and Seiford 1990] We will use the so calledAdditive Model which maintains translation invariance in the analysis of entirelyoutput data [Ali and Seiford 1990] Let us note that the Additive Model is alsoused in [Adler and Golany 2001]Since we consider entirely the output data the Additive Model is defined as
the following problem of linear programming
maxΛ s+
zi = e s+ i = 1 29 (1)
Y Λ minus s+ = Yi
eΛ = 1
Λ ge 0 s+ ge 0
where Y = (Y1 Y2 Y29) e = (1 1)T
The solution of (1) zi is equal to the L1 (city block) distance from the vectorYi to the efficiency frontier ie to the Pareto optimal segment of the convexenvelop of the data vectors Thus the equality zi = 0 is valid for the efficientDMUs Correspondingly the non-zero distance is a measure of inefficiency Thevalues of zi for all DMUs are summarized in Table 4 and together with slacksfor each of four constraints of the linear programming problem (1) are providedin Appendix Tables 11 12 13The distance from Yi to the efficiency frontier can be used as a criterion for
ranking the inefficient DMUs The non-zero slacks show the potential improve-ment quantities along directions of principal components However these po-tential efficiency improvements does not have proper interpretation To obtainestimates of potential efficiency improvements with respect of original criteriathe slacks can be expressed in terms of original data using loadings of principalcomponents However this problem has no unambiguous solution For examplethe PCA coordinates of vectors in the original space are obtained by linear pro-jecting where a rdquoshadow effectrdquo can emerge The mutual distances of of imagescan be better preserved using non-linear projecting methods eg Multidimen-sional Scaling (MDS) [Borg and Groenen 1997 Zilinskas and Zilinskas 2006]The attractive idea of hybridization of DEA and MDS however is very new andstill not matureTherefore we have applied an alternative option to express desired improve-
ments for non-efficient DMUs Let Λi denote the optimal vector of weightscorresponding to the solution of linear programming problem (1) with Yi as lefthand side of the constraints where zi gt 0 Since the i-th DMU is inefficient itsimprovement seems desirable A reasonable target to achieve can be formulatedas
Yi =
29j=1
λi j Yj (2)
where λi j j = 1 29 are components of Λi
8
are ob-tained as the solution of (1) The non zero
data sets are negative Recall that the data with negative elements is notapprpriate in the context of the original formulation of the DEA problemsHowever alternative DEA models have been developed which are translationinvariant [Banker et al 1984 Ali and Seiford 1990] We will use the so calledAdditive Model which maintains translation invariance in the analysis of entirelyoutput data [Ali and Seiford 1990] Let us note that the Additive Model is alsoused in [Adler and Golany 2001]Since we consider entirely the output data the Additive Model is defined as
the following problem of linear programming
maxΛ s+
zi = e s+ i = 1 29 (1)
Y Λ minus s+ = Yi
eΛ = 1
Λ ge 0 s+ ge 0
where Y = (Y1 Y2 Y29) e = (1 1)T
The solution of (1) zi is equal to the L1 (city block) distance from the vectorYi to the efficiency frontier ie to the Pareto optimal segment of the convexenvelop of the data vectors Thus the equality zi = 0 is valid for the efficientDMUs Correspondingly the non-zero distance is a measure of inefficiency Thevalues of zi for all DMUs are summarized in Table 4 and together with slacksfor each of four constraints of the linear programming problem (1) are providedin Appendix Tables 11 12 13The distance from Yi to the efficiency frontier can be used as a criterion for
ranking the inefficient DMUs The non-zero slacks show the potential improve-ment quantities along directions of principal components However these po-tential efficiency improvements does not have proper interpretation To obtainestimates of potential efficiency improvements with respect of original criteriathe slacks can be expressed in terms of original data using loadings of principalcomponents However this problem has no unambiguous solution For examplethe PCA coordinates of vectors in the original space are obtained by linear pro-jecting where a rdquoshadow effectrdquo can emerge The mutual distances of of imagescan be better preserved using non-linear projecting methods eg Multidimen-sional Scaling (MDS) [Borg and Groenen 1997 Zilinskas and Zilinskas 2006]The attractive idea of hybridization of DEA and MDS however is very new andstill not matureTherefore we have applied an alternative option to express desired improve-
ments for non-efficient DMUs Let Λi denote the optimal vector of weightscorresponding to the solution of linear programming problem (1) with Yi as lefthand side of the constraints where zi gt 0 Since the i-th DMU is inefficient itsimprovement seems desirable A reasonable target to achieve can be formulatedas
Yi =
29j=1
λi j Yj (2)
where λi j j = 1 29 are components of Λi
8
defines -th DMU as a peer for -th DMU For Table 4 Bulgaria is one of the countries with the largest distance to the efficiency frontier (= 724 of the year 2015) The peers (defined by the non-zero weights) are Denmark (weight is equal to 08896) and Ireland (weight is equal to 01104) The targets for Bulgaria are presented in Table 5
Only one indicator (8) is already reached in 2015 so the performance of education system in Bulgaria should be improved with respect to 1ndash7 indicators The largest potential for the improvement of the education system in Bulgaria can be reached by improving indicators 5 and 7 These indicators are much worse than in peers Denmark and Ireland
Similarly for Latvia peers are Denmark (weight is equal to 02864) and Ireland (weight is equal to 07137) The targets for Bulgaria are presented in Table 6
Three indicators (3 4 and 8) out of eight are already reached in 2015 and the largest potential for improvement education system in Latvia can be reached by improv-ing the same indicators (5 and 7) like in Bulgaria
5 Discussion and Conclusions
In the analysis of sectors of education systems the most frequently radial DEA mod-els and CCR modifications are applied Radial efficiency measure and proportional improvement of efficiency are natural for the units with fixed structure operating in identical conditions Education systems of different countries do not correspond to
Table 5Observed data and formulated targets for Bulgaria (BGR)
1 2 3 4 5 6 7 8
Observed (2015) 866 321 892 736 20 595 36 819Target 923 481 979 799 286 853 85 803
Table 6Observed data and formulated targets for Latvia (LVA)
1 2 3 4 5 6 7 8
Observed (2015) 901 413 950 787 57 812 44 901Target 929 510 944 766 136 861 90 800
A Jakaitiene A Zilinskas D Stumbriene254
such a characterisation Improvement of education systems means mainly improve-ment in itrsquos structure a reform means not only increasing values of indicators but also changing ratios between their values Therefore BCC type model seems the most appropriate for education systems analysis Our experiments show the applicability of PCA with Additivity Model base DEA The proposed methodology of PCA-DEA allows researchers analyse education systems quantitatively We demonstrated good performance of the proposed methodology on limited data set of ET2020 indicators The assessment of the performance and recommendations for the improvements of education systems could be based on the analysis conducted using sufficiently large data set which would comprehensively represent the considered education system of the country as a whole
Acknowledgements
This research is funded by the European Social Fundaccording to the activity Improve-ment of researchersrsquo qualification by implementing world-class RampD projects of Mea-sure No0933-LMT-K-712 The project No DOTSUT-39 (0933-LMT-K-712-01-0018) LSS-250000-57
References
Adler N and Berechman J (2001) Measuring Airport Quality from the Airlines Viewpoint an Application of Data Envelopment Analysis Transport Policy 8(3) 171ndash181
Adler N and Golany B (2001) Evaluation of Deregulated Airline Networks Using Data Envelopment Analy-sis Combined with Principal Component Analysis with an Application to Western Europe European Jour-nal of Operational Research 132(2) 260ndash273
Adler N and Golany B (2002) Including Principal Component Weights to Improve Discrimination in Data Envelopment Analysis Journal of the Operational Research Society 53(9) 985ndash991
Adler N and Yazhemsky E (2010) Improving Discrimination in Data Envelopment Analysis PCA-DEA or Variable Reduction European Journal of Operational Research 202(1) 273ndash284
Ali AI and Seiford LM (1990) Translation Invariance in Data Envelopment Analysis Operations Re-search Letters 9(6) 403ndash405
Andrejić M Bojović N and Kilibarda M (2013) Benchmarking Distribution Centres Using Principal Component Analysis and Data Envelopment Analysis a Case Study of Serbia Expert Systems with Ap-plications 40(10) 3926ndash3933
Annapoorni D and Prakash V (2017) Measuring the Performance efficiency of Hospitals PCA-DEA Com-bined Model Approach Indian Journal of Science and Technology 9(S1)
Azadeh A Ghaderi S and Ebrahimipour V (2007) An Integrated PCA DEA Framework for Assessment and Ranking of Manufacturing Systems Based on Equipment Performance Engineering Computations 24(4) 347ndash372
Banker RD Charnes A and Cooper WW (1984) Some Models for Estimating Technical and Scale Inef-ficiencies in Data Envelopment Analysis Management Science 30(9) 1078ndash1092
Beblavy M Thum A-E and Veselkova M (2011) Education Policy andWelfare Regimes in OECD Coun-tries Social Stratification and Equal Opportunity in Education
Borg I and Groenen P (1997) Modern Multidimensional Scaling SpringerCharnes A Cooper W Huang Z and Sun D (1990) Polyhedral Cone-Ratio DEA Models with Illustrative
Application to Large Commercial Banks Journal of Econometrics 46 73ndash91
Analysis of Education Systems Performance in European Countries by 255
Charnes A Cooper WW and Rhodes E (1979) Measuring the efficiency of Decision-Making Units Eu-ropean Journal of Operational Research 3(4) 339
Chen J Wan Z Zhang F Park N-k He X and Yin W (2016) Operational efficiency Evaluation of Iron Ore Logistics at the Ports of Bohai Bay in China Based on the PCA-DEA Model Mathematical Problems in Engineering 2016
Cooper WW Seiford LM and Tone K (2006) Introduction to Data Envelopment Analysis and its Uses with DEA-Solver Software and References Springer Science amp Business Media
Dong F Mitchell PD Knuteson D Wyman J Bussan A and Conley S (2016) Assessing Sustainability and Improvements in US Midwestern Soy Bean Production Systems Using a PCA-DEA Approach Renew-able Agriculture and Food Systems 31(6) 524ndash539
Dyson RG Allen R Camanho AS Podinovski VV Sarrico CS and Shale EA (2001) Pitfalls and Protocols in DEA European Journal of Operational Research 132(2) 245ndash259
Flisi S Goglio V and Meroni E (2014) Monitoring the Evolution of Education and Training Systems a Guide to the Joint Assessment Framework Joint Research Center Publications Office of the European Union Luxembourg 10 15187
Jiang C and Fu P (2009) Evaluating efficiency and Effectiveness of Logistics Infrastructure Based on PCA-DEA Approach in China In Intelligent Computation Technology and Automation 2009 ICICTArsquo09 Sec-ond International Conference volume 3 pages 62ndash66 IEEE
Jothimani D Shankar R and Yadav SS (2017) A PCA-DEA Framework for Stock Selection in Indian Stock Market Journal of Modelling in Management 12(3) 386ndash403
Liang L Li Y and Li S (2009) Increasing the Discriminatory Power of DEA in the Presence of the Un-desirable Outputs and Large Dimensionality of Data Sets with PCA Expert Systems with Applications 36(3) 5895ndash5899
Liu SW Meng W and Zhang T (2006) Incorporating Value Judgments in DEANieswand M Cullmann A and Neumann A (2009) Overcoming Data Limitations in Non-parametric
Benchmarking Applying PCA-DEA to Natural Gas TransmissionNunamaker TR (1985) Using Data Envelopment Analysis to Measure the efficiency of Non-profit Organiza-
tions A Critical Evaluation Managerial and Decision Economics 6(1) 50ndash58Pardalos PM Žilinskas A and Žilinskas J (2017) Non-Convex Multi-Objective Optimization volume
123 SpringerPotildeldaru R Roots J et al (2014) Assessing the Performance of Milk Producer in Estonian Farms Using
PCA-DEA Approach Production and Co-operation in AgricultureSilva M and Camanho A (2017) Using Data Analytics to Benchmark Schools the Case of Portugal In
Vanthienen J and Witte KD editors Analytics Applications in Education chapter 6 pages 129ndash192 Taylor and Francis
Thompson RG Langemeier LN Lee C-T Lee E and Thrall RM (1990) The Role of Multiplier Bounds in efficiency Analysis with Application to Kansas Farming Journal of Econometrics 46(1ndash2) 93ndash108
Thompson RG Singleton Jr F Thrall RM and Smith B A (1986) Comparative Site Evaluations for Locating a High-Energy Physics Lab in Texas Interfaces 16(6) 35ndash49
Torgersen AM Foslashrsund FR and Kittelsen SA (1996) Slack-adjusted efficiency measures and ranking of efficient units Journal of Productivity Analysis 7(4) 379ndash398
Ueda T and Hoshiai Y (1997) Application of Principal Component Analysis for Parsimonious Summariza-tion of DEA Inputs andor Outputs Journal of the Operations Research Society of Japan 40(4) 466ndash478
Witte KD and Loacutepez-Torres L (2017) Efficiency in Education a Review of Literature and a Way Forward Journal of the Operational Research Society 68(4) 339ndash363
Želvys R Jakaitienė A and Stumbrienė D (2017) Moving Towards Different Educational Models of the Welfare State Comparing the Education Systems of the Baltic Countries Filosofija Sociologija 28(2) 139ndash150
Žilinskas A and Žilinskas J (2006) Parallel hybrid algorithm for global optimization of problems occurring in MDS-based visualization Computers and Mathematics with Applications 52 211ndash224
A Jakaitiene A Zilinskas D Stumbriene256
A Jakaitiene is professor and chief researcher at Vilnius university She defended her PhD thesis in physical sciences (Informatics 09P) in 2001 A Jakaitiene has experience of statistical analysis in social physical and biomedical areas from working in Lithu-anian and EU institutions As of 2005 her research paper topics could be split in three fields 1 modelling and forecasting of Lithuanian European Union and global economic indicators 2 analysing biomedical data with special interest to modelling of large-scale genetic data 3 conducting secondary analysis of international large-scale assessment databases in education She is a board member of Lithuanian Statistical Society a mem-ber of Lithuanian Mathematical Society International Epidemiology Association and International Biometric Society
A Zilinskas is a member of Lithuanian Academy of Sciences holds the positions of a principal researcher and is professor-emeritus of Vilnius University His scientific interests are statistical theory of global optimization optimization based modelling and design and analysis of multidimensional data by means of visualization His research is oriented to develop statistical models of global optimization implement and investigate the corresponding algorithms and apply them to practical problems He is a member of editorial boards of Journal of Global Optimization Informatica Baltic Journal of Modern Computing International Journal of Grid and High Performance Computing Control and Cybernetics Statistics Optimization and Information Computing and The Open Cybernetics and Systemics Journal He is a member of several working groups of international scientific societies and of American Mathematical Society In 2017 he was awarded Constantine Caratheodory Price of International Society of Global Optimiza-tion for his contribution to the field of global optimization
D Stumbriene PhD student in Informatics and junior researcher from the Institute of Data Science and Digital Technologies of Vilnius university Faculty of Mathematics and Informatics Her main research interest is the largescale analysis of education data She is focusing on creating the methodology and instruments for education monitoring
Analysis of Education Systems Performance in European Countries by 257
Appendix
Table 7Indicators for year 2013
Country 1 2 3 4 5 6 7 8
BEL 890 427 981 781 69 824 135 728BGR 875 294 878 676 20 600 38 818CZE 946 267 857 803 100 828 89 928DNK 920 434 983 810 314 839 74 783DEU 902 329 970 882 79 852 129 867EST 903 425 904 758 126 918 119 906IRL 916 526 981 724 76 875 109 767GRC 899 349 769 396 32 721 38 672ESP 764 423 971 559 114 808 61 555FRA 903 440 1000 747 178 800 112 750HRV 955 256 714 538 31 780 53 813ITA 832 225 987 483 62 790 76 582LVA 902 407 941 776 68 836 55 894LTU 937 513 865 747 59 789 55 934LUX 939 525 994 771 146 771 94 805HUN 881 323 945 734 32 781 69 825NLD 907 432 995 839 179 860 136 758AUT 925 271 939 895 141 820 92 830POL 944 405 848 727 43 887 125 901PRT 811 300 939 656 97 791 70 398ROU 827 229 864 672 20 615 19 757SVN 961 401 898 735 125 820 94 855SVK 936 269 775 703 31 725 67 919FIN 907 451 840 798 249 896 153 859SWE 929 483 957 842 284 760 74 832GBR 876 474 959 828 166 822 106 783ISL 795 439 962 867 263 778 74 722NOR 863 488 974 898 208 806 91 824CHE 946 461 791 843 304 870 133 872
A Jakaitiene A Zilinskas D Stumbriene258
Table 8Indicators for year 2014
Country 1 2 3 4 5 6 7 8
BEL 902 438 981 774 74 802 114 736BGR 871 309 893 654 21 595 36 811CZE 945 282 864 813 96 785 85 932DNK 922 449 981 823 319 852 84 796DEU 905 314 974 884 80 832 117 869EST 886 432 917 793 116 898 129 912IRL 931 522 960 735 69 865 92 788GRC 910 372 840 440 32 681 34 684ESP 781 423 971 611 101 811 59 566FRA 910 437 1000 730 184 777 106 767HRV 973 322 724 620 28 745 51 829ITA 850 239 965 448 81 775 68 593LVA 915 399 944 766 56 812 44 895LTU 941 533 888 801 51 749 52 933LUX 939 527 984 827 145 742 83 820HUN 886 341 947 780 33 729 57 831NLD 913 448 976 833 183 822 125 759AUT 930 400 940 869 143 783 91 839POL 946 421 871 752 40 840 92 905PRT 826 313 935 667 96 805 88 433ROU 819 250 864 659 15 609 20 728SVN 956 410 894 700 121 846 110 857SVK 933 269 774 727 31 698 50 910FIN 905 453 836 770 251 880 132 865SWE 933 499 959 845 292 797 96 837GBR 882 477 982 823 163 809 102 792ISL 809 464 962 890 263 763 69 736NOR 883 521 972 861 201 831 103 827CHE 946 492 806 873 317 819 123 880
Analysis of Education Systems Performance in European Countries by 259
Table 9Indicators for year 2015
Country 1 2 3 4 5 6 7 8
BEL 899 427 980 779 69 802 114 747BGR 866 321 892 736 20 595 36 819CZE 938 301 880 820 85 785 85 932DNK 922 476 985 805 313 852 84 804DEU 899 323 974 889 81 832 117 868EST 888 453 916 792 124 898 129 911IRL 931 523 927 750 65 865 92 798GRC 921 404 796 450 33 681 34 704ESP 800 409 977 622 99 811 59 574FRA 908 450 1000 709 186 777 106 775HRV 972 309 738 624 31 745 51 833ITA 853 253 962 483 73 775 68 599LVA 901 413 950 787 57 812 44 901LTU 945 576 908 811 58 749 52 935LUX 907 523 966 835 180 742 83 760HUN 884 343 953 800 71 729 57 832NLD 918 463 976 866 189 822 125 764AUT 927 387 950 867 144 783 91 846POL 947 434 901 768 35 840 92 908PRT 863 319 936 705 97 805 88 451ROU 809 256 876 680 13 609 20 750SVN 950 434 905 711 119 846 110 868SVK 931 284 784 752 31 698 50 914FIN 908 455 836 755 254 880 132 877SWE 930 502 950 855 294 797 96 843GBR 892 479 1000 850 157 809 102 797ISL 812 471 976 921 281 763 69 750NOR 898 509 973 897 201 831 103 827CHE 949 514 813 848 321 819 123 882
A Jakaitiene A Zilinskas D Stumbriene260
Table 10Spearmanrsquos correlation of indicators
1 2 3 4 5 6 7 8
2013 Y1 1 Y2 0116 1 Y3 -0348 0391 1 Y4 0146 0462 0279 1 Y5 0098 0626 0417 0726 1 Y6 0252 0287 0129 0391 0412 1 Y7 0254 0417 0327 0531 0552 0759 1 Y8 0648 0046 - 0325 - 0305 0145 1 0481 00382014 Y1 1 Y2 0202 1 Y3 -035 0378 1 Y4 0146 0546 0334 1 Y5 0008 0611 0447 0632 1 Y6 0131 0383 0194 0299 0508 1 Y7 012 0437 0296 0502 0647 0753 1 Y8 0635 009 - 0359 - 0231 0185 1 0425 00322015 Y1 1 Y2 0252 1 Y3 - 0311 1 0455 Y4 0081 0508 0365 1 Y5 0009 0600 0476 0574 1 Y6 0186 0426 0217 0239 0475 1 Y7 0172 0441 0291 0420 0649 0753 1 Y8 0609 0115 - 0328 - 0251 0171 1 0454 0051
Correlation is significant at the 005 level (2-tailed)
Analysis of Education Systems Performance in European Countries by 261
Table 11DEA results for 2013
Country Distance to frontier
Slack 1 Slack 2 Slack 3 Slack 4
BEL 1704 188 000 1168 348BGR 7242 2040 1903 2070 1229CZE 5445 000 2431 1583 1432DNK 000 000 000 000 000DEU 2667 000 1196 1458 013EST 1183 000 1168 000 015IRL 000 000 000 000 000GRC 000 000 000 000 000ESP 000 000 000 000 000FRA 1068 000 000 501 567HRV 7748 2757 2795 193 2003ITA 4967 3111 000 1044 812LVA 2595 000 1452 876 267LTU 000 000 000 000 000LUX 383 000 148 075 160HUN 4495 919 1298 1696 582NLD 000 000 000 000 000AUT 4229 000 1105 2009 1116POL 2982 026 2063 248 645PRT 000 000 000 000 000ROU 8276 2641 1576 2487 1572SVN 3158 009 1357 607 1185SVK 7345 1192 3126 1408 1619FIN 284 000 113 000 171SWE 461 000 000 000 461GBR 739 000 000 316 423ISL 000 000 000 000 000NOR 000 000 000 000 000CHE 000 000 000 000 000
A Jakaitiene A Zilinskas D Stumbriene262
Table 12DEA results for year 2014
Country Distance to frontier
Slack 1 Slack 2 Slack 3 Slack 4
BEL 1772 1084 000 688 000BGR 6884 2283 1645 1327 1629CZE 5003 000 2126 957 1919DNK 000 000 000 000 000DEU 3538 000 1114 1553 872EST 1059 000 986 000 073IRL 000 000 000 000 000GRC 000 000 000 000 000ESP 000 000 000 000 000FRA 1446 1439 000 006 000HRV 4996 2668 2026 000 302ITA 4066 4066 000 000 000LVA 2844 065 1305 791 683LTU 000 000 000 000 000LUX 936 000 290 466 180HUN 4694 794 1174 1600 1126NLD 900 317 000 583 000AUT 2681 000 795 887 998POL 2417 000 1653 116 648PRT 000 000 000 000 000ROU 7906 2951 1207 1643 2104SVN 1538 619 750 000 168SVK 6899 1256 2802 723 2118FIN 000 000 000 000 000SWE 000 000 000 000 000GBR 928 688 000 236 003ISL 000 000 000 000 000NOR 000 000 000 000 000CHE 000 000 000 000 000
Analysis of Education Systems Performance in European Countries by 263
Table 13DEA results for year 2015
Country Distance to frontier
Slack 1 Slack 2 Slack 3 Slack 4
BEL 1556 523 000 1034 000BGR 7241 3091 2308 1668 174CZE 4649 998 2495 1156 000DNK 000 000 000 000 000DEU 2986 014 1039 1933 000EST 000 000 000 000 000IRL 000 000 000 000 000GRC 000 000 000 000 000ESP 000 000 000 000 000FRA 1372 1105 009 258 000HRV 5391 3191 2200 000 000ITA 3431 3398 000 032 000LVA 2572 319 1285 968 000LTU 1313 000 1313 000 000LUX 1396 475 192 729 000HUN 4513 1493 1396 1624 000NLD 241 000 000 241 000AUT 2865 388 1174 1304 000POL 1936 128 1416 392 000PRT 000 000 000 000 000ROU 7984 4082 1856 1744 302SVN 1163 490 672 000 000SVK 6922 2522 3404 871 125FIN 000 000 000 000 000SWE 000 000 000 000 000GBR 456 000 000 456 000ISL 000 000 000 000 000NOR 000 000 000 000 000CHE 000 000 000 000 000
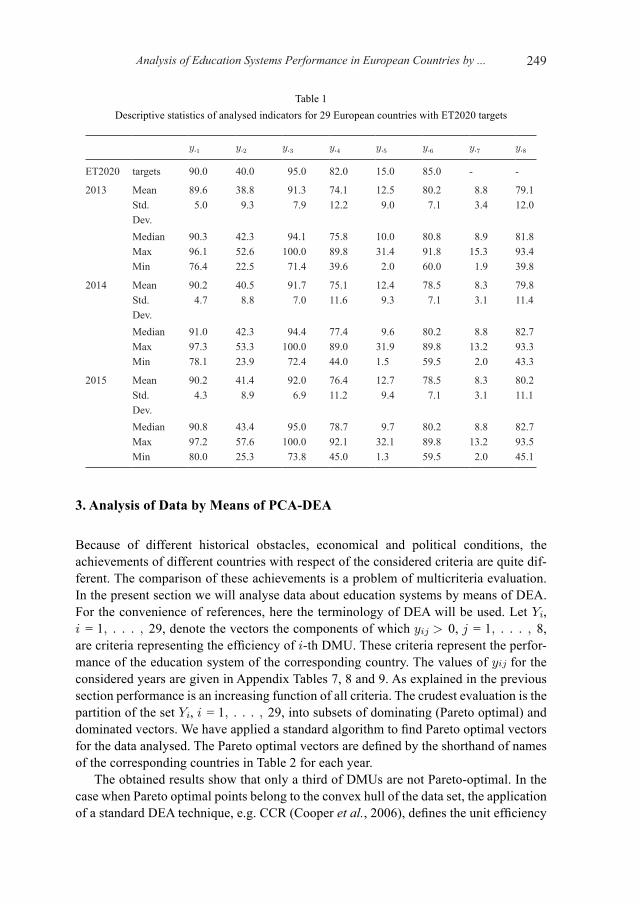
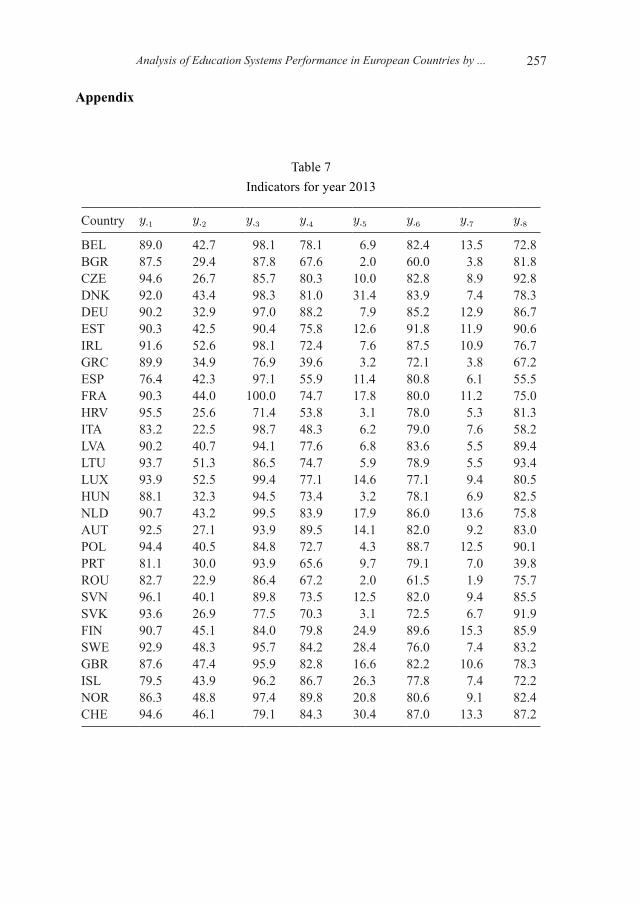
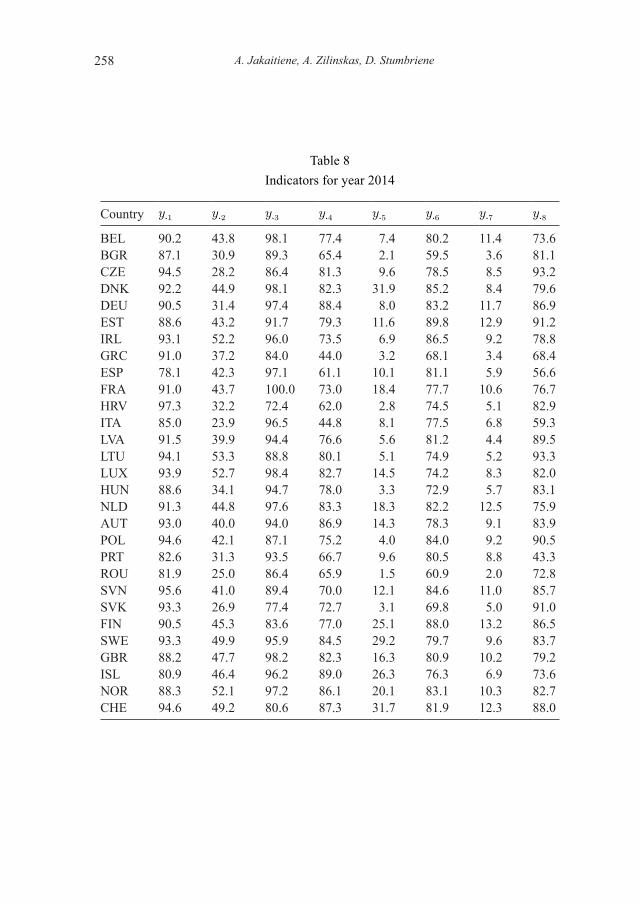
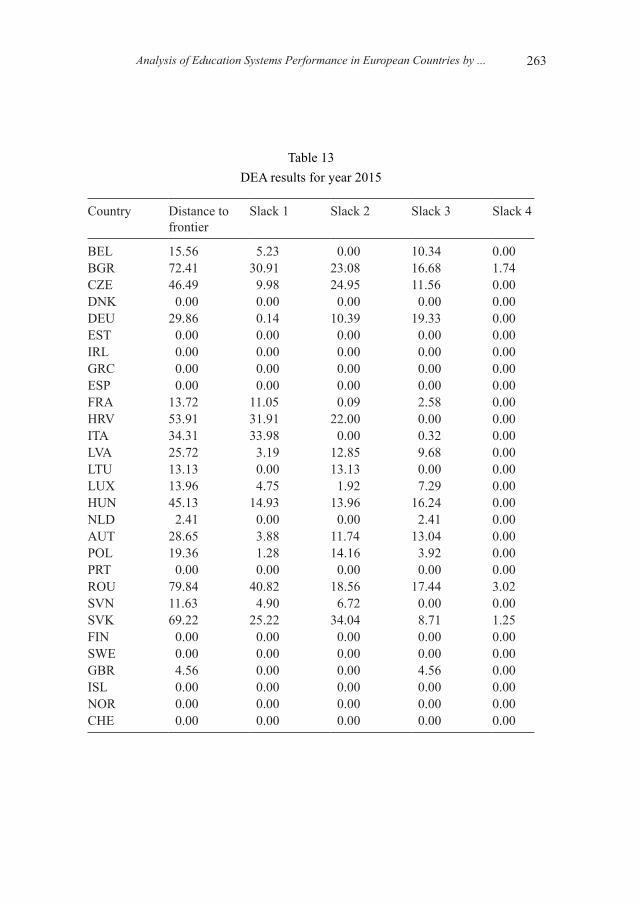
