analysis of drivers and economic consequences of …
TRANSCRIPT

ANALYSIS OF DRIVERS AND ECONOMIC CONSEQUENCES OF WETLAND
DEGRADATION ALONG RUVU RIVERINE IN COASTAL TANZANIA
GERUBIN LIBERATH
A DISSERTATION SUBMITTED IN PARTIAL FULFILMENT OF THE
REQUIREMENTS FOR THE DEGREE OF MASTER OF SCIENCE IN
ENVIROMENTAL AND NATURAL RESOURCES ECONOMICS
OF SOKOINE UNIVERSITY OF AGRICULTURE.
MOROGORO, TANZANIA.
2017

ii
ABSTRACT
The current study intended to analyse the drivers, communities’ awareness and economic
consequences of wetland degradation to local population living along the Ruvu riverine in
Morogoro rural and Kibaha districts. The study deployed a number of methodologies
including household questionnaire survey, interview, focus group discussion and review
of satellite images of land use change in the riverine to collect data. Data were analysed
using Statistical Software for Social Science, content analysis, Land Ecosystem
Disturbance Adaptive Processing System and ArcGIS 10 software. The findings from
satellite imagery analysis indicate the prevalence of wetland degradation within the study
area. Findings from field survey show that livestock grazing is the main cause of wetland
degradation accounting for 53% (n=122) of the degradation, arable farming was ranked as
the second most prominent driver accounting for 48% (n=122), brick making was ranked
as the third significant driver contributing 46% (n=122) and fishing was ranked as the
fourth prominent driver contributing 39%. The findings also revealed that the majority of
the respondents were mostly aware of direct benefits of wetlands. About 75% of the
respondents confirmed that floods are the main consequence of wetland degradation in
the area. The findings show further, that the local community perceive wetland
degradation as having great negative effects on their economic status especially with
regards to accessing food and generating income. Furthermore, independent variable was
able to explain about 33.2 % of the variation in the dependent variable. The study
concludes that anthropogenic activities associated with low awareness on values of
wetland significantly results to wetland degradation which has serious economic costs to
the local communities and the government. The study recommends that awareness on the
iii
direct and indirect benefits of wetlands and proper land use practices should be raised
among the communities to enable proper use of wetlands.

iv
DECLARATION
I, Gerubin Liberath, do hereby declare to the Senate of Sokoine University of Agriculture
that this dissertation is my own original work done within the period of registration and
that it has neither been submitted nor being concurrently submitted to any other
institution.
____________________ ____________________
Gerubin Liberath Date
(MSc. Candidate)
The above declaration is confirmed by;
____________________ ____________________
Prof. John Francis Kessy Date
(Supervisor)

v
COPYRIGHT
No part of this dissertation may be reproduced, stored in any retrieval system, or
transmitted in any form or by any means without prior written permission of the author or
Sokoine University of Agriculture in that behalf.

vi
ACKNOWLEDGEMENTS
I owe my great thanks to the Almighty God who gave me strength and capabilities to
complete this study. Without his blessings, it would have been difficult for me to
complete the study.
I would like to express my sincere and special thanks to my supervisor, Prof. John Francis
Kessy for support me during this research. His guidance and constant supervision as well
as provision of necessary information regarding this research are highly appreciated.
I am greatly indebted to my sponsor, Mwalimu Julius K. Nyerere University of
Agriculture and Technology (MJNUAT) for granting me permission to pursue my studies
at Sokoine University of Agriculture (SUA) as well as funding the studies.
I would like to thank all staff of department of Forest and Environmental Economics as
well as all staff of the Collage of Forest, Wildlife and Tourism for their support and
criticism that helped me to shape my research work well. May God bless them all.
Further, I would like to extend my sincere thanks to Prof. S.S Iddi and Ms. Neema
Kitasho for their support during this study, their support is highly appreciated. Special
thanks should also go to Ms. Rosemary Maskini, Wami Ruvu Water Basin Officer for her
support during this research. Additionally, thanks should go to Ward Executive Officers
of Kisemu, Mkulazi and Ruvu as well as Village Chairmen of Nige, Kidunda, Kibangile,
Ruvu station and Minazimikinda for their support during this study.

vii
Furthermore, my special thanks and appreciation of love are due to my parents,
Mr. Liberatus Msaki, and my mother Theresia Liberatus, my brothers Thomas, Seraphine,
John, Sirili and younger sisters Hellen, Vanessa and Vumilia and my uncles Gabriel and
Pamphil Silayo for their kind cooperation and encouragement which helped me in
completion of this research.
My thanks and appreciation should also go to my beloved friend Joyce Christopher and
my lovely daughter Gabriella who misses my presence during the entire time when i was
away for this study. Many thanks to my colleague Adili Bugingo and all MSc. Students
for their support and encouragement during this research their contribution is highly
appreciated. Lastly, thanks to all who helped me for the accomplishment of this research,
may God bless you all.

viii
DEDICATION
This work is dedicated to my beloved parents Mr. Liberatus Msaki and Theresia Liberatus
who laid the foundation of my education. This work is also dedicated to my Uncle
Gabriel John Silayo for his support and encouragement during the entire time of my
studies.

ix
TABLE OF CONTENTS
ABSTRACT............................................................................................................................. ii
DECLARATION ................................................................................................................... iv
COPYRIGHT ......................................................................................................................... v
ACKNOWLEDGEMENTS ................................................................................................. vi
DEDICATION ..................................................................................................................... viii
TABLE OF CONTENTS ..................................................................................................... ix
LIST OF TABLES .............................................................................................................. xiii
LIST OF FIGURES ............................................................................................................ xiv
LIST OF PLATES................................................................................................................ xv
LIST OF APPENDICES .................................................................................................... xvi
LIST OF ABBREVIATIONS AND ACRONYMS ....................................................... xvii
CHAPTER ONE ..................................................................................................................... 1
1.0 INTRODUCTION ........................................................................................................ 1
1.1 Background Information ................................................................................................ 1
1.2 Problem Statement ......................................................................................................... 3
1.3 Study Justification .......................................................................................................... 5
1.4 General Objective ........................................................................................................... 6
1.4.1 Specific Objectives .......................................................................................... 6
1.4.2 Research Questions.......................................................................................... 6
1.5 Limitations of the Study ................................................................................................. 7

x
CHAPTER TWO.................................................................................................................... 9
2.0 LITERATURE REVIEW ........................................................................................... 9
2.1 Overview ......................................................................................................................... 9
2.2 Definition of terms ......................................................................................................... 9
2.2.1 Wetland Degradation ....................................................................................... 9
2.2.2 Riverine ............................................................................................................ 9
2.3 Wetland Management in Tanzania .............................................................................. 10
2.4 Wetland Degradation.................................................................................................... 11
2.5 Drivers of Wetland Degradation.................................................................................. 12
2.6 Awareness on the Values of Wetland and Consequences of Degradation
and controlling practices .............................................................................................. 13
2.7 Economic Implications of Wetland Degradation to Household’s Income ............... 14
CHAPTER THREE ............................................................................................................. 16
3.0 METHODOLOGY ..................................................................................................... 16
3.1 Overview ....................................................................................................................... 16
3.2 Study Site Description.................................................................................................. 16
3.3 Methods ......................................................................................................................... 18
3.3.1 Research Design ............................................................................................ 18
3.3.2 Sampling procedure ....................................................................................... 18
3.3.3 Sample size determination ............................................................................ 18
3.3.4 Data collection ............................................................................................... 19
3.3.4.1 Primary data collection .............................................................. 19
3.3.4.2 Secondary data ........................................................................... 23
3.3.4.3 Satellite image acquisition ......................................................... 23
3.4 Data Analysis ................................................................................................................ 23

xi
3.4.1 Descriptive analysis ....................................................................................... 23
3.4.2 Content analysis ............................................................................................. 23
3.4.3 Simple linear regression model..................................................................... 24
3.4.4 Satellite image analysis ................................................................................. 25
3.4.4.1 Image pre-processing ................................................................. 25
3.4.4.2 Classification and collection of the training signatures ........... 25
3.4.4.3 Post-classification processing.................................................... 26
3.4.4.4 Land cover change analysis and cross tabulation .................... 26
CHAPTER FOUR ................................................................................................................ 28
4.0 RESULTS AND DISCUSSION ................................................................................ 28
4.1 Overview ....................................................................................................................... 28
4.2 Social Economic Characteristics of the Respondents ................................................ 28
4.2.1 Education level of the household heads ....................................................... 28
4.2.3 Household size ............................................................................................... 30
4.2.4 Occupation of the respondents ...................................................................... 30
4.2.5 Farm size of the respondents ......................................................................... 31
4.2.6 Types of crops grown .................................................................................... 31
4.3 Evidence of Wetland Degradation from Satellite Images.......................................... 32
4.4 Contribution of various economic activities to wetland degradation ........................ 39
4.5 Community Awareness on the Values of Wetland, causes and Consequences of its
Degradation ................................................................................................................... 45
4.5.1 Awareness on the Values of wetland............................................................ 45
4.5.2 Awareness on the causes of wetland degradation........................................ 46
4.5.3 Awareness on the consequences of wetland degradation............................ 47
4.5.4 Community practices on wetland use and controlling degradation ............ 48

xii
4.6 Economic Implications of Wetland Degradation ....................................................... 52
4.6.1 Community Perceptions on economic implications of wetland
degradation ..................................................................................................... 52
4.6.2 Implication of change in average river discharge to household income .... 56
CHAPTER FIVE .................................................................................................................. 59
5.0 CONCLUSIONS AND RECOMMENDATIONS ................................................. 59
5.1 Conclusions ................................................................................................................... 59
5.2 Recommendations ........................................................................................................ 60
REFERENCES ..................................................................................................................... 63
APPENDICES....................................................................................................................... 72

xiii
LIST OF TABLES
Table 1: Number of respondents interviewed in the surveyed study villages ................. 19
Table 2: Land Use Land Cover (LULC) Categories ......................................................... 26
Table 3: Socio-economic characteristics of respondents .................................................. 29
Table 4: Land cover change in Ruvu ward ........................................................................ 33
Table 5: Land use cover change in Mkulazi ward ............................................................. 35
Table 6: Land cover change in Kisemu ward .................................................................... 38
Table 7: Contributions of various economic activities wetland degradation in
the study area ........................................................................................................ 42
Table 8: Awareness on the Values of wetland................................................................... 45
Table 9: Awareness on the causes of wetland degradation............................................... 47
Table 10: Awareness on the consequences of wetland degradation................................... 48
Table 11: Community practices on wetland use and controlling degradation ................... 49
Table 12: Community Perceptions on economic consequences of wetland
degradation ............................................................................................................ 52
Table 13: Regression analysis of change in average water discharge to
household income ................................................................................................. 58

xiv
LIST OF FIGURES
Figure 1: Map showing the location of the study area ................................................ 17
Figure 2: Methodology adopted .................................................................................... 27
Figure 3 (a): Degradation in Ruvu ward as detected by 2007-17 Imagery ...................... 33
Figure 3 (b): Land use change in Ruvu ward as computed from 2007-16
imagery………………………………………………………………...…33
Figure 4 (a): Degradation in Mkulazi ward as detected by 2007-17 Imagery ................. 35
Figure 4 (b): Land use change in Mkulazi ward as computed from 2007-16
imagery……………………………………………………….……..........35
Figure 5 (a): Degradation in Kisemu ward as detected by 2007-17 Imagery .................. 37
Figure 5 (b): Land use change in Kisemu ward as computed from 2007-16
imagery…………………………………………………………..……….37
Figure 6: Implication of change in average water discharge to household
income ............................................................................................................ 57

xv
LIST OF PLATES
Plate 1: Interviewer administering a questionnaire to respondent ............................... 20
Plate 2: A group photo after FGD at Kibangile village ................................................. 21
Plate 3: Tree along the wetland defoliated by livestock keepers for feeding
their livestock ...................................................................................................... 22
Plate 4: Degradation due to improper agricultural practices and livestock
grazing close to the wetland ............................................................................... 44
Plate 5: Water resistant grasses and banana trees planted by the community as
one of their practices in controlling wetland degradation. ............................... 51
Plate 6: Dried permanent natural dam (originates from main Ruvu river)
which used to harbour high fish stock has dried (Mongomore dam) .............. 55

xvi
LIST OF APPENDICES
Appendix 1: Household questionnaire............................................................................. 72
Appendix 2: Checklist for focus group discussion ......................................................... 78
Appendix 3: Checklist for key informants ...................................................................... 79

xvii
LIST OF ABBREVIATIONS AND ACRONYMS
ArcGIS Aeronautical Reconnaissance Coverage Geographic Information
System
FGD Focus Group Discussion
GIS Geographic Information System
ha Hectare
IUCN International Union for Conservation of Nature and Natural
Resources
Km2 Square Kilometres
Lab Laboratory
LEDAPS Land Ecosystem Disturbance Adaptive Processing System
LULC Land Use Land Cover
MJNUAT Mwalimu Julius K. Nyerere University of Agriculture and
Technology
MNRT Ministry of Natural Resource and Tourism
MODIS Moderate Resolution Imaging Spectroradiometer
NASA National Aeronautics and Space Administration
NBS National Bureau of Statistics
NRM Natural Resource Management
NS Not significant
OLI Landsat Operational Land Imager
P Probability level
R2 Coefficient of determination
SPSS Statistical Package for Social Sciences
xviii
SUA Sokoine University of Agriculture
TM Landsat Thematic Mapper
URT United Republic of Tanzania
USGS United States Geological Surveys
WRBWO Wami/Ruvu Basin Water Office.
1
CHAPTER ONE
1.0 INTRODUCTION
1.1 Background Information
An internationally agreed upon definition of wetlands is unavailable. However, the
common and overriding theme of most definitions consists of some component related to
hydrologic conditions (Zedler and Kercher, 2005; Moore, 2008). Perhaps one of the best
current definitions of a wetland, at minimum for the context of this work, was that set by
the Ramsar Convention. The Ramsar Convention on Wetlands (1971) produced an
international, intergovernmental treaty which defined wetlands somewhat broadly as
"areas of marsh, fen, peat land or water, whether natural or artificial, permanent or
temporary, with water that is static or flowing, brackish or salty, including areas of marine
water the depth of which, at low tide, does not exceed six meters".
The global wetland area is estimated to be 7 to 9 million km2 which is equivalent to 4% to
6% of the land surface of the earth (Mitsch et al., 2004). Global wetlands are categorized
into Coastal wetlands, Inland wetlands, and Human-made wetlands (Ramsar Convention
Secretariat, 2013).
Wetlands are among the most biologically productive ecosystems as they are rich in
species diversity and habitats (Mironga, 2005; Mwakaje, 2009). Since, wetlands contain
numerous goods and services that have economic value, they support millions of people
living in their periphery as well as those living outside the wetlands at the national,
regional and global levels (USAID, 2014). The wetlands are also habitats for a number of
biota (Ramachandra et al., 2011; Roy et al., 2012; Hagos et al., 2014).

2
Human activities taking place around and within the wetland area are the most driving
force for wetland degradation globally (Ramsar, 2015). As Davidson (2014) points out,
the global extent of wetlands is estimated to have declined between 64 and 71% in the
20th century, and wetland losses and degradation continue worldwide.
Wetlands in Africa, which are estimated to cover about 131 Million ha, provide an
important source of water and nutrients which are necessary for biological productivity
and people’s survival. Despite their importance, wetlands in Africa are being modified or
reclaimed; measures which are often driven by economic and financial motives.
Sustainable management of wetlands is therefore critical to the long-term health, safety,
and welfare of many African communities (USAID, 2014).
In Tanzania, about 10% of the country’s land is covered by wetland resources such as the
great lake system, inland drainage systems, major river networks and deltaic mangroves
and degradation threat them leading to change in their size and functions that they can
provide to the ecosystem. Some of the major wetlands systems forming the valley bottom
wetlands in Tanzania include the Great Ruaha, Wami, Kilombero, Pangani, Malagarasi,
Ruvu and Katavi River. The largest in this category is the Great Ruaha river system with
wetlands covering 6950 ha (MNRT, 2003). As stated earlier, wetlands have significant
economic, social, cultural and biological values (URT, 2007) and perform a number of
functions such as production of electricity, groundwater recharge, control of floods, water
retention, prevention of eutrophication of rivers and lakes, supporting specific biota and
traditional uses. Also, , wetlands contribute significantly to the country’s Gross Domestic
Product through tourism (URT, 2007).

3
Ruvu River, which originates from Uluguru Mountains, is another most important
wetland in Tanzania. The Uluguru Mountains are part of the Eastern Arc Mountains.
Ruvu River is a catchment of water supply for both domestic and industrial purposes to
Dar es Salaam, Coast and Morogoro regions (URT, 2008). According to Munishi et al.
(2007) reported that, the main Ruvu-Kibungo sub catchment, which drains a bigger
proportion of the river, is relatively more degraded because of agricultural activities that
have high potential for further degradation which is likely to cause more negative impact
on the flow of water downstream.
Wetland degradation deprives the society of quality water, enough quantity of water, fish
and wildlife habitat, as well as recreation benefits, and increases the cost to the society of
replacing wetland services. Wetland conversion through development or agricultural
production is said to generate "negative externalities" or unintended harmful effects on
individuals. Therefore, this study intended to explore the contribution of various
economic activities (drivers) to wetland degradation, community awareness on the value
of wetland and wetland degradation as well as the economic implication of this
degradation to the local population living in and around the Ruvu riverine wetland area in
Kibaha and Morogoro rural districts which both lies in coastal Tanzania.
1.2 Problem Statement
Human populations in and around the Ruvu riverine basin are heavily dependent on this
river for various socio-economic activities and the influence of these populations has left
its mark on the River’s ecosystem (USAID, 2014). Human activities carried out along the
basin have continued to alter the natural flow regimes of the River and have major
consequences to wetland ecosystems and the community that depend on them (Yanda et
al., 2007). Wetlands degradation is caused by human activities that take place within
them and by activities that take place within the wider catchment (Kashaigili et al., 2006).

4
A study by Sakataka et al. (2014) shows that in many developing countries, which rely on
agricultural and other land-based resources, population boom coupled with diminishing
reliability of rainfall and declining yields have resulted to the expansion of livelihood
activities into wetlands resulting to intensive degradation of wetland areas. In this regard,
studies (e.g. Ngana et al., 2010; Millennium Ecosystem Assessment, 2005; Coleman et
al., 2008; Vermaat et al., 2013) have shown that agriculture, which involves both
modifications of land cover and irrigation abstractions, is the foremost cause of wetland
loss and degradation in many wetland ecosystems. However, little is known regarding the
percentage contribution of various economic drivers to wetland degradation.
This therefore impedes efforts on combating wetland degradation in many wetland areas
in Tanzania. Furthermore, little is documented on the consequences of wetlands
degradation to the ecosystems and to the communities living downstream and which
depends on these wetlands for various uses in Tanzania.
People living in the settlements close to wetlands and earning their living from wetland
resources remain unaware of conservation policies, ignorant of the implications of their
practices and uninformed of the new messages or the long-term benefits they could
achieve from wetland resources (Mironga, 2005). Most studies in Ruvu riverine
(i.e. Munishi et al., 2007; Kashaigili, 2011; USAID, 2014) have focused on rapid
Environmental flow assessment and hydrological and land use cover change. However,
little has been done to assess the general awareness of the communities residing close to
and around this wetland on the value and degradation of wetlands and control measures of
wetland degradation in the area.

5
Generally although previous studies (e.g. Ngana et al., 2010; Munishi et al., 2007;
Kashaigili, 2011; USAID, 2014) have been carried out in Ruvu river wetland none of
these has explicitly quantified the contribution of various drivers to wetland degradation
and economic consequences of wetland degradation to the local population living along
the Ruvu riverine wetland area. Also none of these studies investigated community
awareness on the value of wetlands and consequences of their degradation as well as
community practices against wetland degradation in the area. Therefore, the present study
intended to fill this knowledge gap and improve understanding of the contribution of each
driver to wetland degradation, implication of wetland degradation to the local community
income and the level of the local community awareness on the value of wetland and the
likely consequences of degradation. Furthermore, the study will give an understanding on
the community practices towards controlling wetland degradation within the study area.
1.3 Study Justification
The findings from this study provide useful information to researchers, farmers,
environmental experts, water management authorities, wetland conservation institutions,
policy makers and planners as a basis for decision making in enhancing sustainable
wetland use and management. Further, the findings obtained are also useful in prioritizing
drivers to wetland degradation that need more attention and therefore taking immediate
measures to offset them. Furthermore, the findings also provide baseline data with regard
to contribution of various drivers to wetland degradation, the level of community
awareness on the value of wetland and economic consequences of wetland degradation
which will specifically help in all setups aimed at ensuring the conservation of wetland
resources in the country.

6
1.4 General Objective
The general objective of this study was to quantify the contribution of various drivers to
wetland degradation, community awareness and economic consequences of wetlands
degradation along Ruvu riverine in Coastal Tanzania.
1.4.1Specific Objectives
The specific objectives were to:
(i) Establish evidence on the extent of degradation within the study area,
(ii) Analyse contribution of various economic activities to wetland degradation,
(iii) Assess community awareness on the value of wetland, causes and
consequences of its degradation and their practices on controlling it and
(iv) Estimate economic implications of wetland degradation to household income
1.4.2 Research Questions
(i) What is the extent of wetland degradation in riverine wetland area?
(ii) What is the contribution of various economic activities to wetland
degradation?
(iii) What is the level of awareness in the community on the values of wetland and
their practices on controlling wetland degradation?
(iv) What are the implications of wetland degradation to the income of the local
population around the wetland area?
7
1.5 Limitations of the Study
The study encountered several limitations during data collection. However, necessary
measures were taken to overcome them to ensure success. The following were
limitation’s encountered during this study;
(i) Poor recalling of information
Some respondents were unable to recall their annual average income of the past
five years 2011-2015. This was due to poor record keeping on the amount of
income accrued by the respondents over a period of time. This was minimized by
asking the respondents to recall the quantity of products they extracted from
wetlands and then estimate the annual income and this was complemented with
some secondary data obtained from village offices.
(ii) Unwillingness to disclose income information
Some respondents were not willing to disclose their average annual income level
information due to the fear of insecurity in spite of the researcher’s efforts to
explain the purpose of the study. However, this was minimized by using
alternative questions and altered the methods of questioning which made
households to disclose their information unknowingly.
(iii) Poor record keeping
During this study a problem of getting secondary data of incomes, wetland
productivity and average river flow was encountered. In most villages, there were
difficulties in getting data on average income and productivity from wetland;
however this problem was minimized by consulting previous village leaders and
contacting Wami-Ruvu basin water officers that used to work at Ruvu riverine.

8
(iv) Inadequate funds
Funds for various research activities that were proposed during the proposal
writing to the sponsor was also a problem because the sponsor had provided only
44.44% of the basic university research fund required for MSc. Study. This led to
a number of problems in purchasing field gears as well as accessing secondary
materials that were needed to be purchased such as satellite image of change
detection. However, this was minimized by using researcher’s own money to
ensure success of the study.

9
CHAPTER TWO
2.0 LITERATURE REVIEW
2.1 Overview
This chapter presents summary of relevant scholarly perspectives on definitions of
various terms, wetland management and conservation in Tanzania; wetland degradation;
various drivers of wetland degradation; community awareness on values of wetland and
wetland degradation and the control practices and the economic implication of wetland
degradation to local communities and biodiversity.
2.2 Definition of terms
2.2.1 Wetland Degradation
Wetland degradation is the alteration of an existing wetland through impairment of some
physical and chemical property leading to decrease functions and values that it can
provide to the ecosystem and human population. Wetland degradation is caused by both
human and natural activities taking place around and within the wetland area and are the
most driving force for wetland degradation globally (Ramsar, 2015).
2.2.2 Riverine
A riverine is a landscape formed by the natural movement of a water system such as a
river. A riverine landscape includes the ecosystems (all living things including plants and
animals) in and around the area of a river. A riverine may also be defined as a network of
rivers and surrounding land. Riverine landscapes are excellent for agricultural uses such
as farming because the land is rich and fertile. They are a valuable resource for growing
food (Ramsar Convention Secretariat, 2013).

10
2.3 Wetland Management in Tanzania
There are several wetland management strategies that are aimed at attaining sustainable
wetland management in Tanzania. The strategies include provisions in natural resources
management policies and guidelines that address important matters that are related to the
conservation and management of wetlands. Various policies such as National Agriculture
Policy (2013), National Water Policy (2002), Fisheries Policy (2015), National Forest
Policy (1998), Land policy (1997), The National Environmental Policy (1997), Wildlife
policy (2007) and Livestock policy (2006) and National Guidelines for Sustainable
wetland Management all of these incorporated the need for proper management and use
of wetlands in Tanzania. However, these policies and guidelines are fragmented and
uncoordinated due to diverse sectorial objectives, goals, administration and specialized
legislation and, as a result, many wetlands in Tanzania are being degraded by diverse
human economic activities. Thus, some of the policies need to attain successful utilization
of these resources regardless of the impacts of the practices stipulated in the policy
(URT, 2007). For example, the land policy of 1997 categorizes wetlands as hazardous
areas and therefore these areas are not allowed by law to be entitled to any individual or
group of individuals for whatever use (URT, 1997), the agriculture policy on the other
hand encourages efforts to be taken to develop an effective irrigation system in the
country. This is because irrigation ion is considered to be essential for increased
productivity and production as it mitigates vagaries of weather, which are becoming more
frequent and intensive because of global climate change. This policy however does not
say specifically as to what sustainable wetland management measures need to be
established under irrigation schemes and therefore creating a loophole for more
degradation of wetlands in the country (URT, 2013). A part from the various policies and
guidelines on wetland management mentioned above in year 2000 Tanzania ratified the
convention of international importance on wetlands known as Ramsar Convention which

11
essentially encourages the wise use of wetlands among contracting parties. Among the
wetland that has been listed as Ramsar sites in Tanzania include the Malagarasi –
Muyovozi Wetlands, Lake Natron Basin, Kilombero valley floodplain and Rufiji-Mafia-
Kilwa Marine Ramsar Site. The convention calls upon the contracting parties to establish
appropriate laws and policies to ensure that wetland resources are not depleted. This has
remarkably helped to reduce degradation in these areas as opposed to those areas which
are not designated into this category (Majamba, 2012).
2.4 Wetland Degradation
Over years human activities has been the main cause of wetland degradation and loss by
changing water quality, quantity or flow rates, increasing pollution and change the
make-up of the species within habitat as well as the total functions and values that
wetlands can provide to human and the ecosystem. As Bai et al. (2013) observe, with the
rapid growth in human populations, wetlands worldwide are suffering from serious
degradation or loss resulting from wetland pollution, wetland reclamation, civilization
and land use changes. Wetland degradation has potential negative influence on human
health, biodiversity, regional climate, and regional ecological security. The use of various
remote sensing and GIS techniques for environmental policy development and evidencing
degradation is now quite common and useful in assessing the state of ecosystems, as
images from remote sensing platforms are often used to focus attention on emerging
environmental issues and spur debate on potential policy solutions and conservation of
natural resources in many parts of the world. However, the use of these instruments in
policy implementation and evaluation has not been examined in much detail. Remote
sensing data have been used extensively both to assess the loss of wetland area and, to a
lesser degree, to assess the loss of wetland functions and services. These efforts have led
to a more detailed understanding of wetland conditions such as vegetation community

12
characteristics, hydrologic regimes, and soil conditions. These biophysical details can
identify degradation that affects the total functional area of a wetland, as well as the
ecosystem services it may provide. However, these efforts have rarely led to anything
beyond limited requirements for monitoring (Mayer et al., 2011). Xie et al. (2008)
reported that Satellite remote sensing has several advantages for monitoring wetland
resources, especially for large geographic areas and no man's land since it gives clear
evidence of the land use change that has been happening over the years.
2.5 Drivers of Wetland Degradation
Over the years, wetland health has been affected by poor agricultural practices which
cause negative changes to wetland environments. A study by Vermaat et al. (2013) on
meta-analysis of 105 wetland study cases reported that agricultural development has been
the main proximate cause of wetland conversion whereby economic growth and
population density are the most frequently identified underlying forces. Significant factors
explaining wetland conversion in the order of importance include market influence, total
wetland area, mean annual temperature and cropland or built up area.
According to Munishi et al. (2014), the major reasons for degradation in many parts of
Tanzania are increasing human population, exploitation of wetland resources and
conversion of wetlands into agricultural land. Inappropriate grazing regimes and stocking
rates associated with increasing livestock population, increasing irrigation activities as
well as lack of proper wetland management policies and strategies continue to threat
wetland areas in different parts of the world causing changes in the services and goods
accrued from wetland resources (URT, 2007).
Conflicts between famers and livestock keepers are now very common in the Tanzania
especially in wetland areas which are rich in soil and biodiversity; this is due to increased

13
human population resulting into increased demand for areas for agriculture and livestock
keeping, food and income generation. This demand has resulted into serious wetland
degradation because such wetlands become overexploited (Kashaigili et al., 2006).
Various communities (the local farmers as well as the immigrant livestock keepers)
encroach the wetland areas in different parts of the world. The multiple uses of the rivers
and insufficient human and financial resources for proper water resources management
threaten the efforts of conserving the natural resource, and the diversity of users.
Further, people’s relationships with the environment have also posed additional
challenges to wetlands management plans country wide. Among other reasons that have
been witnessed to function as drivers of degradation include urbanization, industrial
development, and population growth. Absence of specific policy on wetland adds to poor
implementation of the existing policies which have connections to wetlands and thus
putting wetlands under pressure of degradation by various anthropogenic activities.
On the other hand, lack of well-organized institutional arrangement provides a loop for
various driving forces to wetland degradation to have severe consequences in many parts
of the world.
2.6 Awareness on the Values of Wetland and Consequences of Degradation and
controlling practices
Awareness is the ability to directly know and perceive or to be conscious of events,
conditions, situations or objects existing in a particular area. Local communities living
around wetlands areas are relatively unaware of diverse ecosystem service that can be
accrued from wetland areas. Kateregga (2005) shows that most wetland resource users are
relatively aware of only three direct benefits of using wetlands such as water for
agriculture activity, water for domestic and industrial use and fishing activity making

14
them to underrate the present and future values of wetlands. Such perceptions and attitude
have often led to inappropriate management practices and consequently wetland
degradation. Low awareness on the total value of wetland among the communities living
adjacent to wetlands is one of the reasons for improper use and poor management of
wetlands resources. A study by Finlayson et al. (1999) shows lack of adequate
information and awareness on national inventories on wetland degradation that indicates
the real extent and loss of wetlands as well as consequences of that degradation as the
main reasons for persistent wetland degradation. Further, there is little information on
the values and benefits (products, functions and attributes) derived from wetlands and
how these have been degraded or lost. Moreover, lack of awareness and understanding
on non-ecological causes of wetland degradation continue to threaten wetlands in
many parts of the world. It is generally accepted that community involvement in
understanding local resources increases the possibilities of taking management measures.
For example, local knowledge has been used in monitoring water quality and grazing
landscapes to understand how ecological changes happened on such landscapes over time
and space. A study by Pender et al. (2008) found out that there is a strong association
between awareness and compliance with Natural Resource Management bylaws.
Therefore, this suggests that there is a need to promote environmental education as part of
the strategy to increase compliance with NRM bylaws.
2.7 Economic Implications of Wetland Degradation to Household’s Income
According to Wasswa et al. (2013), degradation of wetlands implies serious economic
costs to the government and local communities reflected in high expenditures in
duplication of wetland services, foregone incomes, livelihood support and alternative
employment. According to Ramsar (2015) wetlands support family livelihoods through
crop production, grazing pastures, fishing, hunting, harvesting medicinal plants and
artisanal works. However, with all the potential benefits wetland provides and given the

15
extent of ongoing exploitation of these wetlands resources there are many reasons to
believe that these important areas are fast degrading and disappearing before much is
known about them. Ramsar (2015) report shows that the trend of services and goods
offered by wetlands decline overtime due to increased human population and utilization
pressure of the wetland resources in different parts of the world. Also because of wetland
losses and degradation, people are deprived of the ecosystem services that wetlands
provide. Adverse changes to wetlands are estimated to result in more than 20 trillion US$
in losses of ecosystem services annually globally (Ramsar, 2015). Wetlands also play an
essential role in food security, especially during dry seasons or drought years, when dry
land farming, which is limited to the rainfall season, cannot adequately cater for the needs
of these households (URT, 2007). Similarly, Mekonnen et al. (2011) reported that
wetland losses are affecting the rural food security, water availability, climatic variability,
and biodiversity.
A study by McCartney et al. (2004) revealed that in Kilombero, the wetlands contribute
98% to the food security intake of all households in the villages. Forty percent of the
households acknowledge using wetlands as a coping strategy during food shortages but
this is estimated to decline due to improper wetland use which results to degradation.
Farming activities are among the major economic pursuits around wetlands areas.
The crops cultivated include paddy, maize, and various types of vegetables and fruits
(URT, 2007). The practice of growing rice in swampy areas is increasing in many African
countries and the world at large as it contributes to food supply and income generation.
Although many wetlands have been supporting local communities, these activities,
population boom, and the need for development tend to threaten these wetlands result to
degradation and a decline in goods and services offered by these wetlands.

16
CHAPTER THREE
3.0 METHODOLOGY
3.1 Overview
This chapter is organized into three main sections, the first section presents study area
descriptions, the second section presents the methods used in this study and the last
section presents the data analysis techniques used in this study.
3.2 Study Site Description
The study was conducted in five villages namely Kidunda, Kibangile, Nige, Ruvu
Stesheni, and Minazimikinda which are close to Ruvu riverine wetland area. Ruvu River
is one of the major East African rivers that drain the Eastern Arc Mountains, with a basin
area of approximately 18 000 km2. This basin is typically sub-divided into smaller
catchments: the Mgeta, Ngerengere, Upper Ruvu of the Morogogo region, and the Middle
and Lower Ruvu in the Coast Region (USAID, 2014). The Ruvu River and its tributaries
are one of the systems that form part of the Wami/Ruvu Basin, an administrative
designation by the Tanzanian Ministry of Water under which the Ruvu, Wami, and
coastal drainages are collectively managed by the Wami/Ruvu Basin Water Office
(WRBWO). The catchment of the River lies in the Eastern Arc Mountain at latitudes 6°
05’ and 7° 45’ south and longitudes 37° 15’ and 39° 00’ east. This study was conducted in
the villages lying close to the upper, middle and lower parts of the Ruvu riverine wetland
area located in Morogoro and Coast regions to account for the contribution of various
drivers to wetland degradation, awareness of the local community on values of wetland,
and the consequences as well as the economic impact of wetland degradation.

17
Source: Sokoine University GIS Lab.
Figure 1: Map showing the location of the study area

18
3.3 Methods
3.3.1 Research Design
A cross sectional survey design was used in this study. The study design was chosen
because it is well suited to the goal of describing variables and their distribution patterns
and it allows data to be collected at a single point in time. Therefore the design is
economic in nature; and it is suitable in situations where time is limited (Hulley et al.,
2013).
3.3.2 Sampling procedure
A purposive sampling technique was used to select three wards from the study area, one
from each of the following, Upper Ruvu, Middle Ruvu, and Lower Ruvu. Two villages
from Upper Ruvu, one from Middle Ruvu and two from Lower Ruvu, making a total of
five study villages were purposively selected based on their proximity to the wetland and
the use of the wetland area for various socio-economic activities. Simple random
sampling was employed to obtain a sample population, and which was obtained from the
updated village register from the Village Chairman using a lottery technique. A total of
122 respondents were selected from the five study villages. Purposive sampling technique
was used for administering interview to key informants namely water committee
members in each village, government agricultural officials, and Ruvu basin officials who
formed a part of the sampling frame for this study. One focus group discussion with 6 to
10 individuals was carried out in each village to obtain more primary data for answering
the specific objectives.
3.3.3 Sample size determination
A sample size was calculated based on Boyd et al. (1981 cited by Munishi et al., 2012)
who recommend that a random sample should constitute at least` 5% of the total

19
population to be representative of the whole study population. The formula for
determining sample size is:
n/N ≥ 5%
Where: N = is the total households in the village
n = is the number of selected households.
Table 1: Number of respondents interviewed in the surveyed study villages
Village Total number of
households Number of sampled
households Sample size
(%)
Kidunda
640
32
5
Kibangile
560
28
5
Nige
445
22
5
Ruvu stesheni
280
14
5
Minazimikinda
520
26
5
Total 2 445 122 5
3.3.4 Data collection
Both qualitative and quantitative methods were used in data collection for this study
where the primary and secondary data were collected.
3.3.4.1 Primary data collection
(a) Reconnaissance survey
Prior to the actual field data collection, a reconnaissance survey was carried out so as to
pre -test the questionnaire to ascertain the validity and reliability of the questions. A total
of 15 households were randomly selected to pre-test the questionnaire. Amendments were
done to increase precision of the tool for data collection. Reconnaissance survey helped
the researcher to familiarize with the study area, study population and the proper method
of administering data collection tools.

20
(b) Questionnaire survey
A questionnaire with open and closed ended questions (Appendix 1) was used to obtain
primary data during this study. The sampling unit for the study was households where a
total of 122 households were surveyed during this study. A household is defined as that
which consists of all people who occupy a particular housing unit as their usual residence
where each occupied housing unit contains one and only one household (American
Housing Survey, 2013). The questionnaire was designed to collect socio-economic
characteristics of the respondents, community perceptions as well as other variables from
specific objectives of this study.
Plate 1: Interviewer administering a questionnaire to respondent
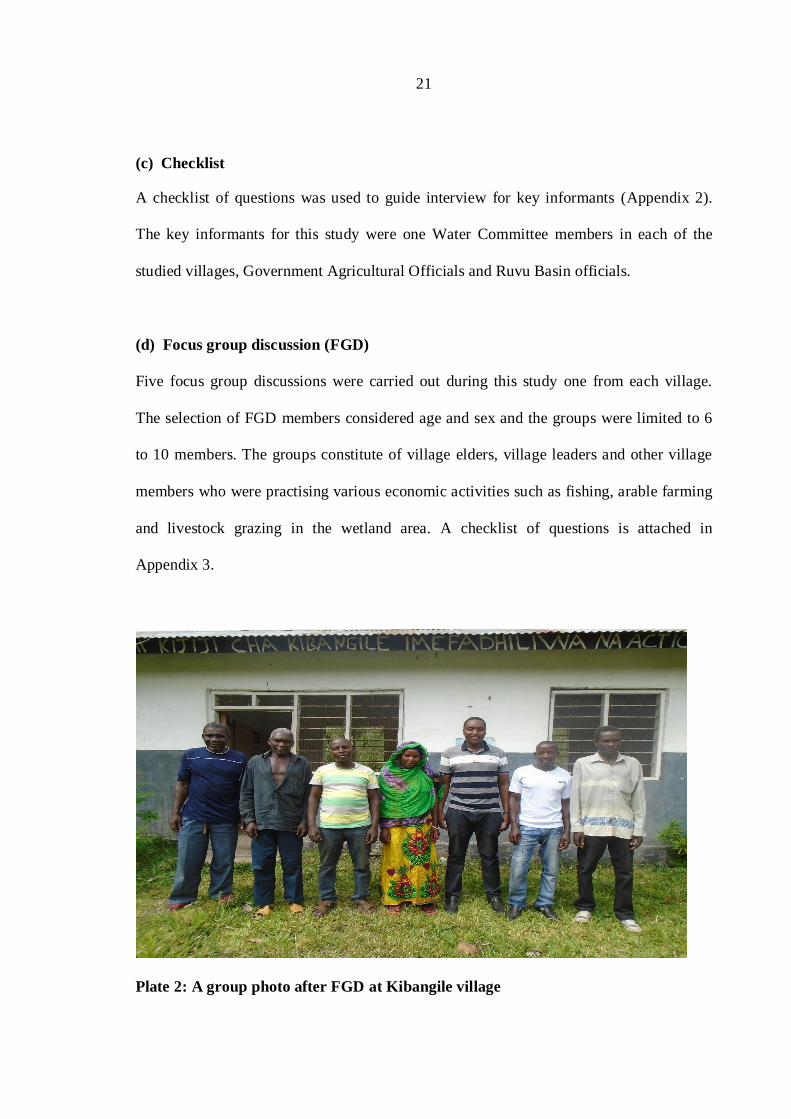
21
(c) Checklist
A checklist of questions was used to guide interview for key informants (Appendix 2).
The key informants for this study were one Water Committee members in each of the
studied villages, Government Agricultural Officials and Ruvu Basin officials.
(d) Focus group discussion (FGD)
Five focus group discussions were carried out during this study one from each village.
The selection of FGD members considered age and sex and the groups were limited to 6
to 10 members. The groups constitute of village elders, village leaders and other village
members who were practising various economic activities such as fishing, arable farming
and livestock grazing in the wetland area. A checklist of questions is attached in
Appendix 3.
Plate 2: A group photo after FGD at Kibangile village

22
(e) Direct observation
According to Erlandson et al. (1993), observations enable the researcher to describe the
existing situations using five senses, providing a "written photograph" of the situation
under study. During this study, a number of field visits were made to ascertain the
presence of degradation along the wetland area. Photographs were taken as evidence of
wetland degradation in the study area. Supplementary information, which was obtained
from field visits, was used to cross check the information obtained from questionnaire and
the secondary data which were obtained from various sources.
Plate 3: Tree along the wetland defoliated by livestock keepers for feeding
their livestock

23
3.3.4.2 Secondary data
During this study, a review of key literature was used to obtain secondary data. A review
of satellite images was used to provide evidence of various incidences of disturbance
which lead to wetland degradation. Other relevant sources from Wami Ruvu Water Basin
Offices and Sokoine National Library were used to provide more secondary data for this
study.
3.3.4.3 Satellite image acquisition
Time analyses of land cover change requires a proper selection and preparation to ensure
that there is compatibility of the Landsat images. In this study the images were
downloaded from freely available United States Geological Surveys (USGS) and Earth
Explorer websites. The images were selected from the same season (July-September) and
with minimal cloud cover (<10%). The images were from different sensors with similar
spectral resolution of 30 meters. The images used were from the Landsat Thematic
Mapper(TM) and Landsat Operational Land Imager (OLI) for years 2007 and 2016
respectively.
3.4 Data Analysis
3.4.1 Descriptive analysis
The data from households’ questionnaire survey were coded and assigned variables in
Statistical Package for Social Sciences (SPSS) whereby quantitative data were subjected
to descriptive statistics. Outputs such as frequencies and percentages were obtained.
3.4.2 Content analysis
Information obtained from Focus Group Discussions, key informants interviews and other
qualitative information from household questionnaire was analysed using content analysis
whereby raw data were broken down into meaningful units of information (Kothari,

24
2004). The information was categorized according to the study objectives and discussed
to develop themes and tendencies that answer the study objectives.
3.4.3 Simple linear regression model
Simple linear regression model was used to measure the relationship between average
river discharge and a change in income of the respondents whereby the average income of
all the respondents for five years was regressed against the average river flow in five
years (2011-2015). This enabled to predict whether or not the dependent and independent
variable were significantly related and this enabled to measure the strength of their
relationship and ascertain whether a change in the average river discharge has impacted
on the livelihood of the local population living alongside the Ruvu River wetland area.
The length of time of five years was found to be suitable due to the reason that the
estimates of income were relying on memory and therefore taking too many years could
be difficult for the respondents to remember. The estimated empirical regression model,
which was used, is specified in the equation below.
𝑌 = 𝛽0 + 𝛽𝑋 + 𝜀…………………………....................................................................... (i)
Where;
𝑌 = dependent variable (Average households annual income in past five years)
𝑋 = independent variables (𝑋 =Average annual river discharge in past five years).
𝛽0, 𝛽= parameters estimated;
𝜀 = error term.
𝑋 =Average river water discharge
It was hypothesized (keeping other factors constant) that change in average river
discharge would have some influence in a decrease or an increase of the average annual
household income in the study area. An increase in the average discharge was expected to

25
lead to an increase in productivity of agricultural crops and fish population. Therefore, an
increase in incomes and a decrease in the average river discharge were expected to lead to
a decrease in the average annual household’s income in the study area. The coefficient of
determination R2 was used to tell how much variations of the dependent variable has been
explained by the independent variable.
3.4.4 Satellite image analysis
3.4.4.1 Image pre-processing
The Images were radiometrically and atmospherically corrected using the LEDAPS tool.
The Landsat Ecosystem Disturbance Adaptive Processing System (LEDAPS) is a NASA
project which maps disturbance, regrowth, and permanent forest conversion across the
continent (Masek et al., 2006). The LEDAPS processes Landsat imagery to surface
reflectance, using atmospheric correction routines developed for the Terra MODIS
instrument (Vermote et al., 1997).
3.4.4.2 Classification and collection of the training signatures
The Supervised classification is the methodology which was adopted for classifying the
images. The supervised classification is the type of classification where the user collects
samples of the land cover classes (training data sets) for different land cover classes and
the image classification software determines each class in terms of what it resembles most
in the training signatures to perform the classification. The images were classified into 6
different land cover classes as shown in the Table 2.

26
Table 2: Land Use Land Cover (LULC) Categories
Land Use Land
Cover (LULC)
Categories
LULC
Categories for
mapping
National Land Cover Description
Forest Woodland an area of land with at least 0.5 ha, with a minimum tree crown cover of 10% or with existing tree species planted or natural having the potential of attaining more than 10% crown cover, and with trees which have the potential or have reached a minimum height of 5m at
maturity in situ. It includes Montane, lowland, mangrove and plantation forests, woodlands and thickets.
Bushland Bushland Bushland is fundamentally defined as being predominantly comprised of plants that are multi-stemmed from a single root base. It includes dense and
open bushland
Grassland Grassland For the most part, grassland occurs in combination with either a limited wooded or bushed component, or with scattered subsistence cultivation
Agriculture Land Cultivated Land
with Scattered Settlements
Land actively used grow agriculture crops including
agro forestry systems, wooded crops, herbaceous crops and grain crops
Other Lands Bare Soil Land that includes bare land and rock outcrop, Costal bare lands, Ice cap / snow
Water Water Includes inland water/Riverine
3.4.4.3 Post-classification processing
Post-classification processing included recoding, majority filtering, clumping, elimination
and mosaicking. The 3 by 3 majority filter was employed to the recoded image to reduce
the salt and paper effect. And lastly, the classes where filtered to a minimum mapping
unit of about 0.5 ha to conform to the forest definition, that is the minimum size is 0.5 ha.
3.4.4.4 Land cover change analysis and cross tabulation
Change detection is one of the most important applications of remote sensing techniques
due to its capability of repetitive acquisition imageries with consistent image quality, at
short intervals, on a global scale, and during complete seasonal cycles (Kashaigili, 2006).

27
The Land Cover change detection was done using ArcGIS10 software. The two classified
Land cover layers that is, Land cover 2007 and 2016 were used. The spatial analysis tool
using the spatial analysis zonal tabulate area function was used to generate land cover
change matrix. The function calculates cross-tabulated areas between two datasets and
outputs a table. The table displays a record for each unique value of the zone dataset and a
field for each unique value of the class dataset. The calculated geometry was used to
calculate the areas (in hectares) of each land cover in the matrix.
Figure 2: Methodology adopted
GIS Overlay analysis
Land Cover change assessment
Estimates of Land Cover Change
Land Cover map 2007
Landsat Imagery for year 2007 and 2016
LEDAPS
Landsat – 2007
Supervised classification, majority
filtering, clump, eliminate
Landsat – 2007
Vectorization, elimination and Label Aggregation
SURFANCE REFLECTANCE
Landsat – 2007
Pre-processed
Land Cover map 2016
Landsat –2016 Pre-processed
Landsat – 2016
Supervised classification, majority
filtering, clump, eliminate
Landsat – 2016
Vectorization, elimination and Label
Aggregation

28
CHAPTER FOUR
4.0 RESULTS AND DISCUSSION
4.1 Overview
This chapter is organized into five sections, the first section presents socio-economic
characteristics of the respondents; the second section presents evidence of wetland
degradation from satellite; the third section presents the contributions of various
economic activities to wetland degradation in the study area; the fourth section presents
results on community awareness on values of wetland, causes and consequences of its
degradation and control practices and the last section presents the economic implication
of wetland degradation to household income.
4.2 Social Economic Characteristics of the Respondents
4.2.1 Education level of the household heads
Findings in Table 3 present education level of the household heads. As indicated in
Table 3, the study shows that 77.90% of the household heads had primary education
while 18% of the household heads had no formal education; 2.50% of the household
heads had secondary education and very few of the household heads had college
education. The findings imply that the level of education in the study area is low as even
those who attended primary education some did not finish Class Seven; therefore
education level among the respondents was low. The level of education has a direct link
with sustainable utilization of wetland resources as well as understanding of drivers of
wetland degradation and the consequences of wetland degradation to the livelihood of the
area. As argued by Kateregga (2015), education is an important variable that influences
individual’s choice with respect to resource use. Education is believed to shape people’s
perception of their environment and what it can offer hence it helps them build up their
socio-economic status. Education also may influence the way people use their natural
resources.

29
Table 3: Socio-economic characteristics of respondents
Sample Villages
Variable Kidunda
(n=32)
Kibangile
(n=28)
Nige
(n=22)
Ruvu station
(n=14)
Minazimikinda
(n=26)
Total (n=122)
Sex
Male 19(59.4) 13(46.4) 13(59.1) 11(78.6) 10(38.5) 66(54.1)
Female 12(40.6) 15(53.6) 9(40.9) 3(21.4) 16(61.5) 56(45.9)
Age of respondent
18-28 2(6.2) 4(14.3) 3(13.6) 1(7.1) 4(15.4) 14(11.5)
29-39 7(21.9) 7(25.0) 7(31.8) 4(28.6) 8(30.8) 33(27.0)
40-50 10(31.2) 10(35.7) 3(13.6) 4(28.6) 7(26.9) 34(27.9)
51-61 7(21.9) 5(17.9) 3(13.6) 2(14.3) 5(19.2) 22(18.0)
62-72 5(15.6) 2(7.1) 6(27.3) 3(21.4) 2(7.7) 18(14.4)
73 and Above 1(3.1) 0(0.0) 0(0.0) 0(0.0) 0(0.0) 1(0.8)
Education level of
respondent
No formal education 8(25.0) 7(25.0) 2(9.1) 1(7.1) 4(15.4) 22(18.0)
Primary education 24(75.0) 20(71.4) 19(86.4) 12(85.7) 20(76.9) 95(77.9)
Secondary education 0(0.0) 1(3.6) 1(4.5) 0(0.0) 1(3.8) 3(2.5)
Attended collage 0(0.0) 0(0.0) 0(0.0) 1(7.1) 1(3.8) 2(1.6)
Marital status of the
respondents
Married 26(81.2) 28(10) 17(77.3) 11(78.6) 21(80.8) 103(84.4)
Single 1(3.1) 0(0.0) 2(9.1) 3(21.4) 3(11.5) 9(7.4)
Widow 3(9.4) 0(0.0) 2(9.1) 0(0.0) 2(7.7) 7(5.7)
Divorced 0(0.0) 0(0.0) 1(4.5) 0(0.0) 0(0.0) 1(0.8)
Separated 1(3.1) 0(0.0) 0(0.0) 0(0.0) 0(0.0) 1(0.8)
Widower 1(3.1) 0(0.0) 0(0.0) 0(0.0) 0(0.0) 1(0.8)
Household Size
1-3 2(6.3) 7(25.0) 6(27.3) 6(42.9) 6(23.1) 27(22.1)
4-7 22(68.8) 19(67.9) 16(72.8) 8(57.1) 20(76.9) 85(69.7)
8-11 8(25.0) 1(3.6) 0(0.0) 0(0.0) 0(0.0) 9(7.2)
12 and Above 0(0.0) 1(3.6) 0(0.0) 0(0.0) 0(0.0) 1(0.8)
Occupation of
respondents
Farming 20(62.5) 20(71.4) 14(63.6) 5(35.7) 5(19.2) 64(52.5)
Farming and fishing
activities 8(25.0) 4(14.3) 2(9.1) 6(42.9) 6(23.1) 26(21.3)
Farming and
entrepreneurship 3(9.4) 4(14.3) 6(27.3) 2(14.3) 14(53.8) 29(23.8)
Farmer and wage
employment 1(3.1) 0(0.0) 0(0.0) 1(7.1) 1(3.8) 3(2.5)
Farm size of
respondents
0-4 29(90.6) 27(96.4) 21(95.5) 7(50.0) 23(88.5) 107(87.7)
5-9 2(6.3) 0(0.0) 1(4.5) 4(28.6) 1(3.9) 8(6.6)
10-14 1(3.1) 1(3.6) 0(0.0) 3(21.4) 2(7.7) 7(5.7)
Types of crop grown
along the wetland
Maize 5(15.6) 4(14.3) 3(13.6) 1(7.1) 3(11.5) 16(13.1)
Rice 2(6.2) 1(3.6) 4(18.2) 10(71.4) 22(84.6) 39(32.0)
Maize and Rice 3(9.4) 16(57.1) 10(45.5) 2(14.3) 1(3.8) 32(26.2)
Vegetables 12(37.5) 3(10.3) 5(22.7) 1(7.1) 0(0.0) 21(17.2)
Sesame 1(3.1) 3(10.3) 0(0.0) 0(0.0) 0(0.0) 4(3.3)
Millet 9(28.1) 1(3.6) 0(0.0) 0(0.0) 0(0.0) 10(8.2)
Key: In brackets are percentages

30
4.2.2 Marital status of the household heads
Results in Table 3 show that 84.4% of the surveyed households were married, 7.40%
were single, 5.70% were widows while only 1% of the surveyed household were
divorced, separated and widower respectively. The results imply that most of the
surveyed households had a husband and a wife plus children who were able to engage in
various production activities along the wetland area.
4.2.3 Household size
Results in Table 3 indicate that 69.77% of the surveyed households had a size of 4-7
people. This average household size conforms to the national household size which is 4.8.
Kibaha District and Morogoro Rural District had household sizes of 4.1 and 4.2
respectively (NBS, 2012). Large household size has an implication on wetland resource
utilization. Having many individuals in the family is more likely to have them engaged in
various wetland resource utilization such as farming, fishing and the like, which leads to
an increase of the chance of degradation due to an increase in resource utilization
pressure. The findings are in line with those in a study by Hatibu (2010) who indicated
that large household size has an implication in resource utilization because large
household size means high consumption units within the household and which can lead to
more resource extraction leading to the degradation of that particular resource.
4.2.4 Occupation of the respondents
Findings from Table 3 show that 52.50% of the respondents were engaged in farming
activities along the wetland. About 21% of the respondents were engaged in both farming
and fishing while 23.80% were engaged in farming and entrepreneurial activities. Only a
small percentage of the respondents were engaged in farming and wage employment.
The results show that farming is the most prevalent occupation of the respondents in the

31
area as it functions as a source of income and food among the respondents. Therefore,
farming practices contribute to wetland degradation in the area. The availability of fertile
soil and wet area that support farming year round is the main reason for most of the
respondents to engage in farming activities along the wetland in the study area.
The findings concur with those from a study by Lippu (2008) who reported that crop
production was a dominant activity as it support livelihood in many communities.
4.2.5 Farm size of the respondents
Results in Table 3 show that 87.70% of the respondents had farms in the wetland with
average sizes of 0 to 4 acres, 6.56% had average sizes of 5 to 9 acres; few respondents
had farms with average sizes of 10-14 acres. The study reveals that most of the farmers
had small farm sizes in the wetland area because of the nature of the landscape. In areas
which are dominated by hills and uplands people were found to have small farm sizes
while in areas such as Ruvu ward which had flat terrain respondents were found to have
large farm sizes. Farm sizes are directly linked to wetland use for those who practice
irrigation agriculture whereby farmers with very large farms are more likely to abstract
large volumes of water from the river than the ones with small size farms. On the other
hand, having large farm size means application of more chemicals which in turn leads to
chemical spills to wetland resulting to significant degradation of these areas. Also, large
sizes of farms influence productivity; the respondents who had large farms were found to
have being producing more agricultural crops than farmers who owned very small farms.
4.2.6 Types of crops grown
Table 3 depicts the main type of crops that were grown within the study area. Rice was
found to be the main crop that was grown in the area whereby 32% of the respondents
were engaged in rice production and 26.20% of the respondents were engaged in both

32
maize and rice production . A significant number of respondents were found to be mostly
engaged in vegetable production during the dry season of the year whereby most of the
wetland areas have low water volume. The results reveal that abstraction of water for
watering crops is normally done during the dry season for watering vegetables and this
significantly affects the wetland area. The types of crops grown in the wetland areas have
different requirements of water for growth: some crops require large amount of water and
therefore increases the likelihood of high water abstraction from wetland, while other
crops require a little amount of water for growth and maturity.
4.3 Evidence of Wetland Degradation from Satellite Images
An increase in human populations triggers pressure to land and other resources due to
increased needs for areas for settlement, farming and grazing, and therefore subjecting
these areas to environmental destructions. Figures 3, 4, and 5 provide evidence of
degradation along Ruvu riverine wetland area from satellite imagery of the study wards.
According to the findings, a change in land use including agriculture expansion, mining,
and livestock grazing along the area has been found to cause significant wetland
degradation due to clearing of forests for opening up new farms and feeding livestock
within the study wards.

33
Figure 3 (a): Degradation in Ruvu ward as detected by 2007-17 Imagery
0
100
200
300
400
500
600
700
800
900
Agriculture Bushland Forest Grassland Water
Year:2007 601 641 874 585 153
Year:2016 734 786 602 544 187
Figure 3 (b): Land use change in Ruvu ward as computed from 2007-16 imagery

34
Figures 3 (a) and (b) show degradation in Ruvu ward; the area is highly dominated by
agriculture activities due to the presence of flat terrain which supports crop farming.
Findings in Table 4 show that agriculture expansion has increased by 2.2% whereas forest
cover has decline by -4.1%.
Table 4: Land cover change in Ruvu ward
Land Use/ Cover Types Land Cover Land Cover Change Annual change rate
Year: 2007 Year: 2016 2007-2016
Ha % Ha % Ha %
Agriculture 601 21 734 26 133 2.2
Bushland 641 22 786 28 145 2.3 Forest 874 31 602 21 -272 -4.1
Grassland 585 20 544 19 -41 -0.8
Water 153 5 187 7 34 2.2
Total 2 854 100 2 853 100 -1

35
Figure 4 (a): Degradation in Mkulazi ward as detected by 2007-17 Imagery
0
5,000
10,000
15,000
20,000
25,000
Agricultur
e
Bare Soil Bushland Forest Grassland Water
Year:2007 780 2 20,194 10,509 2,560 151
Year:2016 903 12 18,415 6,097 8,621 147
Figure 4 (b): Land use change in Mkulazi ward as computed from 2007-16 imagery

36
Figures 4 a and b show degradation in Mkulazi ward;, the findings reveal that the area is
dominated by farming due to the presence of flat terrain and fertile land close to wetland
area. Further findings in Table 5 show that agriculture expansion has increased by 1.6 %
from 2007-2016. Bush land has been reduced by -1.0 % due to invasion by livestock
keepers who cut down trees to feed their livestock along these areas. Also the findings
show that the forest area has been reduced by -6% and this is due to the opening up of
new farms close to the wetland area hence exposing the wetland area to more degradation.
Table 5: Land use cover change in Mkulazi ward
Land Use/ Cover Types Land Cover Land Cover Change Annual change rate
Year: 2007 Year: 2016 2007-2016
Ha % Ha % Ha %
Agriculture 780 2 903 3 123 1.6
Bare Soil 2 0 12 0 10 19.9
Bushland 20 194 59 18 415 54 -1 779 -1.0
Forest 10 509 31 6 097 18 -4 412 -6.0
Grassland 2 560 7 8 621 25 6 061 13.5
Water 151 0 147 0 -4 -0.3
Total 34 196 100 34 195 100

37
Figure 5 (a): Degradation in Kisemu ward as detected by 2007-17 Imagery
0
200
400
600
800
1,000
1,200
1,400
1,600
1,800
Agriculture Bushland Forest Grassland Woodland
Year:2007 409 1,423 505 806 658
Year:2016 431 1,735 298 805 532
Figure 5 (b): Land use change in Kisemu ward as computed from 2007-16 imagery

38
The findings in Figures 5 a and b show that Kisemu ward is dominated by bush land and
therefore supports more grazing which seriously affects the wetland area. Further, the
findings in Table 6 show that bushland has increased by 2.2%. The presence of bush land
in this area attracted a number of livestock keepers including the Wasukuma and
Wamasai from Tabora and Dodoma in search for green pasture. On the other hand, forest
cover close to wetland area of Kimboza forest reserve, which forms an important
catchment of Ruvu riverine, has been reduced by -5.9% due to invasion by people for
settlement as well as farming activities.
Table 6: Land cover change in Kisemu ward
Land Use/ Cover Types Land Cover Land Cover Change Annual change rate
Year: 2007 Year: 2016 2007-2016
Ha % Ha % Ha %
Agriculture 409 11 431 11 22 0.6
Bushland 1 423 37 1 735 46 312 2.2
Forest 505 13 298 8 -207 -5.9
Grassland 806 21 805 21 -1 0.0
Woodland 658 17 532 14 -126 -2.4
TOTAL 3 801 100 3 801 100 0
Various vegetation types that were close to the wetland have been cleared for opening up
new farms for crop cultivation, settlements and livestock feeding in most study wards.
On the other hand, improper irrigation systems threaten the wetland due to extensive
abstraction of water for watering crops. Chemicals from agriculture and industrial effluent
degrade the wetland causing massive loss of various animal species within this wetland.
The study also found out that degradation results into a change of river flow and therefore
impacts negatively on the livelihood of the community that depends on it for various
services. The findings are not different from those in a study by Yanda and Munishi
(2007) and Kashaigili (2008), who reported that land use change leads to wetland
degradation and this has a critical impact on hydrological regimes in Tanzania resulting to
myriad of consequences to the livelihood of the communities that depend on the wetlands.

39
Also the results do not differ much from the study by Mutie et al. (2005) who reported
that changes in Land use/cover results in significant hydrologic changes, whereby
removal of forest cover results to decreased interception, evapotranspiration and increased
runoff volumes. According to CSIRO (2005) in Mutie et al. (2005), a tree canopy can
intercept 10-40% of incoming precipitation (commonly 10-20%) depending on factors
such as tree species, density of stand, age of stand, location, rainfall intensity; and
evaporation during or after a rainfall event, forest disruption, such as logging, forest fires
and wind damage all of which can have major effects upon the canopy characteristics of
forest stands and hydrological processes in the watershed. Where forest cover is
permanently removed for the purposes of agriculture or urbanization, the hydrologic
effects are more long lasting.
In general, the results from satellite imagery show that there is degradation within this
wetland which is mainly derived by various anthropogenic activities practised along the
wetland area. These results are not different from those from a study by Munishi et al.
(2007) on hydrological land use/cover change along the Ruvu and Sigi river watersheds
which showed that the area was under the threat of more degradation from anthropogenic
activities which are carried out along these areas. These have an impact on flow
downstream hence affecting the livelihood of the community which depends on it for
various uses.
4.4 Contribution of various economic activities to wetland degradation
Table 7 presents the results on contributions of various economic activities to wetland
degradation in the study area. The overall result of this study shows that invasion of
livestock in Ruvu riverine basin in search for green pasture is the foremost activity that
contributes to wetland degradation within the study villages by about 52.50% (n=122).

40
The results imply that improper animal grazing along the wetland cause significant
degradation of wetland vegetation and land through regular feeding and trampling.
Cutting down of trees for feeding livestock as well as normal feed by livestock reduce
vegetative cover which act as a barrier for soil erosion since surface sediments become
more exposed therefore unstable and subject to weathering and erosion. Livestock
trampling cause soil compaction which prevents infiltration, which in turn prevents the
groundwater table from recharging and therefore increases surface runoff. This increases
the likely chance of a change of river flow and frequent floods. The results are not
different from those in a study by Droogers (2006) who reported that cropland is limited
in the Ruvu basin due to the reason that much of the basin area is covered by scrubs
which are used for extensive grazing. This could be the reason for livestock grazing to
become the leading cause of degradation in this area. The findings is also supported by
those in a study conducted by Ngana et al. (2010) which reported that pastoralism is wide
spread in Ruvu sub-basin due to large livestock migration that has been taking place over
the years from various regions to Ruvu basin due to the availability of good pasture and
water. Livestock is therefore highly contributing to wetland degradation within the Ruvu
ecosystem.
On the other hand, the result shows that arable farming was ranked as the second
significant driver to degradation within the study area accounting for about 48%(n=122)
of degradation. The results reveal that arable farming is one of the main practices by the
indigenous communities living along these areas and which contributes to wetland
degradation. Improper cultivation is rampant along the wetland due to inadequate
knowledge on how to perform sustainable agriculture within the area; this therefore leads
to wetland degradation. A study by Kashaigili (2011) shows that agriculture is the major
land use by the indigenous community living close to this wetland where irrigated

41
agriculture was found in the lower Ruvu and the western slopes of the Uluguru
Mountains. Over the years, arable farming has been functioning as an important means of
food production and income generation to the indigenous communities living adjacent to
the wetlands. As Malatu et al. (2015) pointed out, a decline of upland productivity
triggers more pressure to wetland cultivation which lead to more degradation to the
wetland. A study by Ngana et al. (2010) on situation analysis of Ruvu-basin revealed that
encroachment activities such as crop cultivation along the river-banks cause degradation
in the area.
Brick making ranked as a third significant driver by about 46% (n=122). Brick making in
most villages in the study area has been carried out at medium scale to supplement
building material. Only in few areas in the study villages brick making has been carried
out as a means of acquiring income by the community; therefore it slightly contributes to
the degradation of wetland in the study area. Clay soil extraction for bricks making
significantly result to land degradation in the wetlands as it creates holes which tend to
lower the water table leading to a decrease in water level and drying of wetlands. On the
other hand, the demand for wood fuel for burning the bricks has been causing a massive
deforestation of wetland vegetation in the area.

42
Table 7: Contributions of various economic activities wetland degradation in the
study area
Contribution of various economic activities to wetland degradation in study villages
Kidunda
(n=32)
Kibangile
(n=28)
Nige
(n=22)
Ruvu
station
(n=14)
Minazimikind
a(n=26)
Total
(n=122)
Drivers
First prominent
driver
Arable farming 3(9.4) 3(10.7) 1(4.5) 1(7.1) 2(7.7) 10(8.2)
Livestock grazing 26(81.2) 1(3.6) 0(0.0) 13(92.9) 24(92.3) 64(52.5)
Brick making 3(9.4) 4(14.3) 5(22.7) 0(0.0) 0(0.0) 12(9.8)
Gold mining 0(0.0) 20(71.4) 16(72.7) 0(0.0) 0(0.0) 36(29.5)
Fishing 0(0.0) 0(0.0) 0(0.0) 0(0.0) 0(0.0) 0(0.0)
Second prominent driver
Arable farming 15(46.9) 9(32.1) 5(22.7) 12(85.7) 18(69.2) 59(48.4)
Livestock grazing 6(18.8) 1(3.6) 5(22.7) 1(7.1) 2(7.7) 15(12.3)
Brick making 8(25.0) 10(35.7) 11(50.0) 0(0.0) 6(23.1) 35(28.7)
Gold mining 2(6.2) 8(28.6) 1(4.5) 1(7.1) 0(0.0) 12(9.8)
Fishing 1(3.1) 0(0.0) 0(0.0) 0(0.0) 0(0.0) 1(0.8)
Third prominent
driver
Arable farming 7(21.9) 6(21.4) 4(18.2) 0(0.0) 4(15.4) 21(17.2)
Livestock grazing 0(0.0) 9(32.1) 5(22.7) 0(0.0) 1(3.8) 15(12.3)
Brick making 19(59.4) 13(46.4) 13(59.1) 4(28.6) 7(26.9) 56(45.9)
Gold mining 0(0.0) 0(0.0) 0(0.0) 0(0.0) 0(0.0) 0(0.0)
Fishing 6(18.8) 0(0.0) 0(0.0) 10(71.4) 14(53.8) 30(24.6)
Fourth prominent driver
Arable farming 1(3.1) 5(17.9) 3(13.6) 0(0.0) 0(0.0) 9(7.4)
Livestock grazing 0(0.0) 9(32.1) 9(40.9) 0(0.0) 0(0.0) 18(14.8)
Brick making 6(18.8) 6(21.4) 3(13.6) 11(78.6) 15(57.7) 41(33.6)
Gold mining 0(0.0) 1(3.6) 5(22.7) 0(0.0) 0(0.0) 6(4.9)
Fishing 25(78.10)
7(25.0)
2(9.1)
3(21.4)
11(42.3) 48(39.3)
Key: In brackets are percentages
Fishing was ranked as the fourth significant driver to degradation by about 39% (n=122).
The study found out that fishing using local method called Migono which involves setting
traps inside the river and the removal/ cutting down of vegetation along the wetland has
been threatening the wetland as its carried out for harvesting of fish for food and business
therefore affecting the wetland vegetation. Improper fishing practices such as the use of
chemicals and setting traps tend to affect wetland ecosystem by killing plants and other

43
animal species existing in the wetland area. A study by Mombo et al. (2011) indicates that
fishing is negatively affecting the vitality of the wetlands due to bad fishing practices.
Results show further that there is a considerable variation of drivers to wetland
degradation from one study village to another and this is mainly because of variation in
the main practices carried out by the local community within the specified areas as well as
restriction on land use along the wetland.
Results show that villages such as Kibangile and Nige which lie close to Kimboza Forest
reserve, livestock grazing has not contributed to degradation due to restrictions on land
use. However, the presence of gold along the wetland within these villages has been the
second significant driver to degradation accounting for 29.50% of degradation.
The contribution of other human activities to wetland degradation in the area was found
to be smaller than the ones mentioned above. Generally, the study found out that the
wetland is being threaten by over-exploitation of its functions, products and services from
increased anthropogenic activities including livestock grazing by immigrants from
various regions in Tanzania and Agriculture (plate 4), brick making, fishing as well a
growing population in Dar es Salaam city and in the nearby small towns lead to increased
demand for food, income, and areas for settlement.

44
Plate 4: Degradation due to improper agricultural practices and livestock grazing
close to the wetland

45
4.5 Community Awareness on the Values of Wetland, causes and Consequences of
its Degradation
4.5.1 Awareness on the Values of wetland
Awareness on the value of a resource makes communities more conscious on ensuring
protection of that particular resource against degradation. Table 8 presents the findings on
awareness of the respondents on the value of wetlands. The results show that most
respondents were aware of the direct benefits that they can accrue from wetlands area.
As indicated in Table 8, 96.7% of the respondents have higher awareness on the direct
value of wetland as they agreed that crop cultivation is something of value they obtain
from the wetland area. This is because the areas are suitable for crops cultivation
all-round the year. The results indicate that majority of the respondents have high
awareness on the extractable benefits that sustain their day to day needs for living.
Findings from this study show further that most of the indigenous people living close to
Ruvu riverine wetland practice agriculture as their main economic activity; therefore they
do value the wetland as the area supports their livelihood through agricultural production.
Table 8: Awareness on the value of wetland
Respondents responses % (n=122)
Values of wetlands Agreed Undecided Disagree
Food and cash crop 96.7
0.8
2.5
Water for domestic use 73.8
0.0
26.2
Fishing 50.0
0.0
50.0
Soil erosion and Flood control 39.4
0.0
59.8
Carbon storage and climate regulation 31.1
0.0
68.5
Storage and recycling of nutrients and human wastes 26.5 1.50 72.0
About 73.8% of the respondents agreed that water for domestic use is the second item of
value that they do get from the wetland. Few respondents were aware of the indirect
benefits of wetlands such as soil erosion and flood control whereby 39.4% of the
respondents agreed that wetland helps in controlling soil erosion and floods as they act as

46
a water sink from various channels and reduce surface runoffs. The results concur with
those from the study by Mombo et al. (2011) who reported that majority of the
households living nearby wetlands are aware of direct benefits such as crop cultivation
and water for domestic use accrued from wetland. These results do not differ much from
those reported by Kateregga (2015) whose study showed that 72% of the respondents
ranked crop cultivation and water for domestic use as the direct benefits of wetlands, 18%
ranked indirect while only 10% valued the ethical benefits of wetlands. Generally, the
study revealed that most indigenous communities who depend directly on wetland for
various services were found to be mostly aware of extractable benefits of wetland rather
than non-extractable benefits of wetland and other natural resources. Therefore, they tend
to underrate the total value of these resources in a long term.
4.5.2 Awareness on the causes of wetland degradation
Table 9 presents the results on the awareness of causes of wetland degradation among the
respondents in the study village. The results show that most of the respondents were
aware of the fact that livestock grazing and farming practices were the main causes of
wetland degradation in the area. As indicated in Table 9, 68.9% of the respondents agreed
that invasion by livestock was the main cause of wetland degradation in the area.
The results imply that the local communities are aware that the ongoing climate change
which is associated with drought in different regions of the country exert more pressure
on wetland ecosystems caused by livestock encroachment in search for green pasture by
pastoral communities. For example in the study area, the respondents reported to have
experienced continuous immigration of livestock keepers from various areas including
Tabora and Dodoma to Ruvu basin in search for green pasture. This has triggered serious
repercussions on the wetland due to cutting down of vegetation along the wetland to feed
their livestock, hence, exposing the wetland to direct sunlight which in some areas has led

47
to drying of water in the wetland. On the other hand, livestock trampling on the wetland
has led to soils compaction and erosion leading to the drying of wetlands in the area.
Table 9: Awareness on the causes of wetland degradation
Respondents responses % (n=122)
Causes of wetland degradation Agree Undecided Disagree
Livestock grazing along the wetland 68.9
12.2
18.9
Arable farming along the wetland 58.2
21.3
20.5
Mining in the wetland 42.6
3.3
54.1
Brick making nearby wetland 66.4
7.4
26.2
Deforestation of wetland vegetation 69.7
3.3
27.0
Illegal fishing practices 80.3 25 17.2
About 58.2% of the respondents agreed that improper crop cultivation associated with
poor irrigation facilities is seriously affecting the wetland as it results into clearing of
vegetation’s, breaking of the river banks and soil erosion along the wetland area.
Generally, the study revealed that where local communities are aware of the main causes
of wetland degradation they tend to be much concerned on how to prevent further
degradation by employing better livelihood practices in their areas such as avoiding
improper livestock grazing as well as improper agriculture practices along the wetland
area.
4.5.3 Awareness on the consequences of wetland degradation
Awareness on the consequences of wetland degradation help individuals to set measures
of offsetting degradation and sometimes restoring the ecosystems to their original
condition so as to continue gaining benefits rather than suffering the consequences.
Findings in Table 10 present the results on the awareness of the respondents on the
consequences of wetland degradation. As indicated in Table 10, majority (75.4%) of the
respondents agreed that occurrence of floods is the foremost consequences of wetland
degradation within the study villages. Most of the respondents showed interest in ensuring

48
that wetland degradation is controlled due to the endurances they go through. The results
indicate further that local communities are aware that continued development patterns
associated with increased population which extends to wetland areas make the area more
vulnerable to flooding which has a serious cost to the livelihood of the surrounding
communities. Respondents who live in the villages in lower Ruvu reported that for the
past three years floods have been destructing their crops making them harvest nothing and
causing massive destructions of lives and properties leading to food insecurity in the area.
. Interviewed respondents reported further that floods are a result of improper wetland use
through cultivation along the wetland and invasion by livestock keepers in the area, all of
which involve opening and clearing of the vegetation which acts as a barrier to water
runoff from upper catchment. Improper livestock grazing and cultivation along the
wetland have led to the erosion of river banks and shifting of the river due to the many
openings that allow water to pass during heavy rains.
Table 10: Awareness on the consequences of wetland degradation
Respondent responses % (n=122)
Consequences of wetland degradation Agreed Undecided Disagree
Occurrence of floods 75.4
12.3
12.3
Reduced crop yield from wetland 43.4
18
38.5
Wetland loss/Dries up 17.2
34.4
48.4
Soil erosion 34.4 13.5 52.1
4.5.4 Community practices on wetland use and controlling degradation
Table 10 presents the results on community practices on wetland use and controlling
wetland degradation. Majority (70.50%) of the respondents reported to have been
carrying out their activities close to wetland although they were aware of its impact, but
local communities have been motivated by the availability of fertile soil and wetness that
support crops production throughout the year.

49
Table 11: Community practices on wetland use and controlling degradation
Respondent Response(n=122)
Strongl
y
Agree Agree
Not
sure Disagree
Strongly
disagree
Practices (%) (%) (%) (%) (%)
Farming 60 meters away from the wetland 0.00 29.50 0.00 70.50 0.00
Not clearing of vegetation along the wetland 2.60 54.00 0.00 43.40 0.00
Using proper fishing method 1.00 40.00 0.00 59.00 0.00
Abide to the government regulations on wetland
management and use 3.20 30.50 0.00 66.30 0.00
(practice activity 60 m away from the wetland)
Using various methods to control wetland
degradation 4.90 50.00 0.00 45.10 0.00
I teach others on proper methods of protecting
wetlands 0.00 46.70 2.50 53.30 0.00
Further about 66.30% of the respondents reported to have been not abiding by
Government regulations on wetland management and use that provide that no human
activities are allowed within 60 meter from the wetland area. Most of the respondents said
that one of the main Government regulations they know is that it is prohibited to practice
farming activities close to the wetland. However, majority of respondents said that most
of the farmers do not abide by this regulation and therefore they continue carrying out
activities very close to the wetland area and this is especially because 60 meters away
from the wetland, the land becomes dry and unfertile and it therefore cannot produce high
quality and quantity of crops. Some of the respondents on the other hand, said that the
relevant Government organs did not show them the wetland boundaries 60 meters from
the wetland; as a result this regulation was not effectively enforced by the relevant
authorities. Furthermore, a number of respondents (54.00%) reported no to have been
clearing vegetation along the wetland so as to preserve it. Vegetation acts as a major and
important cover protecting the wetland from direct sunlight which may cause drying up of
the wetland. Clearing of vegetation for opening farms cause wetlands to dry. Moreover,
50% of the respondents reported to be using traditional methods such as planting trees
and grasses including sugarcane, banana trees and fruits trees to protect wetlands from
degradation. Generally, the study found out that community practices on wetland use and

50
management vary from one area to another depending on the awareness of the value of
that particular resource and the consequences of its degradation to their livelihood. Also,
the study found that a community that has suffered from frequent floods tends to change
their practices towards using wetland (Plate 5) by preventing them from further
degradation. Enforcement of law and regulation that guide sustainable wetland use tends
to improve the conservation status of natural resources. This is because such
enforcements prevent unsustainable utilization of wetlands through regulating day to day
practices on resource use. Similar findings are reported in a study by Kessy et al. (2015)
who revealed that when communities are aware of the potential benefits of a resource
their attitude towards its use would normally change. On the other hand, findings by
Kateregga (2015) showed that practices normally follow the level of awareness; having a
good awareness on the value of a resource makes people abide by sustainable use of
wetland and its resources.

51
Plate 5: Water resistant grasses and banana trees planted by the community as one
of their practices in controlling wetland degradation

52
4.6 Economic Implications of Wetland Degradation
4.6.1 Community Perceptions on economic implications of wetland degradation
Table 12 presents results on community perceptions towards economic implications of
wetland degradation. As indicated in the Table, majority of the respondents perceived that
access to food and cash crops, income, clean water and fish has highly been affected by
wetland degradation making and has made them incur high economic costs in accessing
these needs. About 66% of the respondents said that degradation of the wetland has
highly affected the amount of food and cash crop that used to be harvested in theirs farms
which are located in the wetland area. And 31% of the respondents said that access to
food and cash crop has been affected by wetland degradation. The results imply that
degradation leads to a change in the river flow therefore impacting on crop farming
activities in the study area. High flow leads to inundation which destructs crops whereas
low flow leads to drying up of wetland therefore affecting crops production.
Table 12: Community Perceptions on economic consequences of wetland
degradation
Variable
Highly
affected
%
Affected
%
Somehow
affected
%
Not
Affected
%
Total
(n=122)
%
Access to food and cash crop 66.4 31.1 2.5 0 100
Access to income 69.7 27.9 2.5 0 100
Access to clean water 66.4 30.3 3.3 0 100
Access to Fish 23 14.8 20.5 41.8 100
Further about 70% of the respondents said that access to income that used to gain from
various activities in the wetland area has been highly affected by wetland degradation.
Income from activities such as agriculture and fishing has decreased due to a decreased
crop yield and fish population due to drying up of wetland areas in the study area.
Majority (66.4%) of the respondent said that access to clean water has been affected by
improper wetland use. Activities such as livestock grazing within the wetland, chemical

53
spills and water abstraction from agricultural practices as well as industrial effluent have
significantly affected the quality of water in the wetlands and therefore causing increased
cost of water treatment for domestic uses.
About 23% of the surveyed respondents said that fishing has been highly affected by
wetland degradation, while majority (41.8%) of the respondents said that fishing has not
been affected by wetland degradation in the study area. The findings from field
observation show that some of the dams which originate from the main Ruvu riverine,
and which used to harbour big numbers of fish stocks throughout the year, have dried up
due to overutilization of wetland through improper grazing practices and abstraction of
water for irrigation activities. Similar findings were reported from focus group discussion
that most of the permanent dams from Ruvu riverine wetland area including Mongomore
dam in lower Ruvu (plate 6), and which used to harbour big numbers of fish have dried
up resulting to inadequate access to fish for food and income generation in the area.
The overall findings on community perception reveals that the local community believe
that degradation of wetland has led to a decline in various services and products that
wetland has been offering to them in the past and therefore posing a threat to their
livelihood options. These findings are in line with the findings from a study by Wasswa et
al. (2013) who revealed that wetland degradation deprives societies of various services
including income from agriculture, fish, and wildlife habitat, quality water, water
quantity, and recreation benefits, as well as an increase of the cost for replacing wetland
services. Further the findings are in agreement with the findings from a study sstudy by
Crecious et al. (2013) who reported that cultivation has also been negatively impacted by
wetland degradation whereby clearing of land for cultivation, results to direct reduction in

54
evapotranspiration. This reduces water vapour and hence precipitation and therefore
reducing crop yields which seriously affect the livelihood of the communities living close
to the wetlands. Furthermore the findings are in line with the findings in a study by
Zinhiva et al. (2014) who reported that degradation of the wetland significantly influences
the dwindling of livelihood options which are available to the local households and
worsens the plight of the rural poor since the inhabitants experience food insecurity,
malnutrition, and water shortages and income loss mostly during the dry season.

55
Plate 6: Dried permanent natural dam (originates from main Ruvu river) which
used to harbour high fish stock has dried (Mongomore dam)

56
4.6.2 Implication of change in average river discharge to household income
Figure 6 presents results on the implication of change in the average river discharge to
household’s income in a visualization scatter plot. The visualization scatter plot shows
that there is no significant relationship between change in the average water discharge and
change in household’s incomes. According to the results in the scatter plot, there is an
inverse relationship between the dependent and independent variable whereas in some
years an increase in the average river discharge cause a decrease or an increase in the
average income which was expected to increase as the river discharge increases and
decrease as the river discharge decreases; the trend which is attributed to an increase in
the river flow which normally leads to frequent floods. Such floods have an impact on
households’ properties, lives and crops in terms of a decrease in yields and therefore
affecting household income. Information from focus group discussion reveal that majority
of participants reported that change in the average river flow in Ruvu riverine has been
happening due to wetland degradation associated with improper land use along the area.
Most of the respondents reported to have been witnessing a change especially an increase
of the river flow during rainy seasons which normally start from mid of March to late
May ever year within the area. These changes are associated with high inundation that
normally destructs crops, houses and lives. Respondents revealed further that during dry
season, which normally begin in September to late February, the average river flow tends
to decrease and some parts of the wetland become dry therefore and thereby impacting
negatively on the wetland cultivation and the life of the various living organisms within
the area. As a result this impacts their sources of income including farming and fishing
activities. Findings from the study by Theodory (2014) reported that increased land
conversion had on impact on the flow characteristics of the catchment this was likely to
impact on sources of earning provided by the Riverine.

57
Source: Field survey and secondary data
Figure 6: Implication of change in average water discharge to household income
Table 13 presents the findings on the test for significance on the relationship between
change in the average water discharge and household income in the study area.
The findings show that the R2=0.332 which implies that the model explains 33.2% of the
variation in income. The relationship between the dependent variable (average annual
income) and independent variable (average annual river discharge) was found to be non-
significant (p=0.309) and this could be due to the reason that there is an inverse
relationship between the dependent and independent variable.
An increase and extremely increase in the average flow it occurs and is normally
associated with a number of consequences such as floods which has an impact on
agricultural productivity, human properties, lives and fish population hence affecting
household’s income and decrease in flow impact also productivity from various sources
of incomes.

58
Table 13: Regression analysis of change in average water discharge to household
income
Estimate Value S.E t P-value R2
Constant (βo)
4460868.124
1920700.815
2.323
0.103
0.332
variable (β) -54254.726 44405.504 -1.222 0.309 NS
R2= Coefficient of determination
t=Student t- test
Beta=Regression coefficients
NS= statistically not significant at 0.01, 0.05, 0.1 levels of significance

59
CHAPTER FIVE
5.0 CONCLUSIONS AND RECOMMENDATIONS
5.1 Conclusions
The findings from this study reveal that there is wetland degradation within the area
caused by various land use changes done by human population that is living in the area as
well as by immigrant livestock keepers who invades the area in search for green pasture
for their livestock.
The analysis of contribution of various economic activities to wetland degradation found
out that livestock grazing is the major driver of wetland degradation followed by
unsustainable arable farming practices, brick making and fishing. This has been caused by
the presence of large scrubland along this wetland therefore providing good pasture as
well as water for livestock. On the other hand, the findings show that there is considerable
variation on the contribution of these drivers from one study village to another due to the
main practices by the communities living in these areas.
The study also shows that local communities in the study area has higher awareness on
the direct values of wetland but low awareness on the indirect values of wetland since
majority of them ranked most the direct values of wetland. Majority of the respondents
reported that farming along the wetland and water for domestic use are the most
significant values they obtain over years from using wetland while very few respondents
mentioned the indirect values that wetland provides to them.
Further, findings from the study show that local community practices on wetland and
wetland degradation control are not good enough due to the ongoing improper farming

60
practices, livestock grazing, poor fishing practices as well as gold mining within the
wetland. Most of the respondents reported that the reason for the continued improper use
of wetland is the belief that these areas have been used over years by their ancestors and
therefore there is no reason for them to leave this area or to change practices for
conservation purposes.
Furthermore, the study shows that community perceive that wetland degradation has
highly affected their economic condition including access to reliable income from
agriculture and fishing as well as clean water for domestic use. There was no significant
relationship (p=0.309) between a change in the average annual households income and a
change in the average river discharge in the study area; thus, there was an inverse
relationship between these two variables and few observations due to lack of long-term
data of these two variables.
5.2 Recommendations
Based on the findings, discussion and conclusions above, the following are the
recommendation that can be made;
(i) As evidence from satellite image showed is the prevalence of wetland
degradation in the study area, there is a need for the government and wetland
management authorities to devise measures of controlling degradation in the
area, which may include diversification of livelihood options in the area and
replacing them with those which have little or no impact (i.e. beekeeping and
tree planting projects in areas close to wetland) on this fragile ecosystem, which
is of utmost importance in the country in both environmental and socio-
economic perspectives.

61
(ii) Since livestock grazing and farming along the wetlands have been the major
problems in the area leading to high degradation, the government should develop
and provide better infrastructures for both livestock keepers (i.e. building cattle
trough) and farmers for enhancing sustainable use of wetland areas. Further the
government should set areas for livestock keepers (rangelands) which are
suitable for grazing and located far away from the wetland areas. Furthermore,
farmers should be provided with knowledge on proper agricultural practices in
the area close to the wetland so as to reduce degradation. Moreover, the
government and wetland management authorities should strengthen enforcement
of the regulation that restrict human activities 60 meters close to wetland and
support tree planting campaigns as well as other income generating activity such
as beekeeping projects close to wetlands to supplement farming and livestock
keeping close to wetlands.
(iii) Awareness on direct and indirect values which local communities can accrue if
wetlands are utilised sustainably should be raised. This is because awareness on
the values of wetland will help to improve conservation of wetland resources. on
the other hand, awareness on the causes and implication of wetland degradation
as well as their indicators should be given to the community so as to make them
conserve these resources for the benefit of the present and the coming
generations; Also there is a need for developing specific wetland management
plan to regulate utilization practices of wetland resources by the local community
in the respective areas.
(iv) Since wetland degradation has been found to have serious economic costs to the
government and local communities reflected in high expenditures in replacing
wetland services, foregone incomes, livelihood support and alternative

62
employment, efforts should be made to ensure that proper management of
wetland ecosystems is attained so as to sustain economic and ecological services
offered by these ecosystems. Education campaigns should be established so as to
raise awareness on economic implications of wetland degradation in the area. On
the other hand, there is a need for establishing institutions duly empowered to
issue and implement wetland laws and coordinate management activities in
Tanzania for improved wetland management and reduce wetland degradation
which has serious economic cost to the government and community.

63
REFERENCES
Alexander, S. and McInnes, R. (2012). The Benefits of Wetland Restoration. Ramsar
Scientific and Technical Briefing Note No. 4. Ramsar Convention Secretariat,
Gland, Switzerland. 20pp.
American Housing Survey (2013). Analysis of Trends in Household Composition Using
American Housing Survey Data. Department of Housing and Urban
Development Office of Policy Development and Research, USA. 41pp.
Boyd, H. K., Westfall, R. and Stasch, S. F. (1981). Marketing Research Texts and Cases.
Richard D Publisher, Illinois. 813pp.
Coleman, J. M., Huh, O. K. and Braud, J. D. (2008). Wetland loss in world deltas.
Journal of Coastal Research 1: 1 – 14.
Crecious, H. and Lazarus, C. (2013). Human perceptions on degradation of wetland
ecosystems: The Case of Magwenzi Wetland in Chivi District; Zimbabwe:
Greener Journal of Geology and Earth Sciences 1(1): 13 – 22.
CSIRO (2001). Land use and catchment water balance. Commonwealth Scientific and
industrial research organization. [www.clw.csiro.au/publications/
technical2001/tr18-01.pdf.] site visited on 16/05/2017.
Davidson, N. C. (2014). How much wetland has the world lost? Long-term and recent
trends in Global wetland area. Marine and Freshwater Research 65(10):
934 – 941.
Droogers, P., Kauffman, J. H., Dijkshoorn, J. A., Immerzeel, W. and Huting, J. R. M.
(2006). Green water credits: Basin identification. Green Water Credits Report
No.1. International Soil Reference and Information Centre, Wageningen,
The Netherlands: 86pp.

64
Erlandson, D. A., Harris, E. L., Skipper, B. L. and Allen, S. D. (1993). Doing Naturalistic
Inquiry: A Guide to Methods. Sage Publications, Inc., Newbury Park. 198pp.
Finlayson, C. M. and Rea, N. (1999). Reasons for the loss and degradation of Australian
wetlands. Journal of Wetlands Ecology and Management 7: 1–11.
Government of Rwanda (2003). Rwandan Wetlands Conservation and Sustainable
Management Policy. Kigali, Rwanda. 18pp.
Hagos, G., Temesgen, G. and Abraham, M. (2014). Wetland degradation in Ethiopia
causes consequences and remidies. Journal of EnvirontalEarth Science 4(11):
40 – 48.
Halima, K. and Munishi, P. (2009). Contribution of wetlands to household income and
food security in the Nyumba Ya Mungu wetland system, northern Tanzania.
Tanzania Journal of Forestry and Nature Conservation 79(2): 99 – 108.
Hatibu, H. (2010). Contribution of dry land forests to rural households livelihoods in
Kishapu district, Shinyanga region, Tanzania. Dissertation for Award of MSc
Degree at Sokoine University of Agriculture, Tanzania, 146pp.
Hulley, S.B.,Cummings, S. R. and Newman, T. B. (2013). Designing Clinical Research.
Lippincott Williams and Wilkins, Philadelphia, USA. 378pp.
Kashaigili, J. J. (2011). Rapid Environmental Flow Assessment for Ruvu River: A
Consultancy Report Submitted to Integrated Water, Sanitation and Hygiene.
Sokoine University of Agriculture, Morogoro, Tanzania. 39pp.
Kashaigili, J. J. (2006). Land Cover Dynamics and Hydrological Functioning of Wetlands
in Usangu Plains in Tanzania. Dissertation for award of PhD Degree at
Sokoine University of Agriculture, Morogoro, Tanzania, 266pp.

65
Kashaigili, J. J., McCartney, M. P., Mahoo, H. F., Lankford, B. A., Mbilinyi, B. P.,
Yawson, D. K. and Tumbo, S. D. (2006). Use of a Hydrological Model for
Environmental Managementof the Usangu Wetlands, Tanzania. Research
Report No. 104. International Water Management Institute. Colombo, Sri
Lanka. 48pp.
Kashaigili, J. J., McCartney, M. and Mahoo, H. F. (2007). Estimation of environmental
flows in the Great Ruaha River Catchment, Tanzania. Journal of Physics and
Chemistry of the Earth 32: 1007–1014.
Kateregga, D. and Magezi, D. (2015). The Effects of Wetland Degradation on Socio-
economic Welfare: A Case Study of Nabisaro Wetland in Rubanga division,
Kampala District, Kampala, Uganda. 55pp.
Kendall, L. (2008). The conduct of qualitative interview: Research questions,
methodological issues, and researching online. In: Handbook of Research on
New Literacies. (Edited by Coiro, J., Knobel, M., Lankshear, C. and Leu,
D.), Lawrence Erlbaum Associates, New York. 158pp.
Kessy, J. F., Nsokko, E., Kaswamila, A. and Kimaro, F. (2015). Analysis of drivers and
agents of deforestation and forests degradation in Masito Forest, Kigoma,
Tanzania; International Journal of Asian Social Science 6(2): 93 – 107.
Kothari, C. (2004). Research Methodology, Methods and Techniques. New Age
International Publisher, New Delhi, India. 401pp.
Lippu, O. L. (2008). Land use conflicts under agro-pastoral system in Bukombe District,
Shinyanga Region. Dissertation for Award of MSc Degree at Sokoine
University of Agriculture, Morogoro, Tanzania, 109pp.

66
Majamba, H. I. (2012). Implementing the Ramsar Convention in Tanzania: Salient
features of legislation and policies for the management and conservation of
Wetlands. Journal of African and International Law 5(3): 220 – 243.
Masek, J. G., Vermote, E. F., Saleous, N., Wolfe, R., Hall, F. G., Huemmrich, F., Gao, F.,
Kutler, J and Lim, T. K. (2006). A Landsat surface reflectance data set for
North America, 1990-2000. Geoscience and Remote Sensing Letters 3:
68 – 72.
Massay, N. M. (2008). The Role of Kilombero Valley Wetlands (Ramsar Site) in
Enhancing Livelihood and Welfare of Adjacent Communities. Dissertation for
Award of MSc Degree at Sokoine University of Agriculture, Morogoro,
Tanzania, 86pp.
Mayer, A. L. and Lopez, R. D. (2011). Use of Remote Sensing to Support Forest and
Wetlands Policies in the USA. Journal of Remote Sensing 3: 1211 – 1233.
Mekonnen, T. and Aticho, A. (2011). The driving forces of Boye wetland degradation and
its bird species composition, Jimma, Southwestern Ethiopia: Journal of
Ecology and the Natural Environment 3(11): 365 – 369.
Mitsch, W.J. (2004). Applying science to conservation and restoration of the world’s
wetlands. In: Abstract Volume: The 14th Stockholm Water Symposium, August
16 – 20, 2004. Drainage Basin Management – Regional Approaches for Food
and Urban Security. Stockholm International Water Institute, Stockholm,
Sweden. 54pp.
Mironga, J. M. (2005). Effects of farming practices on wetland. Journal of Applied
Ecology and Environmental Research 3(2): 81 – 91.
Millennium Ecosystem Assessment (2005). Ecosystems and Human Well-being:
Synthesis. Island Press, Washington DC.155pp.

67
Moore, P. D. (2008). Wetlands: Revised Edition. Bang Hermitage. Facts on File, Inc.,
New York. 270pp.
Mombo, F., Speelman, S., Van Huylenbroeck, G., Hella, J., Munishi, P. and Moe, S.
(2011). Ratification of the Ramsar convention and sustainable wetlands
management: Situation analysis of the Kilombero Valley wetlands in
Tanzania. Journal of Agricultural Extension and Rural Development 3(9):
153 – 164.
Mulatu, K., Hunde, D. and Kissi, E. (2015). Socio-economic impacts of wetland
cultivation in south-bench, southwest Ethiopia. African Journal of
Agricultural Research 10(8): 840 – 848.
Munishi, P. K. T., Rweyemamu, R., Kideghesho, J. R. and Kilungu, H. H. (2012).
The role of bahi swamp wetlands in enhancing household food security and
income of adjacent communities.Tanzania Journal of Forestry and Nature
Conservation 81(2): 115 - 132.
Mutie, S. M., Mati, B., Gadain, H. and Home, P. (2005). Land cover change effects on
flow regime of Mara River: Proceedings of the 2nd International Conference
on Information’s System for Crisis Response And Management (Edited by
Van de Walle, B. and Carlé, B.), Brussels, Belgium. pp. 237 – 246.
Mhagama, J. (2016). Water Resource Management and Food Security in Ruvu Basin,
Tanzania Field trip Report. University of Dar es Salaam, Tanzania. 23pp.
MNRT (2003). Assessment Needs for Wetlands Inventory and Tools for Assessing,
Mapping Wetland Types and their Distribution Report. Government Printer,
Dar es Salaam, Tanzania. 141pp.
Mwakaje, A. G. (2009). Wetlands, livelihoods and sustainability in Tanzania. African
Journal of Ecology 47: 179 – 184.

68
Ngana, J., Mahay, F. and Cross, K. (2010). The Ruvu Basin: A Situation Analysis.
International Union for Conservation of Nature and Natural Resources,
Nairobi, Kenya. 96pp.
Ntongani, W. A., Munishi, P. K. T., More, S. R. and Kashaigili, J. J. (2014). Local
Knowledge on the Influence of Land Use / Cover Changes and Conservation
Threats on Avian Community in theKilombero Wetlands. Tanzania Open
Journal of Ecology 4: 723 – 731.
Nkonya, E., Pender, J. and Kato, E. (2008). Who knows, who cares? Determinants of
enactment, awareness and compliance with community natural resources
management regulations in Uganda. Environmental and Development
Economics 13(1): 79 – 101.
Ntupwa, N. W., Kadigi, R. M. J., Kilungu, H. H. and Munishi, P. K. T. (2012).
Livelihoods and economic benefits of wetland utilization in the little Ruaha
Sub-Catchment, Mufindi District Tanzania. Tanzania Journal of Forestry and
Nature Conservation 81(2): 45 – 54.
NBS (2012). Population and Housing Census, Population Distribution by Administrative
Areas, National Bureau Statistics, Dar es Salaam, Tanzania. 264pp.
Ramsar Convention Secretariat (2013). The Ramsar Convention Manual. (6th Edition).
Ramsar Convention Secretariat, Gland, Switzerland. 109pp.
Ramsar (2015). Briefing Note 7: State of the World’s Wetlands and their Services to
People: A compilation of recent analyses. [http://www.ra msar.org/ sites/ def
ault/ file s/d ocu me nts/ libr ary /bn7e_0.pdf] site visited on 20/06/2016.
Ramachandra, T. V., Alakananda, N., Rani, A. and Khan, M. A. (2011). Ecological and
+Socio-economic assessment of varthur wetland, Bengaluru India. Journal of
Environmental Sciience Technologies 53(1): 101 – 108.

69
Ramadhan, M. K. and Mwakaje, A.G. (2013). The impact of equitable payment for
watershed services scheme on livelihoods in Tanzania: The case of Uluguru
Mountains: International Journal of Development and Sustainability 2(2):
1031 – 1051.
Roy, M. B., Roy, P. K., Samal,N.R. and Mazumdar, A. (2012). Soci-economic valuation
of wetland based occupations of lower Gangetic Basin trough participatory
approach. Journal of Environmental and Natural ResourcesResearch. 2(4):
30 – 44.
Sakataka, W. and Namisiko, P. (2014). Livelihood activities that impact on sustainable
Wetland use in Upper Nzoia River Basin, Kenya. Journal of Economics and
Sustainable Development 5(20): 70 – 83.
Spacey, R.,Goulding, A. and Murray, I. (2004). Exploring the attitudes of public library
staff to the internet using the TAM. Journal of Documentation 160(5):
550 – 564.
Theodory, L. (2014). Impacts of climate variability and land use cover change on stream
flow in the little Ruaha River Catchment, Tanzania. Dissertation for Award of
MSc Degree at Sokoine University of Agriculture, Morogoro, Tanzania,
173pp.
United Republic of Tanzania (1997). National Land Policy. Ministry of Lands and
Human Settlements Development, Dar es Salaam, Tanzania. 42pp.
United Republic of Tanzania (1998). The National Forest Policy. Ministry of Natural
Resources and Tourism, Dar es Salaam, Tanzania. 59pp.
United Republic of Tanzania (2002). National Water Policy. Ministry of Water and
Livestock Development, Dar es Salaam, Tanzania. 49pp.
United Republic of Tanzania (2006). National Livestock Policy. Ministry of Livestock
Development, Dar es Salaam, Tanzania. 55pp.

70
United Republic of Tanzania (2007). Guidelines for sustainable management of wetlands.
[http/www.who.int/countryfocus] site visited on 23/03/2016.
United Republic of Tanzania (2007). The Wildlife Policy of Tanzania. Ministry of Natural
Resources and Tourism, Dar es Salaam, Tanzania. 50pp.
United Republic of Tanzania (2008). Environmental Impact Assessment Statement for
Kidunda Dam Executive Summary Final. Dar es Salaam Water and Sewage
Authority, Dar es Salaam, Tanzania. 68pp.
United Republic of Tanzania (2013). National Agriculture Policy Ministry of Agriculture
Food Security and Cooperatives. Government Printer, Dar es Salaam,
Tanzania.47pp.
United Republic of Tanzania (2015). National Fisheries Policy. Ministry of Livestock
and Fisheries Development, Dar es Salaam, Tanzania. 44pp.
URT (2009). Fourth National Report on Implementation on Biological Diversity
(Cbd).Vice President’s Office, Dar es Salaam, Tanzania. 80pp.
USAID (2014). Environmental Flow Recommendations for the Ruvu River Basin. Global
Water for Sustainability Program, USA. 52pp.
Van Asselen, S., Verburg, P. H., Vermaat, J. E. and Janse, J. H. (2013). Drivers of
wetland conversion: a global meta-analysis. [https://doi.org/10.1371/
journal.pone.0081292] site visited on 16/06/2017.
Vermote, E. F., El Saleous, N., Justice, C. O., Kaufman, Y. J., Privette, J. L. ,Remer, L.,
Roger, J. C. and Tanré, D. (1997). Atmospheric correction of visible to
middle-infrared EOS-MODIS data over land surfaces: Background,
operational algorithm and validation, Journal of Geophysical Research
102(14): 17131 – 17141.

71
Wasswa, H., Mugagga, F. and Kakembo, V. (2013). Economic implications of wetland
conversion to local people's livelihoods: The Case of Kampala- Mukono
Corridor Wetlands in Uganda. Academia Journal of Environmental Sciences
1(4): 66 – 77.
Xu, W., Xie, A., Huang, J. and Huang, B. (2008). A method of identifying degradation of
Ruoergai Wetland in Sichuan. International Geoscience and Remote Sensing
Symposium. 4: 882 – 885.
Yanda, P. Z. and Munishi, P. K. T. (2007). Hydrologic and Land Use/Cover Change
Analysis ror the Ruvu River (Uluguru) and Sigi River (East Usambara)
Watersheds. World Wildlife Fund, Dar es Salaam, Tanzania. 80pp.
Zedler, J. B. and Kercher, S. (2005). Wetland resources: status, trends, ecosystem
services, and restorability. Annual Review of the Environment and Resources
30: 39 – 74.
Zinhiva, H., Chikodzi, D., Mutowo, G., Ndlovu, S. and Mazambara, P. (2014). The
Implications for Loss and Degradation of Wetland Ecosystems on Sustainable
Rural Livelihoods. Case of Chingombe Community, Zimbabwe. Greener
Journal of Environmental Management and Public Safety 3(2): 43 – 52.

72
APPENDICES
Appendix 1: Household questionnaire
Dear respondent the aim of this interview is for study purposes only and the information
that you will provide is strictly confidential and will not be used for any other purposes
therefore be free to share everything you know about what i will ask you for the
successful completion of this study.
Part A: General information
1. Questionnaire no…………….
2. Village…………………………………. Household No…………………….
3. Household size……………………….
4. Date of interview……………………….Name of interviewer………………….
5. Sex:1- Male 2-Female
6. Age…………….
7. Education……………….
8. Marital status: Married ( ) Single ( ) Widow ( ) Divorced ( ) Separated ( )
Widower ( )
9. Occupation……………….....................................................................................
10. Household assets along the wetland
How was it acquired
Property Bought Inherited Rent Quantity/number
1-Farm land
2-Fishing gears
3-Brick making
site
4-Mining
assets/site
Any other
5
6

73
Part B: Economic activities that lead to wetland degradation (Circle appropriate
answer)
11. a) In past ten years has the population in this area changed? 1-Yes 2-No
b) If yes has it 1-increased or 2-decreased
12. a) Does the population change leads to wetland degradation? 1-Yes 2-No
b) If yes what have you noticed of degradation from population increase?
………………………………………………………………………………………………
………………………………………………………………………………………………
13. a) In past ten years has the amount of rainfall in the area changed? 1-Yes 2-No
b) If yes has it 1-Increased 2-Decreased
14 Does the decrease rainfall change lead to wetland degradation? 1-Yes 2-No
15. Which activities do you use wetland for?
1-Crop cultivation 2- fishing 3-Animal grazing 4-brick making and sand mining 5-forest
products 6- any other specify
.......................................................................................................................................
.......................................................................................................................................
16. What crops do you cultivate using water from the wetland area?
1- Maize 2- Rice 3- Beans 4-Vegetables 5- Fruits 6- other specify
.......................................................................................................................................
.......................................................................................................................................
17. Has your planting /cropping season changed over years? 1-Yes 2-No
b) If yes how
1-one time 2-two times 3-three time 4-four times 5-other specify
c) Why?
................................................................................................................................................
..............................................................................................................................
18. To your understanding which activity has most prominent effect on the wetland/has
significantly threat to wetland health? Rank in order of importance in affecting the
wetland.

74
1- Crop cultivation 2- fishing 3- Animal grazing 4- brick making and sand mining 5-
forest product 6- any other specify
.......................................................................................................................................
.......................................................................................................................................
19. Why is the activity mentioned above is significantly in affecting wetland health
1-Involve clearing of vegetation 2-eutrophication 3-Sedimentation 4-Draining 5-any
other
20. Why does people still practice the economic activities mentioned above?
1- Supplement household incomes
2-Supplement household food supply
3 -Employment
4 -Others (specify)
…………………………………………....................................................
.....................................................................................................................
Part C: (i) Community awareness on the values of wetland, causes and
consequences of its degradation (Likert response 5- Strongly agree, 4-Agree,
3-undecided, 2-Disagree, 1-Srrongly disagree) if strongly agree to agree and
disagree to strongly disagree give reasons
21. Which of the following are the values of wetlands you know?
a) Food and cash crop
b) Water for domestic use
c) Fishing
d) Erosion and flood control
e) Carbon storage and climate regulation
f) Storage and recycling of nutrients
g) Any other specify
....................................................................................................................................
....................................................................................................................................

75
22. What do you understand when one talks about wetland degradation?
………………………………………………………………………………………………
………………………………………………………………………………………………
23. Has the values of wetland been affected by degradation? 1- Yes 2- No
24. Which of the following are the main causes of wetland degradation you aware of?
a) Livestock grazing along the wetland
b) Arable farming along the wetland
c) Mining within the wetland
d) Mining nearby wetland
e) Deforestation of wetland vegetation
e) Illegal fishing
f) Any others specify
.................................................................................................................................
.................................................................................................................................
25. Which of the following are the primary effect of wetland degradation are you aware
of?
a) Occurrence of floods
b) Reduced crop yield
c) Wetland loss /dries up
e) Soil erosion
f) Any other specify
................................................................................................................................................
................................................................................................................................................
26. What are the indicators of wetland degradation do you know?
................................................................................................................................. .............
.............................................................................................................................................
27. Do you think in your area there is wetland degradation? 1- Yes 2- No

76
(ii) Community practices on controlling it Practices statements ((Likert response 5-
Strongly agree, 4-Agree, 3-undecided, 2-Disagree, 1-Srrongly disagree) if
strongly agree to agree and disagree to strongly disagree give reasons
28 I do my farming activities 60 meters away from the wetland
………………………………………………………………………………………
29. I do not clear vegetation along the wetland
………………………………………………………………………………………
30. I use proper fishing methods
………………………………………………………………………………………
31. I use both traditional and modern ways of preventing wetland degradation
………………………………………………………………………………………
32. I teach other on proper methods of protecting wetlands
………………………………………………………………………………………
Part D1. Consequences of wetland degradation (Response of likert scale 1=Not
affected, 2=somehow affected, 3= affected, 4=highly affected)
33. What is the level of effect of wetland degradation within this area?
.......................................................................................................................................
34. How much the does the following economic activities has been affected by wetland
degradation?
a) Arable farming
...........................................................................................................................
b) Fishing
.................................................................................................... .......................
c) Livestock keeping
...........................................................................................................................
d) Any other specify
.................................................................................................... .......................

77
35. How much does the quantity and quality of domestic water availability has been
affected by wetland degradation?
.......................................................................................................................................
36. How much does the amount of food and cash crops generated from using wetland has
been affected by wetland degradation?
.......................................................................................................................................
37. How much does the amount of income generated from using wetland has been
affected by wetland degradation?
.......................................................................................................................................
Part D2: Estimate of Change Quantity of Goods produced from using wetland
38. What is the average household income that has been accrued in in past five years
2011-2015?
Year Average income Tshs.
2011
2012
2013
2014
2015
39. Why do you think this change has happened? a) Wetland degradation b) climate
change c) Both d) any other specify
.......................................................................................................................................
.................................................................................................................................. .....
40. Has the amount of water available for use in the wetland increased or decreased? a)
Increased b) Decreased c) Remained the same
.......................................................................................................................................
41. a) Why do think so? (Changes observed)
................................................................................................................................................
b) What are the likely impact do you think?
................................................................................................................................................

78
Appendix 2: Checklist for focus group discussion
(Give brief explanation on the trend of the following activities in past years and current
year)
1. Economic activities that are practised in this wetland in past and now
2. Which of the mentioned economic activity has great impact on wetland health
rank in order of importance?
3. What are the values do you get from wetland as whole?
4. Are you aware of wetland degradation and its consequences?
5. What are the changes in productivity of the economic activities past (give an
average for 10) years and the current productivity? In the following production
activities
a) Arable farming
b) Fishing
c) Livestock keeping
d) Any other specify
6. Does change in productivity affected the access to food and income?
7. Is there any change in access to domestic water in terms of quality and volume
the area?
8. What action do you take to control wetland degradation?
9. What are the local ways for maintaining wetland?

79
Appendix 3: Checklist for key informants
1. What are the main use of wetland by local community living adjacent the wetland
area?
2. What are the main drivers of wetland degradation in Ruvu river?
3. Which is the most significant driver in order of sequence from top most to the
lowest?
4. Why does this community prefer more these activity that has impact on wetland?
5. What is the level of awareness of the local community on wetland degradation?
6. What is the awareness of the local community on consequences when wetlands
are degraded?
7. What are the implications of wetland degradation on access of community to
food?
8. What are the implications of wetland degradation on access of community
income?
9. Is there any local knowledge/modern knowledge used by these communities
towards controlling wetland degradation?
10. What attitude do the people living along this area have in averting wetland
degradation?
11. What are the community practices towards controlling wetland degradation