analysis of discharge and sediment loading rates … · analysis of discharge and sediment loading...
TRANSCRIPT

ANALYSIS OF DISCHARGE AND SEDIMENT LOADING RATES IN TRIBUTARIES OF DOG RIVER
IN THE MOBILE METROPOLITAN AREA

GEOLOGICAL SURVEY OF ALABAMA
Berry H. (Nick) Tew, Jr. State Geologist
ANALYSIS OF DISCHARGE AND SEDIMENT LOADING RATES IN TRIBUTARIES OF DOG RIVER IN THE MOBILE
METROPOLITAN AREA
OPEN FILE REPORT 1214
By
Marlon R. Cook and
Neil E. Moss
Partial funding for this project provided by the Mobile Bay National Estuary Program
Tuscaloosa, Alabama 2012
ii

TABLE OF CONTENTS
Introduction ........................................................................................................................... 1
Acknowledgments ................................................................................................................. 1
Project area............................................................................................................................. 1
Project monitoring site characteristics ............................................................................. 4
Land use and stream flow conditions..................................................................................... 5
Sedimentation ........................................................................................................................ 6
Sediment loads transported by project streams................................................................ 7
Suspended sediment......................................................................................................... 8
Bed sediment.................................................................................................................... 11
Total sediment loads ........................................................................................................ 14
Summary ................................................................................................................................ 17
References cited ..................................................................................................................... 19
Appendix................................................................................................................................ 20
ILLUSTRATIONS
Figure 1. Location of the Dog River watershed .................................................................. 2
Figure 2. Estimated suspended sediment loads and average discharge for
monitored Dog River tributaries .......................................................................... 9
Figure 3. Estimated suspended sediment loads and average stream flow
velocities for monitored Dog River tributaries .................................................... 10
Figure 4. Estimated normalized suspended sediment loads and monitored
watershed area for Dog River tributaries ............................................................. 11
Figure 5. Measured bed sediment loads and average stream discharge at
Halls Mill Creek site 5 ......................................................................................... 13
Figure 6. Measured bed sediment loads and average stream flow velocities at
Halls Mill Creek site 8 ......................................................................................... 13
Figure 7. Estimated total sediment loads for monitored tributaries in the Dog
River watershed ................................................................................................... 15
iii

iv
Figure 8. Comparisons of estimated normalized total sediment loads from
selected Baldwin County streams and monitored Dog River
tributaries ............................................................................................................. 16
Figure 9. Comparisons of estimated normalized total sediment loads from
selected streams throughout Alabama and monitored Dog River
tributaries ............................................................................................................. 17
TABLES
Table 1. Stream flow characteristics for monitored sites in the
Dog River watershed............................................................................................ 6
Table 2. Total suspended solids and suspended sediment loads measured in
monitored streams................................................................................................ 9
Table 3. Measured discharge, stream-flow velocity, and estimated bed
sediment loads for sites on monitored tributaries in the Dog River
watershed ............................................................................................................. 14
Table 4. Estimated total sediment loads for monitored Dog River tributaries .................. 14
PLATES
Plate 1. Topography and locations of streams and monitoring sites in the Dog River
watershed.
Plate 2. Topography, monitored sites and subwatersheds in the Dog River watershed.
Plate 3. Land-use/land-cover, monitored sites and subwatersheds in the Dog River
watershed.
Plate 4. Geology, monitored sites and subwatersheds in the Dog River watershed.
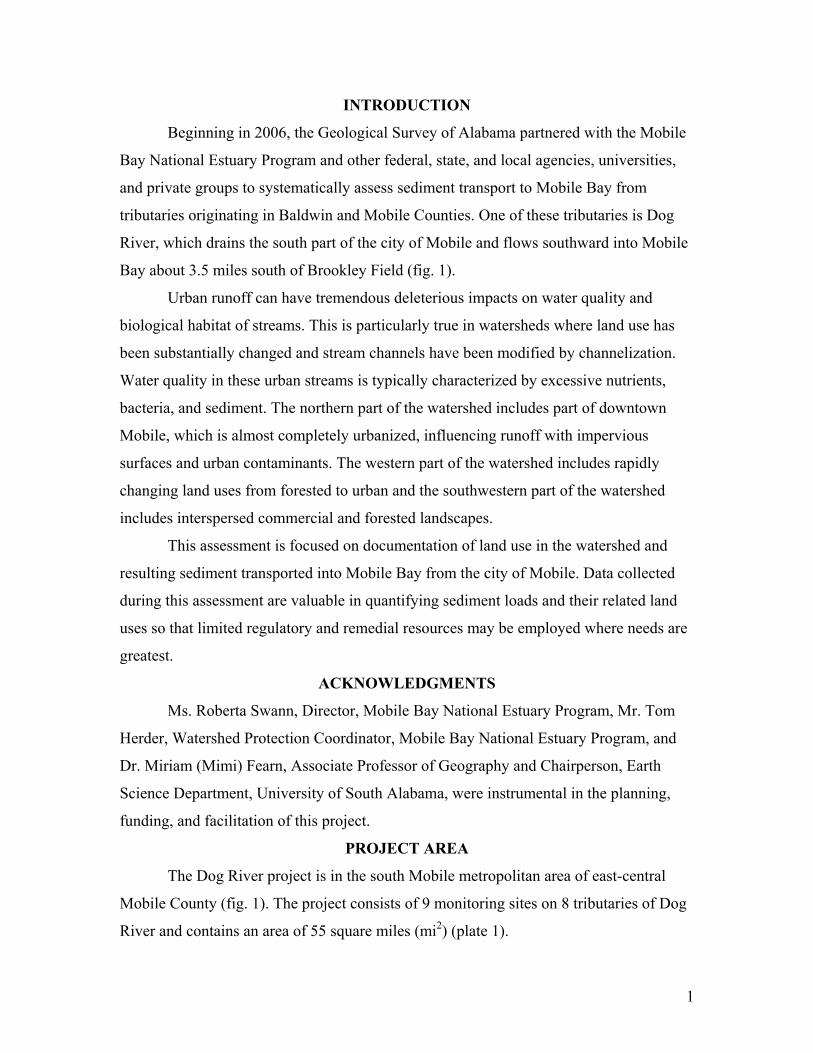
INTRODUCTION
Beginning in 2006, the Geological Survey of Alabama partnered with the Mobile
Bay National Estuary Program and other federal, state, and local agencies, universities,
and private groups to systematically assess sediment transport to Mobile Bay from
tributaries originating in Baldwin and Mobile Counties. One of these tributaries is Dog
River, which drains the south part of the city of Mobile and flows southward into Mobile
Bay about 3.5 miles south of Brookley Field (fig. 1).
Urban runoff can have tremendous deleterious impacts on water quality and
biological habitat of streams. This is particularly true in watersheds where land use has
been substantially changed and stream channels have been modified by channelization.
Water quality in these urban streams is typically characterized by excessive nutrients,
bacteria, and sediment. The northern part of the watershed includes part of downtown
Mobile, which is almost completely urbanized, influencing runoff with impervious
surfaces and urban contaminants. The western part of the watershed includes rapidly
changing land uses from forested to urban and the southwestern part of the watershed
includes interspersed commercial and forested landscapes.
This assessment is focused on documentation of land use in the watershed and
resulting sediment transported into Mobile Bay from the city of Mobile. Data collected
during this assessment are valuable in quantifying sediment loads and their related land
uses so that limited regulatory and remedial resources may be employed where needs are
greatest.
ACKNOWLEDGMENTS
Ms. Roberta Swann, Director, Mobile Bay National Estuary Program, Mr. Tom
Herder, Watershed Protection Coordinator, Mobile Bay National Estuary Program, and
Dr. Miriam (Mimi) Fearn, Associate Professor of Geography and Chairperson, Earth
Science Department, University of South Alabama, were instrumental in the planning,
funding, and facilitation of this project.
PROJECT AREA
The Dog River project is in the south Mobile metropolitan area of east-central
Mobile County (fig. 1). The project consists of 9 monitoring sites on 8 tributaries of Dog
River and contains an area of 55 square miles (mi2) (plate 1).
1

2
Figure 1.—Location of the Dog River watershed.

PROJECT MONITORING SITE CHARACTERISTICS
Site 1 is at latitude 30.66196o north and longitude -88.13171o west on Bolton
Branch at Pleasant Valley Road, about 1600 feet west of Interstate 65. The stream
channel is a concrete flume about 30 feet wide. The stream drains 3.6 mi2 and has a
gradient of 55 feet per mile upstream from the monitoring site (plate 2).
Site 2 is at latitude 30.64623 north and longitude -88.16788 west on Spencer
Branch at Cottage Hill Road about 1.8 miles from the confluence with Moore Creek and
about 7 miles from Mobile Bay (plate 2). The stream channel is a concrete flume about
30 feet wide (see appendix photograph) and the watershed upstream from the site drains
1.2 mi2 and has a gradient of 62 feet per mile, upstream from the monitoring site.
Site 3 is at latitude 30.66106 north and longitude -88.20359 west on Milkhouse
Creek at Grelot Road (plate 2). Milkhouse Creek upstream from the monitoring site
drains 3.1 mi2 and has a gradient of 44 feet per mile. Site 3 is 3.5 miles north of the
confluence with Halls Mill Creek.
Site 4 is at latitude 30.63545 north and longitude -88.21401 west on Second
Creek at Cottage Hill Road (plate 2). Second Creek upstream from the monitoring site
drains 3.7 mi2 and has a gradient of 44 feet per mile. Site 4 is 1.7 miles north of the
confluence with Milkhouse Creek. The channel bed and banks are armored with
limestone riprap.
Site 5 is at latitude 30.62319 north and longitude -88.23480 west on Halls Mill
Creek at Schillenger Road (plate 2). Halls Mill Creek upstream from the monitoring site
drains 2.2 mi2 and has a gradient of 64 feet per mile. Site 5 is about 8 miles west of the
confluence with Dog River. The stream channel upstream from the monitoring site is
anastimosing with a thick sand and silt bed.
Site 6 is on Moore Creek near Halls Mill Road at latitude 30.6275 north and
longitude -88.13737 west. The stream at this site is channelized and is highly impacted by
several structures designed to control runoff. After several unsuccessful attempts to
measure flow and bed sediment, the site was abandoned. Therefore, no data are available
for site 6 (plate 2).
Site 7 is at latitude 30.61313 north and longitude -88.15405 west on Spring Creek
at Maudelayne Drive, about 1.3 miles upstream from the Halls Mill Creek confluence
(plate 2). Spring Creek upstream from the monitoring site drains 2.0 mi2 and has a
3

gradient of 58 feet per mile. The creek flows through residential developments for most
of the reach. The channel is mostly natural with some limestone riprap armoring (see
appendix photographs).
Site 8 is at latitude 30.60611 north and longitude -88.15712 west on Halls Mill
Creek at Halls Mill Road, about 4.1 miles upstream from the Dog River confluence (plate
2). Halls Mill Creek upstream from the monitoring site drains 26.6 mi2 and has a gradient
of 26 feet per mile. Much of the floodplain is characterized as anastomosing and contains
numerous wetlands (see appendix photograph).
Site 9 is at latitude 30.56153 north and longitude -88.16074 west on Rabbit Creek
at Todd Acres Road, about 4.2 miles upstream from the Dog River confluence (plate 2).
Rabbit Creek upstream from the monitoring site drains 6.2 mi2 and has a gradient of 31
feet per mile. The downstream half of the monitored floodplain contains numerous
wetlands. The monitoring site is characterized by riprap armoring and swift flow with
pools upstream and downstream from the site (see appendix photograph).
Site 10 is at latitude 30.66221 north and longitude -88.09323 west on Eslava
Creek at U.S. Highway 90 (Government Boulevard), about 2.4 miles upstream from the
Dog River confluence (plate 2). Eslava Creek upstream from the monitoring site drains
6.5 mi2 and has a gradient of 6 feet per mile. Eslava Creek drains the western part of
downtown Mobile, east of Interstate 65. The floodplain is highly urbanized and the
channel primarily consists of a concrete flume (see appendix photograph).
4

LAND USE AND STREAM FLOW CONDITIONS
Precipitation, stream gradient, geology, and land use are all important factors that
influence sediment transport characteristics of streams. Sediment transport conditions in
the Dog River watershed area are segregated by particular stream segments based on
instream conditions that are influenced by the topography and soils of the watershed,
impervious surfaces, construction activities, and associated erosion prevention and runoff
detention efforts. Estimates of sediment loads are based on measured sediment and
stream discharge. Therefore, a stream flow dataset composed of values ranging from base
flow to flood is desirable. Average observed stream flow conditions are shown in table 1.
Stream flow characteristics for tributaries of Dog River vary widely due to the
wide range of land forms, channel types and flow regimes influenced by urbanization,
channel modifications, and floodplain structures designed to control runoff. Generally,
streams that are farther away from downtown Mobile have received fewer modifications
to floodplains and channels and have fewer impervious surfaces (plates 2, 3). Table 1
indicates that stream flow velocities are highest for those streams with extensive
channelization and are not directly related to stream gradient. Halls Mill Creek upstream
from site 5 has the highest gradient (64 feet per mile (ft/mi) but has the lowest flow
velocity (0.60 feet per second (ft/s) due to a relatively natural anastomosing channel with
meanders and numerous fallen trees and root wads that slow the flow velocity and
prevent scour and erosion. The highest average flow velocity was measured at Bolton
Branch (site 1) (3.3 ft/s). Eslava Creek (site 10) has the lowest stream gradient (6.0 ft/mi)
but has a relatively high average flow velocity (2.1 ft/s) at monitoring site 10 due to
channelization that creates an area of high velocity at the U.S. Highway 90 crossing.
Bolton Branch, Spencer Branch, Spring Creek, and Eslava Creek (sites 1, 2, 7,
and 10, respectively) are channelized (concrete flumes) and have extensive commercial
and residential development in the floodplains (plate 3). Milkhouse Creek has extensive,
relatively recent development in the upstream part of the floodplain near site 3 (plate 3).
The remaining monitored streams have relatively minimal development in floodplains
and only minor modifications to stream channels, although relatively recent urbanization
has occurred on the uplands along the drainage divides (plate 3). Second Creek (site 4) is
primarily anastomosing but has extensive riprap channel armoring upstream and
downstream from the monitoring site at the Cottage Hill Road crossing. Sites 5 and 8 are
5

on Halls Mill Creek which has a relatively small amount of channel modification and
floodplain development (plate 3). Rabbit Creek is the southern most tributary to Dog
River and has relatively minimal development in the floodplain (plate 3). Agriculture in
the Dog River watershed is minimal, although pasture and pecan orchards form a
significant part of the land use in the headwaters of Halls Mill Creek and Rabbit Creek
(plate 3).
Table 1. Stream flow characteristics for monitored sites in the Dog River watershed.
Monitored site
Average discharge
(cfs1)
Maximum discharge
(cfs)
Minimum discharge
(cfs)
Average flow
velocity (ft/s2)
Maximum flow
velocity (ft/s)
Minimum flow
velocity (ft/s)
Stream gradient (ft/mi3)
1 58.9 268.0 2.7 3.3 9.00 0.72 55 2 26.8 83.4 0 2.70 7.50 0.00 62 3 12.0 23.2 3.0 n/a n/a n/a 44 4 46.1 150.0 7.4 n/a n/a n/a 44 5 30.6 120.0 4.5 0.60 1.00 0.07 64 7 20.5 65.4 1.2 2.40 5.45 0.61 58 8 72.8 107.0 44.5 1.20 1.50 1.08 26 9 53.0 200.0 12.1 n/a n/a n/a 31
10 99.7 318.0 4.4 2.1 3.00 1.10 6 1cfs- cubic feet per second 2ft/s- feet per second 3ft/mi- feet per mile
SEDIMENTATION
Sedimentation is a process by which eroded particles of rock are transported
primarily by moving water from areas of relatively high elevation to areas of relatively
low elevation, where the particles are deposited. Upland sediment transport is primarily
accomplished by overland flow and rill and gully development. Lowland or flood plain
transport occurs in streams of varying order, where upland sediment joins sediment
eroded from flood plains, stream banks, and stream beds. Erosion rates are accelerated by
human activity related to agriculture, construction, timber harvesting, unimproved
roadways, or any activity where soils or geologic units are exposed or disturbed.
Excessive sedimentation is detrimental to water quality, destroys biological habitat,
reduces storage volume of water impoundments, impedes the usability of aquatic
recreational areas, and causes damage to structures. Sediment loads in streams are
composed of relatively small particles suspended in the water column (suspended solids)
6

and larger particles that move on or periodically near the streambed (bed load). Seven of
nine monitored sites in the Dog River watershed were assumed to have total sediment
loads represented as suspended sediment due to stream channelization or stream bed
armoring. Sediment in these streams was measured on hard surfaces where all sediment
was suspended or saltating so that samples contained representative concentrations of all
grain sizes transported downstream. Only Halls Mill Creek sites 5 and 8 had sand bed
channels with clearly defined suspended and bed sediment.
SEDIMENT LOADS TRANSPORTED BY PROJECT STREAMS
The rate of transport of sediment is a complex process controlled by a number of
factors primarily related to land use, precipitation runoff, erosion, stream discharge and
flow velocity, stream base level, and physical properties of the transported sediment.
Changes in land use are the primary causes of excessive erosion and
sedimentation in the Dog River watershed. Highly erodable soils formed from
undifferentiated Miocene Series, Citronelle Formation, and Alluvial, Coastal, and Low
Terrace Deposits sediments (plate 4) combined with relatively high topographic relief
related to the formation of Mobile Bay can result in erosion and excessive sediment
transport in areas where soils are cleared of vegetative cover and proper best management
practices are not implemented. This situation can be aggravated in watersheds dominated
by urban development, such as Dog River, where large upland areas of impervious
surfaces increase runoff and cause accelerated stream flow velocities, flashy flows, and
flooding.
Excessive sedimentation causes changes in base level elevation of streams in the
watershed and triggers downstream movement of the material as streams reestablish base
level equilibrium. The movement of this material is accelerated by periodic large
precipitation events that cause increased stream flow and stream flow velocities.
However, in urban watersheds like Dog River, impervious surfaces and armored,
channelized streams prevent erosion and significantly reduce sediment loads.
SUSPENDED SEDIMENT
The basic concept of constituent loads in a river or stream is simple. However, the
mathematics of determining a constituent load may be quite complex. The constituent 7

load is the mass or weight of a constituent that passes a cross-section of a stream in a
specific amount of time. Loads are expressed in mass units (tons or kilograms) and are
measured for time intervals that are relative to the type of pollutant and the watershed
area for which the loads are calculated. Loads are calculated from concentrations of
constituents obtained from analyses of water samples and stream discharge, which is the
volume of water that passes a cross-section of the river in a specific amount of time.
Suspended sediment is defined as that portion of a water sample that is separated
from the water by filtering. This solid material may be composed of organic and
inorganic particles that include algae, industrial and municipal wastes, urban and
agricultural runoff, and eroded material from geologic formations. These materials are
transported to stream channels by overland flow related to storm-water runoff and cause
varying degrees of turbidity. Turbidity values for all monitoring sites are shown in table
2.
Annual suspended sediment loads were estimated using the computer regression
model Regr_Cntr.xls (Regression with Centering) (Richards, 1999). The program is an
Excel adaptation of the U. S. Geological Survey (USGS) seven-parameter regression
model for load estimation (Cohn and others, 1992). The regression with centering
program requires total suspended solids (TSS) concentrations and average daily stream
discharge to estimate annual loads. Although average daily discharge for project streams
was not available from direct measurement, it was estimated by establishing a ratio
between periodic measured discharge in project streams and discharge values for the
same times obtained from the USGS discharge station located on Chickasaw Creek near
Kushla, Alabama (USGS site 02471001), about eight miles northwest from Mobile.
Total suspended solids concentrations and estimated suspended sediment loads for each
monitored site are shown in table 2 and figure 2. Eslava Creek, Spencer Branch,, and
Spring Creek (sites 10, 7, and 2) had the largest loads with 10,803, 5,970, and 5,198 tons
per year (t/yr), respectively. Figure 2 shows the correlation between suspended
8

Table 2—Total suspended solids (TSS) and suspended sediment loads measured in monitored streams.
Monitored site
Average Discharge
(cfs)
Average turbidity (NTU)
Maximum turbidity (NTU)
Average TSS
(mg/L)
Maximum TSS
(mg/L)
Estimated suspended
sediment load (t/yr)
Estimated normalized suspended
sediment load (t/mi2/yr)
1 58.9 48 90 34 167 541 150 2 22.9 117 230 103 282 5,198 4,332 3 12.0 36 80 9 17 48 16 4 46.1 28 75 15 64 551 149 5 30.6 36 111 15 39 210 95 7 20.5 77 259 68 426 5,970 2,985 8 72.8 43 64 17 50 407 15 9 53.1 48 143 9 20 342 55
10 99.7 70 240 22 83 10,803 1,662 1Data were insufficient to estimate sediment loadings at site 6.
10
100
1,000
10,000
100,000
Bolton Branch
(1)
Spencer
Branch (2)
Milkhouse
Creek (3)
Second C
reek(4)
Halls M
illC
reek(upstream
) (5)
Spring C
reek(7)
Halls M
illC
reek(dow
nstream)
(8)
Rabbit C
reek(9)
Eslava C
reek(10)
Monitored tributary
Sus
pend
ed s
edim
ent (
t/yr)
0
20
40
60
80
100
120
Ave
rage
dis
char
ge (c
fs)
Suspended sediment Average Discharge
Figure 2.—Estimated suspended sediment loads and average discharge for monitored Dog River tributaries.
sediment loads and average stream discharge. Note the negative correlation for Spencer
Branch (site 2) and Spring Creek (site 7) where relatively small discharge transports
some of the largest loads (see appendix photograph). This is probably due to activities in
the watershed that promote erosion and sedimentation in the stream. Figure 3 shows
suspended sediment loads and average stream flow velocities for the monitored
tributaries (velocity data was not available for sites 3, 4, and 9). Unlike figure 2, a
positive correlation is seen for Spencer Branch (site 2) and Spring Creek (site 7),
9
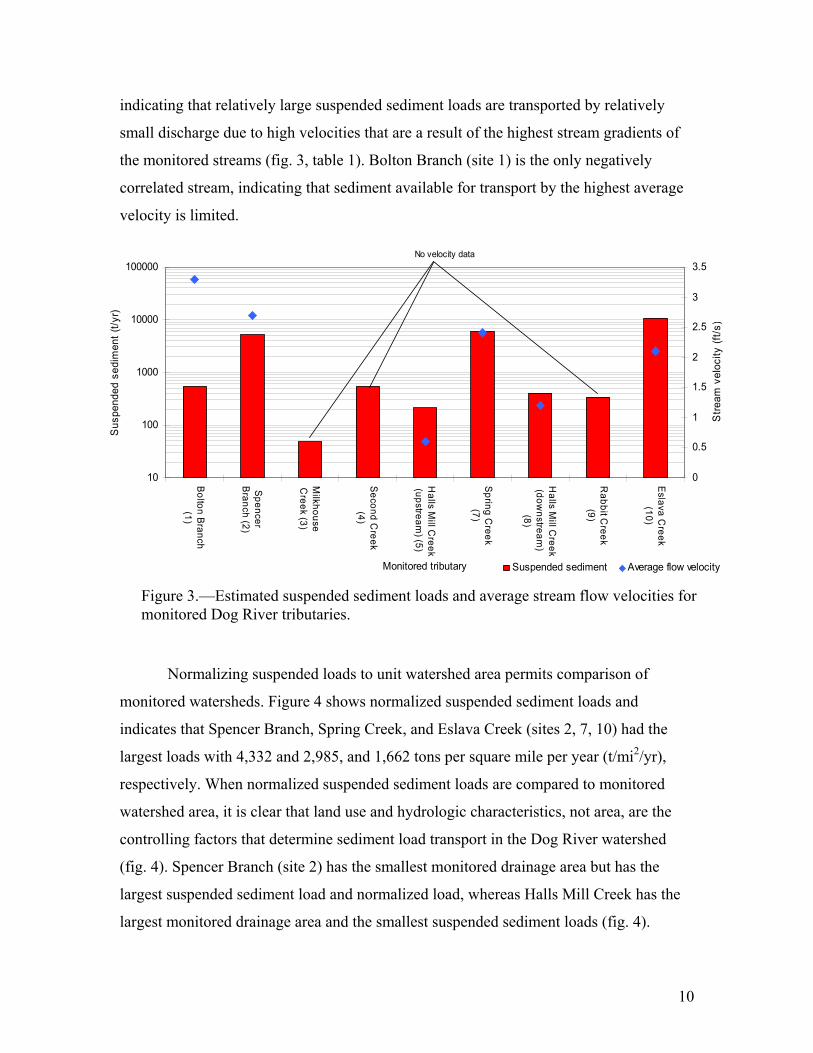
indicating that relatively large suspended sediment loads are transported by relatively
small discharge due to high velocities that are a result of the highest stream gradients of
the monitored streams (fig. 3, table 1). Bolton Branch (site 1) is the only negatively
correlated stream, indicating that sediment available for transport by the highest average
velocity is limited.
10
100
1000
10000
100000
Bolton B
ranch(1)
SpencerB
ranch (2)
Milkhouse
Creek (3)
Second C
reek(4)
Halls M
ill Creek
(upstream) (5)
Spring C
reek(7)
Halls M
ill Creek
(downstream
)(8)
Rabbit C
reek(9)
Eslava C
reek(10)
Monitored tributary
Sus
pend
ed s
edim
ent (
t/yr)
0
0.5
1
1.5
2
2.5
3
3.5
Stre
am v
eloc
ity (f
t/s
Normalizing suspended loads to unit watershed area permits comparison of
monitored watersheds. Figure 4 shows normalized suspended sediment loads and
indicates that Spencer Branch, Spring Creek, and Eslava Creek (sites 2, 7, 10) had the
largest loads with 4,332 and 2,985, and 1,662 tons per square mile per year (t/mi2/yr),
respectively. When normalized suspended sediment loads are compared to monitored
watershed area, it is clear that land use and hydrologic characteristics, not area, are the
controlling factors that determine sediment load transport in the Dog River watershed
(fig. 4). Spencer Branch (site 2) has the smallest monitored drainage area but has the
largest suspended sediment load and normalized load, whereas Halls Mill Creek has the
largest monitored drainage area and the smallest suspended sediment loads (fig. 4).
Figure 3.—Estimated suspended sediment loads and average stream flow velocities for monitored Dog River tributaries.
)
Suspended sediment Average flow velocity
No velocity data
10

10
100
1000
10000
100000
Bolton B
ranch(1)
Spencer
Branch (2)
Milkhouse
Creek (3)
Second C
reek(4)
Halls M
illC
reek(upstream
) (5)
Spring C
reek(7)
Halls M
illC
reek(dow
nstream)
(8)
Rabbit C
reek(9)
Eslava C
reek(10)
Monitored tributary
Sus
pend
ed s
edim
ent (
t/mi2 /y
r)
1
10
100
Mon
itore
d w
ater
shed
are
a (m
i2 )
Estimated normalized suspended sediment load Monitored watershed area
Figure 4.—Estimated normalized suspended sediment loads and monitored watershed areas for Dog River tributaries.
BED SEDIMENT
Transport of streambed material is controlled by a number of factors including
stream discharge and flow velocity, erosion and sediment supply, stream base level, and
physical properties of the streambed material. Most streambeds are in a state of constant
flux in order to maintain a stable base level elevation. The energy of flowing water in a
stream is constantly changing to supply the required power for erosion or deposition of
bed load to maintain equilibrium with the local water table and regional or global sea
level. Stream base level may be affected by regional or global events including
fluctuations of sea level or tectonic movement. Local factors affecting base level include
fluctuations in the water table elevation, changes in the supply of sediment to the stream
caused by changing precipitation rates, and/or land use practices that promote excessive
erosion in the floodplain or upland areas of the watershed.
Bed load sediment is composed of particles that are too large or too dense to be
carried in suspension by stream flow. These particles roll, tumble, or are periodically
suspended as they move downstream. Traditionally, bed load sediment has been difficult
to quantify due to deficiencies in monitoring methodology or inaccuracies of estimating
volumes of sediment being transported along the streambed. This is particularly true in
streams that flow at high velocity or in streams with excessive sediment loads.
11

The Geological Survey of Alabama developed a portable bed load sedimentation
rate-monitoring device to accurately measure bed sediment in shallow streams with sand
or gravel beds (Cook and Puckett, 1998). The device was utilized during this project to
measure bed loads periodically over a range of discharge events to calculate daily bed
load sedimentation rates. However, Halls Mill Creek sites 5 and 8 were the only sites
with stream bed conditions that permitted measurement of bed sediment. As mentioned
previously, sediment volumes at all other sites were measured on hard surfaces so that
total sediment volumes were assumed to be suspended. Table 3 shows measured average
stream discharge and stream flow velocity and bed sediment loads for sites 5 and 8. Note
that the bed sediment load at site 5 (265 t/yr) is greater than that at site 8 (242 t/yr) even
though the drainage area for the watershed upstream from site 5 is less than 10 percent as
large as the drainage area upstream from site 8. This is caused by two primary factors.
First, plate 3 indicates that land uses in the headwaters of Halls Mill Creek upstream from
site 5 are varied with both urban development and agriculture, whereas the floodplain
between sites 5 and 8 is primarily forest and wetlands. Therefore, most of the bed
sediment is sourced from the area upstream from site 5. Secondly, the floodplain of the
creek between sites 5 and 8 expands significantly and contains numerous wetlands. The
gradient of the stream decreases from 64 ft/mi upstream of site 5 to 15 ft/mi between sites
5 and 8. These factors indicate that there is significantly less erosion and greater sediment
deposition in the watershed between sites 5 and 8 than upstream from site 5. This can
also be seen on plate 4, which shows significant alluvium in the stream reach between
sites 5 and 8.
As with suspended sediment, it is possible to use discharge/sediment relationships
to develop regression models to determine mean daily bed load volumes and annual bed
sediment loads, as shown in figure 5. Figure 6 shows the excellent correlation between
measured stream flow velocity and corresponding bed sediment transport rates at Halls
Mill Creek (site 8). Figure 6 also shows that almost no bed sediment is transported until
the stream flow reaches 1.00 ft/s.
12

0.01
0.10
1.00
10.00
1.0 10.0 100.0Discharge (cfs)
Bed
Sed
imen
t (t/d
)
Figure 5.—Measured bed sediment loads in tons per day (t/d) and average stream discharge at Halls Mill Creek site 5.
0
1
23
4
5
6
78
9
10
0.00 0.20 0.40 0.60 0.80 1.00 1.20 1.40 1.60 1.80 2.00Stream flow velocity (ft/s)
Bed
Sed
imen
t (t/d
)
Figure 6.—Measured bed sediment loads in tons per day (t/d) and average stream flow velocities at Halls Mill Creek site 8.
Table 3 gives stream discharge, stream flow velocity, annual bed sediment loads,
and normalized annual bed sediment loads for Halls Mill Creek sites 5 and 8. As
discussed previously, site 5 had the largest bed sediment load (265 t/yr) and site 8 had a
load of 242 t/yr. After normalization of bed sediment loads, site 5 had a load of 121
t/mi 2/yr and site 8 had a load of 8.9 t/mi 2/yr. This confirms the previously discussed fact
that most of the bed sediment is contributed from the area upstream from site 5.
13

Table 3—Measured discharge, stream flow velocity, and estimated bed sediment loads for sites on monitored tributaries in the Dog River watershed.
Monitored site
Average discharge
(cfs)
Average stream-flow velocity
(f/s)
Estimated annual bed sediment loads
(t/yr)
Estimated normalized annual bed
sediment loads (t/mi 2/yr)
5 30.6 0.6 265 121 8 72.8 1.2 242 8.9
*Total sediment loads for sites 1-4, 6, 7, 9, and 10 were assumed to be suspended.
TOTAL SEDIMENT LOADS
Total sediment loads are composed of suspended and bed sediment. As noted
previously, much of the erosion in the project watersheds is caused by human activity.
Without human impact, erosion rates in the watershed, called the geologic erosion rate
would be 64 t/mi2/yr (Maidment, 1993). The estimated geologic erosion rates for the
project watersheds are shown in table 4. The largest total annual sediment load (10,803
t/yr) was estimated for Eslava Creek (site 10) (table 4, fig. 7). When the data are
normalized, allowing comparison of sediment loads with respect to unit drainage areas,
site 2 had the largest load (4,332 t/mi2/yr) (table 4).
Table 4—Estimated total sediment loads for monitored Dog River tributaries.
Monitored site
Estimated geologic erosion rate total sediment load
(t/yr)
Estimated total annual sediment load
(t/yr)
Estimated normalized total annual sediment load
(t/mi 2/yr)
1 230 541 150 2 77 5,198 4,332 3 192 48 16 4 237 551 149 5 134 475 226 7 128 5,970 2,985 8 1,734 649 24 9 398 342 55
10 416 10,803 1,662 Total 3,546 25,577 1,068 (average)
14

265 242
10,803
342
407
5,970
210551
48
5,198
541
10
10,000
Bolton Branch (1)
Spencer Branch(2)
Milkhouse C
reek(3)
Second Creek (4)
Halls M
ill Creek
(upstream) (5)
Spring Creek (7)
Halls M
ill Creek
(downstream
) (8)
Rabbit C
reek (9)
Eslava Creek
(10)
Monitored site
Tota
l sed
imen
t (t/y
r)
Bed sediment Suspended sediment
Figure 7.—Estimated total sediment loads for monitored tributaries in the Dog River watershed.
Comparisons of sediment loads from other watersheds are helpful in determining
the severity of erosion problems in a watershed of interest. Estimates of sediment loads
from Magnolia River site 4 (Magnolia River at U.S. Highway 98), D’Olive Creek site 3
(D’Olive Creek at U.S. Highway 90), and Tiawasee Creek site 7 (Tiawasee Creek
upstream from Lake Forest), in Baldwin County, are compared to Dog River tributary
loads in figure 8 (Cook and others, 2008, 2009). Figure 9 provides a comparison of
sediment loads in selected streams throughout Alabama. It indicates that sediment loads
estimated for Dog River sites 2, 7, and 10 are among the highest of about 55 streams
assessed by GSA. Figure 9 also shows that sediment loads in the Dog River streams are
comparable to watersheds with similar urban sediment sources, flow regimes, and
erosional impacts. Figure 9 shows similar sediment loads in streams in the
Choctawhatchee River watershed in southeast Alabama and the Bear Creek watershed in
northwest Alabama (erosion primarily from row crop agriculture and timber harvesting).
15

Tributaries to the Gantt and Point A reservoirs in south-central Alabama have sediment
primarily from eroding unpaved roads, and D’Olive Creek sediment is primarily from
urban and developing urban areas of the watershed. Figure 9 also shows that sites with
consistently higher sediment loads were from storm-water runoff in the more mature
urban watersheds in the city of Tuscaloosa and Dog River. Yellow River exhibits the
smallest loads due to the rural and forested character of the watershed (fig. 9).
10
100
1,000
10,000
Bolton B
ranch (1)
Spencer B
ranch (2)
Milkhouse C
reek (3)
Second C
reek (4)
Halls M
ill Creek
(upstream) (5)
Spring C
reek (7)
Halls M
ill Creek
(downstream
) (8)
Rabbit C
reek (9)
Eslava C
reek (10)
Magnolia R
iver (4)
D'O
live Creek (3)
Tiawasee C
reek (7)
Monitored site
Tota
l sed
imen
t (t/m
i2 /yr)
Figure 8.—Comparisons of estimated normalized total sediment loads from selected Baldwin County streams and monitored Dog River tributaries.
16

1
10
100
1,000
10,000
BC DBCLCR
LDBWC
FRCYR LKC
BC1BC2
LBCTSW6
TSW8TSW12
TSW13
GP1GP3
GP4DC1
DC3DC7
DC10DR 2
DR7DR10
Monitored watershed
Tota
l Sed
imen
t Loa
ds (t
ons
/ mi
2 / yr
)
Suspended sediment Bed sediment
Choctaw hatchee River Yellow River Bear Creek Tuscaloosa storm w ater Dog River Gantt-Point A D'Olive Creek
Figure 9.—Comparisons of estimated normalized total sediment loads from selected streams throughout Alabama and monitored Dog River tributaries.
SUMMARY
The purpose of this project is to assess sediment loads and sediment transport by
tributaries of Dog River and to assess impacts of land-use on erosion and sediment loads
in the watershed. These data will be useful to municipal and regional officials and
agencies in the development of remediation plans to limit erosion and sediment transport
into Dog River and Mobile Bay.
Urban runoff can have tremendous deleterious impacts on water quality and
biological habitat of streams. This is particularly true in watersheds where land use has
been substantially changed and stream channels have been modified by channelization.
Water quality in these urban streams is typically characterized by excessive nutrients, 17

bacteria, and sediment. The northern part of the watershed includes part of downtown
Mobile, which is almost completely urbanized, influencing runoff with impervious
surfaces and urban contaminants. The western part of the watershed includes rapidly
changing land uses from forested to urban and the southwestern part of the watershed
includes interspersed commercial and forested landscapes. Bolton Branch, Spencer
Branch, Spring Creek, and Eslava Creek (sites 1, 2, 7, and 10, respectively) are
channelized (concrete flumes) and have extensive commercial and residential
development in the floodplains. Milkhouse Creek has extensive, relatively recent
development in the upstream part of floodplain near site 3. The remaining monitored
streams have relatively minimal development in floodplains and only minor
modifications to stream channels, although relatively recent urbanization has occurred on
the uplands along the drainage divides. Second Creek (site 4) is primarily anastomosing
but has extensive riprap channel armoring upstream and downstream from the monitoring
site at the Cottage Hill Road crossing. Sites 5 and 8 are on Halls Mill Creek which has a
relatively small amount of channel modification and floodplain development. Rabbit
Creek is the southern most tributary to Dog River and has relatively minimal
development in the floodplain. Agriculture in the Dog River watershed is minimal,
although pasture and pecan orchards form a significant part of the land use in the
headwaters of Halls Mill Creek and Rabbit Creek.
Sediment loads were determined by direct measurement of suspended and bed
sediment for a range of discharge events. These data were evaluated by regression models
to determine annual sediment loads.
Sites 10 (Eslava Creek at U.S. Highway 98), 7 (Spring Creek at Maudelayne
Drive), and 2 (Spencer Branch at Cottage Hill Road) had the largest suspended sediment
loads with 10,803, 5,970, and 5,198 t/yr, respectively. When the data were normalized
with respect to unit watershed area, sites 2, 7, and 10 had the largest loads with 4,332,
2,985, and 1,662 t/mi2/yr, respectively. Halls Mill Creek sites 5 and 8 were the only sites
with measurable bed sediment (265 and 242 t/yr, respectively) due to the fact that all
other sites had hard surface stream beds so that all transported sediment was assumed to
be suspended.
When compared to sediment loads previously estimated for Baldwin County
streams-- D’Olive Creek (1,987 t/mi2/yr), Tiawasee Creek (692 t/mi2/yr), and Magnolia
18

River (112 t/mi2/yr)-- Dog River tributary sites 2 (Spencer Branch) and 7 (Spring Creek)
were larger with 4,332, and 2,985 t/mi2/yr, respectively. Estimated total sediment
transported to Dog River and Mobile Bay from the eight monitored streams is more than
25,000 t/yr or about 46,000 cubic yards of sediment.
REFERENCES CITED
Cohn, T. A., Caulder D. L., Gilroy E. J., Zynjuk L. D., and Summers, R. M., 1992, The
validity of a simple statistical model for estimating fluvial constituent loads: an
empirical study involving nutrient loads entering Chesapeake Bay: Water
Resources Research, v. 28, p. 2353-2363.
Cook, M. R., and Moss, N. E., 2008, Analysis of water quality, sediment loading,
biological resources, and impacts of land-use change on the D’Olive and
Tiawasee Creek watersheds, Baldwin County, Alabama, 2008: Geological Survey
of Alabama Open-file Report 0811, 140 p.
Cook, M. R., Moss, N. E., and Murgulet, Dorina, 2009, Analysis of sediment loading for
the Magnolia River watershed, Baldwin County, Alabama, 2009: Geological
Survey of Alabama Open-file Report 0914, 22 p.
Cook, M. R., and Puckett, T. M., 1998, Section 319 national monitoring program project
for Lightwood Knot Creek Watershed in Southeast Alabama: A report to the
Alabama Department of Environmental Management, 1997 Annual Report and
Paired Watershed Calibration: Geological Survey of Alabama Open-file Report,
140 p.
Maidment, D. R., ed., 1993, Handbook of hydrology: New York, Mcgraw-Hill Inc., p. 11.37-11.54.
Richards, R. P., 1999, Estimation of pollutant loads in rivers and streams: a guidance
document for NPS programs: Heidelberg College.
19

Appendix
Photographs
20

21
Spencer Branch monitoring site 2.
Spring Creek monitoring site 7.

22
Spring Creek near Halls Mills road, 3,000 feet downstream from site 7.
Rabbit Creek monitoring site 9.

23
Eslava Creek monitoring site 10.
24
GEOLOGICAL SURVEY OF ALABAMA P.O. Box 869999
420 Hackberry Lane Tuscaloosa, Alabama 35486-6999
205/349-2852
Berry H. (Nick) Tew, Jr., State Geologist
A list of the printed publications by the Geological Survey of Alabama can be obtained from the Publications Sales Office (205/247-3636) or
through our web site at http://www.gsa.state.al.us/.
E-mail: [email protected]
The Geological Survey of Alabama (GSA) makes every effort to collect, provide, and maintain accurate and complete information. However, data acquisition and research are ongoing activities of GSA, and interpretations may be revised as new data are acquired. Therefore, all information made available to the public by GSA should be viewed in that context. Neither the GSA nor any employee thereof makes any warranty, expressed or implied, or assumes any legal responsibility for the accuracy, completeness, or usefulness of any information, apparatus, product, or process disclosed in this report. Conclusions drawn or actions taken on the basis of these data and information are the sole responsibility of the user.
As a recipient of Federal financial assistance from the U.S. Department of the Interior, the GSA prohibits discrimination on the basis of race, color, national origin, age, or disability in its programs or activities. Discrimination on the basis of sex is prohibited in federally assisted GSA education programs. If anyone believes that he or she has been discriminated against in any of the GSA’s programs or activities, including its employment practices, the individual may contact the U.S. Geological Survey, U.S. Department of the Interior, Washington, D.C. 20240.
AN EQUAL OPPORTUNITY EMPLOYER
Serving Alabama since 1848

GEOLOGICAL SURVEY OF ALABAMA Plate 1
88°3'0"W
88°3'0"W
88°6'0"W
88°6'0"W
88°9'0"W
88°9'0"W
88°12'0"W
88°12'0"W
88°15'0"W
88°15'0"W
30°42'0"N
30°42'0"N
30°39'0"N
30°39'0"N
30°36'0"N
30°36'0"N
30°33'0"N
30°33'0"N
BERRY H. (NICK) TEW, JR.
State Geologist
TOPOGRAPHY AND LOCATIONS OF STREAMS AND MONITORING SITES IN THE DOG RIVER WATERSHED
ByAlana L. Rogers and Marlon R. Cook
2012
0 1 2 3 4
Miles
5
Mobile
County
V10431§̈¦85
Low : -1
High : 231
City
Explanation
Limited access interstate
Highway
Major road
Interstate highway
United States highway
State highway
Dog River WatershedAssessment Area
Rivers
Elevation in feet above NGVD 1929
!(DR5Site Location and Identification Number
Mobile
Bay
MOBILE
MOBILE
BAY
Dog River
Bolton Branch
Milkhouse C
reek
Second Creek
Eslava Creek
Spencer Branch
Spring Creek
Halls Mill Creek
Halls Mill Creek
Second Creek
Rabbit Creek
Rabbit C
reek
Dog River
Dog River
30°39'0"N
§̈10
§̈65
§̈65
§̈10§̈65
£90
£90
£90
UV183
UV56
UV193
UV193
90
Government
Government
!(Tillmans Corner
!(
!(
!(
!(
!(
!(
!(
!(
!(
!(DR10
DR9
DR8
DR7
DR6DR5
DR4
DR3
DR2
DR1

GEOLOGICAL SURVEY OF ALABAMA Plate 2
88°3'0"W
88°3'0"W
88°6'0"W
88°6'0"W
88°9'0"W
88°9'0"W
88°12'0"W
88°12'0"W
88°15'0"W
88°15'0"W
30°42'0"N
30°42'0"N
30°39'0"N
30°39'0"N
30°36'0"N
30°36'0"N
30°33'0"N
30°33'0"N
BERRY H. (NICK) TEW, JR.
State Geologist
TOPOGRAPHY, MONITORED SITES AND SUBWATERSHEDS IN THE DOG RIVER WATERSHEDBy
Alana L. Rogers2012
0 1 2 3 4
Miles
5
Halls Mill Creek
Dog River
Bolton Branch
Milkhouse C
reek
Perch Creek
Second Creek
Alligator
Bayou
Eslava Creek
Robinson Bayou
Rattlesnake Bayou
Miller Creek
Milkhouse Creek
§̈10
§̈65
§̈65
§̈10§̈65
£90
£90
£90
UV183
UV56
UV193
UV193
90
Government
Government
!(Tillmans Corner
!(
!(
!(
!(
!(
!(
!(
!(
!(
!(DR10
DR9
DR8
DR7
DR6
DR5
DR4
DR3
DR2
DR1
Baldwin
County
MOBILE
MOBILE
V10431§̈¦85
City
Explanation
Limited access interstate
Highway
Major road
Interstate highway
United States highway
State highway
Monitored Subwatersheds
Rivers
!(DR5Site Location and Identification Number
Dog River WatershedAssessment Area

GEOLOGICAL SURVEY OF ALABAMA Plate 3
88°3'0"W
88°3'0"W
88°6'0"W
88°6'0"W
88°9'0"W
88°9'0"W
88°12'0"W
88°12'0"W
88°15'0"W
88°15'0"W
30°42'0"N
30°42'0"N
30°39'0"N
30°39'0"N
30°36'0"N
30°36'0"N
30°33'0"N
30°33'0"N
Mobile
Bay
BERRY H. (NICK) TEW, JR.
State Geologist
LAND-USE/LAND-COVER, MONITORED SITES AND SUBWATERSHEDS IN THE DOG RIVER WATERSHED
By:Alana L. Rogers
2012
0 1 2 3 4
Miles
5
!(
!(
!(
!(
!(
!(
!(
!(
!(
!(DR0
DR9
DR8
DR7
DR6DR5
DR4
DR3
DR2
DR1
!(Tillmans Corner
MOBILE
MOBILE
City
Explanation
Monitored Subwatersheds
!(DR5Site Location and Identification Number
Dog River WatershedAssessment Area
Corn
Cotton
Soybeans
Peanuts
Other Crops
Seed/Sod Grass
Pasture/Hay
Pecans
Open Water
Developed
Barren
Forest
Grassland Herbaceous
Wetlands
LULC Classification

GEOLOGICAL SURVEY OF ALABAMA Plate 4
88°3'0"W
88°3'0"W
88°6'0"W
88°6'0"W
88°9'0"W
88°9'0"W
88°12'0"W
88°12'0"W
88°15'0"W
88°15'0"W
30°42'0"N
30°42'0"N
30°39'0"N
30°39'0"N
30°36'0"N
30°36'0"N
30°33'0"N
30°33'0"N
!(Tillmans Corner
BERRY H. (NICK) TEW, JR.
State Geologist
GEOLOGY, MONITORED SITES AND SUBWATERSHEDS IN THE DOG RIVER WATERSHED
ByAlana L. Rogers and Marlon R. Cook
2012
0 1 2 3 4
Miles
5
!(
!(
!(
!(
!(
!(
!(
!(
!(
!(DR0
DR9
DR8
DR7
DR6DR5
DR4
DR3
DR2
DR1
Alabama
MOBILE
MOBILE
City
Explanation
Monitored Subwatersheds
!(DR5Site Location and Identification Number
Dog River WatershedAssessment Area
Citronelle Formation
Alluvial, Coastal, and Low Terrace Deposits
Miocene Series Undifferentiated
Geology
Water