analysis of data center architectures supporting open ... · pdf fileanalysis of data center...
TRANSCRIPT

Analysis of Data Center Architectures Supporting Open Compute Project (OCP)
Executive summaryOpen Compute has had a significant impact on the thinking about data center design. Until now, the focus has been on systems at the rack level, leaving unanswered questions about the power infrastructure upstream of the rack. In this paper, we address critical questions about the implications of Open Compute on the upstream power infrastruc-ture, including redundancy, availability, and flexibility. We introduce simplified reference designs that support OCP and provide a capital cost analysis to compare traditional and OCP-based designs. We also present an online TradeOff Tool that allows data cen-ter decision makers to better understand the cost differences and cost drivers to various architectures.
Revision 0
by Kevin Brown Wendy Torell
White Paper 228

Schneider Electric – Data Center Science Center White Paper 228 Rev 0 2
Analysis of Data Center Architectures Supporting Open Compute Project (OCP)
The efforts of the Open Compute Project (OCP)1 have opened up an important dialog about the design of data centers. The discussions and detailed specs thus far, have focused primarily on the IT and the rack. In addition, statements about savings have been made without documentation as to how these savings are achieved. This has left some uncertainty as to what the impacts are on the up-stream power architecture. We believe that for Open Compute to be widely adopt-ed, we need electrical architectures designed not only with OCP principles in mind, but that also offer a level of redundancy and maintainability that data center operators expect, as well as the flexibility to support both traditional and Open Compute IT equipment. This paper addresses the following critical questions about the electrical architec-ture we believe data center managers will want to fully understand before consider-ing an OCP adoption. • How do OCP rack/server designs affect the upstream electrical infrastructure?
• Can I still achieve 2N redundancy (sometimes referred to as tier 3)?
• How do I support traditional and OCP loads in the same data center?
We present two Open Compute power architectures as well as a simplified version that supports mixed loads. We also analyze their capital costs and how they compare to a traditional 2N data center architecture, and discuss the key variables that drive the analysis. Note that this paper assumes the reader has knowledge of the OCP Open Rack standard. Figure 1 is a capital cost summary comparing these architectures2 (including costs from MV switchgear down to and including the rack and server power supplies). The degree of cost savings varies depending on redundancy and the required mix of IT equipment (OCP and traditional). Relative to the traditional 2N data center, the Open Compute specific 1N architecture provides a 45% capex savings, while the Open Compute specific 2N architecture provides a 25% savings. OCP-specific designs, however, may be limiting for many data centers. A simplified 2N architec-ture that supports mixed loads represents a 3% premium over the OCP specific 2N design – a small premium for the flexibility it offers in supporting different IT equip-ment types.
1 http://www.opencompute.org/about/ (last accessed on 3/4/16) 2 1.95€/watt represents the simplified 2N design cost with 100% OCP loads. Moving to 100% traditional
loads would add 0.21€/watt more. This is discussed in detail in the cost analysis section of the paper.
Introduction
Figure 1
Capex summary of traditional vs. OCP power architectures
2
Power architectures & reference designs Power architecture refers to the basic, high level structure of how power is distributed from the utility down to the IT racks. A data center reference design is a specific instance of an architecture based a specified set of performance characteris-tics (i.e. capacity, density, redundancy level, efficiency rating). A Schneider Electric reference design covers the electrical, mechanical, and IT spaces and includes electrical one lines, piping diagrams, floor layouts and equipment lists. These tools are designed to help simplify and accelerate planning by making it easy to compare and contrast design alternatives to come to quick agreement on key project parameters. Schneider Electric designs can be found at: http://designportal.apc.com/dcrd/pages/filter.html For this analysis power architectures were developed and example reference designs were made based on these generic architectures. The one lines shown in this paper are from these reference designs.

Schneider Electric – Data Center Science Center White Paper 228 Rev 0 3
Analysis of Data Center Architectures Supporting Open Compute Project (OCP)
Each of these designs, and the details of the cost analysis, including where the cost savings comes from, are described in the following sections. There are many approaches to distributing power from a data center’s utility source(s) to the IT load(s). The selection of the appropriate configuration is deter-mined by the availability needs, risk tolerances, types of loads in the data center, budgets, and existing infrastructure. White Paper 75, Comparing UPS System Design Configurations, describes the 5 key power/UPS architectures and highlights the advantages and disadvantages of each. In this paper, we focus on one common design with two utility sources, a shared generator system/bus, 2N centralized UPSs, and 2N distribution to the loads (sometimes referred to as tier 3). Cross ties are placed at the medium voltage (MV) and low voltage (LV) distribution levels to allow for concurrent maintenance while still providing redundant sources of power to the critical load. A load bank is also included on the output of the UPS. Figure 2 illustrates this common architecture.
Utility A
rPDU
Server
UPS+ SSW
UPS+ SSW
UPS+ SSW
ad t o a
16-20A
LV level
Pod level
Rack level
400A
400A
3200A
RPP
rPDU
1250 A
1250 A
LB
MV level
Utility B
rPDU
Server
UPS+ SSW
UPS+ SSW
UPS+ SSW
16-20A
400A
400A
3200A
RPP
rPDU
LB
1250 A
1250 A
G G G G G
630 A
G G G
1600A
Cooling
1600A
Cooling
Data center managers commonly expect redundancy and maintainability objectives to be achieved through an architecture like this. However, if we shift the mindset from “I have to provide power to redundant server power supplies at all times” to “I can rely on the inherent redundancy of my server power supplies during maintenance”, we can:
• Eliminate unnecessary components like cross ties, their related breakers, load banks, and one of the UPS systems and its batteries that add cost and complexity.
• Save the capital expense of oversizing switchgear and cabling required to simultaneously support critical load and UPS load bank testing. Some UPSs
Traditional 2N power architecture
Figure 2
Traditional 2N design

Schneider Electric – Data Center Science Center White Paper 228 Rev 0 4
Analysis of Data Center Architectures Supporting Open Compute Project (OCP)
can simulate a load without the need for a load bank. In the cost analysis section, we quantify these savings.
When we shift from an environment with traditional IT loads to one with 100% Open Compute IT loads, the architecture upstream is impacted. Since the server power supplies (PSU) are consolidated and the battery backup units (BBU) are placed at the rack level, the upstream UPS is eliminated. Two designs are presented below as examples of what this new upstream power architecture could look like. Open Compute Specific 1N
Figure 3 below illustrates an OCP-specific 1N (sometimes referred to as tier 1) power architecture3. This design aligns with the simplicity and cost-reduction mindset of OCP, and has the following attributes: • Single path to the IT load
• Minimal breaker count
• No centralized UPS, and instead 1N BBU within the rack
• OCP servers with 1N PSU within the rack
Utility
OC
16-20A
LV level
Pod level
Rack level
400A
400A
3200A
RPP
Rack
PDU
ServerPSUBBU
ServerPSUBBU
1250 A
1250 A
G G G G G
630 A
G G G
1600A
Cooling
MV level
This architecture is not likely to be widely adopted, however, as it requires down-time of critical loads in order to conduct maintenance on many of the components in the upstream power path.
3 Although Figure 3 shows two PSU and BBU, they are NOT redundant. The top PSU and BBU provide
1N power to the servers in the top half of the rack, and bottom PSU and BBU provide 1N power to the servers in the bottom half of the rack. Note that the BBU provides power to the server PSU. The PSU and BBU act as a UPS for the entire rack.
Figure 3
Example of simple, cost-reduced power architecture to support OCP
Alternative architectures to support OCP loads

Schneider Electric – Data Center Science Center White Paper 228 Rev 0 5
Analysis of Data Center Architectures Supporting Open Compute Project (OCP)
Open Compute Specific 2N
Figure 4 illustrates a 2N (or tier 3) power architecture. This design allows for maintenance activity or component failures to occur upstream without bringing down IT loads. This design has the following attributes: • Dual utility feeds with shared generator/bus
• Dual paths to the IT load
• No centralized UPS
• BBU within the rack for only 1 power path
• OCP servers with 2N PSU
Utility A
e OC
32A
400A
400A
3200A
RPP
G G G G G
630 A
1250 A
1250 A
Utility B
32APod level
Rack level
400A
400A
3200A
RPP
1250 A
1250 A
G G G
PDU
PSUBBU
PSUBBU
PDU
PSU
PSU
1600A
Cooling
1600A
Cooling
MV level
LV level
Server
ServerDC Voltage
DC Voltage
Note that although this design offers 2N power paths to the critical load, there is only 1N BBU. Removing the redundant BBU reduces capital expense. The above two architectures assume 100% OCP-style loads, with consolidated power supplies and battery backup within the rack. While those designs are simple and homogenous, the biggest question we see arising is: what happens if the data center has a mix of traditional loads and OCP IT loads? Data center managers generally have a refresh policy for their IT equipment. As servers reach end-of-life, they may consider adopting OCP servers. This is likely to happen at the rack or pod level, though, and not at the data center level. The mix of loads may gradually transition from mostly traditional loads to mostly OCP over a number of years. Or in some cases, they may feel there is a need to continue with traditional servers for certain applications, and maintain a hybrid environment long term.
Figure 4
Example of OCP-style power architecture with redundancy upstream
A simplified 2N architecture to support mixed loads

Schneider Electric – Data Center Science Center White Paper 228 Rev 0 6
Analysis of Data Center Architectures Supporting Open Compute Project (OCP)
Because mixed load environments are expected, we believe the architecture in Figure 5 is the most likely to be adopted. To see the complete reference design for this architecture, see Reference Design 62. This design has the following attrib-utes: • Dual utility feeds with shared generator/bus
• A UPS upstream to support both traditional and OCP loads (one path only)
• OCP loads with 2N PSU and no BBU within the rack
• Traditional loads with 2N PSU
Utility A
UPS+ SSW
UPS+ SSW
UPS+ SSW
32A
400A
400A
3200A
RPP
G G G G G
630 A
1250 A
1250 A
Utility B
32A
LV level
Pod level
Rack level
400A
400A
3200A
RPP
1250 A
1250 A
G G G
ServerrPDU
rPDU
PDU
ServerPSU
ServerPSU
PDU
PSU
PSU
OCP rack
Traditional rack
MV level
1600A
Cooling
1600A
Cooling
ATS
DC Voltage
DC Voltage
Understanding the cost trade-offs is a crucial variable to making an informed decision about which upstream architecture is right for a particular data center. We analyzed the capital expense of each of the reference designs, from the utility feed(s) down to and including the IT rack and server power supplies. For each design, we calculated the material costs for the MV level, LV level, pod level, and rack level. The approach we took for the analysis was as follows: • Scenario 1: Compare cost of traditional tier 3 to OCP tier 1 (the simplest, most
cost effective implementation of OCP)
• Scenario 2: Compare cost of traditional tier 3 to OCP tier 3 (the more likely redundancy requirement of typical data center managers)
• Scenario 3: Compare cost of OCP tier 3 to mixed-load design (This will de-termine the premium for an architecture that offers flexibility of mixed loads)
• Sensitivity analysis: Perform sensitivity analysis on key drivers to demonstrate impact on results
Cost analysis
Figure 5
Example architecture to support mix of tradition-al and OCP loads

Schneider Electric – Data Center Science Center White Paper 228 Rev 0 7
Analysis of Data Center Architectures Supporting Open Compute Project (OCP)
Costs for subsystems were based on actual deployed projects, provided by the Schneider Electric project execution team for a 9.6 MW data center with rack densities of 10 kW/rack. Costs were normalized in €/watt. Table 1 and Table 2 provide the key assumptions about the power supply (PSU), battery sizing, and costs for scenarios 1, 2, and 3.
Variable Traditional data center OCP-style data center
PSU price per PSU watt 0.07€* 0.06€**
PSU shelf price per PSU watt Not applicable 0.03€**
PSU redundancy factor 2 1 for 1N OCP; 2 for 2N OCP and Mixed-load
PSU oversizing factor 3 1.2
PSU price per IT load watt 0.07€ x 2 x 3 = 0.42€ (0.06€ + 0.03€) x 1 x 1.2 = 0.11€ for 1N OCP (0.06€ + 0.03€) x 2 x 1.2 = 0.22€ for 2N OCP
* Price quoted from multiple IT and PSU vendors
**Prices are estimates based on Schneider Electric design
Variable Traditional data center OCP-style data center
Battery type VRLA Lithium-ion
Battery run time 5 minutes 4 minutes
Battery placement Centralized in UPS Rack-based
Battery cost per watt 0.06€ for 1N UPS 0.11€ for 2N UPS 0.17€
Battery shelf per watt Not applicable 0.03€
Operating temperature 25°C (77°F) 25°C (77°F)
Findings
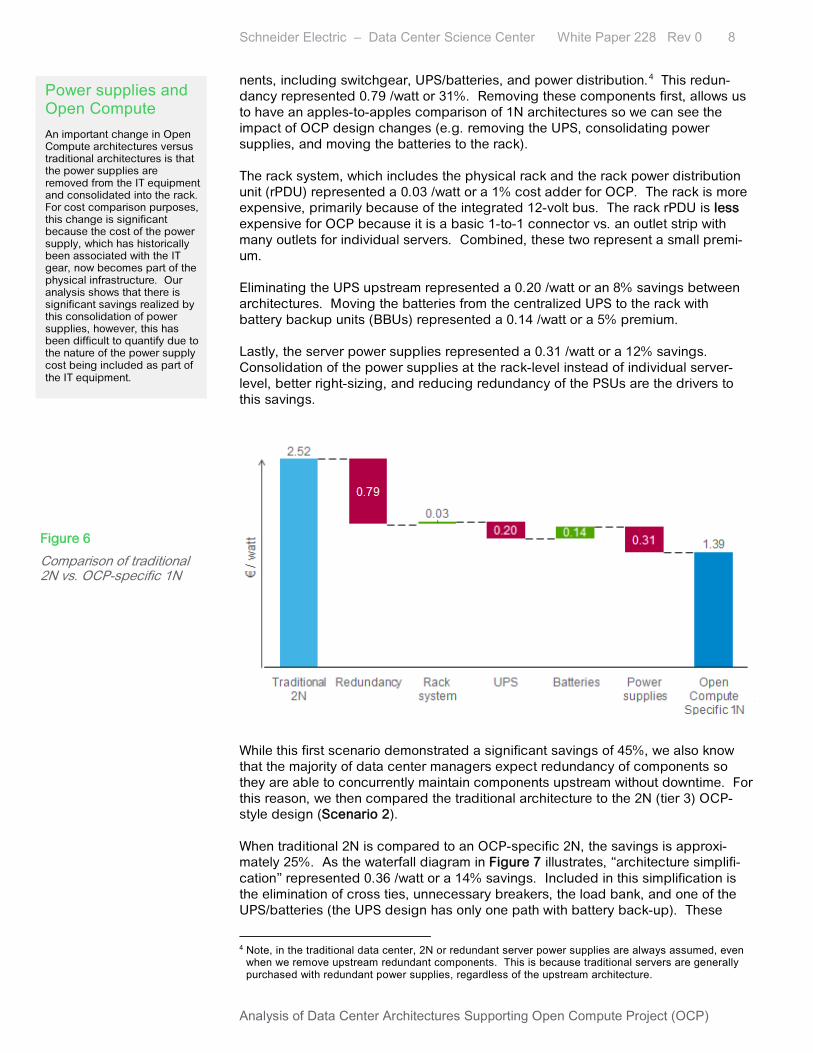
In Scenario 1, we compared the traditional design to the most simple OCP design – the 1N (tier 1) architecture. This was the starting point of the analysis because we believe 1N OCP best represented the philosophies of Open Compute in terms of cost reduction and simplicity. This scenario provided the greatest capital cost savings of 45%. It is important to remember, however, that these two designs represent very different availability and maintainability levels (tier 3 vs. tier 1). Figure 6 illustrates the cost of the two architectures, and also where the savings come from. The biggest savings results from the elimination of redundant compo-
Table 1
PSU assumptions
Table 2
Battery assumptions
Schneider Electric – Data Center Science Center White Paper 228 Rev 0 8
Analysis of Data Center Architectures Supporting Open Compute Project (OCP)
nents, including switchgear, UPS/batteries, and power distribution. 4 This redun-dancy represented 0.79€/watt or 31%. Removing these components first, allows us to have an apples-to-apples comparison of 1N architectures so we can see the impact of OCP design changes (e.g. removing the UPS, consolidating power supplies, and moving the batteries to the rack). The rack system, which includes the physical rack and the rack power distribution unit (rPDU) represented a 0.03€/watt or a 1% cost adder for OCP. The rack is more expensive, primarily because of the integrated 12-volt bus. The rack rPDU is less expensive for OCP because it is a basic 1-to-1 connector vs. an outlet strip with many outlets for individual servers. Combined, these two represent a small premi-um. Eliminating the UPS upstream represented a 0.20€/watt or an 8% savings between architectures. Moving the batteries from the centralized UPS to the rack with battery backup units (BBUs) represented a 0.14€/watt or a 5% premium. Lastly, the server power supplies represented a 0.31€/watt or a 12% savings. Consolidation of the power supplies at the rack-level instead of individual server-level, better right-sizing, and reducing redundancy of the PSUs are the drivers to this savings.
While this first scenario demonstrated a significant savings of 45%, we also know that the majority of data center managers expect redundancy of components so they are able to concurrently maintain components upstream without downtime. For this reason, we then compared the traditional architecture to the 2N (tier 3) OCP-style design (Scenario 2). When traditional 2N is compared to an OCP-specific 2N, the savings is approxi-mately 25%. As the waterfall diagram in Figure 7 illustrates, “architecture simplifi-cation” represented 0.36€/watt or a 14% savings. Included in this simplification is the elimination of cross ties, unnecessary breakers, the load bank, and one of the UPS/batteries (the UPS design has only one path with battery back-up). These
4 Note, in the traditional data center, 2N or redundant server power supplies are always assumed, even
when we remove upstream redundant components. This is because traditional servers are generally purchased with redundant power supplies, regardless of the upstream architecture.
Figure 6
Comparison of traditional 2N vs. OCP-specific 1N
Power supplies and Open Compute An important change in Open Compute architectures versus traditional architectures is that the power supplies are removed from the IT equipment and consolidated into the rack. For cost comparison purposes, this change is significant because the cost of the power supply, which has historically been associated with the IT gear, now becomes part of the physical infrastructure. Our analysis shows that there is significant savings realized by this consolidation of power supplies, however, this has been difficult to quantify due to the nature of the power supply cost being included as part of the IT equipment.

Schneider Electric – Data Center Science Center White Paper 228 Rev 0 9
Analysis of Data Center Architectures Supporting Open Compute Project (OCP)
items were discussed in the Traditional 2N power architecture section, as ways of simplifying and cost-reducing any architecture, independent of what is downstream (OCP or not). The rack system in this comparison is a slight savings, instead of a premium. This is because although the rack itself is a premium for OCP, the power distribution savings is bigger than the Scenario 1 comparison, since there are two rPDUs per rack and the traditional rPDUs are more expensive. The net savings is 0.01€/watt or a <1% savings. The UPS and battery differences are identical from the previous comparison, since the same architectural changes are made. The server power supplies represent a 0.20€/watt or an 8% savings. This number is smaller than in Scenario 1 because the OCP-specific 2N design assumes servers with redundant power supplies.
For Scenario 3, we looked at the cost differences of the OCP-specific 2N (requiring 100% OCP loads) to the simplified 2N (flexible to handle both traditional and OCP loads). Figure 8 illustrates the result of this scenario. The 0.06€/watt or 3% premi-um (light blue bar) represents the cost difference of the two architectures excluding the server power supply differences. These costs include removing the BBUs in the rack, and adding a UPS and batteries upstream. The orange bars represent the additional premium charged for the traditional server power supplies when traditional loads represent a portion of the load. As the percentage of traditional load increases, the penalty becomes larger. This is because, as discussed earlier, the traditional IT loads have a higher PSU cost due to oversizing compared to the consolidated OCP PSUs.
Figure 7
Comparison of traditional 2N vs. OCP-specific 2N

Schneider Electric – Data Center Science Center White Paper 228 Rev 0 10
Analysis of Data Center Architectures Supporting Open Compute Project (OCP)
As Table 1 states, the analysis thus far assumed traditional PSUs with a cost of 0.42€/watt of IT load. This was based off of an oversizing factor of 3. Since the premium paid for the flexible architecture is highly sensitive to the PSU cost, we did a sensitivity analysis to demonstrate how the premium would vary as the PSU oversizing varied. Figure 9 illustrates the results of varying the oversizing factor from 2 to 4.5 or 0.28-63€/watt of IT load. With a mix of 50% traditional and 50% OCP, the premium for the traditional power supplies varies from 5%-15%, and when the load is 100% traditional, the premium varies from 8%-26%. It is important to remember, however, that this premium is driven by the IT load, not the power architecture. When loads are 100% OCP, the cost premium for the flexible architecture is 3%.
An online TradeOff Tool (Traditional vs. Open Compute Capital Cost Calculator) was developed to help illustrate the capital cost differences of traditional and OCP-style power architectures. The tool allows users to select designs with varying levels of redundancy, as well as adjust the power supply cost to see the overall capex differences. Charts illustrate the breakdown of costs, so users can see what subsystems are driving the cost differences. Figure 10 is a screenshot of the tool.
Figure 8
Comparison premium for simplified 2N architecture, dependent on load mix
Figure 9
Impact of traditional PSU sizing on capex premium

Schneider Electric – Data Center Science Center White Paper 228 Rev 0 11
Analysis of Data Center Architectures Supporting Open Compute Project (OCP)
Lithium-ion technology can achieve the same amount of energy in one third the footprint and one third the weight. This has enabled the rack-based approach for batteries in the OCP-style architectures discussed in this paper. The technology also offers other advantages over VRLA batteries such as faster re-charge time and longer life span. See White Paper 229, Battery Technology for Data Centers: VRLA vs. Li-ion, for more details on these differences. In the context of traditional vs. OCP power architectures, it is important to separate out the discussion of battery technology from placement of the battery within the architecture. There are pro’s and con’s of having a centralized UPS/battery, and likewise, there are pro’s and con’s of having a decentralized battery system at the rack-level. Table 3 illustrates these differences.
Storage Benefits
Centralized (upstream of the rack)
• Flexibility to support mix of OCP and traditional IT • Isolation of battery problems from IT equipment • Frees up U space in the IT rack • Minimize stranded capacity of batteries • Less batteries to manage • Filtering and transient protection from upstream UPS
Decentralized (at the rack)
• Fault isolation • Incremental deployment • Maintainability
Figure 10
TradeOff Tool to illustrate cost comparison and cost drivers
Lithium-ion batteries
Table 3
Benefits of centralized vs. decentralized energy storage placement

Schneider Electric – Data Center Science Center White Paper 228 Rev 0 12
Analysis of Data Center Architectures Supporting Open Compute Project (OCP)
Open Compute has opened up a public dialog on data center design to help move the industry forward. However, uncertainty about implications on the power infra-structure upstream of OCP racks still exists. Savings claims have been made without quantifying the sources of those savings, and there has been a lack of detailed documentation on what the upstream power architecture should look like. For these reasons, Schneider Electric has developed and documented reference designs, and created a framework and cost analysis to help compare designs.
This paper presented these publicly available reference designs and answers common questions about redundancy, flexibility and cost of traditional, OCP-specific, and simplified mixed-load architectures.
Our analysis demonstrated that:
• the key drivers to the 45% savings between a traditional 2N and an OCP-specific 1N are the reduction in redundancy and the server power supplydifferences.
• architecture simplification represents 14% of the 25% savings between atraditional 2N and an OCP-specific 2N. In other words, these savings are in-dependent of load type. Traditional data centers can benefit from these sim-plifications as well.
• a simplified 2N architecture that is flexible to support mixed-loads (with anupstream UPS), has a small premium of 3% over an OCP-specific architec-ture. We believe this is the most likely architecture to be adopted.
• server power supply cost and load mix are highly sensitive variables thatimpact capital cost.
• it is important to separate out the discussion of battery technology fromplacement of the battery within the architecture.
About the authorsKevin Brown is the Vice President of Data Center Global Solution Offer & Strategy at Schneider Electric. Kevin holds a BS in mechanical engineering from Cornell University. Prior to this position at Schneider Electric, Kevin served as Director of Market Development at Airxchange, a manufac-turer of energy recovery ventilation products and components in the HVAC industry. Before joining Airxchange, Kevin held numerous senior management roles at Schneider Electric, including Director, Software Development Group.
Wendy Torell is a Senior Research Analyst at Schneider Electric’s Data Center Science Center. In this role, she researches best practices in data center design and operation, publishes white papers & articles, and develops TradeOff Tools to help clients optimize the availability, efficiency, and cost of their data center environments. She also consults with clients on availability science approaches and design practices to help them meet their data center performance objectives. She received her bachelor’s of Mechanical Engineering degree from Union College in Schenec-tady, NY and her MBA from University of Rhode Island. Wendy is an ASQ Certified Reliability Engineer.
Conclusion

Schneider Electric – Data Center Science Center White Paper 228 Rev 0 13
Analysis of Data Center Architectures Supporting Open Compute Project (OCP)
Comparing UPS System Design Configurations White Paper 75
Battery Technology for Data Centers: VRLA vs. Li-Ion White Paper 229
FAQs for Using Lithium-ion Batteries with a UPS White Paper 231
Traditional vs. OCP Power Architecture Capex Comparison TradeOff Tool 18
Lithium-ion vs. VRLA Battery Comparison Calculator TradeOff Tool 19
9.6 MW Simplified 2N for mixed loads Reference Design 62
Contact us For feedback and comments about the content of this white paper:
Data Center Science Center [email protected]
If you are a customer and have questions specific to your data center project:
Contact your Schneider Electric representative at www.apc.com/support/contact/index.cfm
Browse all white papers whitepapers.apc.com
tools.apc.com
Browse all TradeOff Tools™
Resources
© 20
16 S
chne
ider E
lectri
c. Al
l righ
ts re
serve
d.