analysis of dairy farmers' and - · pdf file(339), slovenia (355) ... diversification in...
TRANSCRIPT
M. Klopčič1, A. Malak-Rawlikovska2, A. Stalgiene3, A. Kuipers4
1Univ. of Ljubljana, Biotechnical Faculty, Dept. of Animal Science, Slovenia,
2SGGW, Warsaw, Poland, 3LAEI, Vilnius, Lithuania, 4Wageningen UR, Wageningen, The Netherlands
Belfast, UK, 29.08.2016
Session 2: Creating an enduring dairy sector post quota (with ADSA, Erasmus+ - ISM+ project and EuroDairy project
Analysis of dairy farmers' and stakeholders‘ expectations and
challenges in four European countries

Content
• Which development paths do dairy
farmers and stakeholders in Europe choose?
• Which economic and social factors influence this?
Availability of resources
Opportunities and threats
Future expectations

Research model used
1
Country 2
3
4
Opportunities
& Threats
Resources
Farming goals
Strategies Future
expectations
Analysis using questionnaires

Countries involved
The Netherlands
Slovenia
Poland
Lithuania
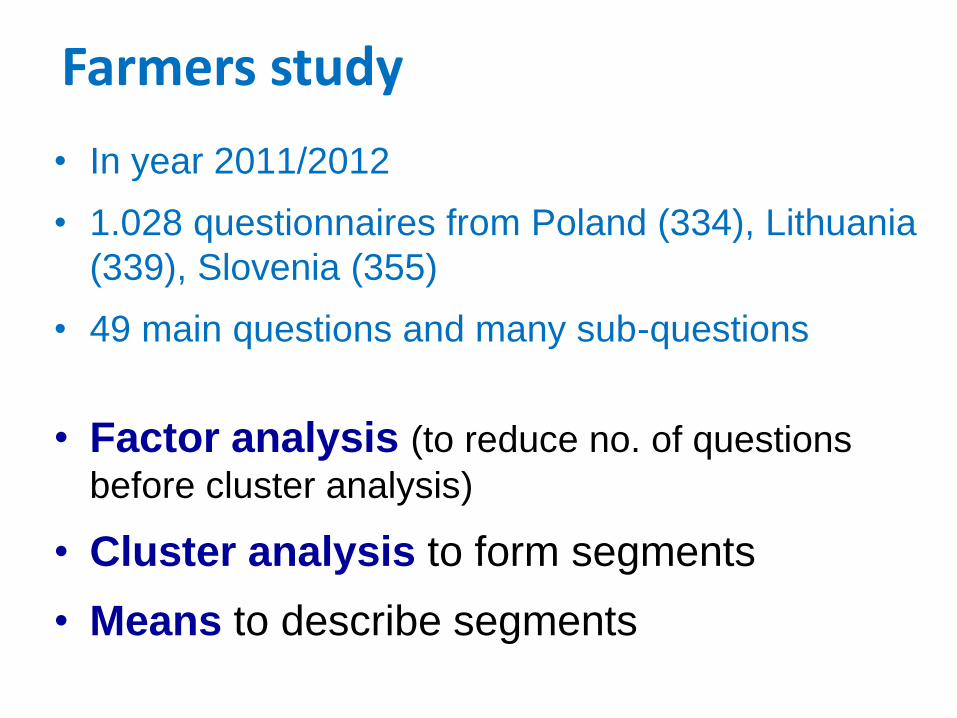
Farmers study
• In year 2011/2012
• 1.028 questionnaires from Poland (334), Lithuania
(339), Slovenia (355)
• 49 main questions and many sub-questions
• Factor analysis (to reduce no. of questions
before cluster analysis)
• Cluster analysis to form segments
• Means to describe segments
Questions about development paths:
specialization; expanding;
diversification in other agr. branches/non agr. branches;
downgrading;
wait and see;
reallocation.
Applied: Principle component analysis and then clustering

Characteristics of dairy farms in sample
Characteristics Lithuania Poland Slovenia
Ha land owned 41 32.6 14.5
Ha land rented 56 8.5 21.0
Number dairy cows 33 24 34
Milk production per cow (2010) 5,441 5,216 6,745
Cubicle/loose housing (in %) 21 17 47
Grazing (% yes) 95 75 40
Number of parcels of agric. land 15 15 31
Situation 2010/2011
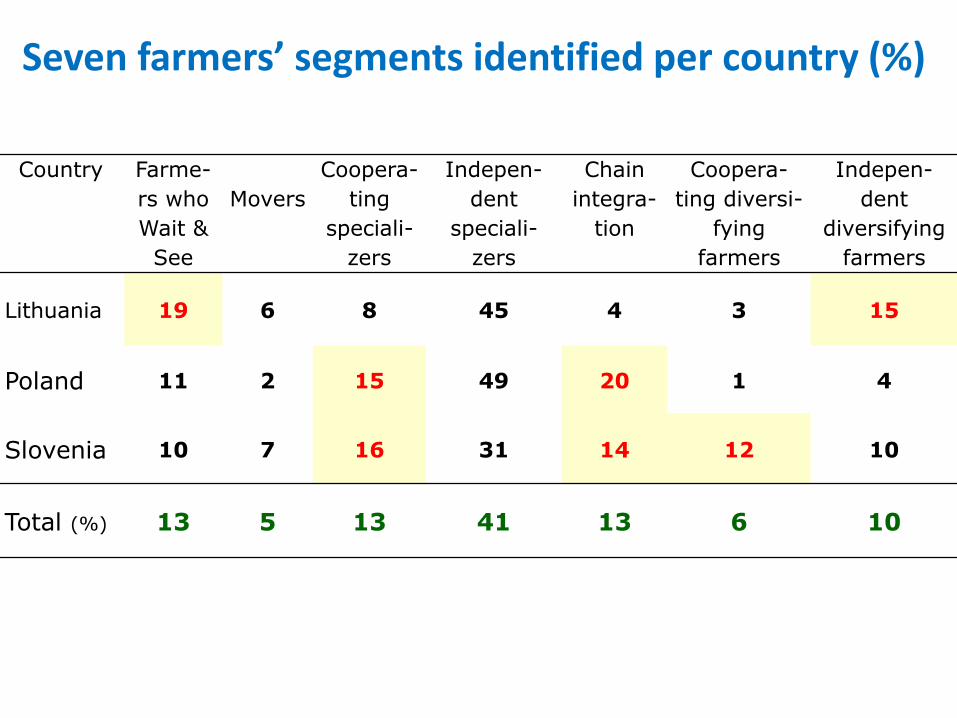
Seven farmers’ segments identified per country (%)
Country Farme-
rs who
Wait &
See
Movers
Coopera-
ting
speciali-
zers
Indepen-
dent
speciali-
zers
Chain
integra-
tion
Coopera-
ting diversi-
fying
farmers
Indepen-
dent
diversifying
farmers
Lithuania 19 6 8 45 4 3 15
Poland 11 2 15 49 20 1 4
Slovenia 10 7 16 31 14 12 10
Total (%) 13 5 13 41 13 6 10
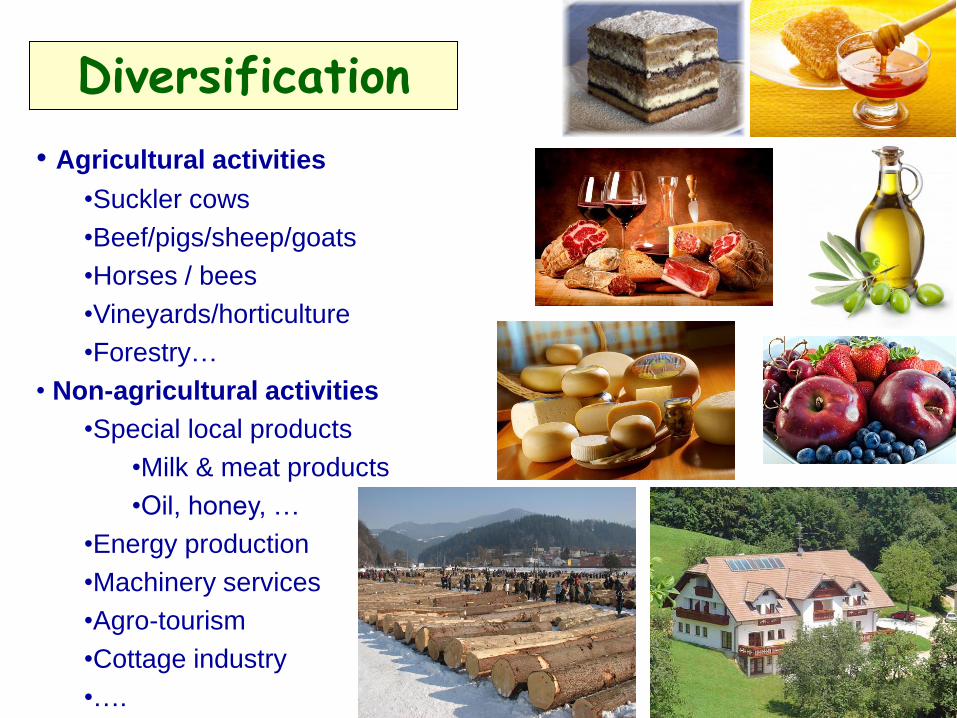
Diversification
• Agricultural activities
•Suckler cows
•Beef/pigs/sheep/goats
•Horses / bees
•Vineyards/horticulture
•Forestry…
• Non-agricultural activities
•Special local products
•Milk & meat products
•Oil, honey, …
•Energy production
•Machinery services
•Agro-tourism
•Cottage industry
•….

Farming goals between countries
1 = very unimportant 7= very important
Farming Goal Slovenia Poland Lithuania
Maximize profit 6.53 (1) 6.24 (1) 6.43 (1)
Sustainable 6.30 (2) 5.95 (2) 6.13 (2)
Dairy farming 6.07 (3) 5.44 (4) 5.86 (4)
Work environment 5.86 (4) 5.39 (5) 5.94 (3)
Improve management 5.45 (5) 5.77 (3) 5.56 (5)
Underlined significantly higher; Bold significantly lower
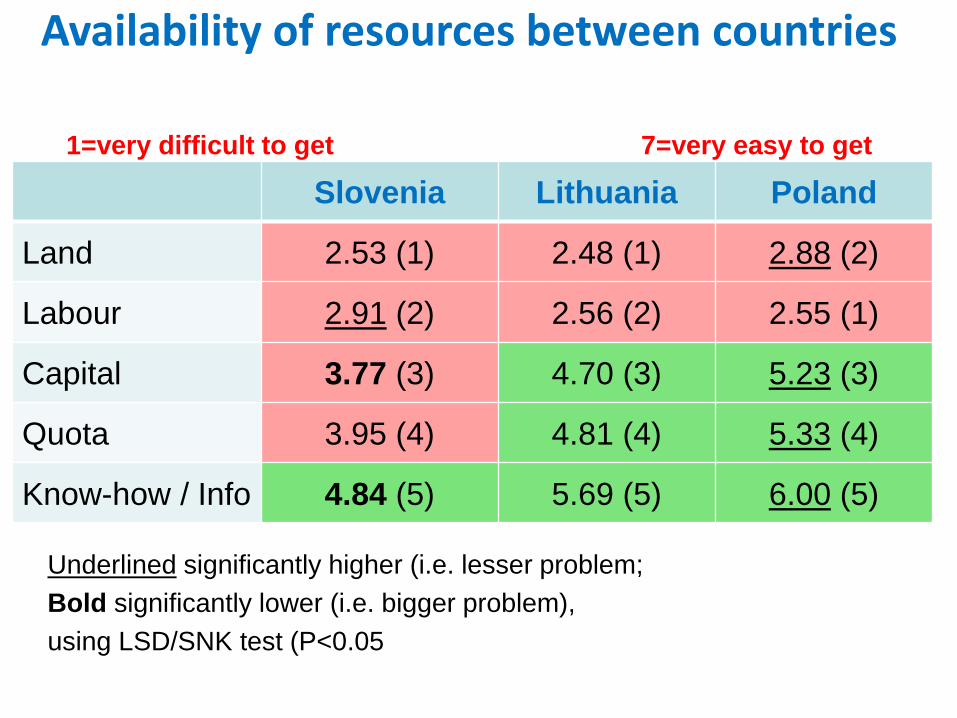
Availability of resources between countries
1=very difficult to get 7=very easy to get
Slovenia Lithuania Poland
Land 2.53 (1) 2.48 (1) 2.88 (2)
Labour 2.91 (2) 2.56 (2) 2.55 (1)
Capital 3.77 (3) 4.70 (3) 5.23 (3)
Quota 3.95 (4) 4.81 (4) 5.33 (4)
Know-how / Info 4.84 (5) 5.69 (5) 6.00 (5)
Underlined significantly higher (i.e. lesser problem;
Bold significantly lower (i.e. bigger problem),
using LSD/SNK test (P<0.05

Inclusion of 102 dairy farmers from the
Netherland: EU policies
(-3 big threat to +3 big opportunity)
-3 -2 -1 0 1 2 3
Future milk quota abolition
Accession to the EU
EU subsidies
Future reduction of direct payments(CAP)
New EU agricultural policy
Netherlands
Slovenia
Poland
Ltihuania

The Market
(-3 big threat to +3 big opportunity)
-3 -2 -1 0 1 2 3
Consumer orientation
International milk market
Netherlands
Slovenia
Poland
Lithuania

Trend in opinions of farmers
Country 2010/2011 2013 2016
Poland 334 71 60
Lithuania 339 102 33
Slovenia 355 175 91
The Netherlands - 105 50
Total 1.028 453 234
Using the same questions

Farmer opinions: future expectations n = 234
1 = pesimistic 7 = optimistic / positive

Farmer opinions: EU agricultural policy n = 234
1 = threat 7 = opportunity
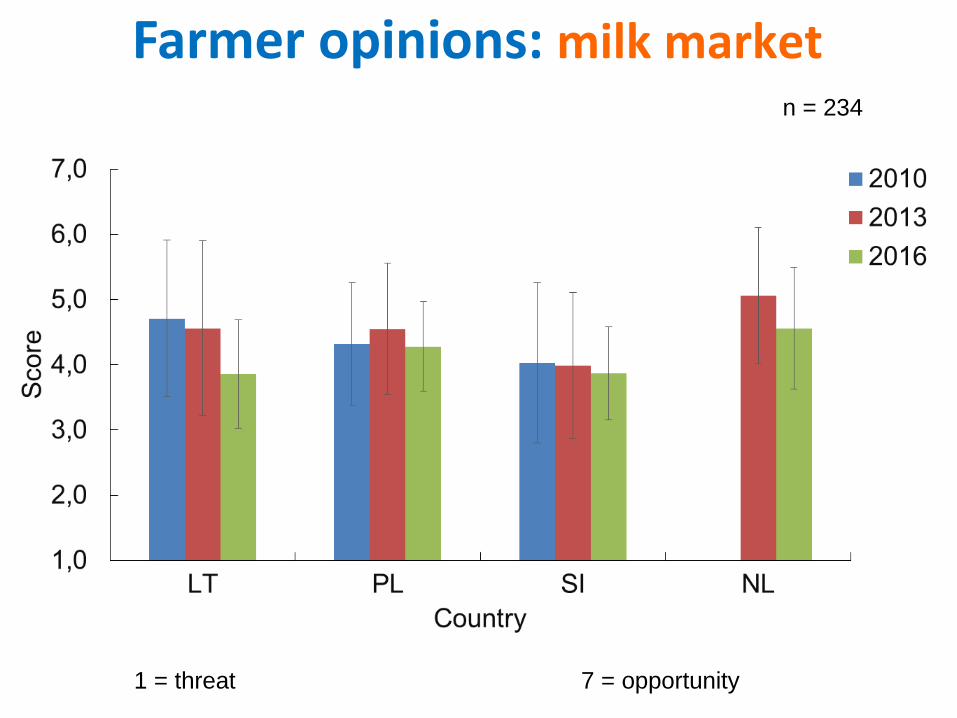
Farmer opinions: milk market n = 234
1 = threat 7 = opportunity

Milk prices in EU: 2005 - 2016
10,00
15,00
20,00
25,00
30,00
35,00
40,00
45,00
50,00
20
05m
01
20
05m
04
20
05m
07
20
05m
10
20
06m
01
20
06m
04
20
06m
07
20
06m
10
20
07m
01
20
07m
04
20
07m
07
20
07m
10
20
08m
01
20
08m
04
20
08m
07
20
08m
10
20
09m
01
20
09m
04
20
09m
07
20
09m
10
20
10m
01
20
10m
04
20
10m
07
20
10m
10
20
11m
01
20
11m
04
20
11m
07
20
11m
10
20
12m
01
20
12m
04
20
12m
07
20
12m
10
20
13m
01
20
13m
04
20
13m
07
20
13m
10
20
14m
01
20
14m
04
20
14m
07
20
14m
10
20
15m
01
20
15m
04
20
15m
07
20
15m
10
20
16m
01
20
16m
04
20
16m
07
Lihtuania Netherlands Poland Slovenia Weighted average EU
2010/11
2013
2016
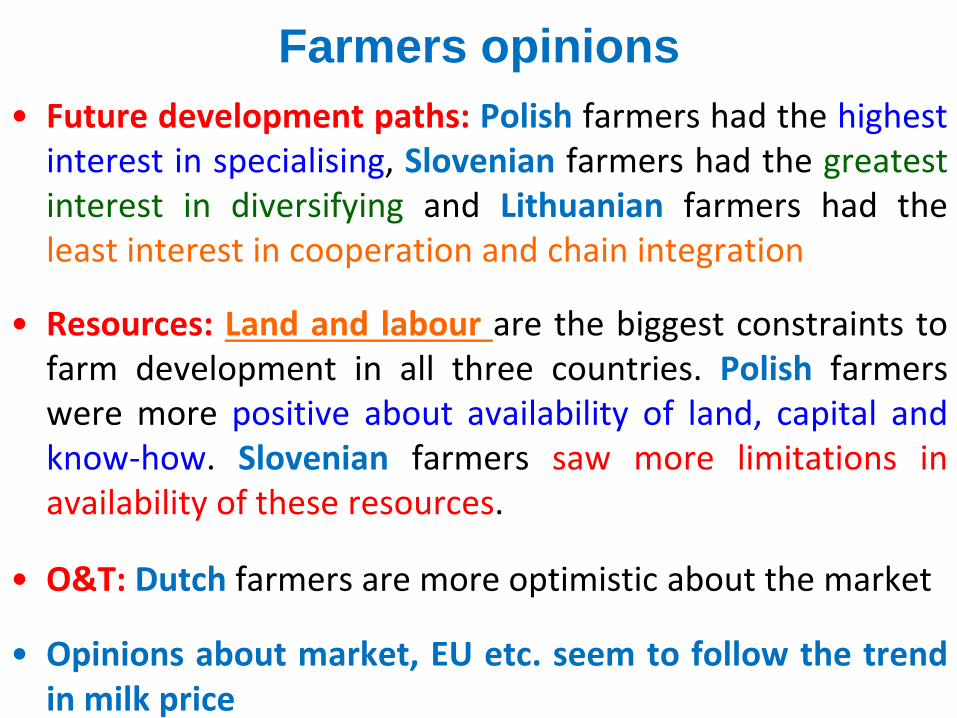
Farmers opinions
• Future development paths: Polish farmers had the highest interest in specialising, Slovenian farmers had the greatest interest in diversifying and Lithuanian farmers had the least interest in cooperation and chain integration
• Resources: Land and labour are the biggest constraints to farm development in all three countries. Polish farmers were more positive about availability of land, capital and know-how. Slovenian farmers saw more limitations in availability of these resources.
• O&T: Dutch farmers are more optimistic about the market
• Opinions about market, EU etc. seem to follow the trend in milk price

Stakeholders study
Netherlands 46
Slovenia 45
Lithuania 40
Poland 30
Total 161
From 8 categories of the sector chain (Ministry, Research, NGO, Extension service, Input suppliers, …)
Questions: low = 1. . . . . . . .high =7
SWOT analysis of dairy sector

Stakeholders opinion: Development paths
Main factors Stakeholders from
Development paths Netherlands Slovenia Lithuania Poland
Expansion/Intensification 5,87 5,46 4,66 5,48
Diversification/Organic 3,52 4,42 4,29 2,67
Wait & See 3,65 3,67 3,75 3,10
Cooperation 5,24 6,07 5,29 4,27

Stakeholders opinion: Resources
Stakeholders from
Resources Netherlands Slovenia Lithuania Poland
Knowhow/Advise 5,69 4,37 5,67 5,09
Subsidies/Credit 4,12 3,88 4,31 4,96
Land 2,39 2,55 2,49 2,82
Labour 4,02 3,43 2,60 3,02

Stakeholders opinion: Opportunities & Threats
Stakeholders from
Opportunities & Threats Netherlands Slovenia Lithuania Poland
Free market 1,26 -1,36 -0,85 0
ICT Tech 2,00 1,57 2,14 1,42
Regulations / Consumer
concern 0,23 -0,20 -0,53 -0,33
Service organisations 1,09 0,56 1,21 0,68
Grazing / Greening 0,33 0,33 -0,12 -0,60
Consumer orientation 0,83 0,31 0,16 0,21
Location Legislation -0,21 -0,66 -0,16 0,30

Stakeholders opinion: Future expectations
Stakeholders from
Netherlands
Slovenia
Lithuania
Poland
Future
expectations 5,50 4,07 3,88 4,53

Stakeholders opinions
• Netherlands stakeholders are more positive about future than Slovenian and Lithuanian farmers; they see many market opportunities;
• Slovenian and Netherlands stakeholders are more positive towards environment than Lithuanian stakeholders
• Netherlands stakeholders are more positive about the input and service providers
• Polish stakeholders are more positive about availability of credits and subsidies
• Slovenian stakeholders are concerned about availability of know-how, and positive towards consumer orientation

Thank you!
