analysis of cleanup obligations and costs for … · analysis of cleanup obligations and costs for...
TRANSCRIPT

Publication Number 03-04-011
If you need this document in alternative format, please call (360) 407-6700 (voice), dial 711, or call (800) 833-6388 (TTY)
Analysis of Cleanup Obligations and Costs for
Hazardous Waste Management Facilities in Washington State—Final Report
January 29, 2003
Prepared for:
Washington Department of Ecology Contract Number C0200264, Subtask 4
Prepared by:
ROSS & ASSOCIATESENVIRONMENTAL CONSULTING, LTD.
Ross & Associates Environmental Consulting, Ltd.
1218 Third Avenue, Suite 1207 Seattle, Washington 98101
(206) 447-1805


Analysis of Cleanup Obligations and Costs for Hazardous Waste Management Facilities in Washington State—Final Report January 29, 2003
Table of Contents
I. Introduction and Background ........................................................................................................... 2 II. Uncertainty of the Inventory and Estimates..................................................................................... 4 III. Hazardous Waste Management Facility Inventory ......................................................................... 5 IV. Case Studies......................................................................................................................................... 8 Amour Fiber Core Inc. (Amour) ........................................................................................................... 9 BEI – Georgetown (a wholly-owned subsidiary of Phillips Services Corporation) ............................. 9 Cameron Yakima, Inc. (CYI)................................................................................................................ 9 CleanCare............................................................................................................................................ 10 Anonymous Site A.............................................................................................................................. 10 Micro Oil (Reflex) .............................................................................................................................. 10 SAFCO Environmental....................................................................................................................... 11 Western Processing............................................................................................................................. 11
Lessons Learned from Case Study Sites ............................................................................................ 11 V. Cleanup Costs.................................................................................................................................... 12
Costs for Cleanup Actions .................................................................................................................. 12 Actual or Estimated Cleanup Costs for Case Studies ......................................................................... 13 Oversight Costs for Cleanup............................................................................................................... 14
Appendices
Appendix A: Hazardous Waste Management Facilities in Washington State Appendix B: Creating the HMWF Inventory Appendix C: Additional Information on Cleanup Cost Research Appendix D: Costs Incurred to Date by Ecology for Oversight of Cleanups of Hazardous Waste
Management Facilities Appendix E: Potentially Responsible Party (PRP) Cost Estimates for Remedial Actions &
Associated Charges at Superfund Sites in Washington Appendix F: Detailed Information on Case Study Facilities

Analysis of Cleanup Obligations and Costs for Hazardous Waste Management Facilities in Washington State—Final Report January 29, 2003
Analysis of Cleanup Obligations and Costs for Hazardous Waste Management Facilities in Washington State—Final Report January 29, 2003 Page 1
Analysis of Cleanup Obligations and Costs for Hazardous Waste Management Facilities in Washington State—Final Report
Executive Summary Reports from publicly available electronic data sets maintained by the Washington State Department of Ecology and the U.S. Environmental Protection Agency were analyzed to identify hazardous waste management facilities and assess the problems, incidents and contamination associated with hazardous waste management facilities in Washington State, with an emphasis on cleanup costs. Electronic data were supplemented by data provided by Ecology staff responsible for overseeing compliance and cleanup of hazardous waste management facilities, interviews with representatives of eight case-study facilities, and independent research on estimates of cleanup costs. Based on this analysis, there are approximately 105 current and former hazardous waste management facilities in Washington State – 66 hazardous waste treatment, storage and disposal facilities, 7 hazardous waste recyclers, 14 used oil processors, 6 facilities that both treat, store or dispose hazardous waste and carry out hazardous waste recycling, 4 facilities that both treat, store or dispose hazardous waste and process used oil, 6 facilities that carry out all three activities, and 2 facilities where the facility-type is not specified. Of these 105 hazardous waste management facilities, the majority, 83 (79%), are identified as having cleanup obligations as evidenced by the fact that current or past cleanup activities are listed in one of the publicly available electronic data sets that we reviewed. There is significant variability in cleanup costs across the facilities on the Inventory. Using data from the 8 case-study facilities, cleanup costs range from $150,000 (Micro Oil) to $118 million (Western Processing). Excluding sites where cleanup costs exceed $50 million, the average cost of cleanup for a hazardous waste management facility is estimated to be $5.1 million, based on an analysis of EPA spending for cleanup at waste handling and disposal facilities listed on the National Priorities List for Superfund cleanup carried out by Resources For the Future in 1999, and $5.2 million based on cost data from the case-study facilities. Costs to the government for overseeing cleanup activities carried out and funded by responsible parties are estimated to be $137,000 per facility, to date, based on data on the 45 hazardous waste management facilities for which oversight cost data was provided. These costs are likely low, given that cleanup, and therefore oversight, is ongoing at the vast majority of facilities. These data and associated analysis represent only a snap-shot in time, taken with the data available to us over the months during which this report was developed. The cleanup status of facilities will change as work progresses, and even the list of facilities may evolve as the universe of waste management sites is better understood. Because of this fluidity, and due to the data limitations discussed above, we emphasize that the Inventory is best used as an indicator of the relative size of the hazardous waste management industry in Washington State and the relative seriousness of the cleanup obligations currently identified for that industry.

Analysis of Cleanup Obligations and Costs for Hazardous Waste Management Facilities in Washington State—Final Report January 29, 2003 Page 2
I. Introduction and Background In 1999 the operators of a western Washington facility used for solvent and antifreeze recycling, used oil processing, and hazardous waste storage abandoned the site, leaving behind over 2000 drums of household hazardous waste and over a million gallons of used oil, contaminated water and sludge, and other solid and hazardous wastes. To date, Washington State and the U.S. Environmental Protection Agency (EPA) have spent more than $4.3 million to remove and manage these wastes safely. Cleanup of contaminated soil and ground water at the site is ongoing, and the full cost of this work is yet unknown. Eventually, waste generators, businesses, local governments, school districts, and other customers who paid to have their hazardous waste properly managed at the facility will likely be called on to reimburse the State and EPA for cleanup costs. This situation occurred despite the fact that the facility was well known to state and federal regulators, and had been issued a Resource Conservation and Recovery Act (RCRA)1 permit to manage hazardous waste. An initial review by the Washington State Department of Ecology (Ecology) indicated that this was not an isolated case, and that, in fact, numerous regulated hazardous waste management facilities around the state require environmental cleanup, sometimes at public expense. In 2001, the Washington State Legislature directed Ecology to examine why hazardous waste management facilities sometimes require cleanup at public expense despite the existence of a longstanding system of technical assistance, regulatory requirements, permits, and enforcement authorities specifically designed to ensure that hazardous wastes are managed safely and that facility owners and operators have adequate resources to address any problems that do occur. In response to the Legislature’s request, Ecology began the Hazardous Waste Management Facilities (HWMF) Initiative. The three goals of the HWMF Initiative are to:
Identify and address gaps in the current permitting and regulatory programs for hazardous waste management and used oil processing facilities.
Seek input from stakeholders. Develop and implement a course of action that assures that services and facilities for the
management of hazardous wastes in Washington are safe and minimize long-term economic and environmental liability.
Ecology was directed to report to the Legislature on the HWMF Initiative in September 2002. To help Ecology develop information necessary to support the HWMF Initiative, Ross & Associates Environmental Consulting, Ltd. (Ross & Associates) was contracted (Washington State of Ecology Contract No. CO200264) to carry out three discrete tasks.
1 The Federal Resource Conservation and Recovery Act (RCRA) established standards for hazardous waste identification, management, and disposal. Ecology has been authorized by EPA to implement the majority of RCRA requirements in lieu of the federal government. Ecology’s implementation of RCRA’s hazardous waste provisions occurs pursuant to the Washington State Dangerous Waste Regulations, Chapter 173-303 Washington Administrative Code.
Analysis of Cleanup Obligations and Costs for Hazardous Waste Management Facilities in Washington State—Final Report January 29, 2003 Page 3
Prepare five- and ten-year forecasts of the types of waste recycling, treatment, and disposal methods and capacities needed to manage hazardous waste generated in Washington State.
Research and analyze the problems, incidents, and contamination associated with hazardous waste management facilities in Washington State and prepare tables to summarize current and past waste management facilities, facility history, release and contaminant information, and cleanup information.
Facilitate a series of focus group meetings on the HWMF Initiative. It is worth noting that Ross & Associates’ work on researching and analyzing hazardous waste management facilities evolved considerably over the course of this project, largely based on limitations in the data available in public data reports. For example, as originally conceived, one of the goals of the project was to distinguish between environmental contamination caused by regulated management of hazardous waste or used oil, and environmental contamination caused by other, un-regulated or less regulated activities (e.g., storage of exempt wastes or exempt recycling). This distinction was not possible to make. For the majority of facilities, the electronic data reports we examined did not include standardized information on sources of contamination that could be used to distinguish between regulated and other activities. Review of facility files for selected sites also yielded little information that could be used to make this distinction.2 Similarly, one of the original goals of the project was to document specific cleanup costs for all facilities with cleanup obligations. This too was impossible to determine for all facilities. Indeed, often regulatory agencies are not privy to detailed (or even general) information on costs for privately funded cleanups. Cleanup costs borne by the state and federal government are tracked and summarized in later sections of this report. In consultation with Ecology, Ross & Associates addressed these data limitations in two ways. First, we undertook a series of brief interviews with representatives of eight of the facilities listed on the inventory and with the facility project staff at Ecology and, when appropriate, at EPA. Although information gathered during the interviews is anecdotal, it gives a sense of the circumstances facility owners and operators face, and their experiences with contamination sources and cleanup costs. We believe this information will be useful in framing future discussions about improvements to hazardous waste management in Washington State. Second, to further refine information on cleanup costs, we conducted independent research on existing, standard estimates of the cost of cleanup, and gathered information on facility-specific costs for sites where Ecology or EPA has paid for cleanup using public funds. This report summarizes Ross & Associates’ work in the second area: researching and analyzing the problems, incidents, and contamination associated with hazardous waste management facilities in Washington State and cleanup costs. The five- and ten-year forecasts will be summarized in a separate document, and the four stakeholder meetings are also summarized separately. A draft of this report was provided to Ecology in July 2002 and Ecology comments were incorporated into this final version.
2 Electronic data sets contained more detailed information on contaminant sources for some facilities, on a site-by-site basis. In addition, it is likely that more in-depth reviews of the technical reports and data in facility files for sites where cleanup is highly documented would allow a distinction to be made between contamination caused by regulated hazardous waste management activities and other activities at many sites. Budget and schedule constraints did not permit us to undertake this type of detailed review. It is also likely that Ecology cleanup project managers know, in a general if not a specific sense, the sources of contamination at sites.
Analysis of Cleanup Obligations and Costs for Hazardous Waste Management Facilities in Washington State—Final Report January 29, 2003 Page 4
II. Uncertainty of the Inventory and Estimates Developing a list of hazardous waste management facilities in Washington State involved review of reports from two data systems, even so, twenty-three facilities identified by Ecology as hazardous waste management facilities (22% of the Inventory) did not appear in the data sets that we reviewed and were added to the facility Inventory at Ecology’s request. While we do not doubt the veracity of these additions (Ecology project managers are undoubtedly the best source of information on the number of hazardous waste management facilities in Washington), they raise concerns about the overall completeness and accuracy of the Inventory. For example, how many facilities were missed because they were not on the “radar screen” of the project manager involved in the Inventory review? Which facilities are inappropriately captured on the Inventory because resources are not available to update the data systems with the most current information or, potentially, to carry out the inspections and other field work necessary to ascertain current information? As data on the Inventory become more specific, they likely become less certain, so that the total number of facilities is likely a more reliable estimate than the break-down of facilities by facility type or the assessment of cleanup obligations. This flows in large part from the lack of standardization in the ways that project managers enter data about facility cleanup status – particularly in the HWIMSY and RCRAInfo systems where numerous data coding options are available. This means that while data on any one individual facility may paint a complete picture, it is difficult to make accurate comparisons across the full range of facilities. This uncertainty was likely exacerbated by our choice (in consultation with Ecology) to use publicly available data reports as the basis for analysis whenever possible, particularly for data on facility cleanup, rather than create special, structured data reports. It is important that the facility Inventory be viewed in light of these limitations, and that any effort to use the Inventory to develop statewide estimates of the total cleanup liabilities at hazardous waste management facilities be appropriately framed by the uncertainties inherent in the analysis. Over time, it may be fruitful for Ecology to examine whether current data systems could be improved or better utilized with existing resources or by obtaining additional resources. This is particularly relevant given that the need to improve the types and amounts of information on waste management facilities available to the public was a recurring theme in the stakeholder focus group meetings, as well as in discussions with facility owners and operators and state and federal staff during the case study interviews. Finally, the Inventory represents only a snapshot in time, taken with the data available to us over the months during which it was developed. The cleanup status of facilities will change as work progresses, and even the list of facilities may evolve as the universe of waste management sites is better understood. Because of this fluidity, and due to the data limitations discussed above, we emphasize that the Inventory is best used as an indicator of the relative size of the hazardous waste management industry in Washington State and the relative seriousness of the cleanup obligations currently identified for that industry.

Analysis of Cleanup Obligations and Costs for Hazardous Waste Management Facilities in Washington State—Final Report January 29, 2003 Page 5
III. Hazardous Waste Management Facility Inventory The facility Inventory lists hazardous waste treatment, storage and disposal facilities, hazardous waste recyclers, and used oil processors (collectively “hazardous waste management facilities” or “HWMF”) and their cleanup status. It was prepared in general using publicly available data sets and systems, and supplemented through review by Ecology staff responsible for overseeing hazardous waste management and cleanup (referred to collectively as “project managers”). The Inventory is summarized here and the methodology for development and analysis of the Inventory are described in Appendix B. The Inventory lists 105 hazardous waste management facilities. It is made up of both waste management facilities that are identified in relevant electronic data sets and reports, and facilities that were identified by Ecology. Ecology also provided notes on facility type and cleanup status for some facilities, both the facilities they identified and facilities identified through electronic data. Because of this approach, we have summarized the Inventory in two ways. The first summary shows the Inventory according to the electronic data sets that we reviewed, the second shows the Inventory incorporating comments by Ecology project managers. It is important not to discount the information provided by Ecology project managers simply because it does not appear in the electronic data systems. The data systems that are used to track facility types are largely populated with information submitted by facility owners and operators, and particularly with respect to facility type it is not uncommon for Ecology and facility owners/operators to have differences of opinion as to the status of a facility. Furthermore, data on cleanup ranking, status, and progress may be updated in the electronic data systems only quarterly or on some other interval, so it is likely that the project managers actually have the most robust and up-to-date understanding of the conditions at each facility.3 Using either approach, the Inventory is comprised largely (65 facilities [62%] based on electronic data; 66 facilities [63%] incorporating Ecology comments) of hazardous waste TSDs. We considered two types of facilities to be TSDs. First, we identified facilities included on the active list of TSDs in Washington State, a list kept by EPA for purposes of identifying facilities subject to inspections. Second, we identified facilities that are on the Washington State Permit Events report, also maintained by EPA. The Permit Events report is a much larger list than the active TSD list and captures facilities that are no longer operating, facilities that may have been brought into the RCRA permitting system due to mismanagement of hazardous waste or other problems, and other facilities that, for one reason or another, were at one time considered for permitting. Because we considered both active and inactive facilities, it is highly likely that some (if not many) of the facilities listed on the Inventory as TSDs are not currently managing hazardous waste. However, using both lists is consistent with Ecology’s instruction to us to develop a comprehensive analysis of all cleanup obligations associated with current and former hazardous waste management facilities. The second category of facilities on the Inventory combines hazardous waste treatment, storage or disposal with used oil processing or hazardous waste recycling or both. Using the electronic data, 8 facilities are considered both a TSD and a hazardous waste recycler, 1 facility is considered a TSD and a used oil processor, and 1 facility (US Navy Bangor Submarine Base) conducts all three activities, for a
3 Twenty-three (22%) facilities were added to the Inventory at Ecology’s request and do not appear in the electronic data as TSDs, used oil processors or hazardous waste recyclers. Ecology provided facility type information for all but three of two of these facilities (Energy Northwest HGP and SAFCO Environmental).
Analysis of Cleanup Obligations and Costs for Hazardous Waste Management Facilities in Washington State—Final Report January 29, 2003 Page 6
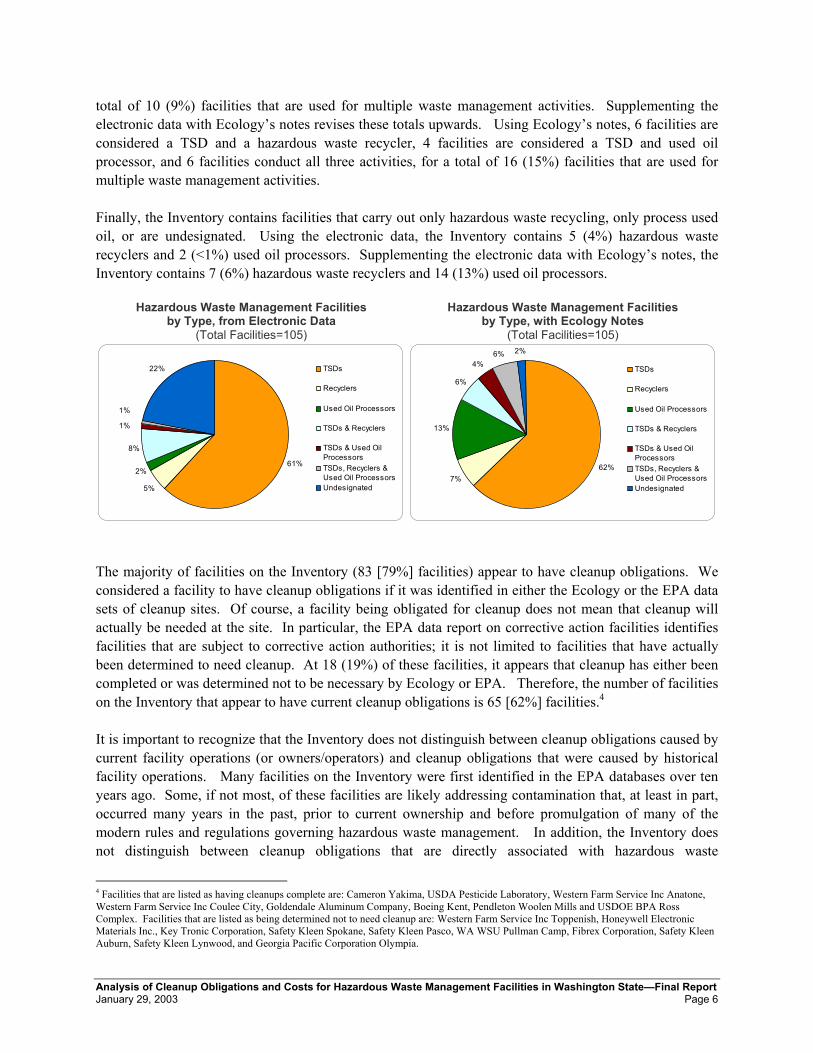
total of 10 (9%) facilities that are used for multiple waste management activities. Supplementing the electronic data with Ecology’s notes revises these totals upwards. Using Ecology’s notes, 6 facilities are considered a TSD and a hazardous waste recycler, 4 facilities are considered a TSD and used oil processor, and 6 facilities conduct all three activities, for a total of 16 (15%) facilities that are used for multiple waste management activities. Finally, the Inventory contains facilities that carry out only hazardous waste recycling, only process used oil, or are undesignated. Using the electronic data, the Inventory contains 5 (4%) hazardous waste recyclers and 2 (<1%) used oil processors. Supplementing the electronic data with Ecology’s notes, the Inventory contains 7 (6%) hazardous waste recyclers and 14 (13%) used oil processors.
Hazardous Waste Management Facilities by Type, from Electronic Data
(Total Facilities=105)
Hazardous Waste Management Facilities by Type, with Ecology Notes
(Total Facilities=105)
The majority of facilities on the Inventory (83 [79%] facilities) appear to have cleanup obligations. We considered a facility to have cleanup obligations if it was identified in either the Ecology or the EPA data sets of cleanup sites. Of course, a facility being obligated for cleanup does not mean that cleanup will actually be needed at the site. In particular, the EPA data report on corrective action facilities identifies facilities that are subject to corrective action authorities; it is not limited to facilities that have actually been determined to need cleanup. At 18 (19%) of these facilities, it appears that cleanup has either been completed or was determined not to be necessary by Ecology or EPA. Therefore, the number of facilities on the Inventory that appear to have current cleanup obligations is 65 [62%] facilities.4 It is important to recognize that the Inventory does not distinguish between cleanup obligations caused by current facility operations (or owners/operators) and cleanup obligations that were caused by historical facility operations. Many facilities on the Inventory were first identified in the EPA databases over ten years ago. Some, if not most, of these facilities are likely addressing contamination that, at least in part, occurred many years in the past, prior to current ownership and before promulgation of many of the modern rules and regulations governing hazardous waste management. In addition, the Inventory does not distinguish between cleanup obligations that are directly associated with hazardous waste
4 Facilities that are listed as having cleanups complete are: Cameron Yakima, USDA Pesticide Laboratory, Western Farm Service Inc Anatone, Western Farm Service Inc Coulee City, Goldendale Aluminum Company, Boeing Kent, Pendleton Woolen Mills and USDOE BPA Ross Complex. Facilities that are listed as being determined not to need cleanup are: Western Farm Service Inc Toppenish, Honeywell Electronic Materials Inc., Key Tronic Corporation, Safety Kleen Spokane, Safety Kleen Pasco, WA WSU Pullman Camp, Fibrex Corporation, Safety Kleen Auburn, Safety Kleen Lynwood, and Georgia Pacific Corporation Olympia.
61%
5%
2%
8%
1%
1%
22% TSDs
Recyclers
Used Oil Processors
TSDs & Recyclers
TSDs & Used OilProcessorsTSDs, Recyclers &Used Oil ProcessorsUndesignated
62%7%
13%
6%
4%6% 2%
TSDs
Recyclers
Used Oil Processors
TSDs & Recyclers
TSDs & Used OilProcessorsTSDs, Recyclers &Used Oil ProcessorsUndesignated
Analysis of Cleanup Obligations and Costs for Hazardous Waste Management Facilities in Washington State—Final Report January 29, 2003 Page 7
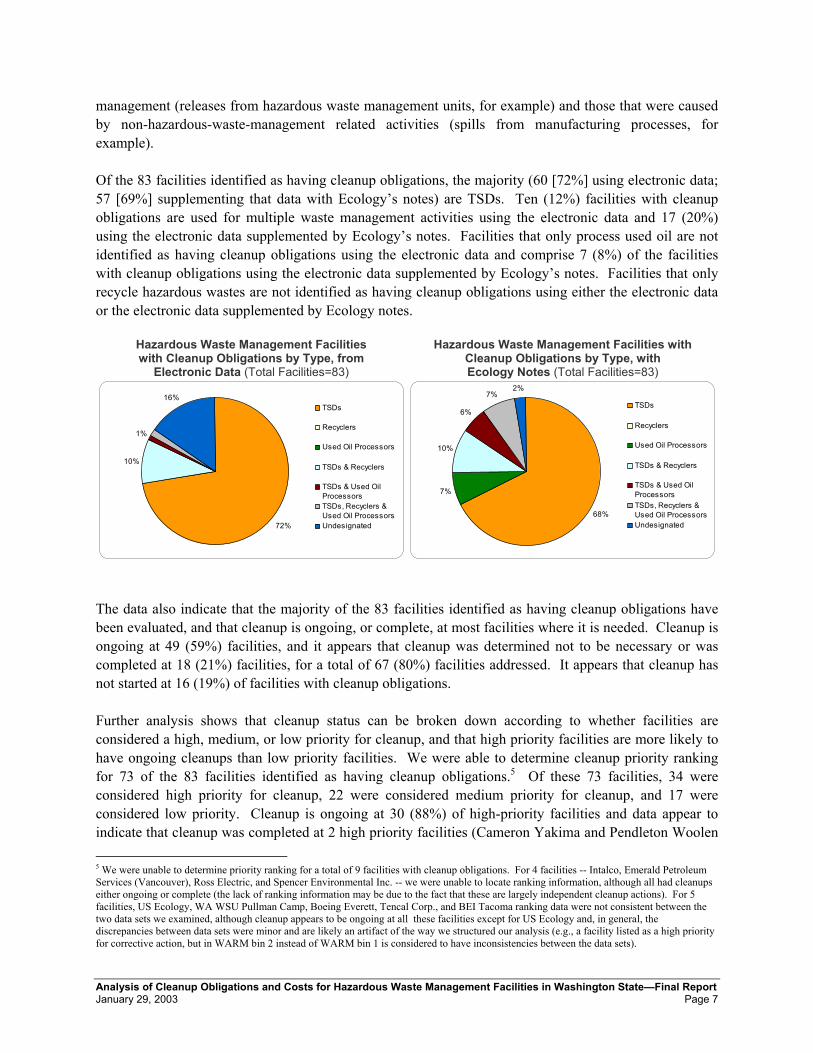
management (releases from hazardous waste management units, for example) and those that were caused by non-hazardous-waste-management related activities (spills from manufacturing processes, for example). Of the 83 facilities identified as having cleanup obligations, the majority (60 [72%] using electronic data; 57 [69%] supplementing that data with Ecology’s notes) are TSDs. Ten (12%) facilities with cleanup obligations are used for multiple waste management activities using the electronic data and 17 (20%) using the electronic data supplemented by Ecology’s notes. Facilities that only process used oil are not identified as having cleanup obligations using the electronic data and comprise 7 (8%) of the facilities with cleanup obligations using the electronic data supplemented by Ecology’s notes. Facilities that only recycle hazardous wastes are not identified as having cleanup obligations using either the electronic data or the electronic data supplemented by Ecology notes.
Hazardous Waste Management Facilities with Cleanup Obligations by Type, from
Electronic Data (Total Facilities=83)
Hazardous Waste Management Facilities with Cleanup Obligations by Type, with Ecology Notes (Total Facilities=83)
The data also indicate that the majority of the 83 facilities identified as having cleanup obligations have been evaluated, and that cleanup is ongoing, or complete, at most facilities where it is needed. Cleanup is ongoing at 49 (59%) facilities, and it appears that cleanup was determined not to be necessary or was completed at 18 (21%) facilities, for a total of 67 (80%) facilities addressed. It appears that cleanup has not started at 16 (19%) of facilities with cleanup obligations. Further analysis shows that cleanup status can be broken down according to whether facilities are considered a high, medium, or low priority for cleanup, and that high priority facilities are more likely to have ongoing cleanups than low priority facilities. We were able to determine cleanup priority ranking for 73 of the 83 facilities identified as having cleanup obligations.5 Of these 73 facilities, 34 were considered high priority for cleanup, 22 were considered medium priority for cleanup, and 17 were considered low priority. Cleanup is ongoing at 30 (88%) of high-priority facilities and data appear to indicate that cleanup was completed at 2 high priority facilities (Cameron Yakima and Pendleton Woolen 5 We were unable to determine priority ranking for a total of 9 facilities with cleanup obligations. For 4 facilities -- Intalco, Emerald Petroleum Services (Vancouver), Ross Electric, and Spencer Environmental Inc. -- we were unable to locate ranking information, although all had cleanups either ongoing or complete (the lack of ranking information may be due to the fact that these are largely independent cleanup actions). For 5 facilities, US Ecology, WA WSU Pullman Camp, Boeing Everett, Tencal Corp., and BEI Tacoma ranking data were not consistent between the two data sets we examined, although cleanup appears to be ongoing at all these facilities except for US Ecology and, in general, the discrepancies between data sets were minor and are likely an artifact of the way we structured our analysis (e.g., a facility listed as a high priority for corrective action, but in WARM bin 2 instead of WARM bin 1 is considered to have inconsistencies between the data sets).
72%
10%
1%
16%TSDs
Recyclers
Used Oil Processors
TSDs & Recyclers
TSDs & Used OilProcessorsTSDs, Recyclers &Used Oil ProcessorsUndesignated
68%
7%
10%
6%
7%2%
TSDs
Recyclers
Used Oil Processors
TSDs & Recyclers
TSDs & Used OilProcessorsTSDs, Recyclers &Used Oil ProcessorsUndesignated

Analysis of Cleanup Obligations and Costs for Hazardous Waste Management Facilities in Washington State—Final Report January 29, 2003 Page 8
Mills), for a total of 32 (94%) high priority facilities addressed. Only 2 high-priority facilities (Washington Chemical Inc. and Framatome ANP Richland Inc.) appear to be awaiting initiation of cleanup.
Cleanup Status of Facilities by Cleanup Priority Ranking
0
10
20
30
40
50
Cleanup Ongoing(Total=49)
Cleanup Not Started(Total=16)
CleanupUnnecessary
(Total=10)
Cleanup Complete(Total=8)
Unspecif ied
Low Priority
Medium Priority
High Priority
No discussion of the Inventory would be complete with out reiterating its temporal nature. It is critically important to recognize that the Inventory is only a snapshot. The cleanup status of facilities will change as work progresses, and even the list of facilities may evolve, as the universe of waste management sites is better understood. We emphasize that the Inventory is best used as an indicator of the relative size of the hazardous waste management industry in Washington State and the relative seriousness of the cleanup obligations currently identified for that industry.6 For detailed information on individual facilities, it is best to turn to the data systems themselves, or, better, to review facility files at the Ecology offices or talk with the Ecology and EPA project managers.
IV. Case Studies To supplement the facility Inventory, Ross & Associates obtained additional information on cleanup at eight facilities through telephone interviews of facility representatives and, where appropriate, Ecology and/or EPA project managers. While the primary objective of the interviews was to gather information regarding actual (or estimated) cleanup costs, secondary objectives included:
Obtain information on the underlying reasons for cleanup. Identify potential solutions to prevent similar situations from arising in the future.
The eight facilities were selected by Ecology as representative of the types of HWMF that tend to require cleanup, as well as meeting criteria about geographic distribution, currency of cleanup activities, and 6 Note that the Inventory reflects only cleanup obligations identified to date in the data sets that we examined. It should not be construed as a statement on any facility’s legal liability for cleanup.
Analysis of Cleanup Obligations and Costs for Hazardous Waste Management Facilities in Washington State—Final Report January 29, 2003 Page 9
availability of cost information. Questions asked during the interviews ranged from the very specific and objective (e.g., amount spent to date on cleanup, source of funds) to more speculative and subjective (e.g., possible preventative measures, barriers to cleanup). Not all facilities had an owner/operator with whom to talk. Where this occurred, the best information available was obtained through interviews with Ecology staff involved with the site (both from the hazardous waste management program and the cleanup program) and sometimes EPA staff who may have been involved in emergency removal operations. In general, the best cost data was available from sites that were still in operation. Of the eight sites included in the study, only two are still in operation. The actual case studies of the eight facilities are included in Appendix F at the end of this report. These case studies provide additional details on site history, operations, enforcement information, and cleanup costs. Below are thumbnail sketches of each site, general cleanup costs, and a summary of common themes and lessons learned. ► Amour Fiber Core Inc. (Amour)
Amour operated as a hazardous waste recycling facility for fiberglass resin. The facility, which closed in 2000, is currently a secured site with over a thousand containers with undetermined contents. EPA initiated an emergency removal of 1000 gallons of Methyl Ethyl Ketone Peroxide (MEKP) in 2001 that has cost about $58,000 to date. Amour had no liability insurance, nor any financial assurances set aside. There is no known source of funds set aside for cleanup. Cost estimates (bids received by owner) for cleanup range from $20,000 to $300,000, depending on the contents of the containers remaining on site.
► BEI – Georgetown (a wholly-owned subsidiary of Phillips Services Corporation)
The Georgetown facility is a hazardous waste storage and treatment facility and a recycling facility for solvents with a lengthy history as an industrial waste site. Years of leaks and spills from historic facility operations (i.e., operations before modern hazardous waste identification and management requirements) have resulted in contaminated soils and groundwater. The entire site has been paved and a stormwater management system installed to ensure containment of future releases. A soil evaporation system has been installed to prevent further contamination and reduce the concentrations in vapors migrating off-site. More than $6 million has been spent to date on cleanup and corrective actions and PSC estimates additional anticipated corrective action work will require another $5.6 million. Cleanup costs have been paid for out of operating proceeds, which will be adequate to complete the cleanup as long as the company (PSC) is still operational. PSC has an irrevocable letter of credit for 100% of the amount of estimated costs as its financial assurance mechanism for remaining cleanup costs and a separate $1.7 million insurance certificate to cover closure costs.
► Cameron Yakima, Inc. (CYI)
Cameron Yakima, Inc. is one of several cleanup sites in the Yakima Railroad Area (YRRA). It was a permitted hazardous waste management facility (TSD) that reclaimed carbon fibers contaminated with organic chemicals. CYI is now closed and the site is a paved vacant lot. All contaminated soils have been removed and a long-term groundwater monitoring system has been installed. Over 200
Analysis of Cleanup Obligations and Costs for Hazardous Waste Management Facilities in Washington State—Final Report January 29, 2003 Page 10
potentially liable parties (PLPS) that had shipped spent carbon to the CYI facility for reclamation contributed $4.5 million to a trust fund to pay for investigation, cleanup, and other remedial actions. Many of these large companies had insurance. Smaller contributors provided staff resources and bottled water to 1,200 homes with affected groundwater at a cost of nearly $180,000. Ecology provided a $6.4 million construction grant to the cities of Yakima and Union Gap to hook these homes up to city water and sewer. As a form of financial assistance, Ecology staff put together a work plan for many of these smaller businesses. CYI itself had only $35,000 set aside as financial assurance to cover the cost of closure, which was used during the closure/cleanup process.
► CleanCare
CleanCare is a former hazardous waste treatment, storage, disposal, and recycling facility located in the Tacoma Tideflats with a 30-year history as a solvent recycling operation and a more recent history as a hazardous waste storage facility and used oil processor. CleanCare closed in 1999 for financial reasons. EPA conducted emergency removal actions at the CleanCare site at a cost of about $4.1 million. CleanCare had $23,000 (of a total $83,000 requirement) set aside in a trust fund to meet its financial assurance requirements for closure. Ecology provided $130,000 in the form of a remedial action grant and for one-time costs related to electrical and security problems at the site. Ecology also continues to pay the monthly utility bills at the site, which range from $600 to $900 per month. Future costs associated with any further cleanup actions are unknown.
► Anonymous Site A
This site, which is still operational and requested confidentiality, is a solvent recycling business that currently collects and recycles/disposes of only waste oils. The responsible parties have completed the investigation phase of cleanup and have interim measures installed and operational. Interim actions have cost $2 million to date. The feasibility study for cleanup is underway and the consultant estimates that the cleanup action plan will cost somewhere between $6 and $14 million. Insurance money has paid for all work to date and should be adequate to complete the cleanup. At this time there is no financial assurance mechanism as the facility is in corrective active. Ecology determines the appropriate amount for financial assurances after the remedial action determinations are complete.
► Micro Oil (Reflex)
Reflex Recycling operated primarily as a 24-hour recycler of specialty solvents used in the printing industry with customers in Washington, Oregon, and California. When discarded, these solvents are classified as hazardous waste. The facility had interim status as a state-only dangerous waste storage facility. Reflex closed in 2001 for financial reasons, including lack of resources to meet closure requirements. Ecology spent $150,000 for an emergency removal and disposal of nearly 250 drums of oily waste. The site is currently fenced and secure, but has not yet gone through proper investigation and cleanup. There was no approved financial instrument in place to fund closure costs. A letter from a consultant to Ecology estimated closure costs at $103,000, but provided no basis for the estimate.

Analysis of Cleanup Obligations and Costs for Hazardous Waste Management Facilities in Washington State—Final Report January 29, 2003 Page 11
► SAFCO Environmental
SAFCO was a hazardous waste recycling and transportation facility that primarily handled waste oil and printing wastes. It was closed by the local fire department as a potential fire hazard following a substantial spill of oily waste in 1992. Ecology issued an emergency enforcement order directing that all materials be removed and disposed of legally. There was neither any financial assurance mechanism nor any source of funds from the owner/operator, who disappeared. A group of 31 PLPs managed the removal and disposal. Best cost estimates received from representatives of the PLP group put the costs between $500,000 and $750,000, but no one could provide exact data due to the age of this case. The site is secured and any remaining cleanup is voluntary.
► Western Processing
Western Processing was an industrial waste recycling and reclamation facility. The company was declared a Superfund (CERCLA) site and closed permanently by court order in 1983. In 2000, after fifteen years of work, EPA, Ecology, and the Western Processing Trust celebrated the conclusion of the active phase of cleanup work. Total costs for this exceeded $100 million (including about $11 million in direct EPA expenditures to date); with final estimated costs of remedial action at $118 million. 190 PRPs established a trust fund to pay for cleanup costs.
Lessons Learned from Case Study Sites The case studies examined three different types of waste management facilities: hazardous waste TSD (treatment, storage, and disposal), recycling facilities, and used oil processors. Each is governed by a different set of regulations and permits, yet some common themes emerged through the information gathering on these eight facilities.
Increased monitoring by state regulators will help to identify potential problems early on and offer prevention and assistance.
Regulators need training in evolving technology and current regulations. Recycling operations and facilities in interim status need to be subject to similar regulations (e.g.,
closure, financial assurance requirements) as hazardous waste units. Financial assurance mechanisms need to be updated and enforced. Coordination among regulatory agencies (state and federal) would help viable operators.
In general, most of those interviewed felt that the appropriate tools exist to regulate these types of facilities and that earlier monitoring and better enforcement–both of which require an increase in staff resources–could help prevent operations from becoming non-compliant. At the same time, they believe there are some regulatory loopholes that could be closed, some mechanisms that could be updated, and some increased level of training and staffing resources that could be provided. Increased costs to facilities will lead to increased costs to generators, which may provide an incentive to explore on-site recycling, which currently is considered too burdensome by many generators. The creation of a strong technical assistance program would be necessary. Additionally, while the idea of recycling wastes into useful products is attractive, the lack of a market for these products may lead to the

Analysis of Cleanup Obligations and Costs for Hazardous Waste Management Facilities in Washington State—Final Report January 29, 2003 Page 12
storage issues that arise and cause problems for some of these facilities (e.g., Amour, SAFCO). Requiring an approved business plan for recycling operations may be a potential solution. Stakeholders echoed many of the lessons learned from the case study facilities during the focus group meetings.
V. Cleanup Costs To derive estimates for the cost of cleanup of hazardous waste management facilities in Washington, Ross & Associates engaged in a three-part research effort.
First, we surveyed federal and state regulatory economic impact analyses, U.S. General Accounting Office reports, EPA studies, and independent research reports produced by nongovernmental agencies to identify general estimates of cleanup costs at typical facilities.
Second, we requested and analyzed site-specific data from EPA Region 10 and Ecology for the cost of cleaning up sites in Washington and costs for oversight of cleanup actions.
Third, we collected data on actual (or estimated) cleanup costs at eight case-study facilities through telephone interviews with facility representatives and, where appropriate, Ecology and/or EPA project managers.
Through this research, Ross & Associates obtained information on two types of expenditures: direct costs borne by private or public entities for implementing cleanup actions, and costs to public agencies for oversight of cleanups implemented by private parties. The results of this research are summarized below and further description of the cost research and analysis is provided in Appendices C–E.
Costs for Cleanup Actions Of the cost estimates that we reviewed, we believe that the best estimates of real, rather than predicted, cleanup costs at hazardous waste management facilities are those derived from Resources for the Future’s (RFF) analysis of actual EPA expenditures for cleanup of Superfund sites listed on the National Priorities List.7 RFF’s analysis includes cleanup cost estimates for specific types of Superfund sites—captive waste handling and disposal facilities, noncaptive waste handling and disposal facilities, recycling facilities, and other types of facilities—except the most expensive, which are known as mega sites.8 Averaging the costs for cleanup of captive and noncaptive waste handling and disposal facilities and recycling facilities and making the conservative assumption that there is only one operable unit—or only one distinct cleanup project—per site, yields a point estimate of approximately $5.1 million for the average cost of cleanup of hazardous waste management facilities.
7 Probst, Katherine N. and David M. Konisky, Superfund’s Future: What Will It Cost? A Report to Congress, Washington: Resources for the Future, 2001. 8 Megasites are sites where cleanup costs are expected to exceed $50 million. RFF conducted a separate analysis for megasites.

Analysis of Cleanup Obligations and Costs for Hazardous Waste Management Facilities in Washington State—Final Report January 29, 2003 Page 13
For comparison, additional point estimates of cleanup costs include the following. Figures were converted to 2002 dollars for comparison purposes, and these estimates are described in further detail in Appendix C.
The average cost of cleanup at RCRA facilities nationwide is about $9.2 million per facility (based on the regulatory impact analysis for the 1993 Corrective Action Rule).
The average cost for cleanup of Superfund NPL sites is about $12 million per operable unit for all sites and about $6 million per operable unit for non-mega sites (based on RFF’s analysis).
The average cost incurred to date by potentially responsible parties for remedial action and associated charges at Superfund sites in Washington is about $27 million per operable unit (based on data provided by EPA Region 10).9
The estimated cost of cleanup is about $33 million for a landfill and about $2.8 million for a petroleum-contaminated site in Washington (based on the 1990 economic impact analysis prepared for the Model Toxics Control Act).
Actual or Estimated Cleanup Costs for Case Studies Through telephone interviews, Ross & Associates gathered information on actual or estimated cleanup costs for the eight case-study facilities. This included information on costs incurred to date for cleanup by facility owners, EPA, and Ecology, as well as estimated additional costs to complete cleanup for facilities currently undergoing cleanup. The results of this cost research on actual and expected cleanup costs for the case studies and Ecology’s oversight costs for the case studies are summarized in the following table. Costs incurred to date for cleanup of the case-study facilities ranged from $150,000 to $118 million. Low estimates of the total costs of cleanup (at the completion of cleanup) averaged $19 million for all case-study facilities and averaged $5.1 million for all the facilities except Western Processing, which had costs far greater than the other facilities.10 The latter figure matches the conservative cost estimate of $5.1 million for cleanup of hazardous waste management facilities11 that we derived from the RFF analysis of costs of Superfund site cleanups (see above).
9 This average is based on data for only 12 sites that, as federal Superfund sites, are not necessarily typical of the facilities in the HWMF inventory. Several of these sites may be considered mega sites, with total cleanup costs in excess of $50 million. 10 Where a range of costs were provided for estimated future costs, the low estimates were used to calculate total cleanup costs. For SAFCO Environmental, which had a range of figures for actual cleanup costs incurred, the average of this range was used in calculating average costs for all the facilities. 11 Our estimate assumed one operable unit per facility.

Analysis of Cleanup Obligations and Costs for Hazardous Waste Management Facilities in Washington State—Final Report January 29, 2003 Page 14
Summary of Cost Information for Case Studies Cleanup Costs to date
Facility Name Owner EPA Ecology
Estimated Costs to Complete Cleanup
Total Cleanup
Costs (Low Estimates)
Oversight Costs to
Date Total Costs
Amour ~$125,000 $58,000 $20,000 – $300,000 $218,000 $23,000 $241,000
BEI - Georgetown $5.9 million $60,000 $5.6 million (owner) $25,000 (EPA)
$12 million $47,000 $12 million
Cameron Yakima $2.7 million $6.4 million $2 million $11 million $226,000 $11 million
Clean Care $23,000 $4.3 million $130,000 Unknown $4.5 million $111,000 $4.6 million
Anonymous Site A $2 million $6-14 million $8.0 million $240,000 $8.2 million
Micro Oil (Reflex) $150,000 Unknown $150,000 $256,000 $406,000
SAFCO Environmental
$500,000 – 750,000
No further cleanup required
$500,000 – 750,000 Not Available $500,000 –
750,000
Western Processing $107 million $11 million $118 million $444,000 (Ecology); $1.4 million (EPA)
$120 million
Oversight Costs for Cleanup Ecology provided data on the costs it has incurred to date for salaries, benefits, goods, services, and other charges for the oversight of cleanups at 45 of the facilities in the hazardous waste management facilities inventory (see Appendix D). This included data for oversight of seven of the eight case-study facilities. Since the data provided represent oversight costs incurred to date rather than the total costs for Ecology’s oversight of cleanups at these facilities, they represent low estimates of oversight costs for those facilities. However, in considering whether and how Ecology’s oversight costs might be extrapolated, it is important to note that it is not known whether the facilities in the HWMF inventory for which Ecology was not able to provide cost data (nearly half of the inventory) differ significantly in the amount and cost of oversight required from the facilities for which Ecology provided data. The average cost incurred to date by Ecology for oversight was about $125,000 for all 45 facilities with available cost data and about $192,000—or 54% more than average—for the seven case-study facilities with available cost data. Oversight costs incurred to date for all facilities ranged from zero dollars for four facilities to about $814,000 for the U.S. Navy Bangor Submarine Base. If we exclude the four facilities with zero reported oversight charges, the average cost of Ecology’s oversight of cleanups at hazardous waste management facilities would increase to about $137,000.
Analysis of Cleanup Obligations and Costs for Hazardous Waste Management Facilities in Washington State—Final Report January 29, 2003
APPENDIX A
Hazardous Waste Management Facilities in Washington State

Analysis of Cleanup Obligations and Costs for Hazardous Waste Management Facilities in Washington State—Final Report January 29, 2003
Analysis of Cleanup Obligations and Costs for Hazardous Waste Management Facilities in Washington State—Final Report January 29, 2003
APPENDIX B
Creating the HMWF Inventory

Analysis of Cleanup Obligations and Costs for Hazardous Waste Management Facilities in Washington State—Final Report January 29, 2003

Analysis of Cleanup Obligations and Costs for Hazardous Waste Management Facilities in Washington State—Final Report January 29, 2003 B–1
Appendix B— Creating the HWMF Inventory
Developing the list of waste management facilities The list of waste management facilities was drawn largely from the Hazardous Waste Information Management System (HWIMSY) developed and maintained by Ecology to track dangerous waste generations and management in Washington State and RCRAInfo, a management and inventory system of hazardous waste handlers developed and maintained by the U.S. Environmental Protection Agency (EPA). In general, all generators, transporters, treaters, storers, and disposers of hazardous waste12 are required to provide information about these activities to state environmental agencies, which pass on the information to regional and national EPA offices. Thus, information in the RCRAInfo system is heavily populated with data from the state system (HWIMSY), provided initially by facility owners and operators. The Inventory began with a working list of 23 facilities that Ecology provided at the onset of the contract and a supplemental list of 51 facilities that Ecology provided on April 15, 2002. Ross & Associates augmented the Ecology working lists using three data sources:
Hazardous waste treatment, storage or disposal facilities were added based on the Active Treatment, Storage and Disposal Facility Report (dated 4/15/02), published by EPA Region 10, using data from HWIMSY. This report lists 39 facilities. Hazardous waste treatment, storage and disposal facilities make up the majority of the inventory.
Used oil processors were added based on a report of facilities that have notified Ecology that they manage used oil (dated 5/6/02), provided by Ecology using data from HWIMSY.
Hazardous waste recyclers were added based on a report of facilities that have notified Ecology that they conduct immediate recycling (dated 5/17/02), provided by Ecology using data from HWIMSY.
This resulted in a draft inventory of 82 facilities, provided to Ecology on 05/13/02. The draft inventory was then checked for completeness and accuracy in two ways. First, Ross & Associates checked the inventory against a list of all facilities for which any “permit event” codes had been entered into the RCRAInfo database. (Again, because RCRAInfo is largely populated with data from HWIMSY, it includes codes entered into the state data system.) Because permits are required for any hazardous waste treatment, storage and disposal, a “permit event” code is an indication that a facility may be treating, storing or disposing of hazardous waste or may have treated, stored, or disposed of hazardous waste in the past. The list of facilities with permit events is much larger than the active treatment, storage and disposal facility list because it captures facilities that are no longer operating and facilities that are in the process of closing, or ceasing to manage hazardous waste. There were 68 facilities on the permit events list that were not on the draft Inventory.
12 Significant exemptions include household hazardous waste and waste produced by conditionally exempt small quantity generators, that is, in general, generators of less than 220 pounds of hazardous waste per month or per batch.

Analysis of Cleanup Obligations and Costs for Hazardous Waste Management Facilities in Washington State—Final Report January 29, 2003 B–2
Second, Ecology project managers reviewed the 82 facilities on the draft Inventory and the 68 candidate facilities from the permit events list and added and deleted facilities based on the following criteria:
Add commercial hazardous waste TSDs, commercial immediate hazardous waste recyclers, and used oil processors;
Add facilities with current or previous permit (interim or final status) for non-commercial hazardous waste treatment or storage (this action was intended to capture facilities that are intentionally managing hazardous waste.);
Delete generators conducting on-site treatment or recycling under allowable exemptions from permitting such as the exemptions for treatment-by-generator, permit-by-rule, or recycling;
Delete generators who were identified as land disposal facilities to bring them into the RCRA corrective action universe because of soil or ground water contamination from sloppy operational practices; and
Delete protective filers, or facilities that filed Part A of the hazardous waste permit notification but did not actually treat, store or dispose of hazardous waste.
This analysis resulted in the final Inventory of 105 facilities. Note that it is not surprising (nor does it necessarily reflect a failure of the data systems) that Ecology would identify a number of facilities not identified in the electronic data sources for addition to the Inventory. The data sources that we used to create the Inventory are populated largely with data submitted by facility owners and operators. This is particularly true with respect to identifying the regulatory status of a facility (i.e., identifying whether a facility is a TSD, recycler or used oil processor). It is not uncommon for Ecology and facility owners/operators to disagree about the regulatory status of a facility, or for facility owners/operators to fail to properly file the notification paperwork used to enter facilities into the electronic data systems. For purposes of categorizing facilities as TSDs, hazardous waste recyclers or used oil processors, Ross & Associates grouped all facilities that were on either the Active Treatment Storage and Disposal Facility Report or the Permit Events report as TSDs. Facilities were identified as used oil processors or hazardous waste recyclers based on data reports from HWIMSY, provided by Ecology as described above.
Developing the information on facilities’ cleanup status As we were developing the Inventory of hazardous waste management facilities, Ross & Associates was also examining existing, publicly available data sets and systems to ascertain the cleanup status of each facility on the Inventory. For information on cleanup status, we relied on two data sources:
The Model Toxics Control Act (MTCA) Confirmed and Suspected Contaminated Sites (CSCS) report (dated 5/29/02 and published by Ecology) that lists sites identified as needing cleanup under MTCA; and
The U.S. EPA Region 10 Corrective Action Events Report (dated 4/15/02 and published by EPA Region 10), which is based on data in RCRAInfo (again largely populated with data from
Analysis of Cleanup Obligations and Costs for Hazardous Waste Management Facilities in Washington State—Final Report January 29, 2003 B–3
HWIMSY) and lists hazardous waste treatment, storage and disposal facilities and other facilities that are undergoing cleanup pursuant to RCRA authorities and information on cleanup activities.
Determining facility cleanup status with any level of specificity proved very difficult. Key data limitations included the following:
Identifying facilities: because the CSCS report is not focused on hazardous waste management facilities, in general, it does not list facilities by their unique RCRA identification number – instead it is organized by facility name and address. This presents difficulties because facility names change over time. To address this we checked for facilities on the CSCS report using current and, when known, former facility names and using address information; however, there is still the potential that some facilities were missed. During their review, Ecology also checked facilities using their unique Ecology identification number (the “facility/site” number), which is not listed in the publicly available data reports, but is available from Ecology upon request.
Date currency: the RCRA Corrective Action Events Report includes numerous data points for a facility; however the data often seems out of date. For many facilities the most recent date points listed in the system were years, sometimes decades old. Data currency was also a problem in the CSCS report. For example, some sites were listed as “ranked, awaiting remedial action” when Ecology project managers reported that remedial actions were, in fact, ongoing. While this created difficulties for creating the Inventory, it is not surprising, nor does it necessarily represent a failure of the data systems, which are currently designed to be updated quarterly, or on another schedule, rather than on a real-time basis.
Consistency between the data systems and data completeness: in some cases, the two data systems did not agree on the cleanup status of a facility. In other cases, information on cleanup status reported by Ecology project managers was missing from the data reports. In a few cases, entire facilities reported by Ecology project managers as undergoing cleanup were missing from the data sets.
Ross & Associates focused on accurately recording cleanup status information for each facility from each data set, and did not attempt to reconcile inconsistencies between the two data systems. It is important to recognize the Inventory is most useful as an indicator of the relative size of the hazardous waste management industry in Washington State and the relative magnitude of associated cleanup obligations. The Inventory is likely much less reliable with respect to information on the details of cleanup obligations (or cleanup progress) at any particular facility. To assist Ecology in using the Inventory and to supplement information in the data systems, we included any additional anecdotal information on facility cleanup status available to us in a notes column. For example, through our facility case studies, we identified additional information on cleanup status that we listed in the notes column. In other cases, Ecology project managers provided information when they reviewed the draft Inventory. This information is strictly anecdotal and Ross & Associates did not conduct an independent review of the information or attempt to verify it. Our analysis of the CSCS report and RCRA Corrective Action Events Report is discussed below.
Analysis of Cleanup Obligations and Costs for Hazardous Waste Management Facilities in Washington State—Final Report January 29, 2003 B–4
The CSCS Report In analyzing the CSCS report, Ross & Associates first checked for each facility on the inventory using current and (if known) former facility names and facility addresses. This resulted in information on 53 facilities.13 Facilities that are listed in the CSCS report have a “yes” in the “CSCS Report” column on the inventory. Facilities that are not listed have a “no” in the CSCS report column. For each facility listed in the CSCS report, we then recorded the cleanup status listed. The CSCS report lists cleanup status in eight ways:
Awaiting Site Hazard Assessment Ranked, Awaiting Remedial Action Remedial Action in progress Independent Remedial Action Construction Completed, Operation & Maintenance Underway Remedial Action Completed, Conformational Monitoring Underway Remedial Action Completed, Residual Contamination Left On Site, On-going Institutional
Controls Required Remedial Action and all activities completed
If a facility was identified as ranked according to the state cleanup prioritization system, we also listed its ranking number.14 If a facility was identified as being in the voluntary cleanup program, we also listed its voluntary cleanup program status.
The RCRA Corrective Action Events Report In analyzing the RCRA Corrective Action Events Report, Ross & Associates used the unique RCRA facility identification number to locate facility listings. This resulted in listings for 71 facilities. Facilities that are listed in the RCRA Corrective Action Events Report have a “yes” in the “Corrective Action Report” column on the inventory. Facilities that are not listed have a “no” in the Corrective Action Report column. The data system from which the RCRA Corrective Action Events Report is drawn makes hundreds of data codes available to project managers. There seems to be a great diversity of approaches to recording facility data. Not all codes are used for each facility, and not all project managers use the same codes. Given this diversity, our next step was to conduct an overall review of available data to devise a standard system to record facility-specific cleanup information. After reviewing the data, we decided to list four data points for each facility. First, we listed the corrective action prioritization ranking, if available. RCRA corrective action sites are ranked as a high, medium, or low priority for cleanup. Second, we listed the corrective action imposition codes, if available. The corrective action imposition codes identified the enforcement or other authority under which cleanup requirements were imposed at the facility and, generally, the date that cleanup requirements were imposed. Third, we listed the most recent data points entered in the system with an
13 Note that even with this cross-checking, the CSCS report does not have listings for many of the facilities on the inventory. We believe this is because the majority of facilities on the inventory are being cleaned up using RCRA cleanup authorities, rather than MTCA, as one would expect. 14 The Washington Ranking Method (WARM) assigns facilities a numeric ranking between 1 and 5, with facilities ranked as 1 being the highest priority for cleanup.
Analysis of Cleanup Obligations and Costs for Hazardous Waste Management Facilities in Washington State—Final Report January 29, 2003 B–5
emphasis on major cleanup milestones such as completion of a RCRA Facility Investigation. Finally, we listed the facilities’ status with respect to the corrective action environmental indicators, if available.
Cleanup Status Using a combination of CSCS and RCRA Corrective Action Events Report data, we developed a cleanup status for each facility on the Inventory. We divided cleanup status into three categories:
Cleanup ongoing, Cleanup determined unnecessary or complete, and Cleanup not yet started.
If either the CSCS report or the RCRA Corrective Action Events Report indicated any cleanup activity, we considered cleanup to be “ongoing” for that facility. Cleanup appears to be ongoing for the majority of the facilities that were identified as having cleanup obligations (49 facilities). Cleanup appears to be ongoing for: Bay Zinc, L Bar Site Northwest Alloys, Lehigh Portland Cement Co., Pasco NPL Site, USAF Fairchild AFB, Van Waters and Rogers Inc. (Spokane), British Petroleum (Arco Petroleum Cherry Point), Kaiser Aluminum Mead Works, Puget Sound Refining, Tesoro Northwest Co, Tosco Refining Co., US Dept. of Energy (Hanford), BEI Georgetown, BEI Kent, BEI Pier 91, Boeing (Auburn), Boeing (Everett), Boeing (Renton), Boeing A&M Developmental Center, Boeing Plant 2, BSB Diversified, Emerald Petroleum Services (Seattle), First Recovery Anacortes, LIDCO, Rhodia Inc., SAFCO Environmental, Tecnal Corp, ToxGon, US Navy (Keyport), US Navy (PSNS Bremerton), US Navy Bangor Submarine Base, Vopak USA Inc., Western Processing, BEI Tacoma, BEI Washougal, Clean Care, Disclaimer Trust of John J. O’Connell, Emerald Petroleum Services (Vancouver), Emerald Services (Tacoma), Lilyblad Petroleum, Noveon Kalama, Petroleum Reclaiming Service, Pioneer Americas, Reichold Chemical, Ross Electric, Spencer Environmental Inc., US Army Ft. Lewis, US Navy (Indian Island), and UW Tacoma Branch Campus. We considered cleanup complete when both data systems agreed that cleanup was finished. This appears to be true for eight facilities on the inventory: Cameron Yakima, USDA Pesticide Laboratory, Western Farm Service Inc Anatone, Western Farm Service Inc Coulee City, Intalco Aluminum Corp., Boeing (Kent), Pendleton Woolen Mills, and US DOE BPA Ross Complex. We considered cleanup to be determined unnecessary when the RCRA Corrective Action Events Report indicated either that the corrective action process had been terminated, or that a RCRA facility investigation (RFI) is not necessary. This was true for ten facilities on the Inventory: Western Farm Service Inc. Toppenish, Honeywell Electronic Materials Inc., Key Tronic Corporation, Safety Kleen Spokane, Safety Kleen Pasco, WSU Pullman Camp, Fibrex Corporation, Safety Kleen Auburn, Safety Kleen Lynnwood, and Georgia Pacific Corporation Olympia Container. We considered cleanup to not yet be started when either of the data systems showed that the facility has cleanup obligations and neither of the data systems indicated any cleanup activity. (As discussed above, when either data system indicated cleanup activity, we considered cleanup to be ongoing.) It appears that cleanup has not yet begun at 16 facilities: Energy Northwest Columbia Generating, US Army Yakima Training Center, US Ecology, Frontier Machinery, Washington Chemical, Kaiser Trentwood, Energy Northwest HGP, Framatome ANP Richland Inc., Boeing D & SG MFC Site, ESPRI Inc., Marine Vacuum

Analysis of Cleanup Obligations and Costs for Hazardous Waste Management Facilities in Washington State—Final Report January 29, 2003 B–6
Service, Airo Services, Fuel Processors, Micro Oil (Reflex), Orting Industrial Lubricants, and USAF McChord. Of the 105 facilities on the Inventory, 25 were not identified as having cleanup obligations. These facilities are: Applied Process Engineering Lab, ECCO Inc., Crown Cork and Seal Co., Hewlett Packard Co. Liberty Lake, Northwest Recycling Service, Goldendale Aluminum, ATG Richland, Amour Fiber Core, Basin Oil Co., Ecolights Northwest, Hallmark Precious Metals, Inc., Total Reclaim, US Navy Camp Wesley Harris Reservation, Arrcom Oil, McClary Columbia Corp., Phoenix Environmental Services, Port of Gray’s Harbor, Ross Electric Logan Hill, SQG Specialists, US Navy Marine & Reserve Center, Waste Disposal Inc. 99th Street, and Waste Disposal Inc., Lakeview Ave.
Cleanup Priority We also used the combination of CSCS and RCRA Corrective Action Events Report data to ascertain the relative cleanup priority of each facility on the Inventory. The RCRA Corrective Action Events Report divides facilities into high, medium and low priorities for cleanup. The CSCS report records the relative risk of a site using the Washington Ranking Method (WARM). WARM assigns a relative cleanup priority ranking of 1 through 5, based on risk and other factors, with facilities ranked 1 being the highest priority for cleanup. We considered a facility a high priority for cleanup if it was listed as a high priority in the RCRA Corrective Action Events Report and/or if it was assigned a WARM ranking of 1. We also considered any facility listed on the Superfund National Priorities List to be a high priority for cleanup, regardless of any other listing. We considered a facility a medium priority for cleanup if it was listed as a medium priority in the RCRA Corrective Action Events report and/or if it was assigned a WARM ranking of 2 or 3. We considered a facility a low priority for cleanup if it was listed as a low priority in the RCRA Corrective Action Events report or if it was assigned a WARM ranking of 4 or 5. Using this approach, we were able to determine the cleanup priority for 73 of the 83 facilities identified as having cleanup obligations. Of these 73 facilities, 34 were considered high priority for cleanup, 22 were considered medium priority for cleanup, and 17 were considered low priority.
Cleanup Priority Ranking Information Available High Medium Low
Bay Zinc Cameron Yakima, Inc. Pasco NPL Site (Landfill) USAF Fairchild AFB Van Waters & Rogers, Inc. (Spokane) Washington Chemical, Inc. Kaiser Aluminum Mead Works Puget Sound Refining Tosco Refining (Ferndale) Framatome ANP (Richland) US Dept of Energy (Hanford) BEI – Georgetown BEI – Pier 91 Boeing Company Renton
Energy NW Columbia Generating US Army Yakima Training Center Lehigh Portland Cement Co. Safety Kleen (Spokane) British Petroleum Cherry Point Kaiser Aluminum (Trentwood) Tesoro Northwest Co. Energy Northwest HGP BEI (PSC) – Kent Boeing Company Auburn Boeing Company Kent Boeing D&SG MFC Site BSB Diversified Marine Vacuum Service
USDA Pesticide Laboratory Western Farm Service (Toppenish) Frontier Machinery Honeywell Electronic Materials Inc. Key Tronic Corporation L Bar Site Safety Kleen (Pasco) Western Farm Service (Anatone) Western Farm Service (Coulee City) ESPRI Inc. Fibrex Corporation SAFCO Environmental Vopak USA Inc. Airo Services

Analysis of Cleanup Obligations and Costs for Hazardous Waste Management Facilities in Washington State—Final Report January 29, 2003 B–7
High Medium Low Boeing A&M Developmental Center Boeing Plant 2 Emerald Petroleum Service (Seattle) LIDCO Rhodia Inc. ToxGon US Navy – Keyport US Navy – PSNS Bremerton US Navy Bangor Submarine Base Western Processing BEI – Washougal CleanCare Disclaimer Trust of John O’Connell Lilyblad Petroleum, Inc. Noveon Kalama, Inc. Pendleton Woolen Mills Pioneer Americas Reichhold Chemical US Army – Fort Lewis US Navy – Indian Island
Safety Kleen (Auburn) Safety Kleen (Lynnwood) Emerald Services (Tacoma) Fuel Processors Micro Oil (Reflex) Petroleum Reclaiming Service USAF – McChord UW Tacoma Branch Campus
Georgia Pacific Corp (Olympia) Orting Industrial Lubricants US DOE BPA Ross Complex
For 5 facilities, Intalco Aluminum Corp, Fibrex Corporation, Emerald Petroleum Services Vancouver, Ross Electric, and Spencer Environmental Inc., neither the CSCS report nor the RCRA Corrective Action report contained ranking information, although all either have ongoing cleanups or cleanups determined complete (Intalco Aluminum Corp.). For 5 facilities, US Ecology, WSU Pullman Camp, Boeing Everett, Tencal Corp., and BEI Tacoma ranking data were not consistent between the two data sets we examined, although cleanup appears to be ongoing or determined not needed (WSU Pullman Camp.) at all but US Ecology.

Analysis of Cleanup Obligations and Costs for Hazardous Waste Management Facilities in Washington State—Final Report January 29, 2003 B–8
Analysis of Cleanup Obligations and Costs for Hazardous Waste Management Facilities in Washington State—Final Report January 29, 2003
APPENDIX C
Additional Information on Cleanup Cost Research

Analysis of Cleanup Obligations and Costs for Hazardous Waste Management Facilities in Washington State—Final Report January 29, 2003

Analysis of Cleanup Obligations and Costs for Hazardous Waste Management Facilities in Washington State—Final Report January 29, 2003 C–1
Appendix C— Additional Information on Cleanup Cost Research
This section describes in further detail research on general estimates of cleanup costs. Along with the interviews with case-study operators and EPA and Ecology staff, Ross & Associates conducted this research in order to derive an estimate of total cleanup costs for hazardous waste management facilities in Washington since those data were not easily obtainable directly. This research involved:
A survey of federal and state regulatory economic impact analyses, U.S. General Accounting Office reports, EPA studies, and independent research reports produced by nongovernmental agencies to identify general estimates of cleanup costs at typical facilities.
An analysis of site-specific data from EPA Region 10 and Ecology for the cost of cleanup and oversight of cleanup at sites in Washington.
Through this research, Ross & Associates obtained general estimates of cleanup costs for Superfund sites and Resource Conservation and Recovery Act (RCRA) facilities nationwide, general estimates on cleanup costs for certain types of facilities subject to MTCA, site-specific estimates of cleanup costs at Washington Superfund sites, and site-specific data on Ecology’s oversight costs for 45 facilities in the inventory.
Superfund Sites The average cost of remedial action at sites on the Superfund National Priorities List (NPL) is $11 million per operable unit15 in 1999 dollars ($12 million in current dollars), according to the non-profit research institute Resources for the Future’s (RFF) analysis of EPA expenditures for sites it cleaned up directly (Fund-lead sites). This average is weighted by the existence of certain sites with particularly high cleanup costs. The average cost of remedial action at mega sites, which have or are expected to have total removal and remedial action costs of $50 million or more, is $30 million per operable unit ($33 million in current dollars). By comparison, the average remedial action cost for non-mega sites is roughly $6 million per operable unit. 16 RFF also estimated average remedial action costs for non-mega sites for several different types of sites. Of most relevance for the Hazardous Waste Facilities Initiative are cost estimates for the following three types of sites:
Recycling sites, which include waste oil recycling facilities, former drum reconditioning facilities, battery-recycling facilities, and all other recycling facilities.
15 An operable unit is a distinct cleanup project within a cleanup site. On average, there are approximately 1.8 operable units at each Superfund NPL site. 16 Probst, Katherine N. and David M. Konisky, Superfund’s Future: What Will It Cost? A Report to Congress, (Washington: Resources for the Future, 2001) 45.

Analysis of Cleanup Obligations and Costs for Hazardous Waste Management Facilities in Washington State—Final Report January 29, 2003 C–2
Captive waste handling and disposal sites, which are private facilities that accept industrial and hazardous waste for management and disposal but not on a fee-for-service basis (e.g., captive industrial landfills and captive industrial waste management facilities).
Noncaptive waste handling and disposal sites, which are public or private facilities that accept municipal, industrial, and/or hazardous waste on a fee-for-service basis for management and disposal (e.g., municipal or commercial landfills and waste management facilities).
The average remedial action cost for noncaptive waste handling and disposal sites, $5.9 million per operable unit ($6.4 million in current dollars), is similar to the average remedial action cost for all types of non-mega sites. Remedial action costs are lower than average for the other two types of sites, however. Remedial actions at recycling sites cost an average of $4.4 million per operable unit ($4.8 million in current dollars), while remedial actions at captive waste handling and disposal sites cost an average of $3.7 million per operable unit ($4.0 million in current dollars).17
Cleanup Costs for Superfund Sites in Washington EPA Region 10 provided data on EPA and potentially responsible party (PRP) estimates of cleanup costs for Superfund sites in Washington. Costs of remedial actions at these sites were not separated from other costs—such as costs for remedial investigations and feasibility studies—for particular consent decrees or administrative orders. These data include costs EPA has already incurred and expects to recover from PRPs for the sites, as well as estimates of total expected costs for PRP actions, but not costs for Fund-lead actions that EPA does not expect to cost recover from PRPs. In the data provided by EPA, twelve sites, representing 25 different operable units, had PRP cost estimates for remedial actions and associated charges. (Costs for removal actions, which are initial cleanup actions to address short-term risks, were not analyzed for this report.) PRP costs for remedial actions and associated charges at these sites ranged from about $5.4 million for the Northwest Transformer site to over $298 million for the Commencement Bay Near Shore/Tide Flats site (see table on PRP cost estimates for Washington Superfund sites). For Washington Superfund sites, the average estimated cost for PRPs for remedial actions and associated charges was about $27 million per operable unit and about $56 million per site. Excluding the four sites with total PRP costs above $50 million reduces the average cost to about $14 million per operable unit for the sites. Though including more than simply remedial action costs, these average figures for Washington Superfund sites are considerably higher than the national estimates derived by RFF of average remedial action costs of $11 million per operable unit for all sites and $6 million per operable unit for “non-mega” sites.
Resource Conservation and Recovery Act Sites In the regulatory impact analysis completed for the 1993 Corrective Action Rule, the average cost of RCRA corrective action was estimated to be $7.2 million per facility and $1.1 million per solid waste management unit in 1992 dollars (or $9.2 million and $1.4 million, respectively, in current dollars).18
17 Probst and Konisky, 47. 18 U.S. Environmental Protection Agency, Office of Solid Waste, “Draft Regulatory Impact Analysis for the Final Rulemaking on Corrective Action for Solid Waste Management Units,” March 23, 1993.

Analysis of Cleanup Obligations and Costs for Hazardous Waste Management Facilities in Washington State—Final Report January 29, 2003 C–3
This analysis was based on a sample of 79 federal and non-federal facilities subject to corrective action, excluding very large federal facilities. A few of the facilities in the sample, however, incurred a large portion of the total costs estimated for corrective action; slightly more than ten percent of the facilities accounted for roughly half of the total corrective action costs. Costs for nine very large federal facilities subject to both RCRA and Superfund were estimated separately in the regulatory impact analysis by the agencies managing the sites, the Departments of Energy and Defense. Preliminary cost estimates for these facilities, which were incomplete and therefore likely under estimated, ranged from about $211 million to over $2 billion, with an average of $995 million in cleanup costs. A more recent EPA study on the implementation of the RCRA Corrective Action Program offers additional information on approximate costs of corrective action at RCRA facilities.19 EPA identified a statistically representative sample of hazardous waste management facilities that had selected a final remedy and/or implemented stabilization measures and conducted a survey of EPA regional and/or state regulators overseeing corrective action at those sample facilities in 1997. Regulators for 65 facilities completed the questionnaire, which included questions asking respondents to identify applicable cost ranges (e.g., less than $1 million or over $50 million) for cleanup at sample facilities, and EPA entered the data into the RCRA Correction Action Implementation Database (RCAID) and extrapolated the data for further analysis. In this analysis, cleanup costs for RCAID facilities varied widely, ranging from under $1 million to over $50 million in 1997 dollars ($1.1 million and $56 million, respectively, in current dollars). Fifty-six percent of RCAID facilities that reported cleanup costs had costs under $5 million ($5.6 million in current dollars); 33 percent had costs ranging from $5 million to $25 million ($28 million in current dollars); and 11 percent had costs exceeding $25 million. While a direct comparison is not possible, these data appear reasonably consistent with the EPA’s estimates from the 1993 Corrective Action Rule regulatory impact analysis. EPA Region 10 was not able to provide data on actual cleanup costs for RCRA sites in Washington.
General Estimates for Cleanup of Facilities in Washington When the Department of Ecology (Ecology) promulgated the Model Toxics Control Act in 1990, it prepared an economic impact analysis and a small business economic impact statement for the proposed cleanup standards.20 In this economic analysis, Ecology estimated cleanup costs for facilities that would be subject to MTCA based on generic contamination scenarios and an EPA cost model, rather than cost estimates for a sample of actual sites, as in the cost analyses for Superfund and RCRA sites discussed above. Example estimates of the cost of remedial action from this analysis include $24 million for a landfill and $2 million for petroleum-contaminated sites with a leaking underground storage tank in 1990 dollars ($33 million and $2.8 million, respectively, in current dollars). (The economic impact analysis Ecology prepared for the proposed amendments to MTCA in 2001 analyzed differential costs and benefits of the proposed amendments, but did not estimate total costs for cleanup of sites.) 19 U.S. Environmental Protection Agency, Office of Solid Waste, “A Study of the Implementation of the RCRA Corrective Action Program,” September 25, 2000, available at www.epa.gov/epaoswer/hazwaste/ca/facility/rcardfnl.pdf. 20 ICF Incorporated, “Economic Impact Statement for Proposed Cleanup Standards under the Model Toxics Control Act,” prepared for the Washington Department of Ecology Toxics Cleanup Program and PTI Environmental Services, July 31, 1990.
Analysis of Cleanup Obligations and Costs for Hazardous Waste Management Facilities in Washington State—Final Report January 29, 2003 C–4
Except for some of the case-study facilities, Ecology was not able to provide information on the costs it has incurred (or estimates of costs to private parties) for cleanup of hazardous waste management facilities in the state. Ecology’s Fiscal Office was, however, able to provide data for Ecology’s oversight costs to date for 45 (or nearly half) of the facilities in the inventory. This information was summarized in the body of the report and is included in Appendix D.

Analysis of Cleanup Obligations and Costs for Hazardous Waste Management Facilities in Washington State—Final Report January 29, 2003
APPENDIX D
Costs Incurred to Date by Ecology for Oversight of Cleanups of Hazardous Waste Management Facilities

Analysis of Cleanup Obligations and Costs for Hazardous Waste Management Facilities in Washington State—Final Report January 29, 2003

Analysis of Cleanup Obligations and Costs for Hazardous Waste Management Facilities in Washington State—Final Report January 29, 2003
APPENDIX E
Potentially Responsible Party (PRP) Cost Estimates for Remedial Actions & Associated Charges at Superfund Sites in Washington

Analysis of Cleanup Obligations and Costs for Hazardous Waste Management Facilities in Washington State—Final Report January 29, 2003

Analysis of Cleanup Obligations and Costs for Hazardous Waste Management Facilities in Washington State—Final Report January 29, 2003
APPENDIX F
Detailed Information on Case Study Facilities

Analysis of Cleanup Obligations and Costs for Hazardous Waste Management Facilities in Washington State—Final Report January 29, 2003
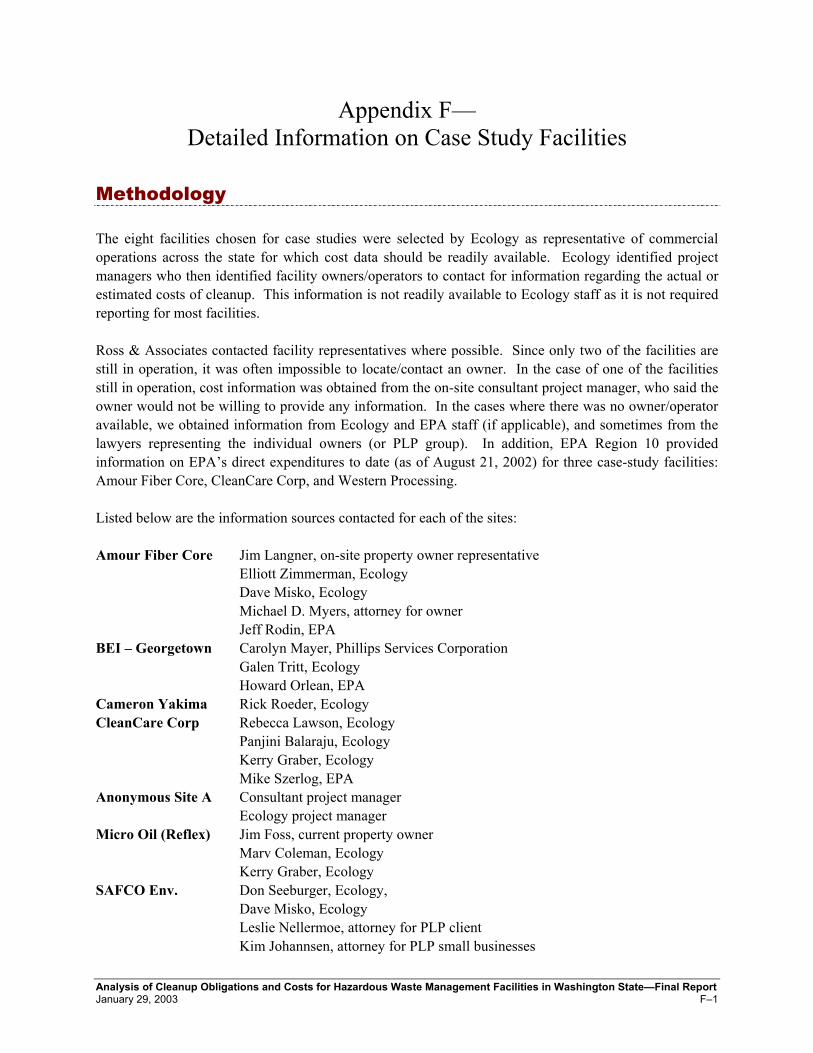
Analysis of Cleanup Obligations and Costs for Hazardous Waste Management Facilities in Washington State—Final Report January 29, 2003 F–1
Appendix F— Detailed Information on Case Study Facilities
Methodology The eight facilities chosen for case studies were selected by Ecology as representative of commercial operations across the state for which cost data should be readily available. Ecology identified project managers who then identified facility owners/operators to contact for information regarding the actual or estimated costs of cleanup. This information is not readily available to Ecology staff as it is not required reporting for most facilities. Ross & Associates contacted facility representatives where possible. Since only two of the facilities are still in operation, it was often impossible to locate/contact an owner. In the case of one of the facilities still in operation, cost information was obtained from the on-site consultant project manager, who said the owner would not be willing to provide any information. In the cases where there was no owner/operator available, we obtained information from Ecology and EPA staff (if applicable), and sometimes from the lawyers representing the individual owners (or PLP group). In addition, EPA Region 10 provided information on EPA’s direct expenditures to date (as of August 21, 2002) for three case-study facilities: Amour Fiber Core, CleanCare Corp, and Western Processing. Listed below are the information sources contacted for each of the sites: Amour Fiber Core Jim Langner, on-site property owner representative Elliott Zimmerman, Ecology Dave Misko, Ecology Michael D. Myers, attorney for owner Jeff Rodin, EPA BEI – Georgetown Carolyn Mayer, Phillips Services Corporation Galen Tritt, Ecology Howard Orlean, EPA Cameron Yakima Rick Roeder, Ecology CleanCare Corp Rebecca Lawson, Ecology Panjini Balaraju, Ecology Kerry Graber, Ecology Mike Szerlog, EPA Anonymous Site A Consultant project manager Ecology project manager Micro Oil (Reflex) Jim Foss, current property owner Marv Coleman, Ecology Kerry Graber, Ecology SAFCO Env. Don Seeburger, Ecology, Dave Misko, Ecology Leslie Nellermoe, attorney for PLP client Kim Johannsen, attorney for PLP small businesses

Analysis of Cleanup Obligations and Costs for Hazardous Waste Management Facilities in Washington State—Final Report January 29, 2003 F–2
Western Processing Lee Marshall, EPA Paul Johanssen, Trust Fund Manager (Boeing) It must be emphasized that only two of the facilities faxed copies of actual or estimated cost data. These came from facilities that are either still operational or are currently in cleanup status. One of the sites (SAFCO) was old enough that the attorneys for the PLP group, who were the ones with the cost data, could not access it, either because it was stored off-site or had been deleted from their files after three years. The rest was obtained from interviews and web-based information sources which emphasizes the anecdotal nature of much of this information. Details about each of the facilities are below.
► Amour Fiber Core Handler ID: WAD000011767 Address: 1120 E. Stevens, P.O. Box 42 Sultan, WA 98294 Owner(s): Mr. Connolly Mr. Roy P. Hoekema Background – Amour Fiber Core began operations in 1993. During its early years, the company received close technical assistance from Ecology pollution prevention and waste reduction staff. The business was established with the unique goal of reusing off-spec resins and fiberglass materials to make high-quality products. Products developed to date have included fiber-reinforced plastic lumber, bumper stops, and landscape paver squares. The facility acquired raw materials for several years with no product output due to lack of a successful marketing plan, resulting in an accumulation of a large quantity of dangerous waste chemicals on site. Due in at least part to conflict between the former operator and the legal owner (Mr. Connolly is currently in litigation seeking cost recovery from the Amour Estate, as well as other generators), the partnership is not financially viable. Current Status – Amour is a secured site undergoing cleanup. In 2001, in response to the immediate danger it caused, EPA carried out an emergency removal of 1000 gallons of Methly Ethyl Ketone Peroxide (MEKP). Currently there are over 900 55-gallon drums and 200-300 small containers with undetermined contents on the site and Ecology is working with the owner to manage and clean up the waste chemicals voluntarily rather than through enforcement. While the on-site manager has received several estimates for the cost of cleanup, the timeline set by Ecology in the administrative order is not likely to be met. Cost Information – Amour had no liability insurance, nor any financial assurances set aside. There is no known source of funds for closure costs. The on-site property manager estimates that the owner has paid approximately $125,000 out-of-pocket for removal and cleanup. EPA has spent about $58,000 to date on emergency removal of the MEKP. Cost estimates received from the owner’s attorney for cleanup range
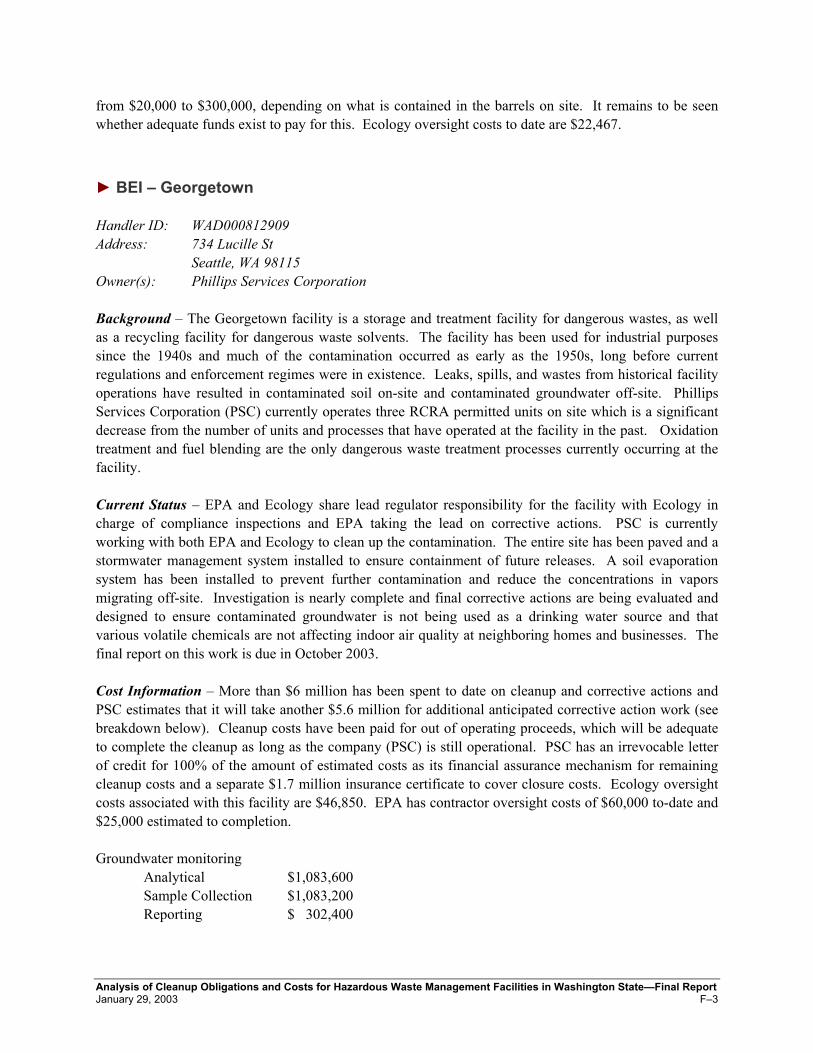
Analysis of Cleanup Obligations and Costs for Hazardous Waste Management Facilities in Washington State—Final Report January 29, 2003 F–3
from $20,000 to $300,000, depending on what is contained in the barrels on site. It remains to be seen whether adequate funds exist to pay for this. Ecology oversight costs to date are $22,467.
► BEI – Georgetown Handler ID: WAD000812909 Address: 734 Lucille St Seattle, WA 98115 Owner(s): Phillips Services Corporation Background – The Georgetown facility is a storage and treatment facility for dangerous wastes, as well as a recycling facility for dangerous waste solvents. The facility has been used for industrial purposes since the 1940s and much of the contamination occurred as early as the 1950s, long before current regulations and enforcement regimes were in existence. Leaks, spills, and wastes from historical facility operations have resulted in contaminated soil on-site and contaminated groundwater off-site. Phillips Services Corporation (PSC) currently operates three RCRA permitted units on site which is a significant decrease from the number of units and processes that have operated at the facility in the past. Oxidation treatment and fuel blending are the only dangerous waste treatment processes currently occurring at the facility. Current Status – EPA and Ecology share lead regulator responsibility for the facility with Ecology in charge of compliance inspections and EPA taking the lead on corrective actions. PSC is currently working with both EPA and Ecology to clean up the contamination. The entire site has been paved and a stormwater management system installed to ensure containment of future releases. A soil evaporation system has been installed to prevent further contamination and reduce the concentrations in vapors migrating off-site. Investigation is nearly complete and final corrective actions are being evaluated and designed to ensure contaminated groundwater is not being used as a drinking water source and that various volatile chemicals are not affecting indoor air quality at neighboring homes and businesses. The final report on this work is due in October 2003. Cost Information – More than $6 million has been spent to date on cleanup and corrective actions and PSC estimates that it will take another $5.6 million for additional anticipated corrective action work (see breakdown below). Cleanup costs have been paid for out of operating proceeds, which will be adequate to complete the cleanup as long as the company (PSC) is still operational. PSC has an irrevocable letter of credit for 100% of the amount of estimated costs as its financial assurance mechanism for remaining cleanup costs and a separate $1.7 million insurance certificate to cover closure costs. Ecology oversight costs associated with this facility are $46,850. EPA has contractor oversight costs of $60,000 to-date and $25,000 estimated to completion. Groundwater monitoring Analytical $1,083,600 Sample Collection $1,083,200 Reporting $ 302,400

Analysis of Cleanup Obligations and Costs for Hazardous Waste Management Facilities in Washington State—Final Report January 29, 2003 F–4
RI Completion Risk Assessment $ 275,000 PR $ 40,000 Final Report $ 150,000 Draft FS Report preparation $ 75,000 Final FS Report preparation $ 50,000 Comment resolution $ 20,000 PR $ 20,000 IM Implementation IHP implementation $ 120,000 Barrier wall constr. $2,000,000 IM O&M $ 343,000 RD/RA Work plan $ 100,000 TOTAL $5,612,200
► Cameron Yakima, Inc. (CYI) Handler ID: WAD009477175 Address: 414 S 1st St. Yakima, WA, 98901-1729 Owner(s): Cleanup being funded by numerous RPs. Background – Cameron Yakima, Inc. is one of several cleanup sites in the Yakima Railroad Area (YRRA). It was a permitted facility for the storage and thermal treatment of hazardous and non-hazardous spent activated carbon which was shipped to it from all over the country. A leaking underground tank that was used to store contaminated carbon prior to treatment and past practices contributed to groundwater contamination. Perchloroethylene (PCE or perc) was found extensively in the soil and groundwater of the entire YRRA, with the highest known amounts at the Cameron Yakima site. The plume from the contamination was six square miles and affected the drinking water of 4,000 low income people. Current Status – CYI has been closed since 1990. The site is now a paved vacant lot with complete removal of all contaminated soils and installation of a long-term groundwater monitoring system. It is awaiting a five year review and has 27 ½ years remaining on a long-term groundwater monitoring plan. The state provided a $6.4 million construction grant to the cities of Yakima and Union Gap to hook up 1200 homes of affected parties to city water and sewer. During the two years it took to complete construction, a local company which was a PLP provided staff and resources to coordinate the distribution of bottled water to these 1200 homes. Cost Information – CYI was organized as a corporation with various investors and shareholders who were not pursued as liable parties during the cleanup process. Ecology did an extensive search and
Analysis of Cleanup Obligations and Costs for Hazardous Waste Management Facilities in Washington State—Final Report January 29, 2003 F–5
identified over 200 potentially liable parties (PLPs) that had shipped contaminants to the CYI facility. Settlement decrees were negotiated with four large groups of PLPs that resulted in the creation of a trust fund in the amount of $4.5 million to provide money for investigation and cleanup. Many of these large companies had insurance. Additionally, smaller contributors, many of which still operate in the Yakima area, reached de minimus settlements for their share of cleanup that included costs incurred for the bottled water program ($112,000 + $67,500). As a form of financial assistance, Ecology staff put together a work plan for many of these smaller businesses. They also incurred oversight costs of $226,141. CYI itself had only $35,000 set aside as financial assurance to cover the cost of closure, which was used during the closure/cleanup process.
► CleanCare Corporation Handler ID: WAD980738512 Address: 1510 Taylor Way Tacoma, WA 98421 Owner(s): Bromley-Marr, a corporation Background – CleanCare was a former treatment, storage, disposal, and recycling facility located in the Tacoma Tideflats with a 30-year history as a solvent recycling operation and a more recent history as a dangerous waste storage facility. While owners/operators have changed several times during its operation, the facility was held to minimal standards until recently because of its insistence that recycling was exempt from regulation. Upon regular inspections, which began in 1998, Ecology determined that the facility did not meet the requirements for interim status, was in violation of a multitude of regulations and recommended closure of the facility. These violations include spills, leaks, storage without a permit, inadequate liability insurance and financial assurance, co-mingling of wastes, and problems with waste analysis. CleanCare closed its doors and declared bankruptcy, leaving no viable owner/operator. Current Status – EPA conducted emergency removal actions at the CleanCare site, removing close to two million gallons of waste from the site, installing an asphalt cap to contain soil contamination, and installing an aboveground stormwater management system to prevent contamination from migrating off-site. The site is secured and dormant, with no further cleanup planned at this time. The state provided a grant to the Tacoma/Pierce County Health Department to do a detailed assessment of soil and groundwater contamination to determine the need for additional cleanup actions at the site. Ecology has taken over responsibility for the operation and maintenance of the stormwater system. Cost Information – CleanCare had $23,000 (of a total $83,000 requirement) set aside in a trust fund to meet its financial assurance requirements for closure. While there is $1.5 million in insurance liability, there have been problems accessing the insurance money. EPA spent about $4.1 million on emergency removal actions and is still determining whether it will seek to recover cleanup costs from potential responsible parties (PRPs). Ecology provided a $70,000 remedial action grant to Tacoma/Pierce County, as well as spent $56,632 for one-time costs related to electrical and security problems at the site. Ecology also continues to pay the monthly utility bills at the site, which range $600-900 per month. Ecology’s oversight costs associated with this site are $110,939. There are still unknown future costs associated with any further cleanup actions determined necessary through the site assessment process.

Analysis of Cleanup Obligations and Costs for Hazardous Waste Management Facilities in Washington State—Final Report January 29, 2003 F–6
► Anonymous Site A Address: Tacoma Background – This site, which is still operational as a business and requested confidentiality, is a solvent recycling business that currently only collects and recycles/disposes of waste oils. The site had contaminated groundwater that was flowing off-site and contaminated soils that were the result of historical releases of hazardous substances at the facility since its inception in 1972. The releases included total petroleum hydrocarbons and volatile and semi-volatile organic compounds (VOCs and SVOCs). Current Status – Through an Agreed Order, the PLPs have completed the investigation phase and have interim measures installed and operational. Contaminated groundwater is captured, treated, and discharged; some contaminated soils have been excavated; and a soil evaporation system has been installed to reduce contaminant concentrations in additional soils. Cost Information – Interim actions have cost $2 million to-date. The consultant contractor estimates that $6.2 million has been spent total, much of that related to legal actions and issues with connecting sites. The feasibility study for cleanup is underway and the consultant estimates that the cleanup action plan will cost somewhere between $6-14 million. Insurance money has paid for all work to-date and should be adequate to complete the cleanup. While the facility is in corrective action status, there is no financial assurance requirement. Ecology’s oversight costs on this facility have been $239,718.
► Micro Oil (Reflex) Handler ID: WAD980978142 Address: 2432 East 11th Street Tacoma WA 98421 Owner(s): FMA, LLP Background – Reflex Recycling operated primarily as a 24-hour recycler of specialty solvents used in the printing industry with customers in Washington, Oregon, and California. It also had interim status as a state-only storage (TSD) facility. Interim status allowed Reflex to store state-only dangerous wastes prior to recycling. Reflex did not meet TSD standards in regard to training plans and records, financial assurance, and an approved closure plan. Additionally, Reflex stored hazardous waste not covered under its interim status, and failed to track and store dangerous wastes properly. The company was not financially viable and therefore not able to meet the financial requirements of closure. Current Status – Operations at Reflex ceased in 2001 when utilities to the site were terminated. The Tacoma/Pierce County Health Department conducted an initial assessment for ranking purposes and Ecology conducted emergency removal actions of 200-250 55-gallon drums of oily waste in 2001. The site is currently fenced and secure, but has never gone through proper investigation and cleanup. The current owner, FMA (Foss Moon Associates), LLC, acquired the property in foreclosure.

Analysis of Cleanup Obligations and Costs for Hazardous Waste Management Facilities in Washington State—Final Report January 29, 2003 F–7
Cost Information – There was no approved financial instrument in place for closure costs. There is a letter from a consultant to Ecology estimating closure costs at $103,060, but providing no basis for the number. Thus far, Ecology has expenditures of $255,714 in oversight costs and $150,000 in contracted costs for removal actions.
► SAFCO Environmental Handler ID: WAD981766884 Address: 1255 South 188th St. SeaTac, Washington Owner(s): Jim Johnson Background – SAFCO was an illegally operated hazardous waste recycling and transportation facility located just south of the SeaTac airport at the end of the runway. It was closed by the local fire department as a potential fire hazard following a substantial spill of oily waste in 1992. Ecology inventoried the materials on site and identified 31 PLPs from the records on site, which included a few larger generators and many small generators. Ecology issued an Emergency Enforcement Order requiring remedial actions by the PLPs to remove 55 damaged or leaking drums containing oil and other waste from the site. Other actions required by the order included separation of incompatibles, identification of the contents of damaged drums, and the disposal of toxic wastes. Eventually, as second order was issued for the removal of an additional 445 drums containing oil and other wastes. Current Status – All materials were inventoried, analyzed, and disposed of properly. The site is currently vacant and secured. There is no remaining cleanup to be done, except what might be necessary on a voluntary basis in order to sell the property. Cost Information – There was neither any financial assurance mechanism nor any source of funds from the owner/operator, who disappeared. A group of 31 PLPs managed the removal and disposal. Best cost estimates received from legal representatives of the PLP group put the costs between $500,000 and $750,000, but no one could provide exact data due to the age of this case. The leads for the group represented the one or two largest companies associated with it. Thirteen smaller generators eventually paid on the order of $200,000 to the lead companies for their share. Both attorneys said cleanup costs were most likely paid for from operating revenues.
► Western Processing Handler ID: WAD980724520 Address: 7215 S. NW 54th St. Kent, WA 98031 Owner(s): Western Processing Trust Background – Western Processing was an industrial waste recycling and reclamation facility that originally processed animal by-products and brewer’s yeast, but expanded in the 1960s to include

Analysis of Cleanup Obligations and Costs for Hazardous Waste Management Facilities in Washington State—Final Report January 29, 2003 F–8
industrial wastes. The waste included waste oils, pesticides and spent solvents. For more than 20 years, hundreds of businesses transported industrial wastes to the site. It stored 4,000-6,000 drums on site, contained 72 bulk tanks, open waste piles, 10 lagoons, and other containers. The company was declared a Superfund (CERCLA) site and closed permanently by court order in 1983. The site was stabilized by emergency removal of PCB liquids, solidified paint sludges, recycled solvents, and mixed contaminated liquids. A stormwater runoff system was installed, waste material piles were capped, and a groundwater treatment system was installed. Current Status – In 2000, after 15 years of work, EPA, Ecology, and the Western Processing Trust celebrated the conclusion of the active phase of cleanup work. Operations review and monitoring continue on a quarterly basis for 30 years. EPA touts the Western Processing site as one of its success stories because the original technology selected to cleanup the groundwater was modified to reflect new information gained during remedy implementation. This change resulted in an $82 million reduction in cleanup costs. Cost Information – Total costs for this exceeded $100 million; with final estimated costs of remedial action at $118 million. Public records in the CERLIS database show the following breakdown: Removal actions and proper disposal $ 5 million On-site treatment plan for stormwater $ 9 million Remedial actions $18 million O&M $ 3 million Groundwater treatment $40 million TOTAL $75 million 190 PRPs established a trust fund to pay for cleanup costs as the result of several lawsuits. Boeing contributed approximately 80 percent of the funds and the trust is managed by Boeing employees. Ecology has $443,907 in oversight costs associated with Western Processing, while EPA has spent about $1.4 million for oversight and about $11 million for cleanup of the site.