analysis of catharanthus roseus alkaloids by hplc · analysis of catharanthus roseus alkaloids by...
TRANSCRIPT

See discussions, stats, and author profiles for this publication at: https://www.researchgate.net/publication/225907237
Analysis of Catharanthus roseus alkaloids by HPLC
Article in Phytochemistry Reviews · June 2007
DOI: 10.1007/s11101-006-9036-y
CITATIONS
48
READS
2,240
2 authors, including:
Mario Jolicoeur
Polytechnique Montréal
120 PUBLICATIONS 1,764 CITATIONS
SEE PROFILE
All content following this page was uploaded by Mario Jolicoeur on 25 January 2014.
The user has requested enhancement of the downloaded file.

Analysis of Catharanthus roseus alkaloids by HPLC
Steve Hisiger Æ Mario Jolicoeur
Received: 22 June 2005 / Accepted: 5 October 2006 / Published online: 13 March 2007� Springer Science+Business Media B.V. 2007
Abstract Catharanthus roseus is a medicinal
plant from which secondary metabolites used in
chemotherapy to treat diverse cancers are ex-
tracted. The well known high value metabolites
vincristine and vinblastine are just 2 of 130
alkaloids that can be found in C. roseus. However,
only few (~11) of this high number of chemical
entities are frequently analyzed and even fewer
(~8) are available commercially. For more than
30 years, different analytical techniques have
been developed to isolate and identify C. roseus
metabolites, and then allowing revealing the
therapeutic potential of C. roseus metabolites.
Among few approaches, high performance liquid
chromatography (HPLC) technique is still widely
used for the separation and analysis of secondary
metabolites such as those from C. roseus. This
article thus reviews the most recent developments
in HPLC analysis of alkaloids from C. roseus.
Diverse considerations that are crucial to the
efficiency of secondary metabolites separation and
identification steps, such as biomass manipulation,
extraction phase and protocols, HPLC separation
and analysis protocols are reviewed in details.
Examples of spectra obtained using the most
common detectors are also shown and suggestions
are made on how to proceed in developing
efficient separation and identification methods at
the analytical and semi-preparative scales.
Keywords Semi-preparative HPLC � Reversed-
phase HPLC � Fluorescence � UV � Vincristine �Serpentine � Vinblastine
Abbreviation
HPLC high performance liquid
chromatography
TLC thin layer chromatography
SPE solid phase extraction
PDA photo diode array
FW fresh weight
DW dry weight
MS mass spectrometry
TIA terpene indole alkaloid
TCA trichloroaceticacid
TEA triethylamine
TFA trifluoroacetic acid
NMR nuclear magnetic resonance
CD circular dichroism
Introduction
Catharanthus roseus is known to biosynthesize
more than 130 alkaloids (van der Heijden et al.
S. Hisiger � M. Jolicoeur (&)Canada Research Chair on the Development ofMetabolic Engineering Tools, Bio-P2 Research Unit,Department of Chemical Engineering, EcolePolytechnique de Montreal, P.O. Box 6079, Centre-ville Station, Montreal, Quebec, Canada H3C 3A7e-mail: [email protected]
123
Phytochem Rev (2007) 6:207–234
DOI 10.1007/s11101-006-9036-y

2004). Although this rich molecular pool has been
screened for therapeutics since few decades, only
five alkaloids from C. roseus (serpentine, ajmal-
icine and the bisindole alkaloids vinblastine,
vincristine and 3¢,4¢-anhydrovinblastine) are mar-
keted. Ajmalicine and serpentine are prescribed
for the treatment of hypertensia, whereas the
bisindoles vinblastine, vincristine and 3¢,4¢-anhy-
drovinblastine are used for their antineoplastic
activity in the treatment of many cancers (see van
der Heijden et al. 2004 for review). These
secondary metabolites are end-products usually
found in plant extracts (Fig. 1), and the biosyn-
thetic pathways leading to these compounds are
already described in literature (van der Heijden
et al. 1989, 2004; Facchini 2001; De Luca and
St-Pierre 2000; De Luca and Laflamme 2001). In
vitro cultures of plant cell suspension and of
diverse tissues (such as hairy roots) have been
widely studied for the production of these high
value and complex molecules, but with limited
commercial success. A major bottleneck is that
some of the alkaloids showed to be tissue-specific
and cannot be obtained in undifferentiated cell
culture. Vincristine and vinblastine require both
aerial and root parts of a plant to be synthesized
(De Luca and Laflamme 2001). Horhammericine,
tabersonine, lochnericine, 19-hydroxytaberso-
nine, 19-O-Acetyl-horhammericine and echitove-
nine are mostly synthesized in roots (Shanks et al.
1998; Laflamme et al. 2001; Rodriguez et al.
2003), and are not always detected in suspension
cells (Kutney et al. 1980; Jolicoeur unpublished
data). In addition, the natural bisindole alkaloids
vingramine and methylvingramine have been
seen in seeds of C. roseus (Jossang et al. 1998),
but their presence in other tissues has not
been demonstrated yet. In the last decades, a
significant research effort has focused on remov-
ing the metabolic limitations that are encountered
in in vitro culture as compared to plants (Ver-
poorte et al. 1999; Verpoorte and Memelink 2002;
Hughes et al. 2004). Research in metabolic engi-
neering and cell line selection have then signifi-
cantly contributed to the improvement of
analytical methods, and most of the efforts have
been placed on chromatographic technologies
which now show to be highly efficient, fast,
accurate and high-throughput for the analysis of
plant alkaloids (McCalley 2002; Drager 2002;
Houghton 2002; Molyneux et al. 2002; Stockigt
et al. 2002; Chen et al. 2004). Thin-layer chroma-
tography (TLC) (De Luca et al. 1986; Asada and
Shuler 1989; Monforte-Gonzales et al. 1992) and
high-performance TLC (Klyushnichenko et al.
1995) were previously suggested for a rapid
screening of plants or cell lines. However, these
methods show a low precision level for the
identification and quantification of alkaloids
from complex mixtures such as crude plant
extracts, which contain hundreds of different
compounds. High-performance liquid chromatog-
raphy (HPLC) then represents a powerful capac-
ity of separation of alkaloids and is particularly
adapted for secondary metabolites fingerprinting.
Automation of HPLC allows high-throughput
analyses and collection of the different fractions
after separation (Stockigt et al. 2002).
Among the molecules illustrated in Fig. 1,
current HPLC methods mainly allow for the
separation and the identification of ajmalicine,
serpentine, vinblastine, vincristine, vindoline,
catharanthine, tabersonine, lochnericine, secolog-
anin, strictosidine, tryptophan and tryptamine.
Reason for this limited list of alkaloids relies on
the fact that no standards are commercially
available (to our knowledge) for the other alka-
loids found in C. roseus. Due to their relative low
abundance in plant and cell extracts, unidentified
alkaloids usually appear as weak peaks that are
‘‘lost in the forest’’ of a chromatogram; a situation
which can bias the identification and the quanti-
fication of the compounds of interest. In the
pathway leading from tabersonine to vindoline,
which occurs in the aerial parts of the plant (De
Luca et al. 1988; St-Pierre et al. 1999; De Luca
and St-Pierre 2000), four intermediates have been
identified as 16-hydroxytabersonine, 16-meth-
oxytabersonine, 16-methoxy-2,3-dihydro-3-hydro-
xy-N-methyltabersonine and deacetylvindoline
(De Luca and Laflamme 2001). Strictosidine
derivatives as 4,21-dehydrogeissoschizine, cathen-
amine, epicathenamine, and stemmadenine and
its derivatives (akuammicine, condylocarpine)
leading to catharanthine and tabersonine (Ste-
vens et al. 1993; El-Sayed et al. 2004) can co-elute
with compounds of interest (see above). There-
fore, the efficiency of a separation method will
208 Phytochem Rev (2007) 6:207–234
123

strictosidine
cathenamine ajmalicine
secologanin
NH
N
CO2Me
H
O
NH
N
CO2Me
H
OH
stemmadenine tabersonine lochnericine
19-hydroxytabersonine catharanthine vindoline
COOMeN
H
N
OH
H
N
N
CO2Me
H
OH
HCHO
MeO CO2Me
COOMeN
H
N
OH
H
N
N
CO2Me
H
OH
H
Me
MeO CO2Me
N
N
CO2Me
H
OH
H
Me
MeO CO2Me
COOMe
N
H
N
CH2CH3
NH
N
CO2Me
H
MeOOC
N
N
H
CH2OH
H
MeOOC
H
NN+
HH
OH
MeOOC
H
NN
HH
OMeOOC
H
NN
HH
O
H
MeOOC
H
NN+
H
O
H
OMeOOC
H
OGlc
NN
HH
H
NH
NH2
O
OMeOOC
H
HOGlc
H
NH
N
CO2Me
H
OH
O
tryptamine
4,21-dehydrogeissoschizine serpentine
hörhammericine
vinblastine vincristine
Fig. 1 Simplified pathways of biosynthesis for the TIAs from Catharanthus roseus. The molecules in bold are thoseseparated and identified by HPLC. Pathways adapted from Meijer et al. (1993) and Tikhomiroff and Jolicoeur (2002)
Phytochem Rev (2007) 6:207–234 209
123
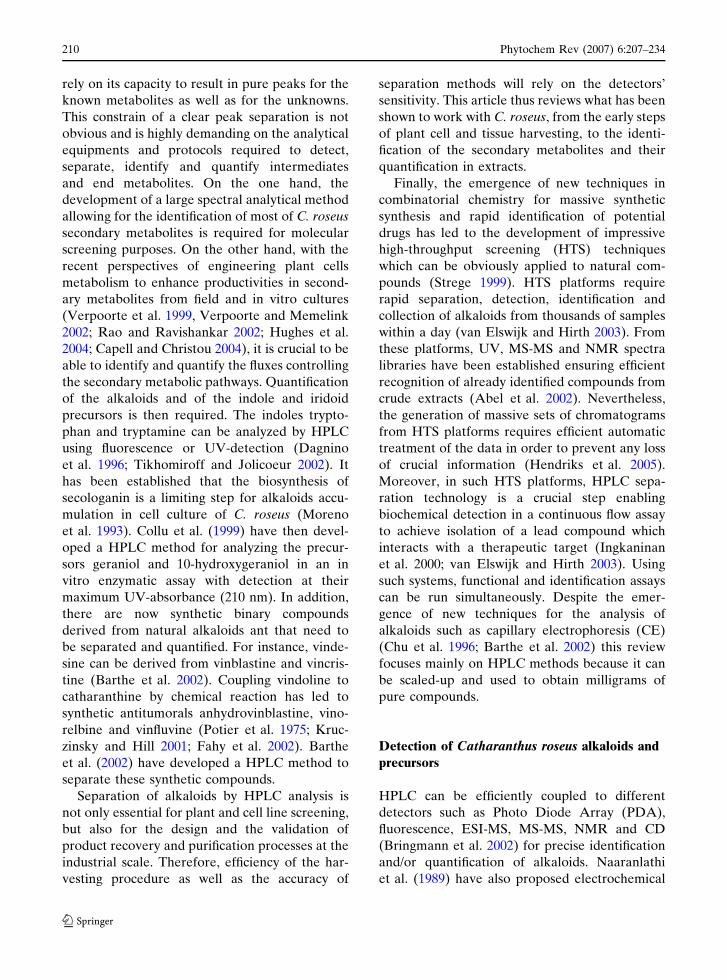
rely on its capacity to result in pure peaks for the
known metabolites as well as for the unknowns.
This constrain of a clear peak separation is not
obvious and is highly demanding on the analytical
equipments and protocols required to detect,
separate, identify and quantify intermediates
and end metabolites. On the one hand, the
development of a large spectral analytical method
allowing for the identification of most of C. roseus
secondary metabolites is required for molecular
screening purposes. On the other hand, with the
recent perspectives of engineering plant cells
metabolism to enhance productivities in second-
ary metabolites from field and in vitro cultures
(Verpoorte et al. 1999, Verpoorte and Memelink
2002; Rao and Ravishankar 2002; Hughes et al.
2004; Capell and Christou 2004), it is crucial to be
able to identify and quantify the fluxes controlling
the secondary metabolic pathways. Quantification
of the alkaloids and of the indole and iridoid
precursors is then required. The indoles trypto-
phan and tryptamine can be analyzed by HPLC
using fluorescence or UV-detection (Dagnino
et al. 1996; Tikhomiroff and Jolicoeur 2002). It
has been established that the biosynthesis of
secologanin is a limiting step for alkaloids accu-
mulation in cell culture of C. roseus (Moreno
et al. 1993). Collu et al. (1999) have then devel-
oped a HPLC method for analyzing the precur-
sors geraniol and 10-hydroxygeraniol in an in
vitro enzymatic assay with detection at their
maximum UV-absorbance (210 nm). In addition,
there are now synthetic binary compounds
derived from natural alkaloids ant that need to
be separated and quantified. For instance, vinde-
sine can be derived from vinblastine and vincris-
tine (Barthe et al. 2002). Coupling vindoline to
catharanthine by chemical reaction has led to
synthetic antitumorals anhydrovinblastine, vino-
relbine and vinfluvine (Potier et al. 1975; Kruc-
zinsky and Hill 2001; Fahy et al. 2002). Barthe
et al. (2002) have developed a HPLC method to
separate these synthetic compounds.
Separation of alkaloids by HPLC analysis is
not only essential for plant and cell line screening,
but also for the design and the validation of
product recovery and purification processes at the
industrial scale. Therefore, efficiency of the har-
vesting procedure as well as the accuracy of
separation methods will rely on the detectors’
sensitivity. This article thus reviews what has been
shown to work with C. roseus, from the early steps
of plant cell and tissue harvesting, to the identi-
fication of the secondary metabolites and their
quantification in extracts.
Finally, the emergence of new techniques in
combinatorial chemistry for massive synthetic
synthesis and rapid identification of potential
drugs has led to the development of impressive
high-throughput screening (HTS) techniques
which can be obviously applied to natural com-
pounds (Strege 1999). HTS platforms require
rapid separation, detection, identification and
collection of alkaloids from thousands of samples
within a day (van Elswijk and Hirth 2003). From
these platforms, UV, MS-MS and NMR spectra
libraries have been established ensuring efficient
recognition of already identified compounds from
crude extracts (Abel et al. 2002). Nevertheless,
the generation of massive sets of chromatograms
from HTS platforms requires efficient automatic
treatment of the data in order to prevent any loss
of crucial information (Hendriks et al. 2005).
Moreover, in such HTS platforms, HPLC sepa-
ration technology is a crucial step enabling
biochemical detection in a continuous flow assay
to achieve isolation of a lead compound which
interacts with a therapeutic target (Ingkaninan
et al. 2000; van Elswijk and Hirth 2003). Using
such systems, functional and identification assays
can be run simultaneously. Despite the emer-
gence of new techniques for the analysis of
alkaloids such as capillary electrophoresis (CE)
(Chu et al. 1996; Barthe et al. 2002) this review
focuses mainly on HPLC methods because it can
be scaled-up and used to obtain milligrams of
pure compounds.
Detection of Catharanthus roseus alkaloids and
precursors
HPLC can be efficiently coupled to different
detectors such as Photo Diode Array (PDA),
fluorescence, ESI-MS, MS-MS, NMR and CD
(Bringmann et al. 2002) for precise identification
and/or quantification of alkaloids. Naaranlathi
et al. (1989) have also proposed electrochemical
210 Phytochem Rev (2007) 6:207–234
123

detection for analyzing cell culture samples.
Indeed, there are physical characteristics
(Table 1) guiding for efficient HPLC detection
of C. roseus secondary metabolites. Since alka-
loids present a structure composed of aromatic
rings, UV absorbance is a method of choice for
their detection. The presence of p-delocalized
electrons in the alkaloids structure enables auto-
fluorescence phenomena allowing for their effi-
cient detection with a reduced baseline back-
ground, especially for the highly fluorescent ones
(e.g. serpentine and ajmalicine). Alkaloids are
also easily ionized by electrospray in positive
mode, so their detection in ESI (+) MS is recom-
mended. However, among the detectors used in
HPLC analysis, UV and fluorescence are partic-
ularly efficient for the quantification of alkaloids,
and these detectors are easily accessible to the
large scientific community.
Detection upon UV absorbance
As stated above, indole alkaloids can be UV-
detected and identified from their specific UV
absorbance spectra after their separation as single
compound. Typical UV spectra are showed in
Fig. 2 (Tikhomiroff and Jolicoeur 2002). If a
single wavelength is available, 218 nm then seems
optimal at maximizing the absorbance level for
most of the alkaloids. However, 254 nm for
serpentine and 340 nm for tabersonine-like com-
pounds will allow higher precision and limit of
detection, with signal-to-noise ratios of respec-
tively 4 and 60 times higher than at 218 nm.
Therefore, since the wavelengths generating max-
imal absorbance do not exactly correspond for all
alkaloids, a PDA detector having multiple UV
channels seems preferable for quantitative studies
of alkaloids mixtures. Indeed, setting the detector
channel to a specific wavelength for a compound
allows enhancing the baseline by suppressing the
noise from low-abundant alkaloids or from other
UV absorbing interfering molecules and mobile
phase. Moreover, as suggested by Shanks et al.
(1998) peak identification may be more reliable
using UV–VIS spectrum obtained by PDA than
just relying upon retention time. Limits of detec-
tion (LOD) for vindoline and catharanthine were
10 and 0.52 lg ml–1, respectively for the method
developed by Naraanlathi et al. (1987) and the
method established by Tikhomiroff and Jolicoeur
(2002). Recent developments in PDA detector
and separation column technologies have con-
tributed to significantly decrease the LOD. How-
ever, the limit of detection under UV can be
significantly affected by the presence of other
compounds at proximity of the peaks of interest
(Chu et al. 1997).
Table 1 Specific properties of C. roseus’ TIAs and precursors for HPLC separation and detection
Alkaloid Fluorescence (max Ex/Em in nm) Absorption UV (nm) Hydrophilicity (compared to serpentine)
Tryptophan 270/370 218, 278 +Tryptamine 270/370 218, 278 +Ajmalicine 270/390 246, 290 +Serpentine 350/450 252, 308, 370 0Vinblastine 297/364 214, 266 –Vincristine 222, 256, 298 –Vindoline 307/357 214, 254, 306 –Catharanthine 290/363a 226, 282 –Tabersonine 222, 302, 326 –Lochnericine 332 –Secologanin 238 +Strictosidine 280/354b 280
a Renaudin (1985) reported that catharanthine could be detected by fluorescence, but it is 9 times less fluorescent thanajmalicine and about 380 times less fluorescent than serpentine (at their maximum of fluorescence). Moreover, in the samearticle it is mentioned that the sensitivity in a HPLC analysis for catharanthine is better in absorbance than in fluorescencedetectionb Pennings et al. (1989) found than the strictosidine fluorescence signal intensity is three times smaller than UV absorbancesignal at 280 nm
Phytochem Rev (2007) 6:207–234 211
123

Detection upon fluorescence
The corynanthe-type alkaloids such as ajmalicine
and serpentine are fluorescent and can be
detected using a fluorescence detector (Fig. 3).
Even if these compounds can either be easily
detected under UV, fluorescence is more sensitive
with a lower limit of detection at the micromolar
level. The precursors tryptophan, tryptamine and
the alkaloid ajmalicine can efficiently be detected
nm200 220 240 260 280 300 320 340 360
0
25
50
75
nm200 220 240 260 280 300 320 340 360
200 220 240 260 280 300 320 340 360
mA
Um
AU
mA
Um
AU
mA
U
mA
U
mA
Um
AU
mA
Um
AU
mA
U
0
200
400
Tryptophan Ajmalicine
nm
nm
nm
nm
nm
0
10
20
30
nm200 220 240 260 280 300 320 340 360
0
200
400
Secologanin Tryptamine
0
200
400
600.
220 240 260 280 300 320 34 360 380 400
0
250
500
750
Vincristine Serpentine
nm
0
500
1000
1500
220 240 260 280 300 320 340 360 380 400220 240 260 280 300 320 340 360 380 400
220 240 260 280 300 320 340 360 380 400
0
500
1000.
Catharanthine Vindoline
nm
0
200
400
600
220 240 260 280 300 320 340 360 380 400220 240 260 280 300 320 340 360 380 400
220 240 260 280 300 320 340 360 380 400
0
250
500
750
Tabersonine Vinblastine
nm
0
10
20
30
Lochnericine
Fig. 2 UV spectra of C. roseus TIAs and precursors. Spectra were recorded using a Beckman-Coulter system Gold 168PDA detector
212 Phytochem Rev (2007) 6:207–234
123

at Ex 270/Em 370 nm, despite the fact that the
maximum excitation wavelength for ajmalicine is
Ex 290 nm, whereas it is Ex 270 nm for both
precursors. Limits of detection for tryptophan
and tryptamine were lower to 0.01 lg ml–1 (Tik-
homiroff and Jolicoeur 2002). Renaudin (1985)
reported that the limit of detection can be
decreased by a factor of six for ajmalicine and
vindoline and even by a factor of 50 for serpen-
tine by using fluorescence detection instead of
traditional UV detection. Combining the use of
fluorescence and absorbance detectors, molecules
that co-elute but which show different physical
characteristics can still be quantified by selecting
appropriate wavelengths. For instance, quantifi-
cation of serpentine performed at 306 nm was
possible while co-eluting with an unidentified
compound (Tikhomiroff and Jolicoeur 2002).
Renaudin (1985) showed that co-elution of ser-
pentine with vinblastine has no effect on serpen-
tine response factor since no quenching occurs;
they can then be differentiated from their respec-
tive fluorescence spectra. Nevertheless, this ap-
proach requires to be validated for each peak
with the identification of the co-eluting com-
pounds and by establishing the detection condi-
tions minimizing interference phenomena.
Adequate sample preparation enhances
analytical steps
An extraction method has to cope with the
starting plant material and the differential in the
physico-chemical properties of the molecules to
be extracted and of those to be removed; their
respective partition coefficient in the extraction
solvent being of the most significant parameters.
Special cares that have to be considered at each
step for the commnonly used methods are pre-
sented below.
Biomass considerations
Secondary metabolites are generally present in a
wide range of concentrations that may even vary
from one lot or batch to another. Therefore, large
amount of biomass may be required to have access
to a large spectrum of compounds each at an
adequate concentration. Usual amounts of bio-
mass sampled from in vitro cultures and whole
plant culture are presented in Tables 2 and 3,
respectively. Freeze-drying of the biomass enables
to crush the cells, to perform extraction steps on
concentrated samples which decrease the volume
to be processed without denaturing alkaloids.
From in vitro plant cell and tissue cultures,
50 mg DW have been reported to be the lower
biomass limit for the efficient quantification of
most of the known alkaloids. This sample size
represents 0.5–1 g FW and thus up to 3 ml of a
plant cell suspension in liquid culture. This is seen
as a minimum and may not always allow for the
detection of all alkaloids, even for the known
ones. Sample concentration can be increased in
different ways such as evaporation of the extrac-
tion phase and re-suspension into a smaller
volume of solvent, or by using solid phase extrac-
tion as for aqueous solution extraction (see
below), and then modulating the elution volume
(Renaudin 1985; Lee-Parsons and Shuler 2002). In
most cases, less than few micrograms of pure
330
370
410
450
490
530
570
330
370
410
450
490
530
570
290
330
Emission Wavelength (nm)
0
500.0
1000
1500
2000
2500
3000
3500
4000
290
330
370
410
450
490
5300
100.0
200.0
300.0
400.0
500.0
600.0
700.0
800.0
290
330
370
410
450
490
5300
325.0
650.0
975.0
1300
1625
1950
2275
2600
290
330
370
410
450
490
530
Exc
itatio
n W
avel
engt
h (n
m)
E
xcita
tion
Wav
elen
gth
(nm
)
0
87.50
175.0
262.5
350.0
437.5
525.0
612.5
700.0
370
410
450
490
530
a b
dc
Fig. 3 2D-Fluorescence spectra of some C. roseus’TIAsand precursors acquired in an aqueous solution pH 5.7(from Hisiger and Jolicoeur 2005). The fluorescencespectra of tryptophan (a), tryptamine (b), serpentine (c)and ajmalicine (d) were recorded with a multichannelfluorescence sensor (Delta Light and Optics, Lyngby,Denmark) using 12.5 mg l–1 standard solutions
Phytochem Rev (2007) 6:207–234 213
123
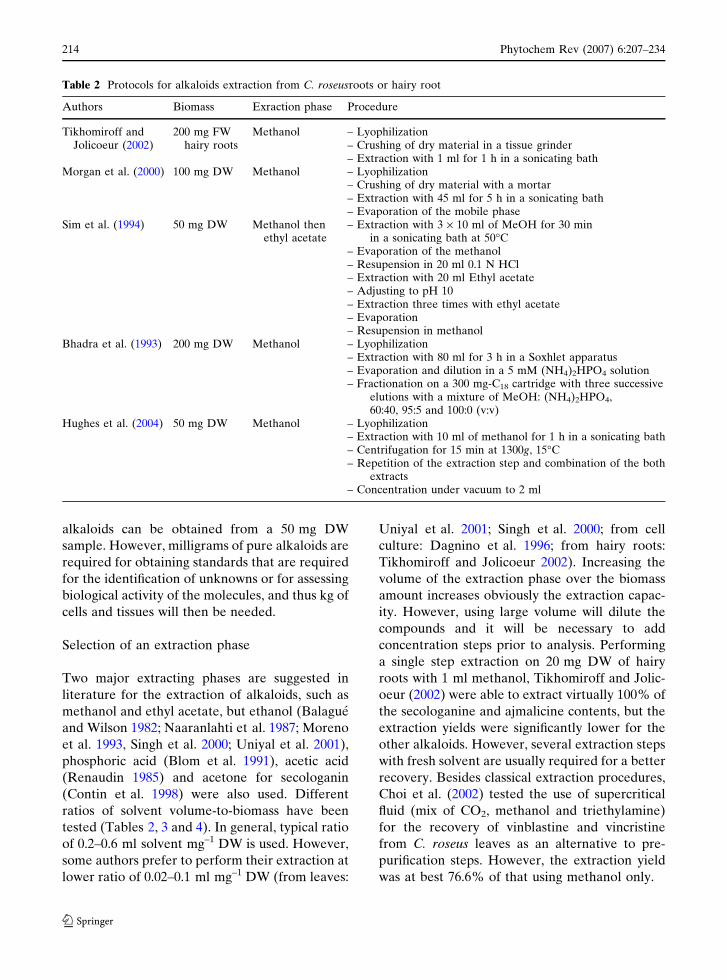
alkaloids can be obtained from a 50 mg DW
sample. However, milligrams of pure alkaloids are
required for obtaining standards that are required
for the identification of unknowns or for assessing
biological activity of the molecules, and thus kg of
cells and tissues will then be needed.
Selection of an extraction phase
Two major extracting phases are suggested in
literature for the extraction of alkaloids, such as
methanol and ethyl acetate, but ethanol (Balague
and Wilson 1982; Naaranlahti et al. 1987; Moreno
et al. 1993, Singh et al. 2000; Uniyal et al. 2001),
phosphoric acid (Blom et al. 1991), acetic acid
(Renaudin 1985) and acetone for secologanin
(Contin et al. 1998) were also used. Different
ratios of solvent volume-to-biomass have been
tested (Tables 2, 3 and 4). In general, typical ratio
of 0.2–0.6 ml solvent mg–1 DW is used. However,
some authors prefer to perform their extraction at
lower ratio of 0.02–0.1 ml mg–1 DW (from leaves:
Uniyal et al. 2001; Singh et al. 2000; from cell
culture: Dagnino et al. 1996; from hairy roots:
Tikhomiroff and Jolicoeur 2002). Increasing the
volume of the extraction phase over the biomass
amount increases obviously the extraction capac-
ity. However, using large volume will dilute the
compounds and it will be necessary to add
concentration steps prior to analysis. Performing
a single step extraction on 20 mg DW of hairy
roots with 1 ml methanol, Tikhomiroff and Jolic-
oeur (2002) were able to extract virtually 100% of
the secologanine and ajmalicine contents, but the
extraction yields were significantly lower for the
other alkaloids. However, several extraction steps
with fresh solvent are usually required for a better
recovery. Besides classical extraction procedures,
Choi et al. (2002) tested the use of supercritical
fluid (mix of CO2, methanol and triethylamine)
for the recovery of vinblastine and vincristine
from C. roseus leaves as an alternative to pre-
purification steps. However, the extraction yield
was at best 76.6% of that using methanol only.
Table 2 Protocols for alkaloids extraction from C. roseusroots or hairy root
Authors Biomass Exraction phase Procedure
Tikhomiroff andJolicoeur (2002)
200 mg FWhairy roots
Methanol – Lyophilization– Crushing of dry material in a tissue grinder– Extraction with 1 ml for 1 h in a sonicating bath
Morgan et al. (2000) 100 mg DW Methanol – Lyophilization– Crushing of dry material with a mortar– Extraction with 45 ml for 5 h in a sonicating bath– Evaporation of the mobile phase
Sim et al. (1994) 50 mg DW Methanol thenethyl acetate
– Extraction with 3 · 10 ml of MeOH for 30 minin a sonicating bath at 50�C
– Evaporation of the methanol– Resupension in 20 ml 0.1 N HCl– Extraction with 20 ml Ethyl acetate– Adjusting to pH 10– Extraction three times with ethyl acetate– Evaporation– Resupension in methanol
Bhadra et al. (1993) 200 mg DW Methanol – Lyophilization– Extraction with 80 ml for 3 h in a Soxhlet apparatus– Evaporation and dilution in a 5 mM (NH4)2HPO4 solution– Fractionation on a 300 mg-C18 cartridge with three successive
elutions with a mixture of MeOH: (NH4)2HPO4,60:40, 95:5 and 100:0 (v:v)
Hughes et al. (2004) 50 mg DW Methanol – Lyophilization– Extraction with 10 ml of methanol for 1 h in a sonicating bath– Centrifugation for 15 min at 1300g, 15�C– Repetition of the extraction step and combination of the both
extracts– Concentration under vacuum to 2 ml
214 Phytochem Rev (2007) 6:207–234
123

Selection of the extraction phase is crucial and
depends on the solubility of the alkaloids. Acidic
extractive solvents (pH = 1.5) are commonly used
and it seems to increase the stability and the
solubility of the alkaloids (Hallard et al. unpub-
lished results; see caption of Fig. 4 for the
complete reference). Solvent phase selection is
also dependent on the nature of the analysis to be
performed. For instance, using methanol as the
extraction phase and then running a HPLC
method with phosphate buffer should be avoided
because methanol can precipitate phosphate salts
in different HPLC parts (e.g. tubings, column and
pre-column, detectors, etc.). In addition, when
further molecular characterization has to be
performed using MS detector, non-volatile sol-
vents (especially phosphoric acid) should be
proscribed in order to prevent any damage to
the MS detector. For MS analysis, TFA should be
used with precaution because high TFA concen-
tration (0.1% w/v) causes ion-suppression in MS
and peak tailing can then be observed (Gustavs-
son et al. 2001; Annesley 2003). Finally, one may
require performing several successive extractions
using the same solvent or even different ones for
pre-cleaning purposes removing contaminating
compounds. For instance, TCA and acetone are
well known to cause protein precipitation,
whereas alkaloids remain in solution, and TFA
seems to cause precipitation of chlorophyll (Hal-
lard et al. unpublished results; see caption of
Fig. 4 for the complete reference).
Sample preparation
Cell membrane and debris as well as precipitated
macromolecules have to be removed from the
solvent after sample extraction. Liquid sample
clarification is usually achieved by centrifugation
at high speed (5 min, 15,000g) and/or by filtration
(see Table 3 for details). The liquid sample has to
be filtered through a submicron filter. A nylon or
PTFE membrane is adequate for solvents sug-
gested in literature (e.g. methanol or acetonitrile).
This step is essential to extend the HPLC column
life-time as well as the global performance of the
HPLC, including that of the injector. Even when
using SPE columns (Solid Phase Extraction),
filtration/centrifugation is a pre-requisite step
before cartridge loading.
Table 3 Protocols for alkaloids extraction from C. roseus leaves
Authors Biomass Extractionphase
Procedure
Uniyal et al.(2001)
5 g of oven-driedtissue
Ethanol – Oven-drying of the leaves for 48 h at 60�C– Extraction (3 · 30 ml) overnight at room temperature– Filtration and concentration in vacuo at 4�C– Dissolution in ethanol and dilution in 10 ml water
and 10 ml 3 mM HCl– Washing with hexane (3 · 30 ml)– pH 8.5 adjusting of the aqueous phase and cool down at 10�C– Extraction with chloroform (3 · 30 ml)– Washing with water– Evaporation of the chloroform phase– Resuspension in 1 ml of chloroform– Fractionation on SPE cartridge and elution with a
chloroform:methanol 90:10 solution– Evaporation then resuspension in Methanol
Singh et al.(2000)
5 g DW Ethanol – Extraction with 3 · 30 ml ethanol (12 h each at room temp.)– Filtration and concentration to 10 ml– Add 10 ml of water and 10 ml of 3% HCl– Washing three times with hexane– Alkalinization of the aqueous phase to pH 8.5– Extraction with chloroform (3 · 30 ml)– Washing with water– Concentration in vaccu-oven– Dissolution in 10 ml methanol
Phytochem Rev (2007) 6:207–234 215
123

Extraction protocols
Extraction of alkaloids from plant tissues or cells,
from culture medium and from adsorbent resins is
well documented. Commonly used techniques for
TIAs and precursors are summarized in the
following.
From biomass
Alkaloids extraction can be performed starting
with hard tissues such as plant leaves, stems,
roots (including hairy roots) and cell suspension.
After harvesting, plant material is frozen in
liquid nitrogen, ground at cold, freeze-dried and
then extracted using selected organic solvent.
Solvent volume and the number of extraction
steps need to be optimized in order to maximize
extraction yield. Since studies generally focus on
a particular type of biomass (e.g. cell suspension
or hairy roots or plants), extraction protocols are
generally biomass type specific. However, differ-
ent tissues can be extracted using a unique
protocol, as shown by Favali et al. (2004) ana-
lyzing leaves, stems and roots from plants
infected with phytoplasmas. In these works,
tissues were extracted in a Soxtec system using
methanol at 190�C for 2 h. However, the result-
ing extraction efficiency may be then lower
overall.
Table 4 Protocols for alkaloids extraction from cell suspension of C. roseus
Authors Biomass Extraction phase Procedure
Dagnino et al. (1996)(apolar alkaloids)
50 mgDW
Dichloromethane – Freeze-drying of the biomass– Wetting with 0.5 ml of water– Extraction with 5 ml of dichloromethane (repeat one more
time)– Drying and resuspension in acetonitrile
Dagnino et al. (1996)(alkaloids precursors)
50 mgDW
Methanol – Extraction with 5 ml of methanol of the dichloromethaneextracted biomass (repeat one more time)
– Drying and resupension in 0.5 ml 1 M phosphoric acidRenaudin (1985) 1–3 g
FWAcetic acid – Freezing and thawing of the fresh cells
– Extraction four times with 15 ml 0.01% (v/v) acetic acid(pH 4.0)
– Centrifugation 4200g for 5 min– Adjusting the pH between 7.3 and 7.5 with 1 M NaOH– Loading a SPE C18 cartridge– Rinsing with 60 ml methanol–25 mM ammonium dihydrogen
phosphate (pH 7.3) (10/90, v/v)– Elution with 2 ml methanol–25 mM ammonium dihydrogen
phosphate (pH 4.7) (85/15, v/v)Lee-Parsons et al. (2004) 250 mg
DWMethanol – Lyophilization
– Extraction with 25 ml methanol (one more time) for 3 h– Evaporation to dryness– Dissolution in an aqueous solution 10% acetonitrile + 0.1%
TFA– Loading on SPE C18– Elution with 100% acetonitrile plus 0.1% TFA– Evaporation and dissolution in aqueous 20% acetonitrile
plus 0.1% TFAMonforte-Gonzales et al.
(1992)1 g DW Methanol then
ethyl acetate– Lyophilization– Extraction with 50 ml methanol for 2 min in a Polytron
homogenizer– Incubation for 2 h at 55�C– Filtration– Evaporation and dissolution in 15 ml H2SO4
– Washing with 15 ml ethyl acetate (three times)– Adjusting the pH to 9.5– Extracting with 20 ml ethyl acetate (three times)– Evaporation and dissolution in 1 ml methanol
216 Phytochem Rev (2007) 6:207–234
123

From a liquid medium
Some authors analyze directly the alkaloids con-
tent of a culture medium without any preliminary
steps (Dagnino et al. 1995; Whitmer et al. 2002;
El-Sayed et al. 2004). However, the level in
alkaloids that are secreted in the medium is
generally too low to allow for a good detection
upon direct HPLC injection. It then becomes
essential to concentrate TIAs in the liquid sample.
Several methods can be used such as evaporation
at low temperature (e.g. lyophilization) and
liquid–liquid extraction (Asada and Shuler 1989;
Zhao et al. 2001; Satdive et al. 2003). The quicker
and most efficient method is a solid phase extrac-
tion using commercial cartridges with C18 packing
(Renaudin 1985; Hisiger and Jolicoeur 2005). In
addition to sample concentration, the use of SPE
cartridge allows to ‘‘clean’’ a sample. Based of the
strength of the solvent used for the elution step,
SPE cartridge can help to fractionate the sample.
It then becomes possible to generate different
fractions, based on the affinity of the compound
for the stationary phase, as for solid-chromatog-
raphy techniques (Bhadra et al. 1993; Renaudin
1984). If the aim is to recover all the alkaloids and
precursors within a unique liquid phase, elution
with a strong solvent such as 100% methanol or
100% acetonitrile is then recommended. Some
previous SPE methods used diatomite or cation-
exchange as solid phase (see the nice review from
van der Heijden et al. 1989). Now-a-days, octade-
cylsilyl is preferred for alkaloids preparation (Lee
and Shuler 2000; Renaudin 1985; Uniyal et al.
2001; Bhadra et al. 1993; McCalley 2002).
From adsorbent phases
Many research groups refer to the use of a solid
extraction phase in situ in the culture medium of
C. roseus suspension cells (Payne et al. 1988;
Asada and Shuler 1989; Lee-Parsons and Shuler
2002; Wong et al. 2004) and hairy roots (Sim et al.
1994). The most documented use of a solid
extraction phase in plant cell culture is the
Amberlite XAD-7 resins (but also XAD-4 and
others are used). This resin is made of a neutral
polymeric adsorbent that has shown a fast
adsorption rate and a weak selectivity among
alkaloids. XAD-7 resins were successfully em-
ployed to enhance the catharanthine and ajmal-
icine production levels in cell culture. Liquid
extraction phases have also been used in situ in
two-liquid-phase bioreactors, such as silicon oil
(Byun and Pedersen 1994; Tikhomiroff et al.
2002) and trycaprylin (Collins-Pavao and Chin
1996). However, liquid extraction phases usually
show high selectivity for some of the alkaloids.
Finally, after separation from the medium and
the cells, alkaloids are extracted from adsorbents
resins using methanol (Asada and Shuler 1989;
Wong et al. 2004) or methanol:HCl (95:5, v:v).
Similar protocols can be applied extracting alka-
loids from liquid extraction phases (Tikhomiroff
et al. 2002).
Estimation of the extraction yield
There is no universal method which can be
applied for the extraction of secondary metabo-
lites from C. roseus because TIAs have different
hydrophobicity levels. The selection of the extrac-
tion phase is then determinant to reach high
extraction yields and every step should be care-
fully optimized. A typical way in approximating
the extraction efficiency consists in spiking the
Fig. 4 UV chromatogram registered at 254 nm of astandard mixture of C. roseus alkaloids using the methoddeveloped by Hallard D, Vera Rocha RA, Sajjadi SE, vander Heijden R and Verpoorte R (unpublished results).Reproduced with the kind permission of Dr Verpoorte. 1,tryptamine; 2, perivine; 3, vindolinine; 4, yohimbine; 5,strictosidine; 6, ajmalicine; 7, serpentine; 8, catharanthine;9, vincristine; 10, vindoline; 11, vinblastine, 12, anhydro-vinblastine. The chromatographic conditions are describedin details in Table 7
Phytochem Rev (2007) 6:207–234 217
123

sample with a known amount of standard material
as soon as at the first step of the extraction
process; while crushing the tissues. However, this
method only gives an approximation because
there is a bias caused by the interaction of the
spiked alkaloids with the intracellular matrix, a
phenomena which can hardly be characterized.
Indeed, it has been suggested than some alkaloids
can form complexes with phenolics (Renaudin
et al. 1982; Renaudin 1989). Tikhomiroff and
Jolicoeur (2002) have reported low extraction
yields (<60%) when using a single methanol
extraction step for recovering intracellular ser-
pentine, vincristine, vindoline, cathranthine,
tabersonine and tryptophan from plant cells
whereas the yield was more than 85% for
vinblastine, tryptamine and ajmalicine. Interest-
ingly, Naaranlathi et al. (1987) found a 100%
extraction yield when spiking their leaves samples
with vindoline and catharanthine after extraction
with ethanol. Multiple successive extractions of
plant cells using acetone revealed an efficiency of
recovery for pure secologanin of only 7.5%
(Contin et al. 1998). Matrix effect can also hap-
pen during HPLC quantification. The use of an
internal standard, added to the sample, is thus
suggested to asses for matrix effect, extraction
efficiency and injection accuracy. It is then nec-
essary to choose a molecule which is absolutely
not present in the liquid sample, exhibits the same
behavior as the target compound(s) without co-
eluting which would interfere with the HPLC
analysis. 5-Methoxytryptamine has been used as
internal standard by Naaranlathi et al. (1987)
although the use of stable isotopic analogues
(deuterium labeled) can be even more efficient
when an MS detector is available (Auriola et al.
1991).
Pseudo-quantification methods
In the worst case when no standards are available,
one can estimate the total alkaloid content of a
sample selecting a wavelength at which most of
the alkaloids show a maximal response in absor-
bance or fluorescence. According to Monforte-
Gonzalez et al. (1992), total alkaloids can be
monitored by measuring the absorbance at
280 nm using a spectrophotometer. However,
the major problem here relies on the fact that
alkaloids and their precursors respond in absor-
bance or fluorescence at different levels. For
instance, tryptamine is 3 times more fluorescent
than tryptophan and 6 times more than ajmalicine
at 270/370 (Fig. 3). The alkaloids concentration
distribution in plant, plant cells and tissues is also
not similar neither constant with time, so it
becomes highly hazardous to establish a calibra-
tion between the signal in absorbance or fluores-
cence and the total alkaloid content of a sample.
This method is thus highly pseudo-quantitative
and is thought to be mostly useful for a quick pre-
screening of plant or cell lines. In addition, the
samples have to be thoroughly cleaned (see
Sample preparation section) to avoid any inter-
ference from the other metabolites that absorb in
UV or do fluoresce.
In the case of C. roseus, only few of the
required standards can be found commercially
(Table 5). Therefore, it is difficult to obtain most
of the standards. It is then feasible again to
proceed by approximation performing external
calibration using an available and quantifiable
alkaloid as the reference. Indeed, horhammeri-
cine and lochnericine can be quantified, based on
the response factor of tabersonine as they possess
Table 5 Some of commercially available C. roseus alka-loids
Compound Supplier
Vinblastine SIGMA (USA)Spectrum chemicals (USA)Vinkem Labs (India)
Vincristine SIGMA (USA)Eli Lilly (USA)Synnad Chemical Co (China)Southern Herbals Ltd (India)
Catharanthine Dayang Chemicals (China)Chemos GmBH (Germany)Kang’ai biological Products (China)ZYF Pharm Chemical (China)
Serpentine Apin chemicals (UK)Ajmalicine Extrasynthese (France)Yohimbine Extrasynthese (France)Vindoline Kang’ai biological Products (China)Tryptamine SIGMA (USA)
Note: It is not possible to screen for all the suppliersaround the world for C. roseus molecules, but this tablemay be useful to find quickly a supplier for a desiredstandard
218 Phytochem Rev (2007) 6:207–234
123

similar UV spectra and molecular extinction
coefficients (Rijhwani and Shanks 1998; Morgan
et al. 2000). In a similar way, coronaridine was
quantified upon the response factor of catharan-
thine (Morgan and Shanks 2002). Compounds
which have not the same response factor could
nevertheless be quantified, proceeding as follow.
It is then important to consider the molecular
extinction coefficient ratio for both molecules
independently quantified, in the mobile phase at
their respective retention time, and for the same
molar amount loaded on the HPLC column.
Thus, this suggests an initial calibration step using
external standards to assess for analytical bias
such as the matrix effect which can play on co-
eluting alkaloids.
Designing, selecting and transposing HPLCmethods
Numerous HPLC methods have been developed
for the analysis of alkaloids and precursors
content in C. roseus extracts (Tables 6 and 7).
In spite of several studies using C8 columns
(Gorog et al. 1977; Pennings et al. 1989) and
Phenyl columns (van der Heijden et al. 1987),
there is now a consensus for reverse phase
chromatography using C18 columns.
HPLC methods for the analysis of TIAs
TIAs are generally more hydrophobic than their
indole and iridoid precursors. It is then preferable
to develop a set of two HPLC separation meth-
ods, one for hydrophilic (precursors) and one for
hydrophobic (TIAs) molecules. A more polar
elution is then performed when analyzing precur-
sors as compared to alkaloids. The different
methods that have been developed are presented
in Table 7. It can be seen that some methods are
highly similar and may only differ because of
slight differences in equipment performance or
because of specific lab research goals. However,
one can obviously start developing a separation
method from published works. Bhadra and
Shanks (1997) modified a method previously
reported by Bhadra et al. (1993) changing the
C18 lBondapak 100 · 8 mm column (Waters) forTa
ble
6H
PL
Cm
eth
od
sfo
rth
ea
na
lysi
so
fth
eC
.ro
seu
sp
recu
rso
rs
Au
tho
rsC
om
po
un
ds
focu
sed
Re
ten
tio
nti
me
(min
)C
olu
mn
Mo
bil
eP
ha
seD
ete
ctio
nE
luti
on
gra
die
nt
an
dfl
ow
-ra
te
Tik
ho
mir
off
an
dJo
lico
eu
r(2
00
2)
Try
pto
ph
an
,3
.2Z
orb
ax
XD
BC
185
lm
,2
50
·4
.6m
m(A
gil
en
t)A
ceto
nit
rile
:10
0m
MH
3P
O4
(pH
2)
(15
:85
,v
:v)
Flu
ore
sce
nce
Ex
27
0/E
m3
70
Iso
cra
tic,
1.5
ml
min
–1
try
pta
min
e,
3.5
seco
log
an
in,
7.2
ajm
ali
cin
ea
12
.2D
ag
nin
oe
ta
l.(1
99
5)
Lo
ga
nic
aci
d,
5.5
LiC
hro
sph
er
60
RP
Se
lect
B5
lm2
50
·4
mm
(Me
rck
)1
%fo
rmic
aci
d–
ace
ton
itri
le–
tric
hlo
roa
ceti
ca
cid
(10
0:1
0:0
.25
v:v
:w)
PD
AIs
ocr
ati
c,1
.2m
lm
in–1
log
an
in,
13
.5se
colo
ga
nin
,2
2.5
try
pto
ph
an
,2
5.5
try
pta
min
e3
0.5
Pe
nn
ing
se
ta
l.(1
98
9)
Str
icto
sid
ine
,5
.6L
iCh
roso
rbR
P-8
Se
lect
B,
7lm
25
0·
4m
m(M
erc
k)
7m
MS
DS
an
d2
5m
MN
aH
2P
O4
inm
eth
an
ol:
wa
ter
(pH
6.2
)(6
8:3
2,
v:v
)
PD
AIs
ocr
ati
c,1
ml
min
–1
try
pta
min
e(f
rom
en
zym
ati
ca
ssa
y)
7
aT
his
alk
alo
idw
as
qu
an
tifi
ed
usi
ng
the
me
tho
ds
for
TIA
sp
recu
rso
rs
Phytochem Rev (2007) 6:207–234 219
123

Ta
ble
7H
PL
Cm
eth
od
sfo
rth
ea
na
lysi
so
fa
lka
loid
sfr
om
C.
rose
us
Au
tho
rsC
om
po
un
ds
focu
sse
dR
ete
nti
on
tim
e(m
in)
Co
lum
nM
ob
ile
Ph
ase
De
tect
ion
Elu
tio
ng
rad
ien
t
Mo
ren
o-
Va
len
zue
lae
ta
l.(1
99
8)
Ajm
ali
cin
e,
21
.8U
ltra
sph
ere
OD
S,
4lm
25
0·
4.6
mm
(Be
ckm
an
)
Ace
ton
itri
le:1
0m
M(N
H4) 2
HP
O4
(43
:57
,v
:v)
UV 2
80
nm
Iso
cra
tic,
1.5
ml
min
–1
yo
him
bin
e5
.9
Re
na
ud
in(1
98
4)
Ajm
ali
cin
e,
14
lBo
nd
ap
ack
C18
10
lm
30
0·
3.9
mm
(Wa
ters
)
Me
tha
no
l:5
mM
(NH
4) 2
HP
O4
(pH
7.3
)(6
7:3
3,
v:v
)
UV 2
54
nm
Iso
cra
tic,
1m
lm
in–1
vin
do
lin
e,
9.5
cath
ara
nth
ine
,1
6te
tra
hy
dro
als
ton
ine
22
Re
na
ud
in(1
98
4)
Ajm
ali
cin
e,
12
lBo
nd
ap
ack
C18
10
lm
30
0·
3.9
mm
(Wa
ters
)
Me
tha
no
l:5
mM
(NH
4) 2
HP
O4
(pH
7.3
)(7
1:2
9,
v:v
)
UV 2
54
nm
Iso
cra
tic,
1m
lm
in–1
cath
ara
nth
ine
,1
3v
inb
last
ine
,1
6se
rpe
nti
ne
19
Bh
ad
rae
ta
l.(1
99
3)
Ajm
ali
cin
e,
12
lBo
nd
ap
ack
C18
10
lm
10
0·
8m
m(W
ate
rs)
Me
tha
no
l:5
mM
(NH
4) 2
HP
O4
(pH
no
tm
en
tio
ne
d)
(67
:33
,v
:v)
UV 2
54
nm
Iso
cra
tic,
0.8
ml
min
–1
serp
en
tin
e,
59
.2ca
tha
ran
thin
e,
14
.5v
ind
oli
ne
,8
.5v
inb
last
ine
nd
Rij
hw
an
ia
nd
Sh
an
ks
(19
98
)
Ajm
ali
cin
e,
serp
en
tin
e,
tab
ers
on
ine
,h
orh
am
me
rici
ne
,lo
chn
eri
cin
e
N/A
C18
bo
nd
clo
ne
RP
10
lm
30
0·
3.9
mm
(Ph
en
om
en
ex
)
Me
tha
no
l:a
ceto
nit
rile
:5
mM
(NH
4) 2
HP
O4
(32
:32
:36
,v
:v:v
)
PD
AIs
ocr
ati
c,1
ml
min
–1
Le
ea
nd
Sh
ule
r(2
00
0)
Ajm
ali
cin
e,
19
.67
lBo
nd
ap
ack
C18
10
lm
30
0·
3.9
mm
(Wa
ters
)
Ace
ton
itri
le:
0.1
%(w
:v)
TF
Ain
wa
ter
(22
:78
,v
:v)
UV 2
54
nm
Iso
cra
tic,
1m
lm
in–1
cath
ara
nth
ine
,2
1.6
0se
rpe
nti
ne
23
.14
El-
Sa
ye
de
ta
l.(2
00
4)
Ste
mm
ad
en
ine
,7
.2V
yd
ac
C1
8R
P2
50
·4
.6m
m(V
yd
ac)
Ace
ton
itri
le:0
.1%
(w:v
)T
FA
inw
ate
r(2
1:7
9,
v:v
)
PD
AIs
ocr
ati
c,1
ml
min
–1
cath
ara
nth
ine
,2
1.7
tab
ers
on
ine
23
.5
Sim
et
al.
(19
94
)C
ath
ara
nth
ine
,a
jma
lici
ne
N/A
lBo
nd
ap
ack
C18
10
lm
30
0·
3.9
mm
(Wa
ters
)
Me
tha
no
l:a
ceto
nit
rile
:5
mM
(NH
4) 2
HP
O4(p
H7
.3)
(30
:40
:30
,v
:v:v
)
UV 2
98
nm
Iso
cra
tic,
1m
lm
in–1
220 Phytochem Rev (2007) 6:207–234
123

Ta
ble
7co
nti
nu
ed
Au
tho
rsC
om
po
un
ds
focu
sse
dR
ete
nti
on
tim
e(m
in)
Co
lum
nM
ob
ile
Ph
ase
De
tect
ion
Elu
tio
ng
rad
ien
t
Un
iya
le
ta
l.(2
00
1)
Vin
cris
tin
e,
14
.62
Sy
mm
etr
yC
18
5lm
15
0·
4m
m(W
ate
rs)
So
lven
tA
(pH
7.0
):M
eth
an
ol:
ace
ton
itri
le:
5m
MC
H3C
OO
NH
4:
trie
thy
lam
ine
(13
:32
:55
:0.2
,b
yv
olu
me
);S
olv
ent
B(p
H7
.0):
Me
tha
no
l:a
ceto
nit
rile
:5m
MC
H3C
OO
NH
4:t
rie
thy
lam
ine
(19
:46
:35
:0.2
,b
yv
olu
me
)
PD
A
020406080100
120
010
2030
Tim
e (m
in)
% B
40
0-15
min
: 0.
4 m
L m
in-1
15-2
0 m
in :
0.5
mL
min
-1
20-2
5 m
in :
0.7
mL
min
-1
25-3
0 m
in :
0.9
mL
min
-1
30-3
5 m
in :
1.2
mL
min
-1
cath
ara
nth
ine
,1
5.9
2v
ind
oli
ne
,1
9.6
vin
bla
stin
e1
8.0
2
Ch
ue
ta
l.(1
99
7)
Vin
cris
tin
e,
14
.8H
yp
ers
ilO
DS
,5
lm2
00
·4
.6m
m(A
gil
en
t)
So
lven
tA
:2
5m
MC
H3C
OO
NH
4in
wa
ter;
So
lven
tB
:2
5m
MC
H3C
OO
NH
4in
me
tha
no
l
ES
I-M
S
020406080
010
203 0
Tim
e (m
in)
% B
1 m
L m
in-1
vin
bla
stin
e2
1.3
Ch
oi
et
al.
(20
02
)V
inb
last
ine
,1
8Z
orb
ax
Bo
nu
sR
P-1
8,
5l
m1
50
·2
.1m
m(A
gil
en
t)
So
lven
tA
:2
0m
MC
H3C
OO
NH
4;
So
lven
tB
:A
ceto
nit
rile
ES
I-M
S
020406080
015
3045
Tim
e (m
in)
% B
0.2
mL
min
-1
vin
cris
tin
e2
1.5
Phytochem Rev (2007) 6:207–234 221
123
Ta
ble
7co
nti
nu
ed
Au
tho
rsC
om
po
un
ds
focu
sse
dR
ete
nti
on
tim
e(m
in)
Co
lum
nM
ob
ile
Ph
ase
De
tect
ion
Elu
tio
ng
rad
ien
t
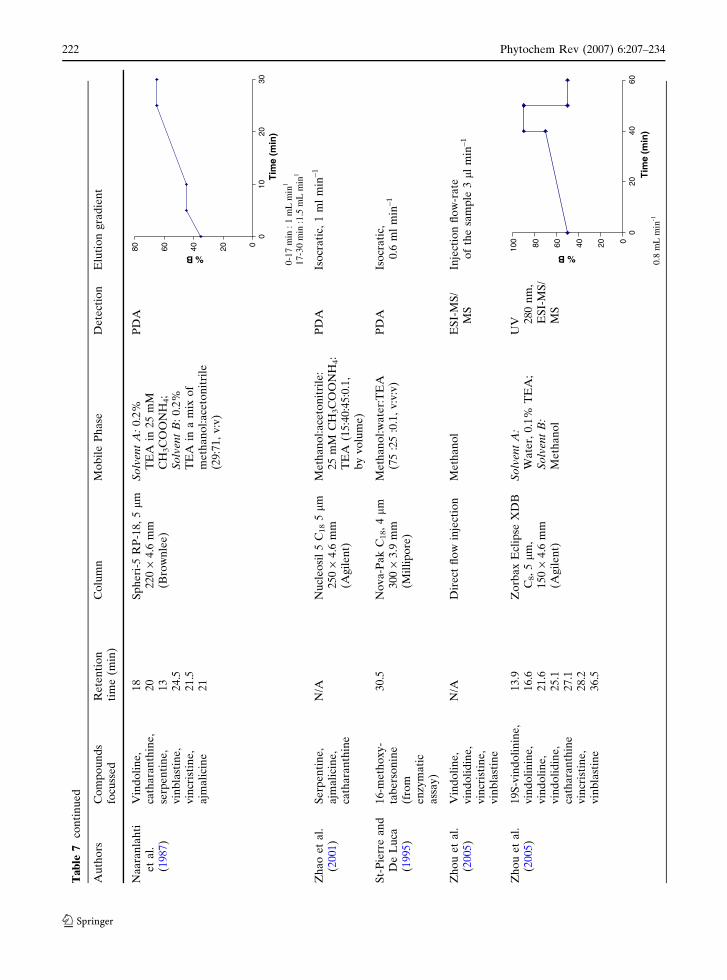
Na
ara
nla
hti
et
al.
(19
87
)
Vin
do
lin
e,
18
Sp
he
ri-5
RP
-18
,5
lm2
20
·4
.6m
m(B
row
nle
e)
So
lven
tA
:0
.2%
TE
Ain
25
mM
CH
3C
OO
NH
4;
So
lven
tB
:0
.2%
TE
Ain
am
ixo
fm
eth
an
ol:
ace
ton
itri
le(2
9:7
1,
v:v
)
PD
A
020406080
010
2030
Tim
e (m
in)
% B
0-17
min
: 1
mL
min
1
17-3
0 m
in :1
.5 m
L m
in1
cath
ara
nth
ine
,2
0se
rpe
nti
ne
,1
3v
inb
last
ine
,2
4.5
vin
cris
tin
e,
21
.5a
jma
lici
ne
21
Zh
ao
et
al.
(20
01
)S
erp
en
tin
e,
ajm
ali
cin
e,
cath
ara
nth
ine
N/A
Nu
cle
osi
l5
C18
5l
m2
50
·4
.6m
m(A
gil
en
t)
Me
tha
no
l:a
ceto
nit
rile
:2
5m
MC
H3C
OO
NH
4:
TE
A(1
5:4
0:4
5:0
.1,
by
vo
lum
e)
PD
AIs
ocr
ati
c,1
ml
min
–1
St-
Pie
rre
an
dD
eL
uca
(19
95
)
16
-me
tho
xy
-ta
be
rso
nin
e(f
rom
en
zym
ati
ca
ssa
y)
30
.5N
ov
a-P
ak
C18,
4l
m3
00
·3
.9m
m(M
illi
po
re)
Me
tha
no
l:w
ate
r:T
EA
(75
:25
:0.1
,v
:v:v
)P
DA
Iso
cra
tic,
0.6
ml
min
–1
Zh
ou
et
al.
(20
05
)V
ind
oli
ne
,v
ind
oli
din
e,
vin
cris
tin
e,
vin
bla
stin
e
N/A
Dir
ect
flo
win
ject
ion
Me
tha
no
lE
SI-
MS
/M
SIn
ject
ion
flo
w-r
ate
of
the
sam
ple
3ll
min
–1
Zh
ou
et
al.
(20
05
)1
9S
-vin
do
lin
ine
,1
3.9
Zo
rba
xE
clip
seX
DB
C8,
5lm
,1
50
·4
.6m
m(A
gil
en
t)
So
lven
tA
:W
ate
r,0
.1%
TE
A;
So
lven
tB
:M
eth
an
ol
UV 2
80
nm
,E
SI-
MS
/M
S
020406080100
020
4060
Tim
e (m
in)
% B
0.8
mL
min
-1
vin
do
lin
ine
,1
6.6
vin
do
lin
e,
21
.6v
ind
oli
din
e,
25
.1ca
tha
ran
thin
e2
7.1
vin
cris
tin
e,
28
.2v
inb
last
ine
36
.5
222 Phytochem Rev (2007) 6:207–234
123

Ta
ble
7co
nti
nu
ed
Au
tho
rsC
om
po
un
ds
focu
sse
dR
ete
nti
on
tim
e(m
in)
Co
lum
nM
ob
ile
Ph
ase
De
tect
ion
Elu
tio
ng
rad
ien
t
Ae
rts
et
al.
(19
94
)C
ath
ara
nth
ine
,v
ind
oli
ne
,ta
be
rso
nin
e
N/A
Hy
pe
rsil
OD
S,
5l
m2
00
·2
.1m
m(A
gil
en
t)
So
lven
tA
:W
ate
r,0
.1%
TE
A;
So
lven
tB
:A
ceto
nit
rile
,0
.1%
TE
A
PD
A
020406080
010
203 0
Tim
e (m
in)
% B
Ba
rth
ee
ta
l.(2
00
2)
Vin
do
lin
e,
6.0
XT
err
aR
P-1
8,
5l
m2
50
·4
.6m
m(W
ate
rs)
Ace
ton
itri
le:w
ate
r:b
ori
ca
cid
(pH
10
)(5
5:4
5:3
.1,
v:v
:w)
UV 2
14
nm
Iso
cra
tic,
1m
lm
in–1
vio
relb
ine
,1
4.6
an
hy
dro
vin
bla
stin
e,
20
.8v
infl
un
ine
,1
0.4
cath
ara
nth
ine
8.8
Au
rio
lae
ta
l.(1
98
9)
Try
pta
min
e,
2l
Bo
nd
ap
ak
C18,
10
lm3
00
·3
.9m
m
Ace
ton
itri
le:0
.1M
CH
3C
OO
NH
4
(pH
7.2
)(4
9:5
1,
v:v
)
UV 2
80
nm
,T
SP
-MS
Iso
cra
tic,
1m
lm
in–1
ajm
ali
cin
e,
5.5
serp
en
tin
e,
8ca
tha
ran
thin
e,
10
tab
ers
on
ine
18
To
ivo
ne
ne
ta
l.(1
99
1)
Ajm
ali
cin
e,
cath
ara
nth
ine
,ta
be
rso
nin
e
N/A
Hy
pe
rsil
OD
S,
5lm
10
0·
2.1
mm
(Ag
ile
nt)
So
lven
tA
:1
4m
MT
EA
inC
H3C
OO
NH
4;
So
lven
tB
:1
4m
MT
EA
inM
eth
an
ol:
ace
ton
itri
le(5
0:5
0,
v:v
)
PD
A
0204060
010
2030
40
Tim
e (m
in)
% B
0.4
mL
min
-1
Phytochem Rev (2007) 6:207–234 223
123

Ta
ble
7co
nti
nu
ed
Au
tho
rsC
om
po
un
ds
focu
sse
dR
ete
nti
on
tim
e(m
in)
Co
lum
nM
ob
ile
Ph
ase
De
tect
ion
Elu
tio
ng
rad
ien
t
Tik
ho
mir
off
an
dJo
lico
eu
r(2
00
2)
Ca
tha
ran
thin
e,
14
.5Z
orb
ax
XD
BC
18
5lm
25
0·
4.6
mm
(Ag
ile
nt)
So
lven
tA
:5
mM
KH
2P
O4
(pH
6);
So
lven
tB
:A
ceto
nit
rile
PD
A
020406080
010
203 0
Tim
e (m
in)
% B
2 m
L m
in-1
serp
en
tin
e,
7.8
vin
do
lin
e,
13
.5v
incr
isti
ne
,1
3.1
vin
bla
stin
e,
15
.2ta
be
rso
nin
e2
0.8
Sin
gh
et
al.
(20
00
)C
ath
ara
nth
ine
,1
2.3
2lB
on
da
pa
ckC
18,
10
lm
30
0·
3.9
mm
(Wa
ters
)
Ace
ton
itri
le:0
.1M
Ph
osp
ha
teb
uff
er:
gla
cia
la
eti
ca
cid
(pH
4.1
4)
(38
:62
:0.3
,v
:v:v
)
PD
AIs
ocr
ati
c,0
.6m
lm
in–1
vin
do
lin
e,
13
.54
vin
cris
tin
e,
10
.15
vin
bla
stin
e1
1.3
4
Le
e-P
ars
on
se
ta
l.(2
00
4)
Try
pta
min
e5
Lu
na
C18
5lm
15
0·
4.6
mm
(Ph
en
om
en
ex
)
So
lven
tA
:W
ate
r,S
olv
ent
B:
Ace
ton
itri
le,
So
lven
tC
:F
orm
ica
cid
(ke
pt
at
0.1
%o
fth
eto
tal
elu
tio
nv
olu
me
)
UV 2
54
nm
0510152025
010
2030
4050
Tim
e (m
in)
% B
1 m
L m
in-1
ajm
ali
cin
e,
34
serp
en
tin
e3
7
Sch
rod
er
et
al.
(19
99
)
Ta
be
rso
nin
e,
16
-hy
dro
xy
-ta
be
rso
nin
e,
16
-me
tho
xy
-ta
be
rso
nin
e
26
.7N
ucl
eo
sil
C18
5lm
20
0·
4m
m(A
gil
en
t)
So
lven
tA
:0
.2%
Na
OH
inw
ate
r,S
olv
ent
B:
Ace
ton
itri
le
PD
A
020406080
010
2030
Tim
e (m
in)
% B
1 m
L m
in-1
13
.02
6.2
224 Phytochem Rev (2007) 6:207–234
123
Ta
ble
7co
nti
nu
ed
Au
tho
rsC
om
po
un
ds
focu
sse
dR
ete
nti
on
tim
e(m
in)
Co
lum
nM
ob
ile
Ph
ase
De
tect
ion
Elu
tio
ng
rad
ien
t
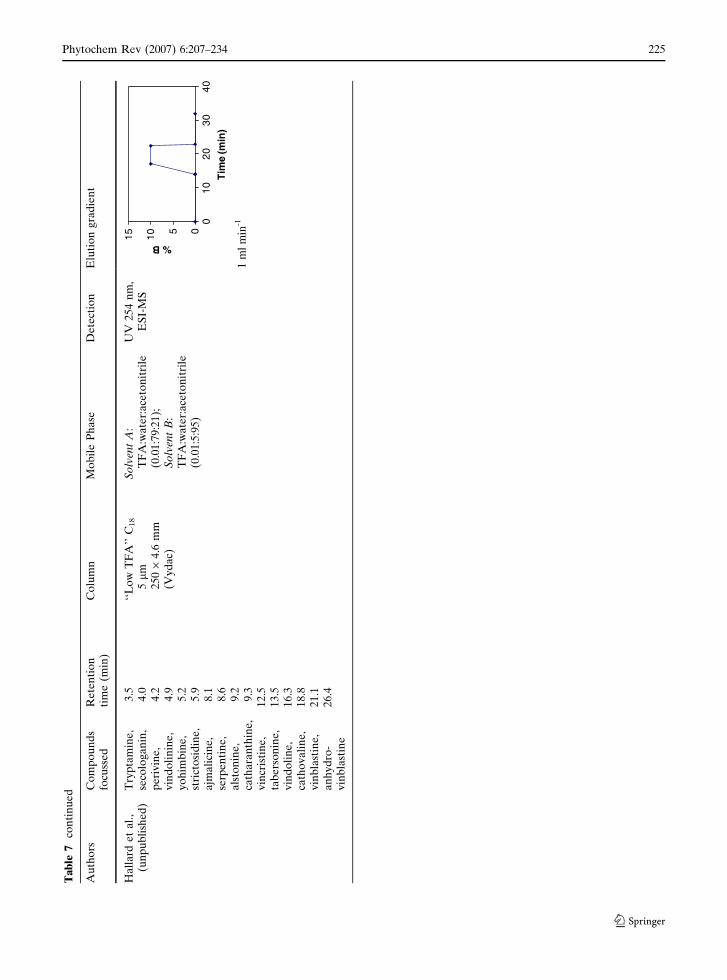
Ha
lla
rde
ta
l.,
(un
pu
bli
she
d)
Try
pta
min
e,
3.5
‘‘L
ow
TF
A’’
C18
5lm
25
0·
4.6
mm
(Vy
da
c)
So
lven
tA
:T
FA
:wa
ter:
ace
ton
itri
le(0
.01
:79
:21
);S
olv
ent
B:
TF
A:w
ate
r:a
ceto
nit
rile
(0.0
1:5
:95
)
UV
25
4n
m,
ES
I-M
S
05
10
15
01
02
03
04
0
Tim
e (m
in)
% B
1 m
l min
-1
seco
log
an
in,
4.0
pe
riv
ine
,4
.2v
ind
oli
nin
e,
4.9
yo
him
bin
e,
5.2
stri
cto
sid
ine
,5
.9a
jma
lici
ne
,8
.1se
rpe
nti
ne
,8
.6a
lsto
nin
e,
9.2
cath
ara
nth
ine
,9
.3v
incr
isti
ne
,1
2.5
tab
ers
on
ine
,1
3.5
vin
do
lin
e,
16
.3ca
tho
va
lin
e,
18
.8v
inb
last
ine
,2
1.1
an
hy
dro
-v
inb
last
ine
26
.4
Phytochem Rev (2007) 6:207–234 225
123

a C18Bondclone, 10 lm, 300 · 3.8 mm column
(Phenomenex), and using a gradient flow
mode with a mixture of methanol and 5 mM
(NH4)2HPO4 (pH 7.3) (58:42, v:v). Using the
modified method, pure peaks were obtained for
ajmalicine, serpentine and tabersonine but cath-
aranthine could not be quantified due to UV
interfering compounds. With the same Bondclone
column, quantification of ajmalicine, serpentine,
tabersonine, horhammericine and lochnericine
was successful using an isocratic elution at
1 ml min–1 (Table 7). Alkaloids metabolism in
wounded seedlings was studied by Vazquez-Flota
et al. (2004) using the method previously devel-
oped by Aerts et al. (1994) in a study on the effect
of methyl jasmonate vapor on C. roseus seedlings.
The method developed by Tikhomiroff and
Jolicoeur (2002) for screening secondary metab-
olites in hairy roots, was recently used for the
analysis of the accumulation of alkaloids in
different plant cultivars (Dutta et al. 2005).
There are multiple approaches when develop-
ing a HPLC separation method and the following
basic considerations have to be considered. In the
case of TIAs analysis, there is no consensus on
mobile phase selection. An effective separation
can be achieved using a saline buffer with
potassium phosphate or ammonium acetate as
aqueous phase, and methanol or acetonitrile as
organic phase (Bhadra et al. 1993; Moreno-Val-
enzuela et al. 1998; Choi et al. 2002; Tikhomiroff
et al. 2002). These methods seem to be inspired
from the early works of Renaudin (1984) on the
separation of ajmalicine, catharanthine, serpen-
tine, vindoline and vinblastine. Other studies are
suggesting the use of ion-pairing additives such as
TEA or TFA, which are commonly used for
masking non-derivatized silanol groups (Aerts
et al. 1994; St-Pierre and De Luca 1995; Lee and
Shuler 2000; Zhao et al. 2001; Uniyal et al. 2001;
El-Sayed et al. 2004). These HPLC methods
using ion-pairing reagents have been first devel-
oped by Naaranlathi et al. (1987). With a neutral
pH, ion-exchange interactions and hydrogen
bonding can occur between dissociated silanol
and protonated (or partially protonated) alka-
loids (Nawrocki 1997; McCalley 2002), which
usually results in peak tailing. TEA allows com-
peting alkaloids for the silanol sites. It is usually
observed that an old column (hopefully after
running few thousands of samples) offers a
weaker retention of alkaloids with low pKa (e.g.
ajmalicine) but a stronger retention of com-
pounds with high pKa (as tryptamine and ser-
pentine) than a new column (Renaudin 1984).
This phenomenon is thought to be due to the
degradation of the hydrophobic stationary phase
resulting from the uncapping of the silanol groups
following the disruption of the C18 alkyl chains.
The presence of amine modifier agents in the
mobile phase modulates the interaction of the
stationary phase with basic analytes (e.g. alka-
loids) and can thus change the elution sequence.
It then becomes tedious to compare the methods.
Competitive amines can be used to enhance
peaks shape at neutral pH and reducing peak
tailing (Nawrocki 1997; McCalley 2002). Mobile
phase pH is an important parameter and acidic
pH (pH 3–4) enables better peak shape for basic
alkaloids. At low pH, most of silanol groups are
undissociated and ion-exchange interactions are
then limited, even if alkaloids are protonated
(McCalley 2002). Alkaline pH (pH 10) was only
tested by Barthe et al. (2002), to our knowledge.
Multiple columns can be found commercially if
one chooses to work at extreme alkaline pH but it
should be noted that past-generation columns
(e.g. C8, Phenyl and C18) cannot be used at high
pH because the destruction of the stationary
phase may be induced. In every cases (acidic or
basic mobile phases), methods should employ a
pH which is far from the pKa of the target
compounds, since weak variations in the mobile
phase preparation can change the degree of
protonation of the alkaloids, and thus influence
the elution pattern and the reproducibility in the
retention times (Uniyal et al. 2001; McCalley
2002). Uniyal et al. (2001) observed that the
elution time pattern changed from catharanthine,
vincristine, vinblastine and vindoline at pH 6, to
vincristine, vindoline, catharanthine and vinblas-
tine at pH 7.5. Using a phosphate buffer at pH 6
with acetonitrile as mobile phase, Tikhomiroff
and Jolicoeur (2002) obtained the same elution
sequence than that obtained at pH 7.5 by Uniyal
et al. (2001). This discrepancy may be explained
because Uniyal et al. (2001) used TEA and a
different column, resulting in a different silanol
226 Phytochem Rev (2007) 6:207–234
123

activity of the column packing. Barthe et al.
(2002) found that the elution sequence for vind-
oline and cathranthine was reversed changing the
mobile phase pH from 5 to 10. Therefore, a
judicious combination of buffer and mobile phase
pH can be helpful when designing a separation
method focusing on specific peaks. For instance,
adjustment of the mobile phase pH at 4.7 instead
of 3.9 allowed separating strictosidine and non-
polar alkaloids from an extract of Tabernaemon-
tana divaricata (Dagnino et al. 1995). Using an
isocratic elution, satisfactory separation of alka-
loids can be achieved (Table 7). Bhadra et al.
(1993) and Rijhwani and Shanks (1998) were able
to separate up tofive alkaloids within a unique run
for C. roseus metabolites. Van der Heijden et al.
(1987) used an isocratic HPLC method previ-
ously developed for Tabernaemontana species.
Furthermore, separation of the alkaloids can be
greatly improved by using a gradient elution
(Naaranlahti et al. 1987; Tikhomiroff et al. 2002).
It allows achieving a good separation without
extending HPLC run time. A typical UV-chro-
matogram obtained from the separation of a
standard mixture of 12 C. roseus secondary
metabolites using the gradient method developed
by Hallard et al. (unpublished results reproduced
with the kind permission of Dr. Verpoorte; see
Fig. 4 caption for the complete list of authors), is
presented in Fig. 4. Some co-eluting peaks cannot
be accurately quantified by UV, but they were
discriminated using an ESI-MS detector in single
ion recording mode, based on the mass of the
protonated molecule (not shown). Analysis of a
crude extract of C. roseus hairy roots using the
gradient method developed by Tikhomiroff and
Jolicoeur (2002) is presented in Fig. 5a. All the
alkaloids are eluted within a 23 min run. The
examples presented in this review show the
advantage of a gradient method for the separation
of complex mixtures of C. roseus alkaloids which
allow separating up to twelve known compounds
in the same run.
HPLC methods for the analysis of precursors
For the analysis of indole and iridoid precursors
(Table 6), Tikhomiroff and Jolicoeur (2002)
adapted the method of Dagnino et al. (1996).
For both indole and iridoid precursors, an acidic
aqueous mobile phase (pH 1.8 or 2) was used to
preserve an adequate peak shape for secologanin
(Dagnino et al. 1996). Modulating TCA concen-
tration in Dagnino’s method allowed varying the
retention time of tryptophan and tryptamine.
Using a similar C18 HPLC column, Tikhomiroff
and Jolicoeur (2002) were able to achieve the
separation of the indole precursors and secolog-
anin in less than 8 min by increasing the flow rate
without using an ion-pairing molecule. Trypt-
amine can also be analyzed in the same run than
TIAs (Auriola et al. 1989; Moreno et al. 1993;
Lee-Parsons et al. 2004).
Scaling-up a method
As a litany stated along this review, the major
limitation in developing effective separation and
identification methods relies in the lack of stan-
dards for most of C. roseus secondary metabo-
lites. However, if a lab is conducting metabolic
studies or is screening for therapeutics, it may
become essential to have access to those unavail-
able standards. Transfer between academics is a
simple and efficient way but could be difficult
when several milligrams of pure compounds are
asked. A lab may then be obliged to upscale a
separation method from the analytical to the
semi-preparative (semi-prep) scale. It is thus
important to consider this issue already when
developing an analytical method because some
early precautions may save a lot of time and
efforts at the further developmental stages,
including industrial. The important parameters
not to forget are the column type and the HPLC
system supplier. The choice of the column is
important because a rigorous scale-up can be
done more easily using a larger diameter column
having the same length and packing that the one
used at analytical scale. Total pressure of the
system is also an important parameter to consider
preventing from packing bed deterioration. Pres-
sure is building-up in the column and the guard-
column and is amplified by the viscosity of the
mobile phase. It is also highly helpful to select a
flow rate range for the analytical method enabling
the use of the same HPLC pump for the semi-
prep method.
Phytochem Rev (2007) 6:207–234 227
123

An example of an analytical method that has
been scaled-up to a semi-prep method is given in
the following. The analytical method developed
for TIAs by Tikhomiroff and Jolicoeur (2002) was
slightly modified. First, the phosphate buffer was
changed for ammonium acetate buffer, which is
more volatile and can thus be easily used in
combination to the MS detector for further
characterization of the fractions collected. Sec-
ond, the flow rate was divided from 2 to 1 ml min–
1. Since the diameter of the semi-prep column was
2 times that of the analytical one, it was necessary
to increase the flow rate to 4 ml min–1 for the
semi-preparative run, to preserve similar
chromatographic conditions. The run was 7 min
longer but the separation remained satisfactory
and the pressure limit of the HPLC system was
not exceeded. The chromatograms obtained for
the analytical and semi-prep methods shown to be
highly similar (Fig. 5). The analytical and semi-
prep methods used injection volumes of 20 and
250 ll, respectively. The use of a PDA detector
with a larger cell adapted for semi-prep flow
rates explains the similar absorbance in both
injections. This semi-prep method was designed
for the recovery of standards, for both the known
0.0 2.5 5.0 7.5 10.0 12.5 15.0 17.5 20.0 22.5 25.0 27.5 30.0 32.5 35.0
0.0 2.5 5.0 7.5 10.0 12.5 15.0 17.5 20.0 22.5 25.0 27.5 30.0 32.5 35.0
mA
Um
AU
mA
Um
AU
0
1200
200
400
600
800
1000
200
400
600
800
1000
0
200
400
600
800
10001 4 a
3
2 6 75
0 0
200
400
600
800
1000
12001 4 b
3
25 6 7
Minutes
Minutes
Fig. 5 Analytical method (a) and semi-prep method (b)developed from the modification of the Tikhomiroff andJolicoeur (2002) method. Mobile phase was CH3COONH4
50 mM pH 6 (solvent A) and acetonitrile (solvent B). Theflow rate was 1 ml min–1 for the analytical method and4 ml min–1 for the semi-prep method The eluent profile(volume solvent A: volume solvent B) was the same forboth methods: 0–20 min, linear gradient from 80:20 to
20:80; 20–30 min, isocratic elution with a 20:80 mixture; 30–35 min: isocratic elution 80:20 for column equilibration.1,serpentine; 2, unknown T1; 3, catharanthine; 4, lochneri-cine; 5, unknown T3; 6, tabersonine; 7, unknown T4. Thealkaloids extract was pre-purified using a Strata C18-T SPEcartridge (Phenomenex, Torrance, USA) (unpublisheddata)
228 Phytochem Rev (2007) 6:207–234
123

molecules as well as for some unidentified alka-
loids. A fraction collector was used and each peak
was collected based on the slope of the absor-
bance signal at 296 nm. The collected fractions
could then be further analyzed for purity through
MS-MS or 1H-NMR detection. Since hundreds
of molecules elute from a single injection, some
compounds may unfortunately co-elute. Thus,
the use of semi-prep columns may be of inter-
est for pre-fractionation of a complex mixture
(Mans et al. 2000). This method allows ‘‘cutting’’
the chromatogram into several fractions contain-
ing, hopefully, one to ten alkaloids each.
Then, the fractions can be separated under
modified HPLC conditions, and used for bioac-
tivity screening.
Other useful analytical techniques
While TLC was historically seen as an interesting
low cost technique, capillary electrophoresis (CE)
and CZE (capillary zone electrophoresis) is now
gaining in interest. The reader is invited to consult
the review of Stockigt et al. (2002) on the use of
CZE for the analysis of alkaloids. CE allows
separation of charged molecules based on the
mass-to-charge ratio in an electric field. Due to
their high pKa, alkaloids are present in their
protonated form when using an acidic buffer.
CZE was used for the separation of the bisindole
vincristine and vinblastine from a crude leaf
extract (Chu et al. 1996). Barthe et al. (2002)
have used a non-aqueous electrophoretic buffer
for separating 11 Vinca alkaloids in less than
10 min. The running buffer consisted in 50 mM
ammonium acetate and 0.6 M acetic acid in an
organic mixture of methanol–acetonitrile (75:25,
v:v). A constant voltage of 25 kV was applied and
the temperature of the capillary was kept at 20�C.
Unfortunately, this non-aqueous capillary elec-
trophoresis method has not been tested on plant
extract.
Preparative-scale continuous separation of
enantiomers by CE has also been reported
(Spanik 2002) but scale-up potential of CE for
phytochemicals has still to be demonstrated
(Suntornsuk 2002). Indeed, CE may be an alter-
native for the analysis of indole alkaloids in crude
extracts. This technique combines the selectivity
of HPLC stationary phase with that resulting
from the application of an electric field (McCalley
2002). It has been reported that a C18 stationary
phase with a charged surface allows effective
electroosmotic flow and an efficient separation
(Zimina et al. 1997). However, the limit of
detection for HPLC analysis is still lower that
that for CE and this is probably due to the low
sample volume injected in CE (Barthe et al. 2002;
Drager 2002).
Future developments
HPLC methods and equipments
There are many improvements that can be
achieved to make HPLC an even more powerful
analytical technique. We think that the objective
for improving HPLC technique should be to
simplify method scale-up procedures and enhance
the capacity for integrating more powerful detec-
tors. In addition to UV and fluorescence spectra
determination, measurement of the molecular
weight for each peak can be highly useful to
analyze plant or cell extracts. Molecular weights
of C. roseus metabolites have been recently
presented by van der Heijden et al. (2004) in a
review inspired from the Dictionary of Natural
Products. The use of MS detection, as TSP-MS
(Thermospray), ESI-MS (Electrospray Ionization
Mass Spectrometry) or MALDI-TOF (Matrix
Assisted Laser Desorption with Time-of-Flight)
can enhance the identification of low abundant
compounds and of non-pure peaks with a higher
precision than UV spectra. However, as discussed
previously, because of the silanol activity of
HPLC packing, an acidic mobile phase is used
to limit peak tailing and ensure batch to batch
reproducibility. Although amine modifiers can be
included in the mobile phase as masking agents,
their use is not recommended for ESI-MS detec-
tion since an ion-suppression phenomenon can be
generated and then greatly reduce the sensitivity
of the instrument (Gustavsson et al. 2001; Anti-
gnac et al. 2005). The introduction on the market
of columns integrating a carbamate internal
group in bonded phase seemed to have solved
this problem. Peak tailing showed to be reduced
Phytochem Rev (2007) 6:207–234 229
123

for basic compounds as compared to traditional
C18 alkyl packing (O’Gara et al. 1999). The
choice of different MS interfaces for the analysis
of alkaloids has been reviewed (Verpoorte and
Niessen 1994). The use of LC-TSP-MS allowed
quantification of tryptamine, ajmalicine, serpen-
tine, catharanthine and tabersonine (Auriola
et al. 1989). Hallard (unpublished data, see cap-
tion of Fig. 4 for complete reference) developed a
LC-ESI-MS method allowing quantification of 10
alkaloids and 19 precursors. Using a HPLC
separation system coupled to an ESI interface,
Chu et al. (1997) detected vincristine and vin-
blastine in plant extracts at a limit of detection of
0.2 lg ml–1. The sensitivity for these compounds
was 2–3 times higher in ESI-MS rather than with
UV detection. In addition of increasing the
sensitivity, ESI-MS will help to achieve the
identification of the numerous compounds which
can not be actually identified from a UV detector
because some secondary metabolites possess
highly similar UV-spectra. Zhou et al. (2005)
were able to analyze vindoline, vindolidine, vin-
cristine and vinblastine in a commercial prepara-
tion by direct injection ESI-MS-MS. This is
obviously shortening the time for the identifica-
tion of these molecules. However, the authors
mentioned that HPLC separation is required,
followed by ESI-MS-MS to discriminate catha-
ranthine from the two isomers vindolinine and
19S-vindolinine, which all have a m/z ratio of 337.
Maldi-TOF analysis of crude extract represents a
quick technique for fast screening of different
strains and cell lines for their vinblastine or
vincristine contents, as proposed by Contin and
van der Heijden (unpublished results, cited in van
der Heijden et al. 2004). However, single quad-
rupole MS detector may not be sufficient for
absolute peak identification because many metab-
olites posses the same molecular weight. For
instance, 13 alkaloids from C. roseus have a
similar molecular weight of 352.432 g mol–1.
Identification of such molecules should be
achieved after molecular fragmentation in a
tandem mass spectrometer and/or by 1H-NMR
analysis. Transposition of HPLC methods devel-
oped for UV or fluorescence detector to MS
detector is possible if the methods are using a
volatile buffer as mobile phase. However, most
common HPLC methods are based on non-
volatile buffers, such as phosphate buffer, which
are not compatible with MS detection (Law and
Temesi 2000). Also, since the elucidation of the
structure of many alkaloids is achieved by 1H-
NMR, the association of such detection with the
power of separation of HPLC could be highly
efficient. Such an approach was presented by
Bobzin et al. (2000) for the determination of
marine alkaloids as inhibitors of an enzyme
implicated in the type II diabetes. HPLC-NMR
was also used for the screening of plant extracts
(Bringmann et al. 1999, 2000, 2002; Zhao et al.
1999). To our knowledge, however, this method
has never been used with C. roseus crude extracts.
Coupling NMR detection to HPLC is though to
be the unique method for the elucidation of
isomers.
Conclusion
This article has presented a review on the
significant effort of the scientific community to
develop efficient and reliable HPLC methods for
the analysis of C. roseus alkaloids. There are
some other analytical techniques such as TLC and
CE that have also been presented but emphasis
has been placed on HPLC because it can be easily
scaled-up. This article has then reviewed the most
recent developments in HPLC analysis of alka-
loids from C. roseus. The diverse considerations
and the crucial steps to achieve an efficient
separation and identification of secondary metab-
olites were enumerated and discussed. Biomass
manipulation, choice of an extraction phase and
of the extraction protocols as well as HPLC
separation and analysis protocols were then
reviewed in details. Furthermore, examples of
spectra obtained using most common detectors
were also shown. Finally, suggestions were made
on how to proceed for developing efficient sep-
aration and identification methods, based on
literature.
The screening of C. roseus secondary metabo-
lites represents a challenge for the pharmaceuti-
cal industry. The synthesis of the bisindole
alkaloids vinblastine and vincristine may be
performed industrially through chemical synthesis
230 Phytochem Rev (2007) 6:207–234
123

or from genetically modified plant cells in a near
future. The modification of C. roseus metabolic
pathways or the insertion of C. roseus genes in
other plant species may also result in an increase
of the biodiversity of the alkaloids obtained (van
der Heijden et al. 2004). Thus, many novel
unknown alkaloids of therapeutic interest may
then be obtained in the future and these new
compounds will have to be separated, identified
and tested using HPLC. The development of a
successful HPLC method is thus a crucial step in
the process of identifying the therapeutic
potential of phytochemicals such as those from
C. roseus.
Acknowledgements Authors wish to thank Dr.Verpoorte for his kind permission to include in thispaper his unpublished work shown as Fig. 4.
References
Abel U, Koch C, Speitling M, Hansske FG (2002) Modernmethods to produce natural-product libraries. CurrOpin Chem Biol 6:453–458
Aerts RJ, Gisi D, Decarolis E, Deluca V, Baumann TW(1994) Methyl jasmonate vapor increases the devel-opmentally controlled synthesis of alkaloids in Cath-aranthus and Cinchona seedlings. Plant J 5:635–643
Annesley TM (2003) Ion suppression in mass spectrome-try. Clin Chem 49:1041–1044
Antignac JP, Brosseaud A, Gaudin-Hirret I, Andre F,Bizec BL (2005) Analytical strategies for the directmass spectrometric analysis of steroid and corticoste-roid phase II metabolites. Steroids. Web released
Asada M, Shuler ML (1989) Stimulation of ajmalicineproduction and excretion from Catharanthus roseus:effects of adsorption in situ, elicitors and alginateimmobilization. Appl Microbiol Biotechnol 30:475–481
Auriola S, Naaranlati T, Lapinjoki SP (1991) Determinationof Catharanthus roseus alkaloids by high-performanceliquid-chromatography–isotope-dilution thermospraymass spectrometry. J Chromatogr 554:227–231
Auriola S, Ranta VP, Naaranlahti T, Lapinjoki SP (1989)Thermospray liquid-chromatographic mass-spectro-metric analysis of Catharanthus alkaloids. J Chroma-togr 474:181–185
Balague C, Wilson G (1982) Growth and alkaloid biosyn-thesis by cell suspensions of Catharanthus roseus in achemostat under sucrose and phosphate limitingconditions. PhysiolVeg 20:515–522
Barthe L, Ribet JP, Pelissou M, Degude MJ, Fahy J,Duflos A (2002) Optimization of the separation ofvinca alkaloids by nonaqueous capillary electropho-resis. J Chromatogr A 968:241–250
Bhadra R, Shanks JV (1997) Transient studies of nutrientuptake, growth, and indole alkaloid accumulation inheterotrophic cultures of hairy roots of Catharanthusroseus. Biotechnol Bioeng 55:527–534
Bhadra R, Vani S, Shanks JV (1993) Production of indolealkaloids by selected hairy root lines of Catharanthusroseus. Biotechnol Bioeng 41:581–592
Blom TJM, Sierra M, Vanvliet TB, Frankevandijk MEI,Dekoning P, Vaniren F, Verpoorte R, Libbenga KR(1991) Uptake and accumulation of ajmalicine intoisolated vacuoles of cultured-cells of Catharanthusroseus (L.) G. Don and its conversion into serpentine.Planta 183:170–177
Bobzin SC, Yang S, Kasten TP (2000) Application ofliquid chromatography–nuclear magnetic resonancespectroscopy to the identification of natural products.J Chromatogr B 748:259–267
Bringmann G, Messer K, Wohlfarth M, Kraus J, DumbuyaK, Ruckert M (1999) HPLC-CD on-line coupling incombination with HPLC–NMR and HPLC–MS/MSfor the determination of the full absolute stereostruc-ture of new metabolites in plant extracts. Anal Chem71:2678–2686
Bringmann G, Wohlfarth M, Heubes M (2000) Observa-tion of exchangeable protons by high-performanceliquid chromatography–nuclear magnetic resonancespectroscopy and high-performance liquid chroma-tography–electrospray ionization mass spectrometry:a useful tool for the hyphenated analysis of naturalproducts. J Chromatogr A 904:243–249
Bringmann G, Wohlfarth M, Rischer H, Schlauer J, RetoB (2002) Extract screening by HPLC coupled to MS-MS, NMR, and CD: a dimeric and three monomericnaphthylisoquinoline alkaloids from Ancistrocladusgriffithii. Phytochemistry 61:195–204
Byun SY, Pedersen H (1994) 2-Phase airlift fermenteroperation with elicitation for the enhanced productionof benzophenanthridine alkaloids in cell-suspensionsof Eschscholtzia californica. Biotechnol Bioeng 44:14–20
Capell T, Christou P (2004) Progress in plant metabolicengineering. Curr Opin Biotechnol 15:148–154
Chen X, Yi C, Yang X, Wang X (2004) Liquid chroma-tography of active principles in Sophora flavescensroot. J Chromatogr B 812:149–163
Choi YH, Yoo KP, Kim J (2002) Supercritical fluidextraction and liquid chromatography–electrospraymass analysis of vinblastine from Catharanthus roseus.Chem Pharm Bulletin 50:1294–1296
Chu IH, Bodnar JA, Bowman RN, White EL (1997)Determination of vincristine and vinblastine inCatharanthus roseus plants by high performanceliquid chromatography electrospray ionization massspectrometry. J Chromatogr Relat Technol 20:1159–1174
Chu IH, Bodnar JA, White EL, Bowman RN (1996)Quantification of vincristine and vinblastine in Cath-aranthus roseus plants by capillary zone electropho-resis. J Chromatogr A 755:281–288
Phytochem Rev (2007) 6:207–234 231
123

Collins-Pavao N, Chin CK (1996) Taxol partitioning intwo-phase plant cell cultures of Taxus brevifolia. JBiotechnol 49:95–100
Collu G, Bink HHJ, Moreno PRH, Van Der Heijden R,Verpoorte R (1999) Determination of the activity ofthe cytochrome p450 enzyme geraniol 10-hydroxylasein plants by high-performance liquid chromatography.Phytochem Anal 10:314–318
Contin A, Van Der Heijden R, Lefeber AWM, VerpoorteR (1998) The iridoid glucoside secologanin is derivedfrom the novel triose phosphate/pyruvate pathway ina Catharanthus roseus cell culture. FEBS Lett434:413–416
Dagnino D, Schripsema J, Verpoorte R (1995) Terpenoidindole alkaloid biosynthesis and enzyme-activities intwo cell-lines of Tabernaemontana divaricata. Phyto-chemistry 39:341–349
Dagnino D, Schripsema J, Verpoorte R (1996) Analysis ofseveral iridoid and indole precursors of terpenoidindole alkaloids with a single HPLC run. Planta Med62:278–280
De Luca V, Balsevich J, Tyler RT, Eilert U, Panchuk BD,Kurz WGW (1986) Biosynthesis of indole alkaloids:developmental regulation of the biosynthetic pathwayfrom tabersonine to vindoline in Catharanthus roseus.J Plant Physiol 125:147–156
De Luca V, Fernandez JA, Campbell D, Kurz WGW(1988) Developmental regulation of enzymes ofindole alkaloid biosynthesis in Catharanthus roseus.Plant Physiol 86:447–450
De Luca V, Laflamme P (2001) The expanding universeof alkaloid biosynthesis. Curr Opin Plant Biol 4:225–233
De Luca V, St-Pierre B (2000) The cell and developmentalbiology of alkaloid biosynthesis. Trends Plant Sci5:168–173
Drager B (2002) Analysis of tropane and related alkaloids.J Chromatogr A 978:1–35
Dutta A, Batra J, Pandey-Rai S, Singh D, Kumar S, Sen J(2005) Expression of terpenoid indole alkaloid bio-synthetic pathway genes corresponds to accumulationof related alkaloids in Catharanthus roseus (L) GDon. Planta 220:376–383
El-Sayed M, Choi YH, Frederich M, Roytrakul S,Verpoorte R (2004) Alkaloid accumulation in Cath-aranthus roseus cell suspension cultures fed withstemmadenine. Biotechnol Lett 26:793–798
Facchini PJ (2001) Alkaloid biosynthesis in plants: bio-chemistry, cell biology, molecular regulation andmetabolic engineering applications. Annu Rev PlantPhysiol Plant Mol Biol 52:29–66
Fahy J, Du Boullay VT, Bigg DCH (2002) New method ofsynthesis of vinca alkaloid derivatives. Bioorg MedChem Lett 12:505–507
Favali MA, Musetti R, Benvenuti S, Bianchi A, PressaccoL (2004) Catharanthus roseus L. plants and explantsinfected with phytoplasmas: alkaloid production andstructural observations. Protoplasma 223:45–51
Gorog S, Herenyi B, Jovanovics K (1977) High-perfor-mance liquid chromatography of Catharanthus alka-loids. J Chromatogr A 139:203–206
Gustavsson SA, Samskog J, Markides KE, Langstrom B(2001) Studies of signal suppression in liquid chroma-tography–electrospray ionization mass spectrometryusing volatile ion-pairing reagents. J Chromatogr A937:41–47
Hendriks MMWB, Cruz-Juarez L, Bont DD, Hall RD(2005) Preprocessing and exploratory analysis ofchromatographic profiles of plant extracts. Anal ChimActa 545:53–64
Hisiger S, Jolicoeur M (2005) Plant cell culture monitoringusing an in situ multiwavelength fluorescence probe.Biotechnol Prog 21:580–589
Houghton PJ (2002) Chromatography of the chromoneand flavonoid alkaloids. J Chromatogr A 967:75–84
Hughes EH, Hong SB, Gibson SI, Shanks JV, San KY(2004) Expression of a feedback-resistant anthranilatesynthase in Catharanthus roseus hairy roots providesevidence for tight regulation of terpenoid indolealkaloid levels. Biotechnol Bioeng 86:718–727
Ingkaninan K, De Best CM, Van Der Heijden R, HofteAJP, Karabatak B, Irth H, Tjaden UR, Van DerGreef J, Verpoorte R (2000) High-performance liquidchromatography with on-line coupled UV, massspectrometric and biochemical detection for identifi-cation of acetylcholinesterase inhibitors from naturalproducts. J Chromatogr A 872:61–73
Jossang A, Fodor P, Bodo B (1998) A new structural classof bisindole alkaloids from the seeds of Catharanthusroseus: vingramine and methylvingramine. J OrgChem 63:7162–7167
Klyushnichenko VE, Yakimov SA, Tuzova TP, SyagailoYV, Kuzovkina IN, Wulfson AN, Miroshnikov AI(1995) Determination of indole alkaloids from R.serpentina and R. vomitoria by high-performanceliquid-chromatography and high-performance thin-layer chromatography. J Chromatogr A 704:357–362
Kruczynski A, Hill BT (2001) Vinflunine, the latest Vincaalkaloid in clinical development: a review of itspreclinical anticancer properties. Oncol/Hematol40:159–173
Kutney JP, Choi LSL, Kolodziejczyk P, Sleigh SK, StuartKL, Worth BR, Kurz WGW, Chatson KB, ConstabelF (1980) Alkaloid production in Catharanthus roseuscell cultures: isolation and characterization of alka-loids from one cell line. Phytochemistry 19:2589–2595
Laflamme P, St-Pierre B, De Luca V (2001) Molecular andbiochemical analysis of a madagascar periwinkle root-specific minovincinine-19-hydroxy-O-acetyltransfer-ase. Plant Physiol 125:189–198
Law B, Temesi D (2000) Factors to consider in thedevelopment of generic bioanalytical high-perfor-mance liquid chromatographic–mass spectrometricmethods to support drug discovery. J Chromatogr B748:21–30
Lee CWT, Shuler ML (2000) The effect of inoculumdensity and conditioned medium on the productionof ajmalicine and catharanthine from immobilizedCatharanthus roseus cells. Biotechnol Bioeng 67:61–71
Lee-Parsons CWT, Erturk S, Tengtrakool J (2004)Enhancement of ajmalicine production in Catharan-
232 Phytochem Rev (2007) 6:207–234
123

thus roseus cell cultures with methyl jasmonate isdependent on timing and dosage of elicitation. Bio-technol Lett 26:1595–1599
Lee-Parsons CWT, Shuler ML (2002) The effect ofajmalicine spiking and resin addition timing on theproduction of indole alkaloids from Catharanthusroseus cell cultures. Biotechnol Bioeng 79:408–415
Mans DRA, Da Rocha AB, Schwartsmann G (2000) Anti-cancer drug discovery and development in Brazil:targeted plant collection as a rational strategy toacquire candidate anti-cancer compounds. The Oncol-ogist 5:185–198
McCalley DV (2002) Analysis of the Cinchona alkaloids byhigh-performance liquid chromatography and otherseparation techniques. J Chromatogr A 967:1–19
Meijer AH, Verpoorte R, Hoge JHC (1993) Regulation ofenzymes and genes involved in terpenoid indolealkaloid biosynthesis in Catharanthus roseus. J PlantRes 3:145–164
Molyneux RJ, Gardner DR, James LF, Colegate SM(2002) Polyhydroxy alkaloids: chromatographic anal-ysis. J Chromatogr A 967:57–74
Monforte-Gonzales M, Ayaora-Talavera T, Maldonado-Mendoza IE, Loyola-Vargas VM (1992) Quantitativeanalysis of serpentine and ajmalicine in plant tissuesof Catharanthus roseus and hyoscyamine and scopol-amine in root tissues of Datura stramonium by thinlayer chromatography–densitometry. PhytochemAnal 3:117–121
Moreno PRH, Van der Heijden R, Verpoorte R (1993)Effect of terpenoid precursor feeding and elicitationon formation of indole alkaloids in cell-suspensioncultures of Catharanthus roseus. Plant Cell Rep12:702–705
Moreno-Valenzuela OA, Galaz-Avalos RM, Minero-GarciaY, Loyola-Vargas VM (1998) Effect of differentiation onthe regulation of indole alkaloid production in Catha-ranthus roseus hairy roots. Plant Cell Rep 18:99–104
Morgan JA, Barney CS, Penn AH, Shanks JV (2000)Effects of buffered media upon growth and alkaloidproduction of Catharanthus roseus hairy roots. ApplMicrobiol Biotechnol 53:262–265
Morgan JA, Shanks JV (2002) Quantification of metabolicflux in plant secondary metabolism by a biogeneticorganizational approach. Metabol Eng 4:257–262
Naaranlahti T, Nordstrom M, Huhtikangas A, LounasmaaM (1987) Determination of Catharanthus alkaloids byreversed-phase high-performance liquid chromatog-raphy. J Chromatogr A 410:488–493
Naaranlahti T, Ranta V-P, Jarho P, Nordstrom M,Lapinjoki SP (1989) Electrochemical detection ofindole alkaloids of Catharanthus roseus in high-performance liquid chromatography. Analyst114:1229–1331
Nawrocki J (1997) The silanol group and its role in liquidchromatography. J Chromatogr A 779:29–71
O’Gara JE, Walsh DP, Alden BA, Casellini P, Walter TH(1999) Systematic study of chromatographic behaviorvs. alkyl chain length for HPLC bonded phasescontaining an embedded carbamate group. AnalChem 71:2992–2997
Payne GF, Payne NN, Shuler ML, Asada M (1988) In situadsorption for enhanced alkaloid production of Cath-aranthus roseus. Biotechnol Lett 10:187–192
Pennings EJM, Verpoorte R, Goddijn OJM, Hoge JHC(1989) Purification of tryptophan decarboxylase froma Catharanthus roseus cell-suspension culture. J Chro-matogr 483:311–318
Potier P, Langlois N, Langlois Y, Gueritte F (1975) Partialsynthesis of vinblastine-like alkaloids. J Chem Soc16:670–671
Rao SR, Ravishankar GA (2002) Plant cell cultures:chemical factories of secondary metabolites. Biotech-nol Adv 20:101–153
Renaudin JP (1985) Extraction and fluorimetric detectionafter high-performance liquid chromatography ofindole alkaloids from cultured cells of Catharanthusroseus. Physiol Veg 23:381–388
Renaudin JP (1984) Reversed-phase high-performanceliquid chromatographic characteristics of indole alka-loids from cell suspension cultures of Catharanthusroseus. J Chromatogr A 291:165–174
Renaudin JP (1989) Different mechanisms control thevacuolar compartmentation of ajmalicine in Catha-ranthus roseus cell cultures. Plant Physiol Biochem27:613–621
Renaudin JP, Brown SC, Guern J (1982) Compartmenta-tion mechanisms of indole alkaloids in cell suspensionof Catharanthus roseus. Phyisol Veg 20:533–547
Rijhwani SK, Shanks JV (1998) Effect of elicitor dosageand exposure time on biosynthesis of indole alkaloidsby Catharanthus roseus hairy root cultures. BiotechnolProg 14:442–449
Rodriguez S, Compagnon V, Crouch NP, St-Pierre B, DeLuca V (2003) Jasmonate-induced epoxidation oftabersonine by a cytochrome p-450 in hairy rootcultures of Catharanthus roseus. Phytochemistry64:401–409
Satdive RK, Fulzele DP, Eapen S (2003) Studies onproduction of ajmalicine in shake flasks by multipleshoot cultures of Catharanthus roseus. BiotechnolProg 19:1071–1075
Schroder G, Unterbusch E, Kaltenbach M, Schmidt J,Strack D, De Luca V, Schroder J (1999) Light-induced cytochrome P450-dependent enzyme in in-dole alkaloid biosynthesis: tabersonine 16-hydroxy-lase. FEBS Lett 458:97–102
Shanks JV, Bhadra R, Morgan J, Rijhwani S, Vani S(1998) Quantification of metabolites in the indolealkaloid pathways of Catharanthus roseus: implica-tions for metabolic engineering. Biotechnol Bioeng58:333–338
Sim SJ, Chang HN, Liu JR, Jung KH (1994) Productionand secretion of indole alkaloids in hairy root culturesof Catharanthus roseus – effects of in-situ adsorption,fungal elicitation and permeabilization. J FermentBioeng 78:229–234
Singh D, Maithy A, Verma R, Gupta M, Kumar S (2000)Simultaneous determination of Catharanthus alka-loids using reversed phase high performance liquidchromatography. J Liquid Chromatogr Relat Technol23:601–607
Phytochem Rev (2007) 6:207–234 233
123

Spanik I, Lim P, Vigh G (2002) Use of full-columnimaging capillary isoelectric focusing for the rapiddetermination of the operating conditions in thepreparative-scale continuous free-flow isoelectricfocusing separation of enantiomers. J ChromatogrA 960:241–246
St-Pierre B, De Luca V (1995) A cytochrome p-450monooxygenase catalyzes the first step in the conver-sion of tabersonine to vindoline in Catharanthusroseus. Plant Physiol 109:131–139
St-Pierre B, Vazquez-Flota FA, De Luca V (1999)Multicellular compartmentation of Catharanthus ro-seus alkaloid biosynthesis predicts intercellular trans-location of a pathway intermediate. Plant Cell 11:887–900
Stevens LH, Giroud C, Pennings EJM, Verpoorte R(1993) Purification and characterization of strictosi-dine synthase from a suspension culture of Cinchonarobusta. Phytochemistry 33:99–106
Stockigt J, Sheludko Y, Unger M, Gerasimenko I, War-zecha H, Stockigt D (2002) High-performance liquidchromatographic, capillary electrophoretic and capil-lary electrophoretic–electrospray ionisation massspectrometric analysis of selected alkaloid groups. JChromatogr A 967:85–113
Strege M (1999) High-performance liquid chromato-graphic–electrospray ionization mass spectrometricanalyses for the integration of natural products withmodern high-throughput screening. J Chromatogr B725:67–78
Suntornsuk L (2002) Capillary electrophoresis of phyto-chemical substances. J Pharm Biomed Anal 27:679–698
Tikhomiroff C, Allais S, Klvana M, Hisiger S, Jolicoeur M(2002) Continuous selective extraction of secondarymetabolites from Catharanthus roseus hairy roots withsilicon oil in a two-liquid-phase bioreactor. BiotechnolProgr 18:1003–1009
Tikhomiroff C, Jolicoeur M (2002) Screening of Catha-ranthus roseus secondary metabolites by high-perfor-mance liquid chromatography. J Chromatogr A955:87–93
Toivonen L, Ojala M, Kauppinen V (1991) Studies on theoptimization of growth and indole alkaloid productionby hairy root cultures of Catharanthus roseus. Bio-technol Bioeng 37:673–680
Uniyal GC, Bala S, Mathur AK, Kulkarni RN (2001)Symmetry C18 column: a better choice for the analysisof indole alkaloids of Catharanthus roseus. PhytochemAnal 12:206–210
Van Der Heijden R, Verpoorte R, Ten Hoopen JG (1989)Cell and tissue cultures of Catharanthus (L.)G. Don: aliterature survey. Plant Cell Tiss Org 18:231–280
Van Der Heijden R, Jacobs DI, Snoeijer W, Hallared D,Verpoorte R (2004) The Catharanthus alkaloids:pharmacognosy and biotechnology. Curr Med Chem11:607–628
Van Der Heijden R, Lamping PJ, Out PP, Wijnsma R,Verpoorte R (1987) High-performance liquid chro-matographic determination of indole alkaloids in asuspension culture of Tabersnaemontana divaricata. JChromatogr 396:287–295
Van Elswijk DA, Irth I (2003) Analytical tools for thedetection and characterization of biologically activecompounds from nature. Phytochem Rev 1:427–439
Vazquez-Flota F, Carrillo-Pech M, Minero-Garcia Y, deLourdes Miranda-Ham M (2004) Alkaloid metabo-lism in wounded Catharanthus roseus seedlings. PlantPhysiol Biochem 42:623–628
Verpoorte R, Memelink J (2002) Engineering secondarymetabolite production in plants. Curr Opin Biotech13:181–187
Verpoorte R, Niessen W (1994) Liquid chromatographycoupled with mass spectrometry in the analysis ofalkaloids. Phyotchem Anal 5:217–232
Verpoorte R, Van Der Heijden R, Ten Hoopen HJG,Memelink J (1999) Metabolic engineering of plantsecondary metabolite pathways for the production offine chemicals. Biotechnol Lett 21:467–479
Whitmer S, Van Der Heijden R, Verpoorte R (2002)Effect of precursor feeding on alkaloid accumulationby a strictosidine synthase over-expressing transgeniccell line s1 of Catharanthus roseus. Plant Cell Tiss OrgCult 69:85–93
Wong PL, Royce AJ, Lee-Parsons CWT (2004) Improvedajmalicine production and recovery from Catharan-thus roseus suspensions with increased product re-moval rates. Biochem Eng J 21:253–258
Zhao Y, Nookandeh A, Schneider B, Sun X, Schmitt B,Stockigt J (1999) Lignans from Torreya jackiiidenti-fied by stopped-flow high-performance liquid chro-matography–nuclear magnetic resonancespectroscopy. J Chromatogr A 837:83–91
Zhao J, Zhu WH, Hu Q (2001) Enhanced catharanthineproduction in catharanthus roseus cell cultures bycombined elicitor treatment in shake flasks andbioreactors. Enzyme Microbiol Technol 28:673–681
Zhou H, Tai YP, Sun CR, Pan YJ (2005) Rapid identifica-tion of Vinca alkaloids by direct-injection electrosprayionisation tandem mass spectrometry and confirmationby high-performance liquid chromatography–massspectrometry. Phytochem Anal 16:328–333
Zimina TM, Smith RM, Myers P (1997) Comparison ofODS-modified silica gels as stationary phases forelectrochromatography in packed capillaries. J Chro-matogr A 758:191–197
234 Phytochem Rev (2007) 6:207–234
123
View publication statsView publication stats