analysis of bolton’s tooth size discrepancy for a referred...
TRANSCRIPT

Analysis of Bolton’s tooth size discrepancy for a
referred UK population
A thesis submitted to the University of Birmingham for the degree of
Master of Philosophy
Submitted by
Insigam Muqbil
BDS MFDS RCS MOrth

University of Birmingham Research Archive
e-theses repository This unpublished thesis/dissertation is copyright of the author and/or third parties. The intellectual property rights of the author or third parties in respect of this work are as defined by The Copyright Designs and Patents Act 1988 or as modified by any successor legislation. Any use made of information contained in this thesis/dissertation must be in accordance with that legislation and must be properly acknowledged. Further distribution or reproduction in any format is prohibited without the permission of the copyright holder.

Abstract
Objectives
The aims of this study are:
• To study the incidence of tooth size discrepancy in a UK population
• To establish whether there are differences between males and females.
• To assess racial differences for tooth size discrepancies in different malocclusion
categories.
Malocclusion groups included: Class I, Class II division 1, Class II division II, Class III
Racial groups included: Caucasian, Asian, Afro-Caribbean
Method
A retrospective study using dental casts of patients in the orthodontic departments of Birmingham
Dental Hospital and Kings College Hospital, London. 30 sets of casts were assessed from each
malocclusion group for each race. i.e 30 Class I Caucasian, 30 Class I Asian, 30 Class I Afro-
Caribbean, with an equal male to female ratio. In total 360 dental casts were used.
Mesiodistal tooth dimensions were measured from right first molar to left first molar in the
maxillary and mandibular arches. Measurements were taken using HATS digital callipers
accurate to 0.1mm. Anterior and overall Bolton discrepancies were calculated for each model.

Results
Gender Significant differences between males and females for the overall ratio only existed for
the Class II/I Afro-Carribean group. There were significant differences in the anterior ratio for all
the racial groups with Class III malocclusion, and for Class I Asian and Class II/II Afro-
Carribeans.
Malocclusion group There were significant differences between the means of the malocclusion
groups for the combined overall and anterior ratios. These differences arose because of the
differences between the Class III subjects and the remaining malocclusion groups. There was
also a significant difference in the anterior ratio in the Asian subjects due to the difference
between the Class I and Class III groups.
Race Significant differences only arose in the anterior ratio of the Class I group due to the
differences between the Asian and the Caucasian groups. No significant differences were found
in the combined overall or anterior ratios.
Conclusion
Differences between males and females existed mainly in the anterior ratio for the Class III
groups. The Class III groups showed significantly higher combined overall and anterior ratios,
compared to the other malocclusion groups. In addition the anterior ratio of the Asian group was
higher in Class III than Class I subjects, indicating mandibular tooth size excess in Class III
subjects. No significant differences were found when comparing racial groups, except the
anterior ratio of the Class I Caucasian group was significantly greater than the Class I Asian
group.

Acknowledgements
I would like to thank my supervisors Dr Rock and Mr Turner for their assistance and
advice during the course of my research.
I am grateful to Mr Mack for his assistance with facilitating my data collection at Kings
College, London.
I would like to dedicate this thesis to my parents, Abdulla and Miriam for their endless
encouragement and support.

Contents
Chapter Contents Page
One 1.1 Introduction 1
1.2 Causes of tooth size discrepancy 3
1.3 Methods of assessment of tooth size discrepancy 5
1.4 Methods for measuring tooth width for Bolton ratios 7
1.5 The prevalence of tooth size discrepancies 15
1.6 Tooth size discrepancies and malocclusion groups 17
1.7 Tooth size discrepancies and racial variation 24
1.8 Tooth size discrepancy and gender 31
1.9 Clinical relevance of tooth size discrepancy 33
1.10 Management of tooth size discrepancy 34
1.11 Tooth tissue reduction 34
1.12 Incisor angulation (mesiodistal tip) 35
1.13 Incisor inclination (torque) 35
1.14 Building up small teeth 36
1.15 Premolar extractions and their effect on tooth size discrepancy 37

Chapter Contents Page
Two 2.1 Objectives 39
2.2 Null Hypothesis 39
Three 3.1 Sampling 40
3.2 Ethical approval 40
3.3 Selection criteria 40
3.4 Subject selection 41
3.5 Sample size calculation 44
3.6 Reproducibility study 44
3.7 Model measurement 45
3.8 Data Analysis 45
Four Results 48
Five Discussion 61
Six Conclusions 67

List of tables Page Table 4.1 Descriptive results for reproducibility testing 48 Table 4.2 Descriptive statistics for main study 49 Table 4.3 Paired T test values for differences in overall ratios by gender 51 Table 4.4 Paired T test values for differences in anterior ratios by gender 51 Table 4.5 ANOVA for combined overall ratios by malocclusion groups 52 Table 4.6 ANOVA for overall Asian ratios by malocclusion group 52 Table 4.7 ANOVA for overall Caucasian ratios by malocclusion group 53 Table 4.8 ANOVA for overall Afro-Caribbean ratios by malocclusion group 53 Table 4.9 ANOVA for combined anterior ratios by malocclusion group 54 Table 4.10 ANOVA for anterior Asian ratios by malocclusion 54 Table 4.11 ANOVA for anterior Caucasian ratios by malocclusion 55 Table 4.12 ANOVA for anterior Afro-Caribbean ratios by malocclusion 55 Table 4.13 ANOVA for combined overall ratios by racial group 56 Table 4.14 ANOVA for Class I overall ratios by racial group 56 Table 4.15 ANOVA for Class II/1 overall ratios by racial group 57 Table 4.16 ANOVA for Class II/2 overall ratios by racial group 57 Table 4.17 ANOVA for Class III overall ratios by racial group 58 Table 4.18 ANOVA for combined anterior ratios by racial group 58 Table 4.19 ANOVA for Class I anterior ratios by racial group 59 Table 4.20 ANOVA for Class II/1 anterior ratios by racial group 59 Table 4.21 ANOVA for Class II/2 anterior ratios by racial group 60 Table 4.22 ANOVA for Class III anterior ratios by racial group 60

Legend to illustrations Page
Figure 2.1 The HATS digital callipers and details 46 Figure 2.1 The HATS computer screen 47

CHAPTER ONE
1.1 Introduction
Malocclusion can be defined as a significant deviation from a normal or ‘ideal’ occlusion
(Andrews, 1972). Many components are involved in the achievement of a normal
occlusion, including skeletal, soft tissue and local dental factors. The most important are
(a) size of maxilla; (b) size of mandible; (c) factors which determine the relationship
between the two skeletal bases, such as cranial base and environmental factors; (d) arch
form; (e) size and morphology of the teeth; (f) number of teeth present; and (g) soft
tissue morphology and behaviour.
Andrews’ study, (1972) was based on 120 casts of non orthodontic patients in which he
found six significant characteristics:
• Molar relationship.
The distal surface of the distobuccal cusp of the upper first permanent molar made
contact and occluded with the mesial surface of the mesiobuccal cusp of the lower
second molar. The mesiobuccal cusp of the upper first permanent molar fell
within the groove between the mesial and middle cusps of the lower first
permanent molar.
• Correct crown angulation.
The gingival portions of the long axes of all crowns were more distal than the
incisal portions.

• Correct crown inclination.
Crown inclination is determined by the resulting angle between a line at ninety
degrees to the occlusal plane and a line tangent to the middle of the labial or
buccal clinical crown.
• No rotations
• No spaces and tight contact points.
• Flat occlusal plane
Bennett and McLaughlin, (1993) added a seventh key which was correct tooth size. In
order to achieve a good occlusion with satisfactory intercuspation of teeth and a correct
overjet and overbite, the maxillary and mandibular teeth must be proportional in size. A
tooth size discrepancy (TSD), defined as a disproportion among the sizes of individual
teeth will affect attainment of an ideal occlusion. Black, (1902) first assessed tooth size
and measured the mesio-distal widths of a large number of human teeth in order to
establish the mean dimensions for each tooth in the dental arch. Abnormalities in tooth
size and shape result from disturbances in development and can lead to a tooth size
discrepancy.

1.2 Causes of tooth size discrepancy
Malocclusion is multifactorial in aetiology, being affected by skeletal, dental and soft
tissue factors, which in turn are influenced by environmental and genetic components.
Whilst measurements of the skeletal craniofacial complex have moderate to high
heritability, because of the adaptability of the dentoalveolar region when subjected to
environmental factors local malocclusions are often acquired (Mossey, 1999). Harris and
Smith, (1982) suggested that some variables pertaining to the position and occlusion of
teeth have a stronger environmental than hereditary influence.
Analysis of nature versus nurture in malocclusion concluded that the genetic contribution
to dental anomalies was only 40 per cent (Lundstrom, 1984). Other studies however,
challenge this view. Lundstrom, (1948) had previously studied 50 pairs of monozygotic
twins and 50 pairs of dizygotic twins and concluded that heredity played an important
role in determining width and length of arch, crowding and spacing of the teeth, and
degree of overbite. In particular twin studies have shown that crown dimensions are
strongly determined by heredity (Markovic, 1992). Homeobox genes have particular
implications in tooth development. Muscle specific homeobox genes MSX1 and MSX2
appear to be involved in epithelial mesenchymal interactions and are implicated in
craniofacial development, in particular concerning the developmental position (Msx-1)
and further development (Msx-2) of the tooth buds (Mackenzie et al., 1991; Jowett et al.,
1993). Satokata and Maas, (1994) found that mice with a non functional Msx-1 gene had

complete failure of tooth development. In addition evolutionary theory suggests that
changes in dietary habits have resulted in evolutionary selection with reduced tooth
volume in the fields of third molars, second premolars and lateral incisors. Hypodontia of
these teeth shows a familial tendency and fits the polygenic model (Gravely and
Johnston, 1971)
The most common dental abnormality is variation in size, particularly of maxillary
lateral incisors. Alvesalo and Portin, (1969) provided substantial evidence to support the
view that missing and malformed lateral incisors may well be the result of a common
gene defect. Abnormalities range from peg shaped through microdont to missing lateral
incisors, all of which have familial trends, female preponderance and association with
other dental anomalies such as ectopic canines.
Size and form of teeth are principally genetically determined. However growth and final
morphology of the dentofacial structures is undoubtedly influenced by environmental
factors. Therefore in summary the cause of tooth size discrepancy is a classical case of
interaction between genetic and environmental factors.

1.3 Methods of assessment of tooth size discrepancy
Since the initial work of Black, (1902), there have been other studies in this field.
Steadman, (1952) produced a method to determine the overbite and overjet relationship
of anterior teeth and Neff, (1949) examined the three dimensionality of teeth and
determined an anterior coefficient value of 1.2 – 1.22 for an ideal anterior ratio between
the upper and lower teeth. However the most recognised work is that of Bolton, (1958)
who assessed fifty five Caucasian female subjects with excellent occlusions, of which
forty four had been treated orthodontically without extraction. Tooth size disharmony
was assessed in relation to the treatment of a malocclusion and two mathematical ratios
were developed for estimating tooth size discrepancies. The summed mesio distal widths
of twelve mandibular to maxillary teeth were measured for the overall ratio, and the six
anterior mandibular to the corresponding maxillary teeth for the anterior ratio.
Sum of mesio-distal widths of twelve mandibular teeth
Sum of mesio-distal widths of twelve maxillary teeth x 100 = Overall ratio
Sum of mesio-distal widths of six mandibular teeth
Sum of mesio-distal widths of six maxillary teeth x100 = Anterior ratio

Bolton concluded that an overall ratio of 91.3 and an anterior ratio of 77.2 were necessary
for proper articulation of maxillary and mandibular teeth. If a ratio lies outside two
standard deviations from Bolton’s means i.e. 87.47 – 95.13 for the overall ratio and 73.8
– 80.5 for the anterior ratio, then a Boltons discrepancy is said to exist. Bolton concluded
that these two ratios could be used as diagnostic tools, allowing clinicians to assess the
functional and aesthetic outcome of treatment without the use of a diagnostic wax up
(Bolton, 1962).

1.4 Methods for measuring tooth width for Bolton ratios
Several methods are available for measuring tooth width in order to analyse Bolton ratios,
and these are continuing to develop with increased technological advances. If a method
of measurement is to be widely used, it is important that is quick and easy to use and
easily reproducible. The traditional methods for measuring mesiodistal widths of teeth
on dental casts have used either needle-pointed dividers or a Boley gauge (Vernier
callipers). Shellhart et al., (1995) evaluated the reliability of Bolton analyses using these
two instruments. Pre and post treatment casts of 15 patients were analysed by four
investigators on two separate occasions two weeks apart. Casts were selected on the basis
that there was at least 3mm of pre treatment crowding in one arch and treatment records
indicated no inter-proximal tooth reduction. As a result of the pre and post treatment
matching, teeth extracted were not included in the measurements. The investigators had
all been trained in the use of Bolton analysis but had varying experience. Comparing the
recorded Bolton ratios to a clinical standard of significance of 1.5mm (Proffit, 1993)
every investigator in the study made at least one error in measurement that was greater
than the clinically significant value for tooth size excess. Therefore, even if a patient’s
teeth were perfectly proportioned, measurement error alone can lead to errors in
treatment planning. The authors concluded that significant measurement errors can occur
when Bolton tooth size analysis is performed on casts that have at least 3mm of
crowding, although there was considerable variation between investigators. This
suggests that clinicians should undertake tooth size discrepancy analysis in substantially

crowded cases only after the teeth have been aligned. When comparing the two
measuring devices, the Boley gauge demonstrated a higher frequency of significantly
correlated repeated measures and thus may provide more reliable measurements than
needle pointed dividers.
Shellhart et al., (1995) suggested that Bolton’s analysis may be appropriate as a screening
tool to determine the possible range of discrepancy because of its ease and rapidity,
although, if the discrepancy range indicates two treatment alternatives it would be wise to
carry out a diagnostic wax up, even though it is more time consuming.
The recent introduction of digital callipers which can be linked to computers allows for
rapid calculation of Bolton’s ratios. In addition study casts can now be digitized or
scanned into a computer so that images can be measured on-screen. The use of digital
callipers with direct input into a computer programme can virtually eliminate
measurement transfer and calculation errors compared to analyses that require dividers,
rulers and calculators (Ho and Freer., 1999). Although measurement error is associated
with the placement of computer-linked dividers on the mesial and distal surfaces of the
teeth, this method is still more reliable than manual measurement. Computer
programmes such as the Ho-Freer Graphic Analysis of Tooth Width Discrepancy
(GATWD) (University of Queensland School of Dentistry, Brisbane, Australia 4000)
provide a simple graphic description of tooth – width relationships between the arches, a

comprehensive representation of tooth-width ratios in various arch segments and a
method of localizing tooth size discrepancies. Digital callipers that input data directly
into such programmes provide a diagnostic tool that is convenient, consistent and easy to
use.
Computer aided analysis of tooth size discrepancy was investigated further by Tomassetti
et al., (2001) who compared manual measurements with Vernier callipers to the
QuickCeph Image programme, the Hamilton Tooth Arch System software (HATS) and
the OrthoCad software. The Quick Ceph image system involved digitising the models in
to the Quick Ceph image pro programme, which then measured the casts and calculated
Bolton analyses. In contrast the Hamilton Tooth Arch System uses digital callipers to
measure the actual study casts, and then transfers the data directly into a computer
programme which then calculates the Bolton analysis. The final method using OrthoCad
involved shipping the models to CADENT Inc, where they were scanned to make 3-
dimensional images, upon which the Bolton analysis was performed. Eleven pre
treatment and eleven post treatment models with no more than 3mm of crowding were
measured using four methods. Vernier callipers were used to carry out a tooth size
analysis three times on each set of casts. Measurements were carried out within a 1
month period, with at least two weeks between each measurement. Each analysis was
timed from the first measurement to the final computation, and the data from these
measurements were averaged and used as a standard. For the second analysis, models
were digitised and measured using the QuickCeph Image programme, which also

calculated Bolton analyses. The third analysis used digital callipers which directly
inputed data into the Hamilton Tooth Arch System software (HATS). The software
calculated the Bolton analysis, and again the entire procedure was timed. Finally the
models were scanned to make 3-dimensional images of the casts which were then
analysed using the OrthoCad software. Again this was timed. Measurements with the
HATS system had the highest degree of correlation to Vernier callipers, with 86.4% of
the measurements for the overall ratio being within 1.5mm of the vernier calliper
measurements, followed by OrthoCad and QuickCeph. QuickCeph was found to be the
fastest method of measurement at 1.85minutes, followed by the HATS system at
3.4minutes, OrthoCad at 5.37minutes and finally Vernier callipers at 8.06 minutes.
Although the results were useful, measurements were not replicated to assess
reproducibility.
Othman and Harradine, (2007) compared the reproducibility and speed of the HATS
digital callipers to the use of manual measurements and the Odontorule slide rule. 150
Caucasian orthodontic patients were randomly selected. Twenty study models were
measured twice; a week apart using both methods, and another three investigators also
measured twenty sets of models twice with the HATS digital callipers. The results
showed that there were small or no systematic errors within or between these two
methods. A very significant difference was evident for mean time measurements between
the two methods, with the mean time for HATS being 3.5 minutes and for the Odontorule
8.9 minutes. There was relatively high error variance for both methods of measurement
as a percentage of the total variance. The authors concluded that On-line electronic

measurement was more rapid than manual. Both methods produced high random errors,
which may have important consequences for the clinical use of Bolton's ratios
Zilberman et al., (2003) compared the accuracy of model measurement with the aid of
Vernier callipers and OrthoCad. Twenty set ups of artificial teeth resembling various
malocclusions were created and used to produce plaster and virtual orthodontic models.
No more than 5mm of crowding existed in any of the models. The same investigator then
performed tooth size measurements of mesiodistal tooth widths as follows:
• Every isolated artificial tooth was measured after removal from the set up, using
electronic callipers accurate to 0.01mm
• Teeth on plaster models were measured, again using electronic callipers
• Computerised models were measured using OrthoCad, accurate to 0.01mm
Upper and lower intercanine and intermolar widths were also measured on six set ups, for
both plaster and computerised models.

Measurements carried out using all three methods were highly correlated. Measurements
made directly on study casts with electronic callipers were however found to be the most
accurate and repeatable, although the accuracy of measurements made using OrthCad
were considered to be clinically acceptable.
Arkutu, (2004) looked at commonly used methods of assessing Bolton’s discrepancy and
compared them to the gold standard, which was defined as measurements using Vernier
callipers accurate to 0.1mm. The following four methods were used:
• Inspection
• The Quick check method comparing the size of the laterals and second premolars.
(Proffit 2000)
• Needle point dividers and stainless steel rule (nearest to 0.5mm)
• Vernier callipers (nearest 0.1mm)
Anterior and overall ratios were calculated on 200 study models. When comparing
Inspection and Proffit’s method against measurements using Vernier callipers there was
poor agreement concerning measurement of Bolton’s anterior and overall discrepancies.
Assessments made using dividers and a stainless steel rule showed moderate agreement
with the Vernier calliper method. In addition sensitivity and specificity tests showed that
the inspection and quick check methods were less satisfactory than Vernier callipers for
detecting a lack of Bolton’s discrepancy and very poor at correctly identifying a

significant Bolton’s discrepancy. This may explain the clinical opinion that tooth size
discrepancy is much less common than many studies report.
The most accurate and reproducible results for studies measuring tooth size discrepancies
were achieved using Vernier callipers (Shellhart et al., 1995; Arkutu, 2004.) Vernier
callipers digitally linked to computer programmes provide additional accuracy as the
error of data recording and transfer is removed (Ho and Freer, 1999). This is supported
by Ziebermann et al., (2003) who found that the measurements made using digital
callipers such as the HATS system, produced the most accurate and reproducible results.
This is probably because investigators can measure more accurately on plaster models as
opposed to digitised or scanned 3-dimensional models, and there is less risk of error by
inaccurate data recording or analysis. These results suggest that measurements for future
studies assessing tooth size discrepancies are best carried out using digital callipers
connected to computerised analysis software.
When carrying out quantitative studies, it is important that the reproducibility of
measurements is accurately explored. However there have been some well known
studies on tooth size discrepancy in which measurement errors were not reported at all
(Crosby and Alexander, 1989; Araujo and Souki, 2003; Bernabe et al., 2004). Houston,

(1983) stated that if a study using measurements is to be of value, it is imperative that an
error analysis be undertaken and reported. Error analyses serve to improve the quality of
results, particularly if models are replicated so that measurements can be averaged.

1.5 The prevalence of tooth size discrepancies
The prevalence of a tooth size discrepancy in the general population is around 5 percent
according to the proportion of occlusions that fall outside two standard deviations from
Bolton’s mean ratios (Proffit, 2000). However studies have reported a higher prevalence
of TSD and found that a greater percentage of patients have anterior TSD than an overall
TSD. Freeman et al., (1996) found that the overall discrepancy was likely to be a relative
excess in the maxilla or the mandible, whereas the anterior discrepancy was nearly twice
as likely to be a relative mandibular excess (19.7%) than a relative maxillary excess
(10.8%). Further studies which have examined orthodontic patients have produced
similar prevalence values (Santoro et al., 2000; Araujo and Souki; 2003).
However Bernabe et al., (2004) assessed a group of 200 Peruvian school children with
untreated malocclusions and found an anterior TSD of 20.5% and an overall TSD of
5.4%. Measurement of Bolton’s discrepancy is only valid for a fully erupted permanent
dentition and orthodontic samples may have a higher prevalence of a Bolton’s
discrepancy, depending on the proportion of subjects with impacted teeth and
hypodontia. This is because impacted teeth are associated with absent or diminutive teeth
as illustrated by Brin et al., (1986) who showed that 42.6% of impacted canines were
associated with small or developmentally absent lateral incisors.

Othman and Harradine, (2007) investigated how many millimetres of tooth size
discrepancy were clinically significant, and what percentage of an orthodontic population
had such a tooth size discrepancy. They also aimed to determine the ability of simple
visual inspection to detect such a discrepancy. Their sample comprised 150 pre-treatment
study casts with fully erupted and complete permanent dentitions from first molar to first
molar. The mesiodistal diameter tooth sizes were measured using HATS digital callipers,
and the Bolton analysis and the tooth size corrections were calculated by the Hamilton
Arch Tooth System (HATS) software. Simple visual estimation of Bolton discrepancy
was also performed for comparison. In the sample group 17.4% had anterior tooth-width
ratios and 5.4% had total arch ratios greater than 2 of Bolton's standard deviations from
Bolton's mean. For the anterior analysis, correction greater than +/- 2 mm was required
for 16% of patients in the upper arch or 9% in the lower arch. For the total arch analysis,
the corresponding figures are 28% and 24%. A significant percentage of patients had a
tooth size discrepancy of +/- 2mm. and it was therefore recommended that 2 mm of
required tooth size correction was an appropriate threshold for clinical significance.
Visual estimation of TSD had a low sensitivity and specificity suggesting that careful
measurement is frequently required in clinical practice than visual estimation would
suggest.

1.6 Tooth size discrepancies and malocclusion groups
Studies that have focussed on the prevalence of a Bolton’s discrepancy in orthodontic
patients have looked at different malocclusions with varying results. Five studies found
relative mandibular tooth excess in Class III malocclusions (Sperry et al.,1977; Nie and
Lin, 1999; Ta et al., 2001; Alkofide and Hashim, 2002; Araujo and Souki, 2003), relative
maxillary excess in Class II malocclusions (Nie and Lin, 1999), whilst other studies
found no significant differences (Crosby and Alexander,1989; Liano et al., 2003; Uysal et
al., 2005).
The most recent of the studies that found relative mandibular tooth excess in Class III
malocclusions was that of Araujo and Souki, (2003). The prevalence of TSD in a
Brazilian population from Belo Horizonte was assessed, firstly to measure the prevalence
of TSD in the three Angle malocclusion groups according to gender and secondly to
investigate differences of Bolton’s anterior TSD in the three malocclusion groups. The
study sample consisted of 300 patients assigned to a malocclusion group according to
Angle’s classification. Each group comprised 100 individuals and the distribution
between males and females was approximately equal. Each canine and incisor tooth was
measured at the largest mesiodistal dimensions using a digital calliper accurate to
0.01mm and all measurements were made by the same examiner. An error analysis was
performed by randomly selecting 29 individuals from the original sample and repeating
the measurements twice within three weeks. No significant differences were found

between the two sets of measurements (P>0.05) upon testing using the Wilcoxon
nonparametric test. Individual tooth size was firstly assessed using ANOVA to
determine whether tooth size was related to gender, malocclusion classification, or both.
No significant differences were found between the three groups as a function of Angle’s
classification. Objectives of the study also involved assessment of the prevalence of TSD
compared to those presented by Bolton. Data were classified as ‘normal’ for Bolton
ratios within +/- 1 SD, and ‘discrepancy’ for ratios greater than +/- 1 SD. Results showed
that although 56% of the subjects in the study presented with a Bolton TSD greater than
+/- 1 SD, there was no significant difference among the three malocclusion groups or
according to gender. 22.7% of the sample showed clinically significant TSD greater
than +/- 2SD, and when analysed by Angle’s classification, there were significantly
greater numbers of Class I and III subjects within this group than Class II subjects. No
significant differences were observed between genders. In addition a two by three
ANOVA was performed to compare the Bolton anterior ratio as a function of Angle’s
classification, gender or both. The mean anterior Bolton’s ratio was statistically greater
for the Class III sample than for the Class I and Class II samples. The Class I and II
samples showed no significant differences when compared with each other and no sexual
dimorphism was observed.
The results of Alkofide and Hashim, (2002) support the findings of Araujo and Souki,
(2003), in that a significant difference in Bolton’s ratio was found in females with Class
III malocclusions. The purpose of the study by Alkofide and Hashim was to determine if

a difference existed in tooth size ratios between the different malocclusion classes and
normal occlusion in Saudi patients, and if sexual dimorphism occurred. Their sample
comprised of 240 pre-treatment casts with both sexes evenly distributed. Sixty cases had
normal occlusion, sixty were Class I malocclusions, sixty Class II malocclusions and 60
Class III malocclusions according to Angle’s classification. Mesiodistal tooth widths
were measured directly on the dental casts by one examiner using digital callipers with
fine tips accurate to 0.01mm. Measurement errors were assessed by remeasuring five
sets of study models twice, ten days apart. Pearson correlation coefficient and
Dahlberg’s method were used for testing the error of the method and results a high
correlation between the first and second measurements. However given that the study
sample was 240, perhaps more study models should have been measured to confirm
reproducibility. Results showed that the average overall ratio for all classes combined
was 92.61, with the mean anterior ratio being 78.86. Both of these were higher than the
actual Bolton’s ratios. Comparison between the three malocclusion groups showed that
the mean overall ratio for Class II cases was higher than for Class I and III. This
disagrees with Nie and Lin, (1999), who found that the mean ratio in Class III was higher
than for both Class I and II in a Chinese population. When the three malocclusion groups
were compared in males and females, the results showed that the mean overall and
anterior ratios for Class III cases were greater than Class I and II malocclusions in both
males and females. This finding is in agreement with Araujo and Souki, (2003). The
study also concluded that significant sexual dimorphism existed for the anterior ratio in
Class III malocclusion, with males having a significantly higher mean anterior ratio.

Statistically significant differences were found between the anterior ratio of the Bolton
standard and the Class III occlusion group a study of 110 Southern Chinese twelve year
olds (Ta et al., 2001). 50 Class I, 30 Class II and 30 Class III subjects were randomly
selected from 1247 12-year old Southern Chinese children. A digital calliper was used to
measure mesiodistal crown diameters to 0.1mm (Moorrees et al., 1957). Twenty dental
casts with Class I occlusions were used to determine the method error. Casts were
measured twice, with a week between the measurements, and the method described by
Dahlberg was used to assess the method error. Unfortunately no Class II or III casts were
used when determining the method error which was therefore not representative of the
whole sample. No statistically significant sex differences were found between the
anterior and overall ratios in the three occlusion groups, and the mean anterior and
overall ratios were subsequently combined for males and females. Statistically
significant differences for the anterior ratios were found between the Bolton standard and
the Class III occlusion group. Statistically significant differences for the overall ratios
were found between the Bolton standard and the Class II occlusion group, and between
the Class II and Class III groups. The study concluded that Bolton standards applied to
southern Chinese children with Class I occlusion but not to those with Class II or III
occlusions. Although the young age group in this study was chosen to minimise
alteration of mesiodistal tooth dimensions due to caries, attrition or restorations, it was
not made clear in the paper whether patients were in the mixed or permanent dentition.
This is extremely important as the differences in size between the primary and permanent
dentitions will inevitably affect tooth size discrepancy measurements.

Nie and Lin, (1999) assessed intermaxillary tooth size discrepancies among different
malocclusion groups in China. The objectives of the study were to determine whether
sexual dimorphism exists for tooth size ratios, and to assess whether there is a difference
in intermaxillary TSD as represented by the anterior, overall and posterior ratios of
Bolton for designated malocclusion groups. The study consisted of 60 subjects who
served as the normal group and 300 patients divided into five malocclusion groups based
on their skeletal ANB classification (Class I with bimaxillary protrusion, Class II division
I, Class II division II, Class III, and Class III surgical cases). The age range was between
13-17 years, except for the Class III subjects who were older at 17-23 years. Tooth size
measurements were taken from models of normal occlusion and pre-treatment models of
patients using a three dimension measuring machine with an accuracy of 0.01mm. Tooth
size ratios were analysed as described by Bolton. T tests showed no sexual dimorphism
for the ratios in each of the six groups, so the sexes were combined in each group and
compared among different malocclusion groups. No significant differences were found
between subcategories of Class II malocclusion. These groups were then combined to
produce 120 subjects in each of three categories: Class I, Class II and Class III. Multi
comparison was then performed between the three groups and the results showed that
Bolton’s anterior ratio, posterior ratio and overall ratio was greatest in Class III and least
in Class II, with Class I subjects in between. The results support the work carried out by
Sperry et al., (1977) which showed that Class III cases with mandibular prognathism had
more subjects with mandibular tooth size excess for the overall ratio than did Class I and
II subjects. Moreover the findings of Nie and Lin (1999) show that not only Class III
surgical but also Class III non surgical groups had a greater frequency of mandibular

tooth size excess than other malocclusion groups. In addition the study also concluded
that there was a tendency for maxillary tooth size excess in Angle Class II malocclusion.
In contrast Crosby and Alexander, (1989) suggested that there were no significant
differences in the incidence of tooth size discrepancies in the four malocclusion groups.
When their sample was taken as a whole there was no significant difference in mean
mesiodistal tooth size ratios as compared to Bolton’s mean, although there were higher
standard deviations. The study consisted of 109 patients randomly selected from a
private practice and divided as follows: 30 Class I cases, 30 Class II div I cases, 29 Class
II div II cases and 20 Class II surgical cases. Measurements were taken with digital
callipers accurate to 0.01mm and the procedure was repeated for error analysis on five
subjects within each malocclusion group. In this study however, skeletal categories were
not mentioned, although some Class II cases were treated surgically. This can be
important in sample selection as some skeletal Class II malocclusions can be converted in
to dental Class I malocclusions by forward movement of the permanent first molar due to
the premature loss of the deciduous second molar, and so a Class I group may contain
both skeletal Class I and Class II patients. Also there were no Class III cases in this
study, and as shown from the previous studies these cases tend to display a high degree of
anterior tooth size discrepancy, which may well have affected the results. In addition
Crosby and Alexander did not differentiate between sexes and did not mention the ratio
of sexes in each group. The study did however show a large number of subjects within
each group with discrepancies greater than 2 SD from the mean, as defined by Bolton’s
study, indicating the importance of tooth size analysis before treatment.
Liano, (2003) and Uysal, (2005) also found no association between TSD and different
malocclusion groups. However in the study by Liano there were only 13 subjects in the
Class III group, which meant that the statistical analysis was dubious. Although Uysal’s
study showed no differences between malocclusion types, all malocclusion groups had
significantly higher average ratios than the group of 150 untreated normal occlusions.
Summary
In summary much of the evidence suggests that mandibular tooth size excess is greatest
in Class III malocclusions (Arauyo and Souki,2003; Nie and Lin, 1999; Ta et al., 2001,
Sperry et al.,1977). Sperry et al., (1977) also showed that there was maxillary tooth
excess in Class II malocclusions. In the Chinese populations studied, both anterior and
posterior ratios were greatest in Class III malocclusions, (Nie and Lin, 1999; Ta et al.,
2001) and in fact Ta et al., (2001) concluded that Bolton’s ratios only applied to Chinese
subjects who were Class I. Although Crosby and Alexander, (1989) concluded there was
no difference in tooth size discrepancy between the malocclusion groups, they did note
the high proportion of subjects with ratios greater than 2SD of Bolton’s ratio within each
group.
1.7 Tooth size discrepancies and racial variation
The incidence of a Bolton’s discrepancy differs between racial groups (Santoro et al.,
1970; Lavelle, 1972; Smith et al, 2000). Bolton’s original 1958 study was carried out on
a group of 55 Caucasian females, and provides no information relating to other racial
groups. The Bolton standards may therefore not necessarily be applicable to other racial
groups.
Lavelle, (1972) compared mesiodistal crown diameters of the maxillary and mandibular
teeth in the three major racial groups, Caucasoid, Mongoloid and Negroid. These three
terms for racial groups are anthropological and are based on skull dimensions. They can
be considered equivalent to white, black and far eastern, as used in many English
speaking countries today (Harradine, 2006). A total of 120 casts with excellent
occlusion were included in the study, 40 from each racial group. Male to female
distribution was equal and all subjects were within the age range 18 to 28 years. Subjects
were chosen to have excellent occlusions, so the means are a good guide to the norms for
a racial group. Mesiodistal crown diameters and percentage overbite were determined.
Tooth dimensions were greater in males than females, and the average mesio- distal
crown diameter was greater in Negroids than in Caucasoids, with that for Mongoloids
being intermediate. This applied to maxillary and mandibular dentitions in both males
and females. In addition both the overall and anterior ratios were greater in Negroids

than in Caucasoids, with Mongloids again being intermediate. Percentage overbite was
greater in Caucasoids than Mongoloids and that for Negroids was intermediate. These
results suggest that there is a greater degree of conformity between the maxillary and
mandibular tooth dimensions in Negroids than in Caucasoids, with that for Mongoloids
being intermediate.
Merz et al., (1991) assessed tooth diameters and arch perimeters in both black and white
populations. Records of 51 black and 50 white patients were selected and mesiodistal
diameters were measured for all teeth in the lower left quadrant, first molar to central
incisor. In addition arch width and depth were measured. The mean mesiodistal crown
diameters of the canines, premolars and molars in the black population were all
significantly larger than for the corresponding teeth in the white population. Mean
mesiodistal diameters of the central and lateral incisors showed no significant difference
between the two groups. Maxillary intercanine and intermolar arch widths were
significantly greater in the black subjects than the white subjects. Mandibular intercanine
and intermolar widths were also greater in the black sample, although the difference was
not statistically significant. In addition both the mean maxillary and mandibular arch
depths were significantly greater in the black sample. The increased dental arch width
and arch depth in the black sample resulted in an increase in arch perimeter more than
sufficient to accommodate larger tooth space requirements.

Smith et al., (2000) support the evidence of racial variation with respect to tooth size,
since they found significant differences in tooth size discrepancy in negroid, caucasoid
and hispanic samples. 60 study models from each racial group with an equal male to
female ratio were measured and anterior, posterior and overall ratios were compared.
There were significant gender and racial differences in the ratios between upper and
lower arch segments. The overall ratio was smallest in caucasoids followed by hispanics
and negroids, and the difference between caucasoids and negroids was highly significant.
The posterior ratio was greatest in negroids, who had larger mandibular teeth than either
caucasoids or hispanics. The difference in the overall ratio between caucasoids and
negroids was primarily due to size differences in the posterior teeth, with the posterior
maxillary segment being 2.3mm larger in negroids and the posterior mandibular segment
3.6mm larger than the caucasoid sample. The anterior ratio was significantly larger in
hispanics than negroids, with caucasoids showing no significant difference from the other
two groups. The anterior ratio showed that caucasoids had larger anterior mandibular
teeth than negroids, a finding which differed from that of Lavelle et al., (1972) who
showed that overall and anterior ratios were greater in Negroids than Caucasoids.
Other studies have looked more specifically at single population groups, such as the
Dominican Americans (Santoro et al., 2000) and Peruvians (Bernabe et al., 2004).
Santoro et al., (2000) examined 54 Dominican Americans and aimed to establish
normative data on the mesiodistal crown dimensions of this population group. The 36
male and 18 female orthodontic patients were second or third generation Dominicans
residing in New York who were racially mixed subjects with homogeneous skin
pigmentation and craniofacial features. Mean, range and standard deviations were
calculated for the sizes of the teeth, and the coefficients of variation were obtained for the
tooth size ratio. Generally the results showed that male crown measurements were
slightly larger and showed a higher variability than female measurements, but followed
the same distribution pattern. When the results were compared to that of the African
American sample and the white sample, they showed a closer resemblance to the former.
Maxillary and mandibular tooth dimensions in Dominicans were slightly smaller than
those in the African American sample, with the exception of the mandibular central and
lateral incisors, which were larger. The crown widths of the Dominicans were however
consistently larger than the crown widths of the North American whites. The American
Dominican tooth ratios were then compared to the Bolton ratios, and it was noted that in
both the overall and anterior ratios the range, standard deviations and coefficients of
variation were larger than in the Bolton study. This may have been due to the fact that
the sample was of patients with orthodontic problems, whereas Bolton’s sample was of
individuals with optimum occlusions. The overall tooth size ratio was equivalent to the
original Bolton overall ratio, but the anterior tooth size ratio was larger than the Bolton
anterior ratio (P < 0.05). In addition a statistically significant overall tooth size
discrepancy was found in 11% of the subjects, whereas 28% exhibited a statistically and
clinically significant anterior discrepancy. The differences shown from the results of this

sample compared to the Bolton ratios, suggest the need for more specific standards for
the Dominican population.
The Dominican population had a close ethnic relationship with the Peruvian population,
and it may therefore be expected to show significant differences in anterior tooth width
ratios (Santoro et al., 2000). However Flores-Mir et al., (2003) found no clinical
differences in tooth widths in a Peruvian population compared with white samples.
Bernabe, (2004) studied 200 Peruvian school children to determine maxillary to
mandibular tooth size ratios. Two standard deviations from the Bolton mean did not
predict clinically significant anterior and total tooth width ratio discrepancies. A tooth
size discrepancy of less than 1.5mm is rarely significant (Proffit, 2000) and only larger
discrepancies create problems in treatment planning. If the mandibular arch is defined as
normal, then a tooth size discrepancy would be described as maxillary tooth width
deficiency or excess. According to this definition 32.5% of this sample had a clinically
significant anterior tooth size discrepancy, and 36.5% had a clinically significant total
tooth size discrepancy, although this was not predicted by the 2 SD range from the Bolton
mean.
Bishara et al., (1989) compared mesio-distal and bucco-lingual crown dimensions in
populations from Egypt, Mexico and the United States. The sample from each

population group was similar in size and matched for age and male to female proportion.
Mesio-distal crown dimensions were measured on casts using pointed callipers. The
findings indicated the presence of sexual dimorphism between the three populations, and
in general sex differences was more pronounced in Mexicans. Comparisons made
between the three groups indicated consistent differences in the maxillary central incisors
for boys, with the Egyptian boys having larger mesiodistal diameters than the US and
Mexican boys. Egyptian girls had significantly larger mesiodistal widths for all first
premolars, mandibular second premolars and first molars than girls from Mexico and the
US. In general there were fewer differences in mesiodistal crown widths between the
boys in the three groups than between the girls, and overall the average differences found
were considered small and not of clinical significance. The differences in tooth
dimensions detected between these different groups could have been related to the degree
of admixture within the population groups. The genetic pool in the Mexicans was largely
of Spanish Caucasian and North American Indian Mongolian descents, whereas as the
US population was an admixture of various Caucasian groups, mainly English,
Scandinavian and German. The Egyptian population seemed to be the least mixed.
Summary
Studies that have assessed tooth size discrepancies with regard to race have shown
differing results. Lavelle et al., (1972) concluded that mesiodistal crown widths were
greater in Negroid, than Caucasoid populations with Mongoloid subjects being

intermediate. This is supported by Merz et al., (1991), who found the mesiodistal widths
of canines, premolars and molars in a black sample to be significantly greater than the
corresponding teeth in a white sample. Smith et al., (2000) also suggested that there was a
trend to larger overall and posterior ratios in black populations compared to white and
hispanic groups, although in contrast to Lavelle et al., (1972), anterior ratios were shown
to be greater in caucasians than negroids. Bernabe et al., (2004) concluded that 2 SD
from the Bolton mean was not sufficient to detect tooth size discrepancies in a Peruvian
population. This certainly suggests that there is much racial variation with respect to
tooth size. However Flores-Mir, (2003) assessed tooth size discrepancy in a Peruvian
population and found no significant differences compared to Bolton, whilst Bishara et al.,
(1989) compared tooth size discrepancies in populations from Mexico, Egypt and the
United States and found that differences detected were of small magnitude and not
clinically significant.

1.8 Tooth size discrepancy and gender
Bishara et al., (1989) assessed tooth dimensions in populations from Egypt, Mexico and
the United States and as well as assessing racial variation, compared female to male
dimensions within each population. Maxillary and mandibular canines and first molars
were larger in Egyptian males than females. The sum of the maxillary right canine and
first and second premolars was also significantly greater in boys. In the Mexican sample
the canines, first premolars, second premolars and first molars were significantly larger in
males than in females, although there was no significant difference between the sexes
regarding incisors. The subjects from the US showed significantly larger canines and
first molars in males than females, with no significant differences between the incisors.
Unfortunately tooth size discrepancy ratios were not measured in this study
Lavelle, (1972) compared maxillary and mandibular tooth size ratios between males and
females. The overall and anterior ratios were both greater in males than females,
although the differences were small, all being less than 1%.

Richardson et al., (1975) sampled 162 American negroes with an equal male to female
distribution. The mean mesiodistal crown dimensions of each type of tooth in the
maxillary and mandibular arches were greater in males than females. The anterior and
overall mandibular to maxillary arch ratios were the same for both males and females.
Other studies have also found no significant differences between tooth size discrepancies
in males and females (Aroujo and Souki, 2003; Alkofide and Hashim, 2002; Nie and Lin,
1999). Smith et al., (2000) however found that overall and posterior ratios were
significantly larger in males than females, although the differences were small (0.7% for
the overall and 0.9% for the posterior ratio).
There is much variation in the literature regarding tooth size discrepancy and gender.
Richardson et al., (1975) showed that tooth dimensions were greater in American Negro
males than females, and this was supported by Bishara et al., (1989), who looked at
populations in Mexico, Egypt, and the United States. However much of the evidence
suggests that gender makes no significant difference to tooth size discrepancy.

1.9 Clinical relevance of tooth size discrepancy
Tooth size discrepancies must be taken into account when treatment is planned since they
are a principal factor in accurate space analysis. At the planning stage it is important to
quantify the space required in each arch to correct a malocclusion. Crowding or spacing,
arch width change and incisor anteroposterior changes can have substantial space
implications. Space analysis can be used to assess the need for extractions, to determine
anchorage requirements and to plan mechanics during treatment.
Crowding or spacing should be related to an arch form that reflects the majority of teeth,
not necessarily the imaginary arch that passes through the incisal edge of the most
prominent central incisor in each arch (Kirschen et al., 2000). Assessment of arch width
and the anteroposterior position of the labial segment is essential when deciding the line
of the arch upon which to base treatment objectives. A diagnostic wax up can be a useful
aid when planning management of tooth size discrepancies as planned tooth movements,
composite additions and prosthetics can be visualised. In addition it also allows a
number of treatment options to be explored prior to deciding upon a definitive plan.

1.10Management of tooth size discrepancy
The goal of orthodontic treatment is to determine the best possible aesthetic and
functional result. Where a tooth size discrepancy exists, there may still be residual spaces
or an excessive overjet or an increased overbite following treatment. Management will of
course depend on whether there is excess space or a shortage of space and this is
discussed in more detail below.
1.11 Tooth tissue reduction
Although tooth size discrepancy problems are usually evaluated during treatment
planning, it not usually until the finishing phase that they are actually dealt with. Inter
proximal dental stripping or “slenderisation” is the usual method to compensate for
discrepancies caused by tooth excess. Space can be gained from reduction of the
mesiodistal width of an unusually broad tooth or from approximal enamel reduction.
When stripping of enamel is part of the original treatment plan, most of the stripping
should be done initially, but final stripping can be deferred until the finishing stage. This
would allow direct observation of the occlusal relationships before the final adjustments
are made (Proffit, 2007).

1.12 Incisor angulation (mesiodistal tip)
Generalised small size deficiencies can be masked by altering the position of the incisors
in several ways, including mesiodistal angulation, inclination and rotation. If upper
incisors are too vertical they take up less space in the arch than if they are correctly
angulated Kirschen et al., (2000). Tuverson, (1980) demonstrated the use of diagnostic
wax ups to show that 2mm of excess space can be absorbed by mesial angulation of
upright upper incisors. However incorrect angulation does not necessarily signify that a
space requirement exists, although, if incorrectly angulated teeth are corrected, space is
gained by correcting them to normal angulation. The space gained is small and it is
important to balance this with the anchorage implications of mesiodistal and apical
movements, which are likely to be of greater clinical relevance.
1.13 Incisor inclination (torque)
Andrews, (1972) pointed out the importance of correct labio-lingual inclination of the
upper incisors if they are to occupy the correct amount of space. Failure to establish
correct inclinations would lead to either an incorrect buccal occlusion or spacing and
would compromise the final aesthetic result (Bass, 1991). Torque of the upper incisors

can be used to compensate for larger or smaller upper incisors. Leaving the incisors
slightly more upright makes them take up less space relative to the lower arch and hence
masks large upper incisors. On the other hand slightly excessive torque can partially
compensate for small upper incisors. Tuverson, (1980) suggested that 1mm of excess
maxillary space could be absorbed by applying palatal root torque to maxillary incisors.
1.14 Building up small teeth
When tooth size discrepancy problems are caused by small teeth, the maxillary lateral
incisors are often to blame. A small space distal to the lateral incisors can be
aesthetically pleasing and functionally acceptable, although the amount of tooth material
in both arches must be proportional to achieve an excellent occlusion. A composite resin
restoration of small lateral incisors is usually the best plan and this can either be carried
out towards the end of treatment or as soon as possible once the patient is in retention.
This would require an initial retainer to hold the space and a new retainer once the
restoration is completed. Alternatively an indirect restoration can be provided, and again
this can be carried out once orthodontic treatment has been completed. The main
advantage of waiting until after orthodontic appliances have been removed is to allow
gingival inflammation to resolve (Proffit, 2007).

1.15 Premolar extractions and their effect on tooth size discrepancy
The decision to extract teeth is a critical one in relation to orthodontic treatment and may
affect the Bolton overall ratio. Premolar teeth are usually the extractions of choice and
Bolton, (1962) discussed the affect of premolar extraction on the overall ratio, which was
reduced from a mean of 91.3% to 86% by extraction of four premolars. Saati and
Yuckay, (1997) investigated whether the extraction of four premolars was a factor in the
creation of a tooth size discrepancy. They assessed 50 pre-treatment casts and
determined the overall Bolton ratio for each. The difference between the pre-treatment
and post-extraction Bolton ratios was found to be statistically significant following first
premolar extractions but not significant for other combinations. Tong et al., (2004) also
found that the overall Bolton ratio decreased after premolar extractions. The effect of a
combination of premolar extractions on tooth size discrepancy was assessed for 213
plaster casts, divided in to those with a small Bolton ratio (89.39% - 1sd), normal Bolton
ratio (between 89.39% and 93.21%) and a large Bolton ratio (93.21% + 1sd). A tooth size
discrepancy occurred in normal overall ratios after premolar extractions, but tooth size
discrepancy might be corrected with big overall ratios after premolar extractions.
Summary
Tooth size discrepancy must be taken in to consideration when planning orthodontic care.
Its impact on an overall case varies with the severity of the discrepancy, although even

small mismatches between maxillary and mandibular arches will affect the overall
orthodontic finish. It is therefore imperative for the accurate planning of cases that an
assessment of any discrepancy is made at this initial phase. Bolton’s ratio is a quick
method to use, however it is uncertain whether the ratios apply to all populations, since
Bolton’s original study was based only upon measurements of white females with
excellent occlusions. The literature is certainly inconclusive on many of these issues.
Although the effects upon Bolton’s ratios of gender, race and malocclusion have been
studied to some extent, there is little evidence in the literature to compare the incidence of
intermaxillary tooth size discrepancy in different racial groupings with similar
malocclusions (Nie, 1999). This is the area that I intend to investigate in the present
study. Within the West Midlands population and the referred population at Birmingham
Dental Hospital many of patients are of Caucasian, Asian or Afro-Caribbean origins, and
therefore I will analyse the Bolton ratio for these three population groups.

CHAPTER TWO

2.1 Objectives
The objectives of the study are to determine:
1. The incidence of a tooth size discrepancy in a referred orthodontic population in
the UK
2. To establish whether there is a difference in tooth size discrepancies between
males and females.
3. To assess racial differences for tooth size discrepancies in different malocclusion
categories.
2.2 Null Hypotheses
There is no difference in the incidence of tooth size discrepancies in a referred
orthodontic population from that of the general population
1. There is no difference in intermaxillary tooth size discrepancy between males
and females
2. There is no difference in intermaxillary tooth size discrepancy between different
racial groups and malocclusion classes

CHAPTER THREE

Materials and Method
3.1 Sampling
360 casts of patients treated at The Birmingham Dental Hospital, Russells Hall Hospital
and Kings Dental Hospital were analysed retrospectively.
3.2 Ethical approval
Ethical approval was obtained from South Staffordshire PCT, Research and Development
approval was obtained from South Birmingham and King’s College London Research
and Development Committees.
3.3 Selection Criteria
Inclusion Criteria
• Orthodontic patients aged between 13 and 25 years.
• All permanent teeth, except for third molars, erupted and present.
• Good quality pre-treatment models
• No severe mesiodistal tooth abrasions
• No restorative treatment affecting mesial and distal surfaces.

Exclusion Criteria
• Subjects with congenitally missing teeth, extracted teeth, broken or
chipped teeth or carious lesions that could affect the mesio-distal crown
width.
• Poor quality study mode
3.4 Subject selection
360 casts were required for the study. These were retrospectively selected dental casts of
patients treated at various UK hospitals. All casts were stored within the hospital
departments.
The variables assessed at were:
Gender
Racial group
Malocclusion
Racial group The racial groups were Caucasian, Asian and AfroCaribbean. This was determined
using the facial views of the clinical photographs that had been taken as part of each
patient’s routine orthodontic records. These photographs were stored on a secure hospital

computer and were accessible only to clinical staff. The Term Asian in this study is used
to define people from the Indian sub continent and included those of Indian, Pakistani
and Bangladeshi origins. The term AfroCaribbean was used to define patients that
originated from the Caribbean. Patients of Middle Eastern and African origins were not
included in the study, as well as patients of mixed racial origin. Identifications were
determined by contacting the clinicians responsible for their care.
Malocclusion group
This was determined using both intra-oral photographs and study models. Both methods
were used to try and eliminate inaccuracies due to photographs being postured or models
incorrectly trimmed. Use of both types of records allowed subjects to be categorised into
a malocclusion group with more confidence.
Subjects were divided in to four malocclusion groups based on the British Standards
Institute’s Incisor Classification (1983), Class I, Class II/I, Class II/II and Class III.
The intra-oral photographs also helped to identify patients who had restorations affecting
their mesial and distal tooth surfaces. This would have prevented accurate measurements
of tooth widths. These patients were not included in the study.

Gender
This was determined using the clinical photographs. Equal numbers of males and
females were selected for each malocclusion class.
Lists were produced for all patients under the care of each clinician, with their basic
information such as date of birth. The ages of the patients could then be determined to
ensure that they were within the required age criteria for the study. The photographs of all
patients that fell in to the required age criteria for the study were then assessed. The
clinical photographs were used to systematically select the final study sample by physical
randomisation; patients were selected sequentially until each group was filled.
Quality of study casts
Prior to carrying out measurements on study models of the selected patients, these models
were firstly assessed to ensure that they were of adequate quality. In a few cases models
were damaged to the extent where it was not possible to carry out accurate mesiodistal
tooth width measurements, these were therefore not used.

3.5 Sample size calculation
The number of subjects required was based on sample size calculations carried out using
an Altmans nomagram.
Significance level = 0.05
Clinically relevant difference CRD (Tooth size discrepancy) = 2.0mm
Power = 0.8
Standard difference =CRD/SD = 2/2 = 1
The normogram, (Altman, 1991 p456) suggests that a sample size of 30 to give 0.8 power
at 0.01 significance level
30 casts per racial group and malocclusion group were therefore used for the study,
giving a sample of 120 casts per racial group and a total of 360 casts. Each group had an
equal gender distribution.
3.6 Reproducibility study
Prior to the main study 30 casts were randomly selected for an initial reproducibility
study to evaluate and assess the accuracy of a single operator. The measurements were
then repeated four weeks later
3.7 Model measurement
All measurements were carried out by a single operator (I M). Measurements on the
casts were made using HATS digital callipers to the nearest 0.01mm. (Figure 2.1)
Measurements of individual mesiodistal tooth widths were taken from first molar to first
molar in each arch. In a well aligned dentition measurements were made from mesial
contact point to distal contact point. Where teeth were rotated their mesial and distal
points in the de-rotated positions were measured. Measurements taken with the callipers
were automatically recorded by the HATS software onto a computer screen and the sum
of the upper and lower teeth was generated. The data was then transferred on to an Excel
spreadsheet for further analysis (Figure 2.2)
3.8 Data analysis
Data were analysed using the Minitab statistical package

Figure 2.1
The Hamilton Arch Tooth System (HATS) digital calipers. Developed by Dr David Hamilton of Pennsylvania and supplied by Dentsply GAC.

Figure 2.2
The HATS computer screen The HATS computer screen above shows the data recorded by the HATS software.
Individual tooth widths are automatically inputted in to the table and the sum of the upper
and lower teeth, and the recommended tooth size corrections are calculated.

CHAPTER FOUR

4.1 Results Table 4.1 Descriptive Results for Reproducibility Testing Paired t Test and Confidence Interval Tooth 1st Mean 2nd Mean P Value Significance of
difference UR6 10.57 10.59 0.51 NS UR5 7.08 7.02 0.54 NS UR4 7.24 7.31 0.51 NS UR3 7.95 7.95 0.85 NS UR2 7.11 7.09 0.66 NS UR1 8.75 8.77 0.62 NS UL1 8.65 8.66 0.61 NS UL2 6.91 6.92 0.74 NS UL3 7.83 7.83 0.98 NS UL4 7.35 7.37 0.70 NS UL5 7.00 6.98 0.53 NS UL6 10.65 10.64 0.89 NS LL6 10.92 10.92 0.99 NS LL5 7.58 7.56 0.55 NS LL4 7.49 7.48 0.78 NS LL3 6.89 6.89 1.00 NS LL2 6.19 6.22 0.61 NS LL1 5.61 5.61 0.97 NS LR1 5.51 5.52 0.63 NS LR2 6.06 6.09 0.56 NS LR3 6.83 6.82 0.84 NS LR4 7.46 7.47 0.78 NS LR5 7.50 7.49 0.70 NS LR6 10.97 10.95 0.63 NS Key: NS= Not significant
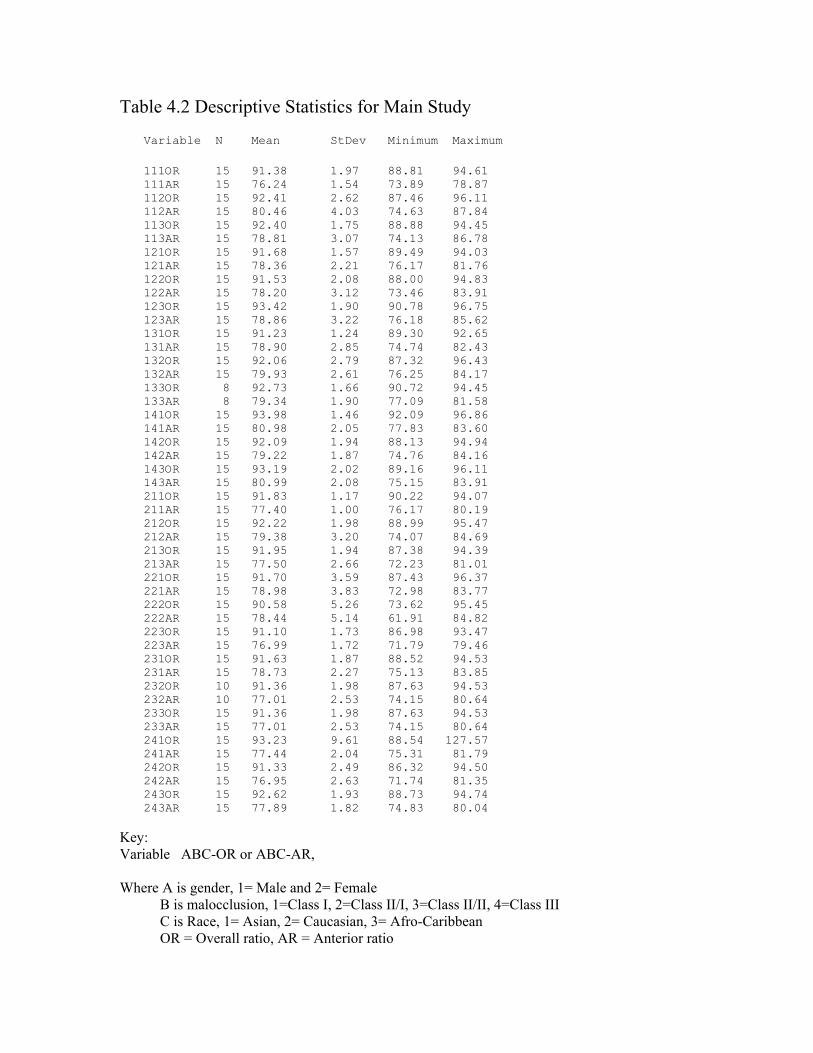
Table 4.2 Descriptive Statistics for Main Study
Variable N Mean StDev Minimum Maximum
111OR 15 91.38 1.97 88.81 94.61 111AR 15 76.24 1.54 73.89 78.87 112OR 15 92.41 2.62 87.46 96.11 112AR 15 80.46 4.03 74.63 87.84 113OR 15 92.40 1.75 88.88 94.45 113AR 15 78.81 3.07 74.13 86.78 121OR 15 91.68 1.57 89.49 94.03 121AR 15 78.36 2.21 76.17 81.76 122OR 15 91.53 2.08 88.00 94.83 122AR 15 78.20 3.12 73.46 83.91 123OR 15 93.42 1.90 90.78 96.75 123AR 15 78.86 3.22 76.18 85.62 131OR 15 91.23 1.24 89.30 92.65 131AR 15 78.90 2.85 74.74 82.43 132OR 15 92.06 2.79 87.32 96.43 132AR 15 79.93 2.61 76.25 84.17 133OR 8 92.73 1.66 90.72 94.45 133AR 8 79.34 1.90 77.09 81.58 141OR 15 93.98 1.46 92.09 96.86 141AR 15 80.98 2.05 77.83 83.60 142OR 15 92.09 1.94 88.13 94.94 142AR 15 79.22 1.87 74.76 84.16 143OR 15 93.19 2.02 89.16 96.11 143AR 15 80.99 2.08 75.15 83.91 211OR 15 91.83 1.17 90.22 94.07 211AR 15 77.40 1.00 76.17 80.19 212OR 15 92.22 1.98 88.99 95.47 212AR 15 79.38 3.20 74.07 84.69 213OR 15 91.95 1.94 87.38 94.39 213AR 15 77.50 2.66 72.23 81.01 221OR 15 91.70 3.59 87.43 96.37 221AR 15 78.98 3.83 72.98 83.77 222OR 15 90.58 5.26 73.62 95.45 222AR 15 78.44 5.14 61.91 84.82 223OR 15 91.10 1.73 86.98 93.47 223AR 15 76.99 1.72 71.79 79.46 231OR 15 91.63 1.87 88.52 94.53 231AR 15 78.73 2.27 75.13 83.85 232OR 10 91.36 1.98 87.63 94.53 232AR 10 77.01 2.53 74.15 80.64 233OR 15 91.36 1.98 87.63 94.53 233AR 15 77.01 2.53 74.15 80.64 241OR 15 93.23 9.61 88.54 127.57 241AR 15 77.44 2.04 75.31 81.79 242OR 15 91.33 2.49 86.32 94.50 242AR 15 76.95 2.63 71.74 81.35 243OR 15 92.62 1.93 88.73 94.74 243AR 15 77.89 1.82 74.83 80.04
Key: Variable ABC-OR or ABC-AR, Where A is gender, 1= Male and 2= Female B is malocclusion, 1=Class I, 2=Class II/I, 3=Class II/II, 4=Class III C is Race, 1= Asian, 2= Caucasian, 3= Afro-Caribbean OR = Overall ratio, AR = Anterior ratio

4.1 Statistical Analysis Two- Sample T tests were used to investigate differences between male and female subjects in the following twelve categories: Class I Asian Class I Caucasian Class I Afro Caribbean Class II/I Asian Class I//I Caucasian Class II/I Afro Caribbean Class II/II Asian Class II/II Caucasian Class II/II Afro Caribbean Class III Asian Class III Caucasian Class III Afro Caribbean ANOVA was used to test for differences between blocks of data as grouped with regard to anterior or posterior ratio; racial group; and malocclusion Class. The following comparisons were made: Combined overall ratios by malocclusion group Combined overall ratios for Asians by malocclusion group Combined overall ratios for Caucasians by malocclusion group Combined overall ratios for Afro Caribbeans by malocclusion group Combined anterior ratios by malocclusion group Combined anterior ratios for Asians by malocclusion group Combined anterior ratios for Caucasians by malocclusion group Combined anterior ratios for Afro Caribbeans by malocclusion group Combined overall ratios by racial groups Class I overall ratios by racial group Class II/I overall ratios by racial group Class II/II overall ratios by racial group Class III overall ratios by racial group Combined anterior ratios by racial group Class I anterior ratios by racial group Class II/I anterior ratios by racial group Class II/I anterior ratios by racial group Class III anterior ratios by racial group

Table 4.3 Paired T test values for differences in overall ratios by gender
Race/Malocclusion Class I Class II/I Class II/II Class III Asian 0.45 0.98 0.56 0.77 Caucasian 0.82 0.52 0.63 0.36 Afro-Caribbean 0.52 0.002* 0.13 0.44 Table 4.4 Paired T test values for differences in anterior ratios by gender Race/Malocclusion Class I Class II/I Class II/II Class III Asian 0.02* 0.59 0.24 0.00* Caucasian 0.42 0.88 0.19 0.01* Afro-Caribbean 0.23 0.06 0.04* 0.00* Key- * denotes values of significance (p< 0.05) Significant differences between males and females for the overall ratio only existed for the Class II/I Afro- Caribbean group. There were significant differences in the anterior ratio for all the racial groups with Class III malocclusions, and for Class I Asians and Class II/II Afro- Caribbeans.

Table 4.5 ANOVA for combined overall ratios by malocclusion group Individual 95% CIs For Mean Based on Pooled StDev Occlusion N Mean StDev --+---------+---------+---------+------- I 90 92.03 1.93 (------*-------) II/I 90 91.67 3.04 (-------*-------) II/2 108 91.78 2.06 (------*------) III 60 93.12 4.97 (---------*--------) --+---------+---------+---------+------- 91.20 92.00 92.80 93.60 One way ANOVA R-Sq (Adj)= 1.98%; F= 3.34; p < 0.05
Key I - Class I incisor occlusion II/I- Class II division I incisor malocclusion II/2- Class II division II incisor malocclusion III – Class III incisor malocclusion There were significant differences between the means of the four malocclusion groups. This difference arose due to the difference between the mean for the Class III subjects (93.12) and both the Class II division I (91.67) and Class II division II subjects (91.78). A print out for ANOVA results can be interpreted in terms of overlapping between the confidence intervals of the respective groups. Space between confidence intervals is indicative of significance. Overlapping of the confidence intervals for different groups indicates absence of significant difference between them . Table 4.6 ANOVA for Overall Asian ratios by malocclusion group Individual 95% CIs For Mean Based on Pooled StDev Occlusion N Mean StDev +---------+---------+---------+--------- I 30 91.61 1.609 (--------*--------) II/I 30 91.69 2.720 (--------*--------) II/2 30 91.41 1.613 (--------*---------) III 30 93.60 6.763 (--------*--------) +---------+---------+---------+--------- 90.0 91.5 93.0 94.5 One way ANOVA R-Sq (Adj)=2.81%; F= 2.15; P <0.098
There were no significant differences between the means of the malocclusion groups

Table 4.7 ANOVA for Overall Caucasian ratios by malocclusion group Individual 95% CIs For Mean Based on Pooled StDev Occlusion N Mean StDev +---------+---------+---------+--------- I 30 92.32 2.29 (---------*---------) II/I 30 91.05 3.96 (----------*---------) II/2 30 91.85 2.34 (---------*----------) III 30 91.71 2.23 (---------*---------) +---------+---------+---------+--------- 90.0 91.0 92.0 93.0 One way ANOVA R-Sq (Adj)=0.10%; F= 1.04; P <0.377
There were no significant differences between the means of the malocclusion groups Table 4.8 ANOVA for Overall Afro-Caribbean ratios by malocclusion Individual 95% CIs For Mean Based on Pooled StDev Occlusion N Mean StDev ---------+---------+---------+---------+ I 30 92.17 1.83 (---------*---------) II/I 30 92.26 2.14 (---------*---------) II/2 18 91.97 1.92 (------------*------------) III 30 92.91 1.97 (---------*---------) ---------+---------+---------+---------+ 91.70 92.40 93.10 93.80 One way ANOVA R-Sq (Adj)=0.34%; F= 1.12; P <0.344
There were no significant differences between the means of the malocclusion groups

Table 4.9 ANOVA for Combined anterior ratios by malocclusion group
Individual 95% CIs For Mean Based on Pooled StDev
Occlusion N Mean StDev +---------+---------+---------+--------- I 90 78.30 3.046 (--------*-------) II/I 90 78.30 3.360 (--------*-------) II/2 108 78.28 2.658 (-------*-------) III 60 79.66 2.454 (----------*----------) +---------+---------+---------+--------- 77.70 78.40 79.10 79.80 One way ANOVA R-Sq (Adj)= 2.21%; F=3.61; P< 0.05
There were significant differences between the means of the malocclusion groups. This difference arose due to the difference between the mean for the Class III subjects (79.66) and the Class I (78.30), Class II division I (78.30) and Class II division II subjects (78.28). Table 4.10 ANOVA for anterior Asian ratios by malocclusion Individual 95% CIs For Mean Based on Pooled StDev Occlusion N Mean StDev --------+---------+---------+---------+- I 30 76.82 1.41 (-------*-------) II/I 30 78.67 3.09 (-------*-------) II/2 30 78.24 3.02 (-------*-------) III 30 79.21 2.70 (-------*-------) --------+---------+---------+---------+- 76.8 78.0 79.2 80.4 One way ANOVA R-Sq (Adj)= 8.11%; F=4.5; P< 0.005
There were significant differences between the means of the malocclusion groups. This difference arose due to the difference between the mean for the Class I subjects (76.82) and the Class II/I (78.67) and Class III subjects (79.21)

Table 4.11 ANOVA for anterior Caucasian ratios by malocclusion Individual 95% CIs For Mean Based on Pooled StDev Occlusion N Mean StDev ---------+---------+---------+---------+ I 30 79.917 3.617 (---------*---------) II/I 30 78.317 4.179 (---------*---------) II/2 30 79.328 2.477 (---------*---------) III 30 78.085 2.518 (---------*---------) ---------+---------+---------+---------+ 78.0 79.2 80.4 81.6 One way ANOVA R-Sq (Adj)= 2.61%; F= 2.06; P <0.109 There were no significant differences between the means of the malocclusion groups Table 4.12 ANOVA for anterior Afro-Caribbean ratios by malocclusion Individual 95% CIs For Mean Based on Pooled StDev Occlusion N Mean StDev --+---------+---------+---------+------- I 30 78.15 2.90 (---------*--------) II/I 30 77.92 2.71 (--------*---------) II/II 18 78.05 2.51 (-----------*------------) III 30 79.44 2.49 (--------*---------) --+---------+---------+---------+------- 77.0 78.0 79.0 80.0 One way ANOVA R-Sq (Adj)= 2.76%; F= 2.01; P <0.117 There were no significant differences between the means of the malocclusion groups

Table 4.13 ANOVA for Combined overall ratios by racial group Individual 95% CIs For Mean Based on Pooled StDev Race N Mean StDev ------+---------+---------+---------+--- Asian 120 92.076 3.873 (----------*---------) Caucasian 120 91.731 2.800 (----------*---------) Afro-Caribbean 108 92.366 1.977 (----------*-----------) ------+---------+---------+---------+--- 91.50 92.00 92.50 93.00 One way ANOVA R-Sq (Adj)= 0.15%; F= 1.27; P <0.283 Key A = Asian C = Caucasian AC= Afro Caribbean No significant differences were found between the means of the racial groups Table 4.14 ANOVA for Class I overall ratios by racial group Individual 95% CIs For Mean Based on Pooled StDev Race N Mean StDev -----+---------+---------+---------+---- Asian 30 91.608 1.609 (-----------*----------) Caucasian 30 92.315 2.287 (-----------*----------) Afro-Caribbean 30 92.174 1.833 (----------*-----------) -----+---------+---------+---------+---- 91.20 91.80 92.40 93.00 One way ANOVA R-Sq (Adj)= 0.29%; F= 1.13; P <0.328
No significant differences were found between the means of the racial groups

Table 4.15 ANOVA for Class II/I overall ratios by racial groups Individual 95% CIs For Mean Based on Pooled StDev Level N Mean StDev +---------+---------+---------+--------- Asian 30 91.69 2.72 (----------*----------) Caucasian 30 91.05 3.96 (----------*----------) Afro-Caribbean 30 92.26 2.14 (----------*----------) +---------+---------+---------+--------- 90.0 91.0 92.0 93.0 One way ANOVA R-Sq (Adj)= 0.41%; F= 1.18; P <0.312
No significant differences were found between the means of the racial groups Table 4.16 ANOVA for Class II/II overall ratios by racial groups Individual 95% CIs For Mean Based on Pooled StDev Race N Mean StDev ---------+---------+---------+---------+ Asian 30 91.41 1.61 (-----------*------------) Caucasian 30 91.85 2.34 (-----------*-----------) Afro-Caribbean 18 91.97 1.92 (---------------*--------------) ---------+---------+---------+---------+ 91.20 91.80 92.40 93.00 One way ANOVA R-Sq (Adj)= 0.00%; F= 0.57; P <0.57
No significant differences were found between the means of the racial groups

Table 4.17 ANOVA for Class III overall ratios by racial groups Individual 95% CIs for Mean Based on Pooled StDev Race N Mean StDev ---------+---------+---------+---------+ Asian 30 93.60 6.77 (---------*---------) Caucasian 30 91.71 2.23 (---------*----------) Afro-Caribbean 30 92.91 1.97 (---------*----------) ---------+---------+---------+---------+ 91.5 93.0 94.5 96.0 One way ANOVA R-Sq (Adj)= 1.13%; F= 1.51; P <0.23
No significant differences were found between the means of the racial groups Table 4.18 ANOVA for Combined anterior ratios by racial groups Individual 95% CIs for Mean Based on Pooled StDev Race N Mean StDev ------+---------+---------+---------+--- Asian 120 78.23 2.757 (----------*---------) Caucasian 120 78.91 3.323 (---------*----------) Afro-Caribbean 108 78.43 2.711 (-----------*----------) ------+---------+---------+---------+--- 78.00 78.50 79.00 79.50 One way ANOVA R-Sq (Adj)= 0.393%; F= 1.67; P <0.19
No significant differences were found between the means of the racial groups

Table 4.19 ANOVA for Class I anterior ratios by racial group Individual 95% CIs For Mean Based on Pooled StDev Race N Mean StDev -----+---------+---------+---------+---- A 30 76.82 1.41 (------*------) C 30 79.92 3.62 (------*------) AC 30 78.15 2.90 (------*------) -----+---------+---------+---------+---- 76.5 78.0 79.5 81.0 One way ANOVA R-Sq (Adj)= 15.65%; F= 9.26; P < 0.01 There were significant differences between the means of the three racial groups. This difference arose due to the difference between the mean for the Asian subjects (76.82) and that for the Caucasian subjects (79.92). Table 4.20 ANOVA for Class II/I anterior ratios by racial group Individual 95% CIs For Mean Based on Pooled StDev Race N Mean StDev ---+---------+---------+---------+------ Asian 30 78.67 3.09 (------------*-----------) Caucasian 30 78.32 4.18 (-----------*-----------) Afro-Caribbean 30 77.92 2.71 (-----------*------------) ---+---------+---------+---------+------ 77.0 78.0 79.0 80.0 One way ANOVA R-Sq (Adj)= 0.00%; F= 0.36; P < 0.696
No significant differences were found between the means of the racial groups

Table 4.21 ANOVA for Class II/II anterior ratios by racial group Individual 95% CIs For Mean Based on Pooled StDev Race N Mean StDev --+---------+---------+---------+------- Asian 30 78.24 3.024 (--------*---------) Caucasian 30 79.33 2.477 (---------*---------) Afro-Caribbean 18 78.05 2.511 (-----------*------------) --+---------+---------+---------+------- 77.0 78.0 79.0 80.0 One way ANOVA R-Sq (Adj)= 1.85%; F= 1.73; P < 0.185
No significant differences were found between the means of the racial groups Table 4.22 ANOVA for Class III anterior ratios by racial group Individual 95% CIs For Mean Based on Pooled StDev Race N Mean StDev --------+---------+---------+---------+- Asian 30 79.21 2.70 (--------*--------) Caucasian 30 78.09 2.52 (--------*--------) Afro-Caribbean 30 79.44 2.49 (--------*---------) --------+---------+---------+---------+- 78.0 79.0 80.0 81.0 One way ANOVA R-Sq (Adj)= 3.03%; F= 2.39; P < 0.098
No significant differences were found between the means of the racial groups

CHAPTER FIVE
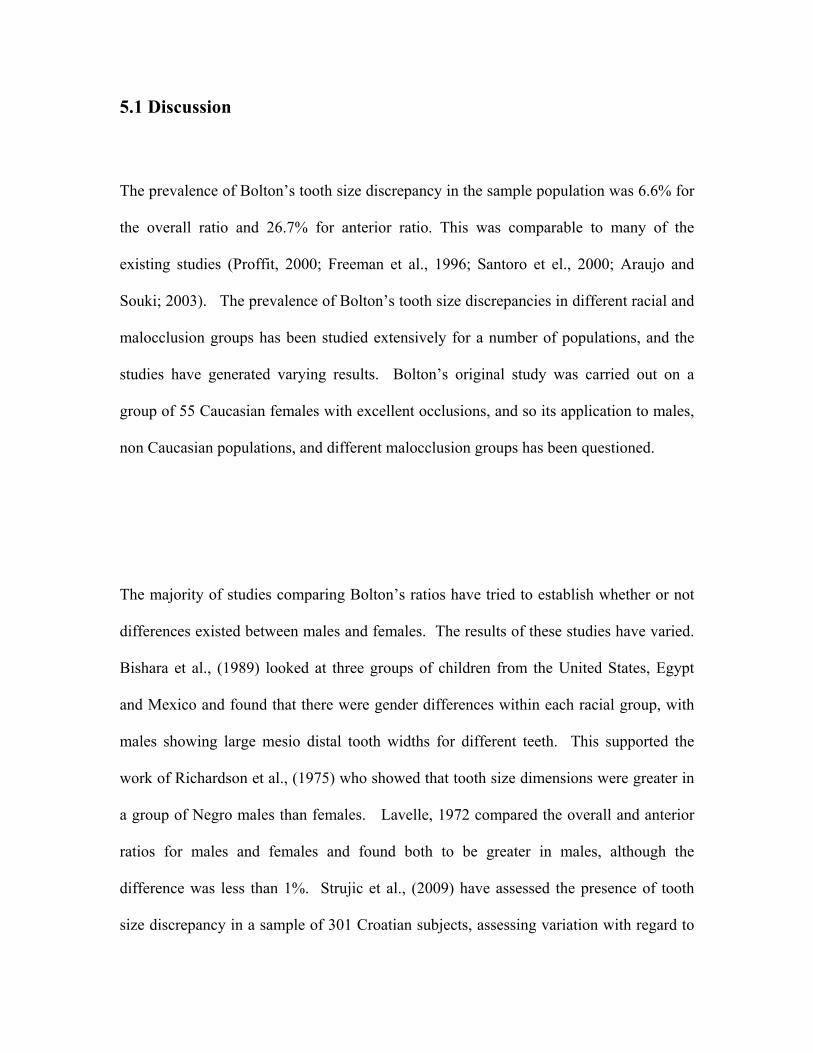
5.1 Discussion
The prevalence of Bolton’s tooth size discrepancy in the sample population was 6.6% for
the overall ratio and 26.7% for anterior ratio. This was comparable to many of the
existing studies (Proffit, 2000; Freeman et al., 1996; Santoro et el., 2000; Araujo and
Souki; 2003). The prevalence of Bolton’s tooth size discrepancies in different racial and
malocclusion groups has been studied extensively for a number of populations, and the
studies have generated varying results. Bolton’s original study was carried out on a
group of 55 Caucasian females with excellent occlusions, and so its application to males,
non Caucasian populations, and different malocclusion groups has been questioned.
The majority of studies comparing Bolton’s ratios have tried to establish whether or not
differences existed between males and females. The results of these studies have varied.
Bishara et al., (1989) looked at three groups of children from the United States, Egypt
and Mexico and found that there were gender differences within each racial group, with
males showing large mesio distal tooth widths for different teeth. This supported the
work of Richardson et al., (1975) who showed that tooth size dimensions were greater in
a group of Negro males than females. Lavelle, 1972 compared the overall and anterior
ratios for males and females and found both to be greater in males, although the
difference was less than 1%. Strujic et al., (2009) have assessed the presence of tooth
size discrepancy in a sample of 301 Croatian subjects, assessing variation with regard to

Angle’s classification and looking at sexual dimorphism. Their results showed a
statistically significant gender difference in the anterior ratio (P= 0.017). The results of
the present study support these findings as most of the significant tooth size discrepancies
between males and females in the existing sample were in the anterior ratios.
T tests were carried out to compare overall and anterior ratios by gender. Significant
differences in the overall ratios were found only in the Class II division I Afro-Caribbean
subjects. There were significant differences in the anterior ratios of all Class III
malocclusions, and for Class I Asians and Class II/II Afro-Caribbeans. From the existing
study it appears that on the whole, tooth size discrepancies between males and females is
largely limited to the anterior ratio and particularly affects Class III subjects.
Much of the research assessing the association between malocclusion and tooth size
discrepancy suggests that mandibular tooth size excess is greatest in Class III
malocclusions (Arauyo and Souki, 2003; Nie and Lin, 1999; Ta et al., 2001, Sperry et
al.,1977). This was supported by the findings of the current study, as significant
differences existed for the overall and anterior ratios in Class III subjects. ANOVA was
used to compare combined overall ratios by malocclusion groups, and significant
differences were found between the means of the four malocclusion groups due to
differences between the means for the Class III subjects and those of the Class II/I and
Class II/II subjects. The mean for the Class III subjects was significantly greater than
that of the Class II groups, suggesting overall mandibular tooth size excess in the Class

III group. No significant differences were found for the overall ratios of individual racial
groups. Data for the combined anterior ratios showed significant differences between the
means of some malocclusion groups. These differences arose due to difference in the
means between Class III subjects and the other three groups, with that of the Class III
group being significantly greater. Again this suggests that a mandibular tooth size excess
exists in Class III subjects. When comparing anterior ratios for individual racial groups
by malocclusion, significant differences were found between the means of the Class I
Asian subjects and the Class III Asian subjects. Again the mean ratio for the Class III
group was greater, suggesting that mandibular tooth size excess existed in the Class III
Asian group compared to the Class I group.
Different racial groups were compared in the work carried out in the United Kingdom by
Lavelle, (1972). A local white population was compared to Far eastern immigrants from
Hong Kong and black immigrants from Africa. All groups had excellent occlusions and
the mesio-distal tooth widths of their teeth were compared. The average mesio- distal
crown diameter was greater in the black group than in the white, with that for far eastern
group being intermediate. This applied to maxillary and mandibular dentitions in both
males and females. In addition both the overall and anterior ratios were greater in Black
group than in the white, with far eastern again being intermediate.

This was supported by Smith et al., (2000) who found significant differences in tooth size
discrepancy in negroid, caucasoid and hispanic samples. The overall ratio was smallest
in caucasoids followed by hispanics and negroids, and the difference between caucasoids
and negroids was highly significant. The posterior ratio was greatest in negroids, who had
larger mandibular teeth than either caucasoids or Hispanics. The anterior ratio was
significantly larger in hispanics than negroids, with caucasoids showing no significant
difference from the other two groups. The anterior ratio showed that caucasoids had
larger anterior mandibular teeth than negroids, a finding which differed from that of
Lavelle et al., (1972) who showed that overall and anterior ratios were greater in
Negroids than Caucasoids.
Merz et al, (1991) assessed tooth diameters in both black and white populations in the
United States. The mean mesiodistal crown diameters of canines, premolars and molars
in the black population were all significantly larger than for the corresponding teeth in the
white population, which supports the results of Lavelle et al., (1972). In addition both the
mean maxillary and mandibular arch depths were significantly greater in the black
sample resulting in an increase in arch perimeter more than sufficient to accommodate
larger tooth space requirements; therefore the black population did not have significantly
more crowding.

Other studies have not found racial variation to be a significant factor in the presence of
tooth size discrepancies. Flores-Mir, (2003) assessed tooth size discrepancy in a
Peruvian population and similar results to those of Bolton, (1958). Bishara et al., (1989)
compared tooth size discrepancies in populations from Mexico, Egypt and the United
States and found that differences were small magnitude and not clinically significant.
The present study assessed three racial groups, Asians, Caucasians and Afro Caribbeans.
ANOVA was used to test for differences in anterior and overall ratios in the three racial
groups. No significant differences were found in the overall ratios for the three racial
groups for combined ratios or any malocclusion Class. In addition, no significant
differences were found between the combined anterior ratios of individual malocclusion
Classes, except for the Class I group where significant differences were found between
the anterior ratios of the Asian and Caucasian Class I groups. The mean anterior ratio for
the Caucasian group (79.92) was significantly larger than the mean of the Asian group
(76.82). The anterior ratio for the Afro-Caribbean group was intermediate (78.00),
although did not differ significantly from the other two groups. This supports the work of
Smith et al., (2000) in which there was no significant difference in the anterior ratios of
Caucasians and negroids. No significant differences existed between the means of the
combined overall and anterior ratios of Asians and Caucasians and the only significant
difference was in the Class I group. No study has examined Caucasian and Asian (Indian

sub-continent) populations and so it is not possible to make comparisons with the present
findings.
On the whole the results of the current study suggest that differences in tooth size
discrepancies are affected by gender and malocclusion group, particularly in Class III
subjects. The anterior ratios of all Class III subjects showed significant differences
between males and females. This was the only malocclusion group to show such gender
differences for all three racial groups. When the malocclusion groups were compared,
both the overall and anterior ratios were greatest in the Class III groups suggesting
mandibular tooth size excess. Only one significant difference was found when
comparing racial groups. This was between anterior ratios in Class I Asian and Class I
Caucasian subjects.

CHAPTER SIX

6.1 Conclusions
• The prevalence of tooth size discrepancy in the sample population was 6.03% in
the overall ratio and 26.7% for the anterior ratio
• Significant differences between males and females for overall ratios existed only
for Class II/I Afro- Caribbean subjects.
• There were significant differences between males and females in the anterior
ratios for all racial groups with Class III malocclusions. Differences also were
found for Class I Asians and Class II/II Afro- Caribbeans
• There were significant differences between the means of the combined overall
ratios for the four malocclusion groups. These differences arose due to the mean
for the Class III subjects being significantly greater than the means for both Class
II division I and Class II division II subjects
• There were significant differences between the means of the combined anterior
ratios for the four malocclusion groups. These differences arose due the mean for
the Class III subjects being significantly greater than those of the other
malocclusion groups.
• There were significant differences between the means of the anterior ratios for the
Asian subjects by malocclusion class. The mean for the Class I subjects was
significantly lower than for the Class II/I and Class III subjects
• There were significant differences between the means of the three racial groups.
This difference arose due to difference between the means for the Asian subjects
and that Caucasian subjects.

CHAPTER SEVEN

7.1 References
1. Alkofide E and Hashim H
Intermaxillary tooth size discrepancy among different malocclusion classes: a
comparative study
The Journal of Clinical Pediatric Dentistry
2002; 26(4): 383-7
2. Alvesalo and Portin 1969
The inheritance pattern of missing, peg shaped and mesio-distally reduced
upper lateral incisors
Acta Odontologica Scandinavica
1969; 27(6): 563-75
3. Andrews LF
The six keys to normal occlusion
American Journal of Orthodontics
1972; 62(3): 296-309
4. Arkutu N
Bolton’s Discrepancy-which way is best?
Poster 3, British Orthodontic Conference 2004
5. Aroujo E and Souki M
Bolton anterior tooth size discrepancies among different malocclusion groups
The Angle orthodontist
2003; 73: 307-13

6. Bass NM
The aesthetic analysis of the face
European Journal of Orthodontics
1991; 13(5): 343-350
2. Bennett JC and McLaughlin RP
Orthodontic treatment mechanics and the preadjusted appliance,
London, Wolfe Medical Publishing
1993
3. Bernabe E, Major PW and Flores-Mir C
Tooth-width ratio discrepancies in a sample of Peruvian adolescents
American Journal of Orthodontics and Dentofacial Orthopedics
2004; 125: 361-5
4. Bishara SE, Jakobsen JR, Abdallah EM and Garcia AF.
Comparisons of mesiodistal and buccolingual crown dimensions of the
permanent teeth in three populations from Egypt, Mexico and the United
States
American Journal of Orthodontics and Dentofacial Orthopedics
1989; 96:416-22
5. Black GV
Descriptive anatomy of human teeth, 4th edition
Philadelphia: S.S. White, 1902

6. Bolton WA
Disharmony in tooth size and its relation to the analysis and treatment of
malocclusion
The Angle Orthodontist
1958; 28: 113-30
7. Bolton WA
The clinical application of a tooth size analysis
American Journal of Orthodontics
1962; 48: 504-529
8. Brin I, Becker A, and Shalhav M
Position of the maxillary permanent canine in relation to the anomalous or
missing lateral incisors: A population study
European Journal of Orthodontics
1986; 8:12-16
9. Crosby DR and Alexander CG 1989
The occurrence of tooth size discrepancies among different malocclusion
groups
American Journal of Orthodontics and Dentofacial Orthopedics
1989; 95:457-61
10. Flores-Mir C, Bernabe E, Camus C, Carhuayo MA, Major PW
Prediction of mesiodistal canine and premolar tooth width in a sample of
Peruvian adolescents
Orthodontics and Craniofacial research

2003; 6: 173-6
11. Freeman JE, Maskeroni AJ and Lorton L
Frequency of Bolton tooth size discrepancies among orthodontic patients
American Journal of Orthodontics and Dentofacial Orthopedics
1996; 110:24-7
12. Gravely JF and Johnston DD
Variation in expression of hypodontia in monozygotic twins
Dental Practitioner
1971; 21: 212
13. Harris EF and Smith RJ
Occlusion and arch size in families: A principal components analysis
The Angle Orthodontist
1982; 52: 135-43
14. Ho CTC and Freer TJ
A computerized tooth width analysis
Journal of Clinical orthodontics
1999; 33:498-503
15. Houston WJB
The analysis of errors in orthodontic measurements
American Journal of Orthodontics and Dentofacial Orthopedics
1983; 83: 382-9

16. Jowett AK, Vaino S, Ferguson MW, Sharpe PT and Thesleff I
Epithelial-mesenchymal interactions are required for MSX1 and MSX2 gene
expression in the developing murine molar tooth.
Development 1993; 117: 461-470
17. Kirschen RH, O’Higgins EA and Lee RT
The royal London space planning: An integration of space analysis and
treatment planning: Part II: The effect of other treatment procedures on space
American Journal of Orthodontics and Dentofacial Orthopedics
2000; 118(4):456-61
18. Lavelle CLB
Maxillary and mandibular tooth size in different racial group and in different
occlusal categories
American Journal of Orthodontics and Dentofacial Orthopedics
1972; 61:29-37
19. Liano A, Quaremba G, Paduano S and Stanzione S
Prevalence of tooth size discrepancy among different malocclusion groups
Progress in Orthodontics
2003; 4: 37-44
20. Lundstrom A
The importance of genetic and non-genetic factors in the facial skeleton
studied in 100 pairs of twins
European Orthodontic Society Report Congress
1948; 30: 92-107

21. Merz ML, Isaacson RJ, Germane N and Rubenstein LK
Tooth diameters and arch perimeters in a black and white population
American Journal of Orthodontics and Dentofacial Orthopedics
1991; 100: 53-8
22. Mackenzie A, Ferguson MW, Sharpe PT
Hox-7 expression during murine craniofacial development.
Development
1991; 113: 601-611
23. Markovic MD
At the crossroads of oral facial genetics
European Journal of Orthodontics
1992; 14: 469-481
24. Moorrees CFA, Thomsen SO, Jensen E, Yen PK
Mesiodistal crown diameters of the deciduous and permanent teeth in
individuals
Journal of dental research
1957; 36:39-47
25. Mossey PA
The Heritability of malocclusion: Part 2. The influence of genetics in
malocclusion
Journal of Orthodontics
1999; 26:195-203

26. Neff CW
Tailored occlusion with the anterior coefficient
American Journal of Orthodontics and Dentofacial Orthopedics
1949; 35: 309-14
27. Nie Q and Lin J
Comparison of intermaxillary tooth size discrepancies among different
malocclusion groups
American Journal of Orthodontics and Dentofacial Orthopedics
1999; 116: 539-44
28. Othman SA and Harradine NWT
Tooth- size discrepancy and Bolton’s ratios: a literature review
The Journal of Orthodontics
2006; 33: 45-51
29. Othman SA and Harradine NW
Tooth size discrepancy and Bolton’s ratios: The reproducibility and speed of
two methods of measurements
The Journal of Orthodontics
2007; 34(4): 234-42
30. Othman S and Harradine N
Tooth size discrepancies in an adult orthodontic population
The Angle Orthodontist
2007; 77 (4): 668-74

31. Proffit WR
Contemporary orthodontics
St Louis: Mosby- Year Book; 1993
32. Proffit WR
Contemporary Orthodontics
St. Louis: Mosby- Year Book; 2007
33. Richardson ER, Malhotra SK
Mesiodistal crown dimension of the permanent dentition of American
Negroes
American Journal of Orthodontics and Dentofacial Orthopedics
1975; 68: 157-64
34. Satokata I and Maas R 1994
MSX1 deficient mice exhibit cleft palate and abnormalities of craniofacial and
tooth development
Nature Genetics
1994; 6: 348 –356
35. Saatci P and Yukay F
The effect of premolar extractions on tooth size discrepancy
American Journal of Orthodontics and Dentofacial Orthopedics
1997; 111: 428-34

36. Santoro M, Ayoub ME, Pardi VA and Cangialosi TJ
Mesiodistal crown dimensions and tooth size discrepancy of the permanent
dentition of Dominican Americans
The Angle Orthodontist
2000; 70: 303-7
37. Shellhart WC, Lange DW, Kluemper GT, Hicks EP and Kaj AL
Reliability of the Bolton tooth size analysis when applied to crowded
dentitions
The Angle Orthodontist
1995; 65: 327-34
38. Smith SS, Buschang PH, Watanabe E
Interarch tooth size relationships of three populations: “Does Bolton’s
analysis apply?”
American Journal of Orthodontics and Dentofacial Orthopedics
2000; 117: 169-17
39. Sperry TP, Worms FW, Isaacson RJ and Speidel TM
Tooth size discrepancy in mandibular prognathism
America Journal of Orthodontics
1977; 72: 183-90

40. Steadman SR
The relation of upper anterior teeth to lower anterior teeth as present on
plaster models of a group of acceptable occlusions
The Angle Orthodontist
1952; 22:91-97
41. Strujic M, Anic-Milosevic S, Mestrovic S and Slaj M
Tooth size discrepancy in orthodontic patients among different malocclusion
groups
European Journal of Orthodontics
2009; April (Electronic publication ahead of print)
42. Ta AT, Ling JYK and Hagg U
Tooth size discrepancies among different occlusion groups of southern
Chinese children
American Journal of Orthodontics and Dentofacial Orthopedics
2001; 120: 556-8
43. Tomassetti JJ, Taloumis LJ, Denny JM, Fischer JR
A comparison of three computerized Bolton tooth size analyses with a
commonly used method.
The Angle Orthodontist
2001; 71: 351-357
44. Tong H, Danpeng C, Lei X and Ping L
The effect of premolar extractions on tooth size discrepancies
The Angle Orthodontist

2004; 74: 508-511
45. Tuverson DL
Anterior interocclusal relations. Part 1
American Journal of Orthodontics
1980; 78(4): 361-70
46. Uysal T, Sari Z, Basciftci FA and Memili B
Intermaxillary tooth size discrepancy and malocclusion: Is there a relation?
The Angle Orthodontist
2005; 72(2): 208-13
47. Zilberman O, Huggare JAV and Konstantinos AP
Evaluation of the validity of tooth size and arch width measurements using
conventional and three- dimensional virtual orthodontic models.
The Angle Orthodontist
2003: 73: 301-306