analysis of 2013 uk electricity margins
TRANSCRIPT
Review of Electricity Company Profitability
Revised Edition for 2013
Derek W Louden
Abbian House
Tower Street
Tain
Ross-shire
IV19 1DY
Tel: 01862 892734
Email: [email protected]
Last year I watched the evidence given by the Supply Directors of some of the major energy
companies, usually referred to as the “Big Six” before the Energy & Climate Change Select
Committee at the House of Commons in the run-up to Christmas. They presented a uniform story of
low returns which no-one could consider were exhibiting evidence of monopoly or oligopoly profit.
I investigated whether or not what they had said was true, this year I’ve revised my findings.
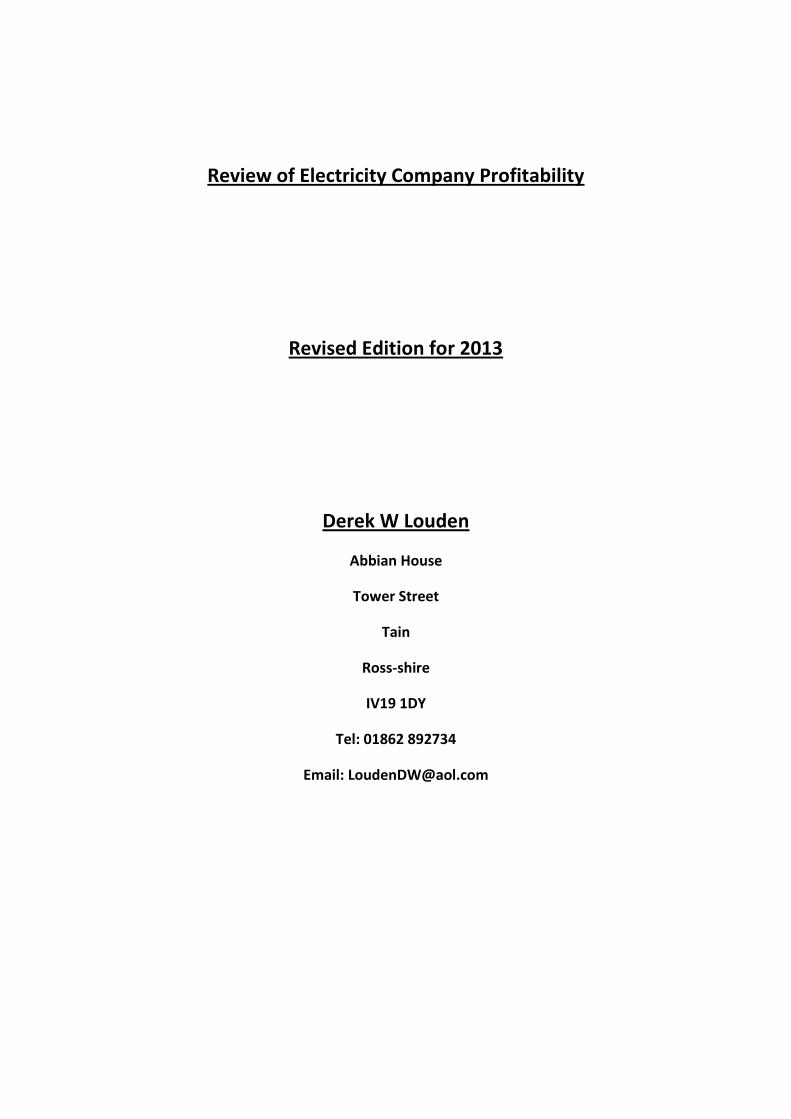
Scottish & Southern Energy show that their Supply business – their retail arm selling electricity to
customers was earning low returns. This position is illustrated in the graph below:
It is fair to say the supply business does earn low returns. I was struck by the phrase “in our retail
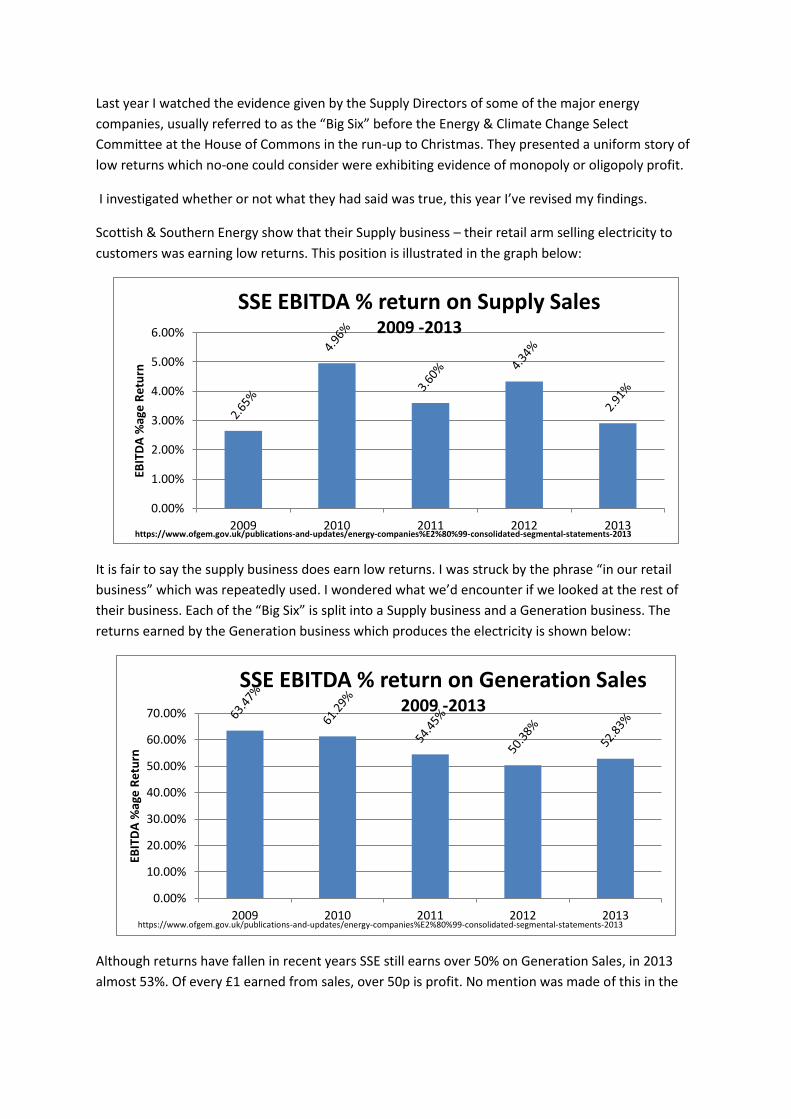
business” which was repeatedly used. I wondered what we’d encounter if we looked at the rest of
their business. Each of the “Big Six” is split into a Supply business and a Generation business. The
returns earned by the Generation business which produces the electricity is shown below:
Although returns have fallen in recent years SSE still earns over 50% on Generation Sales, in 2013
almost 53%. Of every £1 earned from sales, over 50p is profit. No mention was made of this in the
0.00%
1.00%
2.00%
3.00%
4.00%
5.00%
6.00%
2009 2010 2011 2012 2013
EBIT
DA
%ag
e R
etu
rn
SSE EBITDA % return on Supply Sales 2009 -2013
https://www.ofgem.gov.uk/publications-and-updates/energy-companies%E2%80%99-consolidated-segmental-statements-2013
0.00%
10.00%
20.00%
30.00%
40.00%
50.00%
60.00%
70.00%
2009 2010 2011 2012 2013
EBIT
DA
%ag
e R
etu
rn
SSE EBITDA % return on Generation Sales 2009 -2013
https://www.ofgem.gov.uk/publications-and-updates/energy-companies%E2%80%99-consolidated-segmental-statements-2013
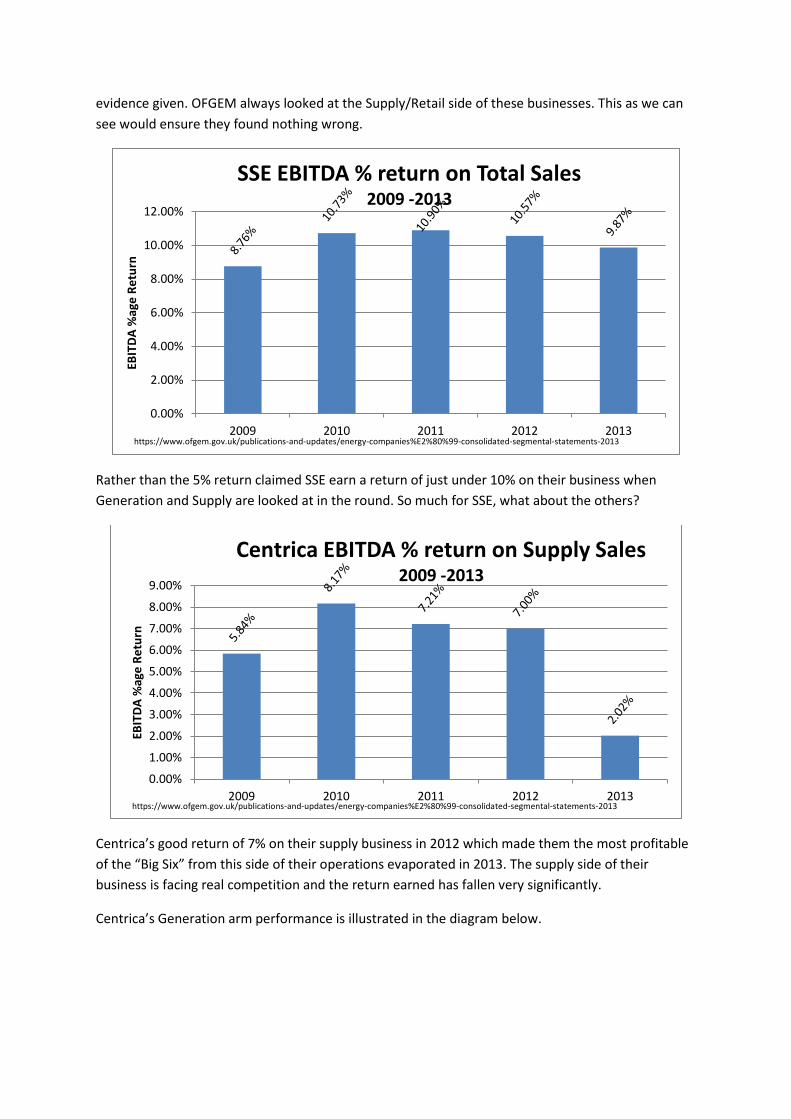
evidence given. OFGEM always looked at the Supply/Retail side of these businesses. This as we can
see would ensure they found nothing wrong.
Rather than the 5% return claimed SSE earn a return of just under 10% on their business when
Generation and Supply are looked at in the round. So much for SSE, what about the others?
Centrica’s good return of 7% on their supply business in 2012 which made them the most profitable
of the “Big Six” from this side of their operations evaporated in 2013. The supply side of their
business is facing real competition and the return earned has fallen very significantly.
Centrica’s Generation arm performance is illustrated in the diagram below.
0.00%
2.00%
4.00%
6.00%
8.00%
10.00%
12.00%
2009 2010 2011 2012 2013
EBIT
DA
%ag
e R
etu
rn
SSE EBITDA % return on Total Sales 2009 -2013
https://www.ofgem.gov.uk/publications-and-updates/energy-companies%E2%80%99-consolidated-segmental-statements-2013
0.00%
1.00%
2.00%
3.00%
4.00%
5.00%
6.00%
7.00%
8.00%
9.00%
2009 2010 2011 2012 2013
EBIT
DA
%ag
e R
etu
rn
Centrica EBITDA % return on Supply Sales 2009 -2013
https://www.ofgem.gov.uk/publications-and-updates/energy-companies%E2%80%99-consolidated-segmental-statements-2013
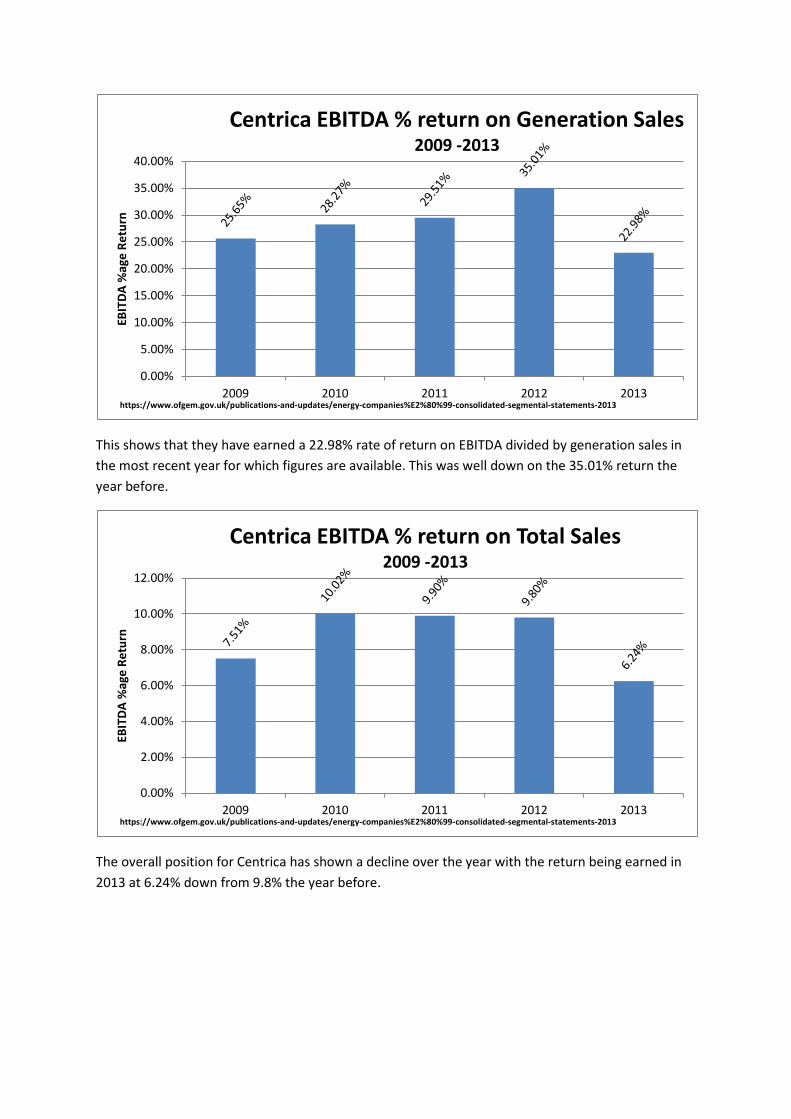
This shows that they have earned a 22.98% rate of return on EBITDA divided by generation sales in
the most recent year for which figures are available. This was well down on the 35.01% return the
year before.
The overall position for Centrica has shown a decline over the year with the return being earned in
2013 at 6.24% down from 9.8% the year before.
0.00%
5.00%
10.00%
15.00%
20.00%
25.00%
30.00%
35.00%
40.00%
2009 2010 2011 2012 2013
EBIT
DA
%ag
e R
etu
rn
Centrica EBITDA % return on Generation Sales 2009 -2013
https://www.ofgem.gov.uk/publications-and-updates/energy-companies%E2%80%99-consolidated-segmental-statements-2013
0.00%
2.00%
4.00%
6.00%
8.00%
10.00%
12.00%
2009 2010 2011 2012 2013
EBIT
DA
%ag
e R
etu
rn
Centrica EBITDA % return on Total Sales 2009 -2013
https://www.ofgem.gov.uk/publications-and-updates/energy-companies%E2%80%99-consolidated-segmental-statements-2013
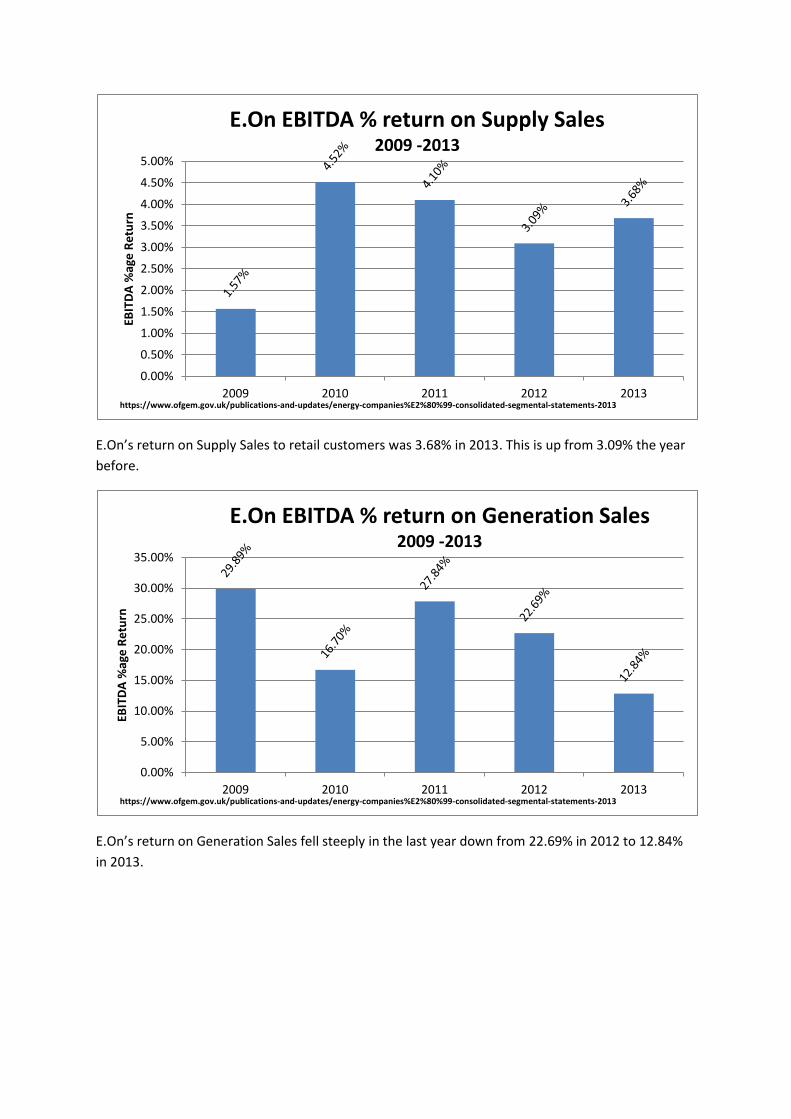
E.On’s return on Supply Sales to retail customers was 3.68% in 2013. This is up from 3.09% the year
before.
E.On’s return on Generation Sales fell steeply in the last year down from 22.69% in 2012 to 12.84%
in 2013.
0.00%
0.50%
1.00%
1.50%
2.00%
2.50%
3.00%
3.50%
4.00%
4.50%
5.00%
2009 2010 2011 2012 2013
EBIT
DA
%ag
e R
etu
rn
E.On EBITDA % return on Supply Sales 2009 -2013
https://www.ofgem.gov.uk/publications-and-updates/energy-companies%E2%80%99-consolidated-segmental-statements-2013
0.00%
5.00%
10.00%
15.00%
20.00%
25.00%
30.00%
35.00%
2009 2010 2011 2012 2013
EBIT
DA
%ag
e R
etu
rn
E.On EBITDA % return on Generation Sales 2009 -2013
https://www.ofgem.gov.uk/publications-and-updates/energy-companies%E2%80%99-consolidated-segmental-statements-2013

E.On’s overall performance was also down from a return of 6.72% in 2012 on their business taken as
a whole to 4.92% in 2013.
.
EDF’s Supply business is the worst performing of the “Big Six” and has made almost no profit in the
last five years. Before you start to weep for them, we’ll move along to the next diagram....
0.00%
1.00%
2.00%
3.00%
4.00%
5.00%
6.00%
7.00%
8.00%
9.00%
10.00%
2009 2010 2011 2012 2013
EBIT
DA
%ag
e R
etu
rn
E.On EBITDA % return on Total Sales 2009 -2013
https://www.ofgem.gov.uk/publications-and-updates/energy-companies%E2%80%99-consolidated-segmental-statements-2013
-1.00%
-0.50%
0.00%
0.50%
1.00%
1.50%
2.00%
2009 2010 2011 2012 2013 EBIT
DA
%ag
e R
etu
rn
EDF EBITDA % return on Supply Sales 2009 -2013
https://www.ofgem.gov.uk/publications-and-updates/energy-companies%E2%80%99-consolidated-segmental-statements-2013
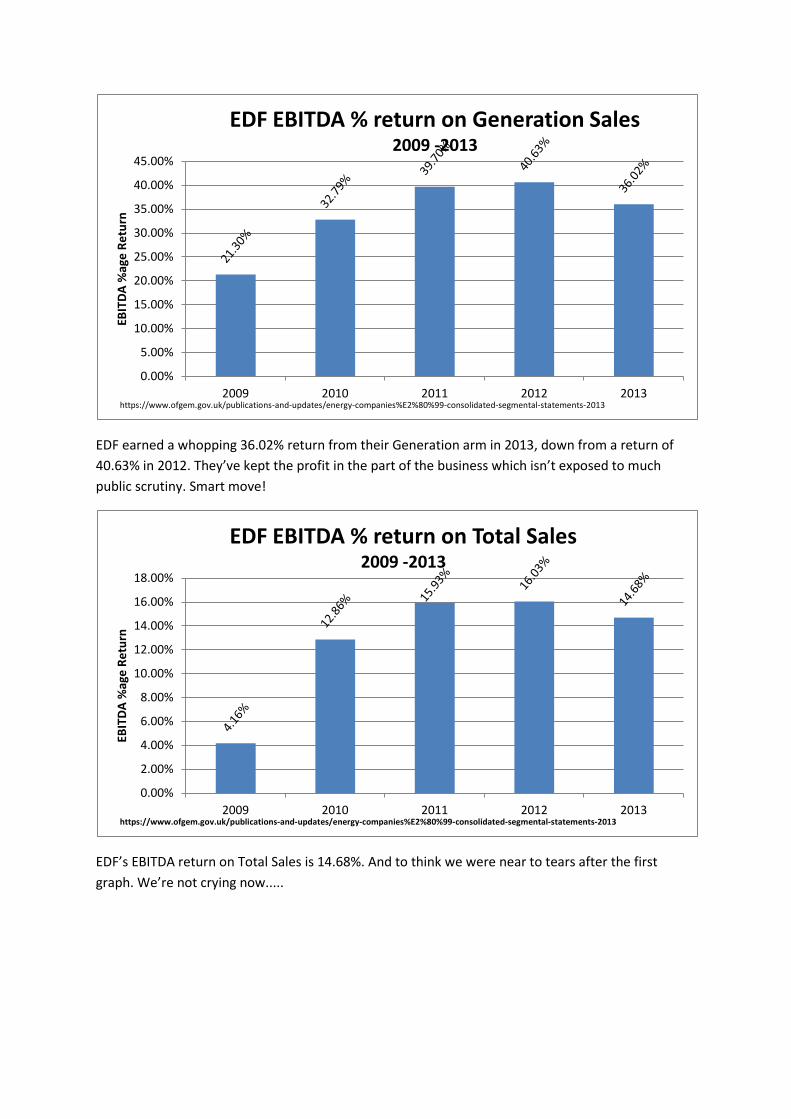
EDF earned a whopping 36.02% return from their Generation arm in 2013, down from a return of
40.63% in 2012. They’ve kept the profit in the part of the business which isn’t exposed to much
public scrutiny. Smart move!
EDF’s EBITDA return on Total Sales is 14.68%. And to think we were near to tears after the first
graph. We’re not crying now.....
0.00%
5.00%
10.00%
15.00%
20.00%
25.00%
30.00%
35.00%
40.00%
45.00%
2009 2010 2011 2012 2013
EBIT
DA
%ag
e R
etu
rn
EDF EBITDA % return on Generation Sales 2009 -2013
https://www.ofgem.gov.uk/publications-and-updates/energy-companies%E2%80%99-consolidated-segmental-statements-2013
0.00%
2.00%
4.00%
6.00%
8.00%
10.00%
12.00%
14.00%
16.00%
18.00%
2009 2010 2011 2012 2013
EBIT
DA
%ag
e R
etu
rn
EDF EBITDA % return on Total Sales 2009 -2013
https://www.ofgem.gov.uk/publications-and-updates/energy-companies%E2%80%99-consolidated-segmental-statements-2013
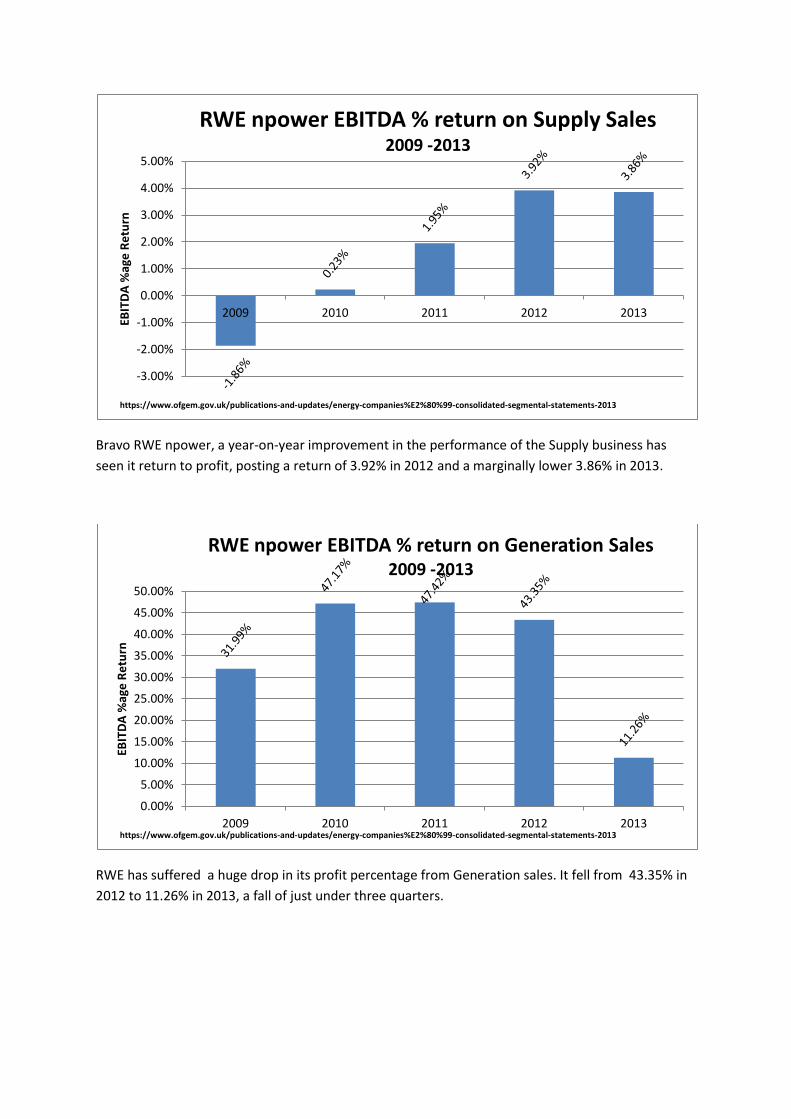
Bravo RWE npower, a year-on-year improvement in the performance of the Supply business has
seen it return to profit, posting a return of 3.92% in 2012 and a marginally lower 3.86% in 2013.
RWE has suffered a huge drop in its profit percentage from Generation sales. It fell from 43.35% in
2012 to 11.26% in 2013, a fall of just under three quarters.
-3.00%
-2.00%
-1.00%
0.00%
1.00%
2.00%
3.00%
4.00%
5.00%
2009 2010 2011 2012 2013
EBIT
DA
%ag
e R
etu
rn
RWE npower EBITDA % return on Supply Sales 2009 -2013
https://www.ofgem.gov.uk/publications-and-updates/energy-companies%E2%80%99-consolidated-segmental-statements-2013
0.00%
5.00%
10.00%
15.00%
20.00%
25.00%
30.00%
35.00%
40.00%
45.00%
50.00%
2009 2010 2011 2012 2013
EBIT
DA
%ag
e R
etu
rn
RWE npower EBITDA % return on Generation Sales 2009 -2013
https://www.ofgem.gov.uk/publications-and-updates/energy-companies%E2%80%99-consolidated-segmental-statements-2013
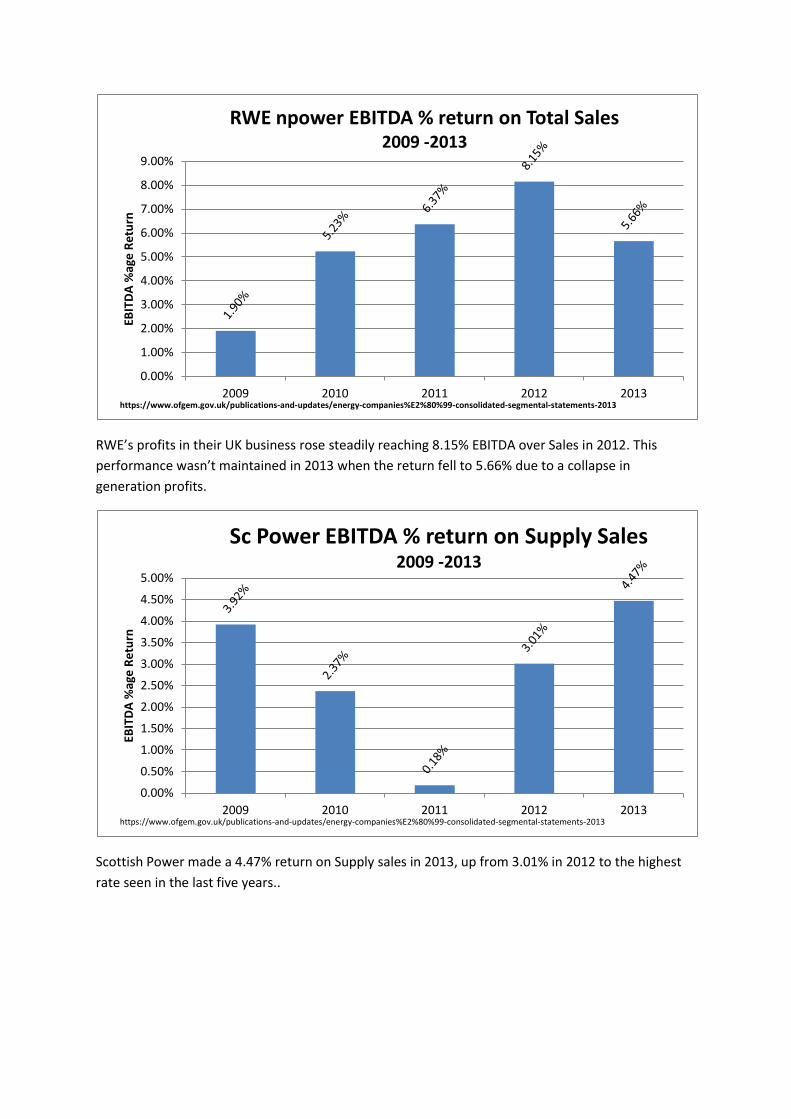
RWE’s profits in their UK business rose steadily reaching 8.15% EBITDA over Sales in 2012. This
performance wasn’t maintained in 2013 when the return fell to 5.66% due to a collapse in
generation profits.
Scottish Power made a 4.47% return on Supply sales in 2013, up from 3.01% in 2012 to the highest
rate seen in the last five years..
0.00%
1.00%
2.00%
3.00%
4.00%
5.00%
6.00%
7.00%
8.00%
9.00%
2009 2010 2011 2012 2013
EBIT
DA
%ag
e R
etu
rn
RWE npower EBITDA % return on Total Sales 2009 -2013
https://www.ofgem.gov.uk/publications-and-updates/energy-companies%E2%80%99-consolidated-segmental-statements-2013
0.00%
0.50%
1.00%
1.50%
2.00%
2.50%
3.00%
3.50%
4.00%
4.50%
5.00%
2009 2010 2011 2012 2013
EBIT
DA
%ag
e R
etu
rn
Sc Power EBITDA % return on Supply Sales 2009 -2013
https://www.ofgem.gov.uk/publications-and-updates/energy-companies%E2%80%99-consolidated-segmental-statements-2013
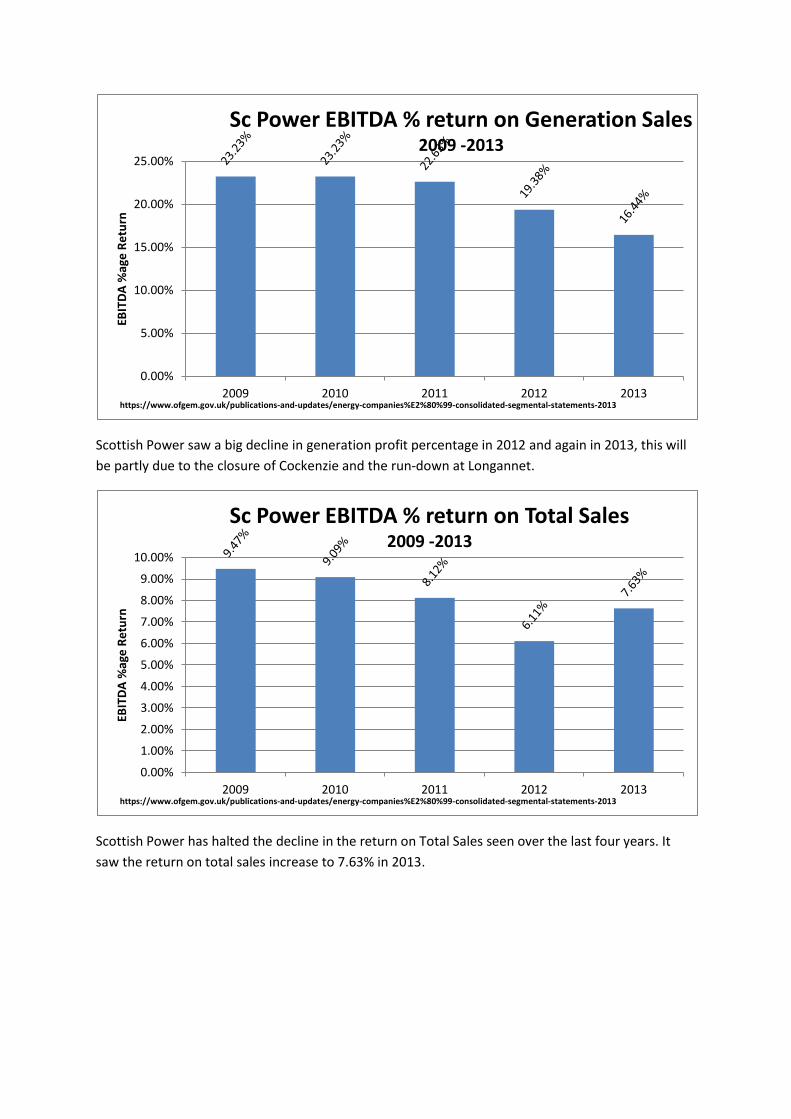
Scottish Power saw a big decline in generation profit percentage in 2012 and again in 2013, this will
be partly due to the closure of Cockenzie and the run-down at Longannet.
Scottish Power has halted the decline in the return on Total Sales seen over the last four years. It
saw the return on total sales increase to 7.63% in 2013.
0.00%
5.00%
10.00%
15.00%
20.00%
25.00%
2009 2010 2011 2012 2013
EBIT
DA
%ag
e R
etu
rn
Sc Power EBITDA % return on Generation Sales 2009 -2013
https://www.ofgem.gov.uk/publications-and-updates/energy-companies%E2%80%99-consolidated-segmental-statements-2013
0.00%
1.00%
2.00%
3.00%
4.00%
5.00%
6.00%
7.00%
8.00%
9.00%
10.00%
2009 2010 2011 2012 2013
EBIT
DA
%ag
e R
etu
rn
Sc Power EBITDA % return on Total Sales 2009 -2013
https://www.ofgem.gov.uk/publications-and-updates/energy-companies%E2%80%99-consolidated-segmental-statements-2013
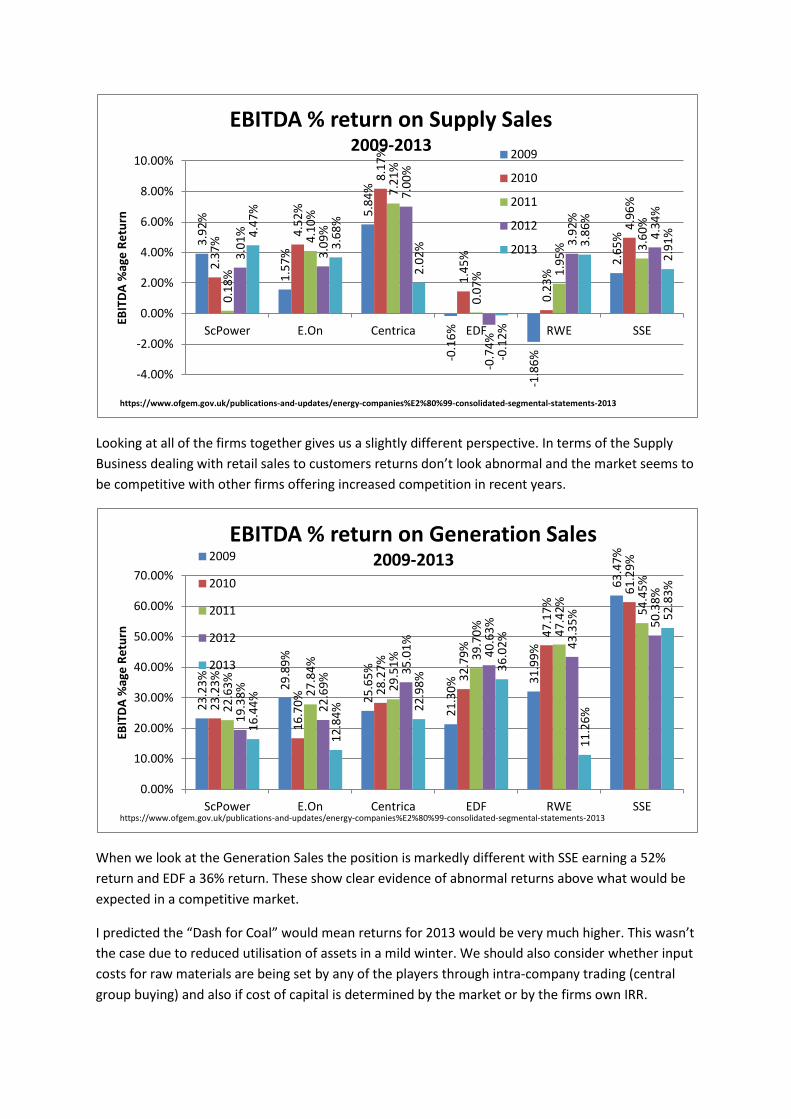
Looking at all of the firms together gives us a slightly different perspective. In terms of the Supply
Business dealing with retail sales to customers returns don’t look abnormal and the market seems to
be competitive with other firms offering increased competition in recent years.
When we look at the Generation Sales the position is markedly different with SSE earning a 52%
return and EDF a 36% return. These show clear evidence of abnormal returns above what would be
expected in a competitive market.
I predicted the “Dash for Coal” would mean returns for 2013 would be very much higher. This wasn’t
the case due to reduced utilisation of assets in a mild winter. We should also consider whether input
costs for raw materials are being set by any of the players through intra-company trading (central
group buying) and also if cost of capital is determined by the market or by the firms own IRR.
3.9
2%
1.5
7%
5.8
4%
-0.1
6%
-1.8
6%
2.6
5%
2.3
7%
4.5
2%
8.1
7%
1.4
5%
0.2
3%
4.9
6%
0.1
8%
4.1
0%
7.2
1%
0.0
7%
1.9
5%
3.6
0%
3.0
1%
3.0
9%
7.0
0%
-0.7
4%
3.9
2%
4.3
4%
4.4
7%
3.6
8%
2.0
2%
-0.1
2%
3.8
6%
2.9
1%
-4.00%
-2.00%
0.00%
2.00%
4.00%
6.00%
8.00%
10.00%
ScPower E.On Centrica EDF RWE SSE
EBIT
DA
%ag
e R
etu
rn
EBITDA % return on Supply Sales 2009-2013
2009
2010
2011
2012
2013
https://www.ofgem.gov.uk/publications-and-updates/energy-companies%E2%80%99-consolidated-segmental-statements-2013
23
.23
%
29
.89
%
25
.65
%
21
.30
%
31
.99
%
63
.47
%
23
.23
%
16
.70
% 28
.27
%
32
.79
% 4
7.1
7%
61
.29
%
22
.63
%
27
.84
%
29
.51
%
39
.70
%
47
.42
%
54
.45
%
19
.38
%
22
.69
% 35
.01
%
40
.63
%
43
.35
%
50
.38
%
16
.44
%
12
.84
%
22
.98
% 3
6.0
2%
11
.26
%
52
.83
%
0.00%
10.00%
20.00%
30.00%
40.00%
50.00%
60.00%
70.00%
ScPower E.On Centrica EDF RWE SSE
EBIT
DA
%ag
e R
etu
rn
EBITDA % return on Generation Sales 2009-2013 2009
2010
2011
2012
2013
https://www.ofgem.gov.uk/publications-and-updates/energy-companies%E2%80%99-consolidated-segmental-statements-2013

What we have discovered for all of the companies is that their overall percentage return is much
higher than the retail profit percentages shared with the Energy and Climate Change Select
Committee. The Generation business is where the money is being made.
Returns of over 50% on generation make a mockery of the evidence given to the committee. Will
anything be done about this? Since we last wrote OFGEM referred the market to the new
Competition and Markets Authority (CMA). The CMA inquiry team headed by a former director of N-
Power heading a committee of city grandees has produced interim findings suggesting things are
fine. The above analysis suggests that things are not fine in the generation market. It is to be hoped
that generation will be looked at again before final conclusions are drawn.
DWL
9.4
7%
7.0
1%
7.5
1%
4.1
6%
1.9
0%
8.7
6%
9.0
9%
6.8
4%
10
.02
% 12
.86
%
5.2
3%
10
.73
%
8.1
2%
8.9
6%
9.9
0%
15
.93
%
6.3
7%
10
.90
%
6.1
1%
6.7
2%
9.8
0%
16
.03
%
8.1
5%
10
.57
%
7.6
3%
4.9
2%
6.2
4%
14
.68
%
5.6
6%
9.8
7%
0.00%
2.00%
4.00%
6.00%
8.00%
10.00%
12.00%
14.00%
16.00%
18.00%
ScPower E.On Centrica EDF RWE SSE
EBIT
DA
%ag
e R
etu
rn
EBITDA % return on Total Sales 2009-2013
2009
2010
2011
2012
2013
https://www.ofgem.gov.uk/publications-and-updates/energy-companies%E2%80%99-consolidated-segmental-statements-2013