analysis of 100 sgip interconnection studies · • analyze the types of adverse system impacts and...
TRANSCRIPT
1
SANDIA REPORT SAND2014-4753 Unlimited Release Printed December 2014
Analysis of 100 SGIP Interconnection Studies Santiago S. Sena, Jimmy E. Quiroz, Robert J. Broderick Prepared by Sandia National Laboratories Albuquerque, New Mexico 87185 and Livermore, California 94550 Sandia National Laboratories is a multi-program laboratory managed and operated by Sandia Corporation, a wholly owned subsidiary of Lockheed Martin Corporation, for the U.S. Department of Energy's National Nuclear Security Administration under contract DE-AC04-94AL85000. Approved for public release; further dissemination unlimited.

2
Issued by Sandia National Laboratories, operated for the United States Department of Energy by Sandia Corporation. NOTICE: This report was prepared as an account of work sponsored by an agency of the United States Government. Neither the United States Government, nor any agency thereof, nor any of their employees, nor any of their contractors, subcontractors, or their employees, make any warranty, express or implied, or assume any legal liability or responsibility for the accuracy, completeness, or usefulness of any information, apparatus, product, or process disclosed, or represent that its use would not infringe privately owned rights. Reference herein to any specific commercial product, process, or service by trade name, trademark, manufacturer, or otherwise, does not necessarily constitute or imply its endorsement, recommendation, or favoring by the United States Government, any agency thereof, or any of their contractors or subcontractors. The views and opinions expressed herein do not necessarily state or reflect those of the United States Government, any agency thereof, or any of their contractors. Printed in the United States of America. This report has been reproduced directly from the best available copy. Available to DOE and DOE contractors from U.S. Department of Energy Office of Scientific and Technical Information P.O. Box 62 Oak Ridge, TN 37831 Telephone: (865) 576-8401 Facsimile: (865) 576-5728 E-Mail: [email protected] Online ordering: http://www.osti.gov/bridge Available to the public from U.S. Department of Commerce National Technical Information Service 5285 Port Royal Rd. Springfield, VA 22161 Telephone: (800) 553-6847 Facsimile: (703) 605-6900 E-Mail: [email protected] Online order: http://www.ntis.gov/help/ordermethods.asp?loc=7-4-0#online

3
SAND2014-4753 Unlimited Release
Printed November 2014
Analysis of Utility SGIP Interconnection Studies
Santiago S. Sena, Jimmy E. Quiroz and Robert J. Broderick Photovoltaics and Grid Integration Department
Sandia National Laboratories P.O. Box 5800
Albuquerque, New Mexico 87185-1033
Abstract The purpose of the report is to describe the findings from the analysis of 100 Small Generation Interconnection Procedure (SGIP) studies and describe the database. The database was used to analyze the impacts, mitigations, and costs associated with PV system interconnections. A total of 100 SGIP reports performed by 3 utilities and one regional transmission operator (RTO) were analyzed. Each record within the database represents an itemized SGIP report and includes information about the generation facility, interconnection topology, electrical power system characteristics, identified adverse system impacts, mitigation options, and costs associated with interconnection the generation facility. The analysis identified several key findings:
• 44% of generation facilities that entered the SGIP study process had no adverse impact on the electrical power system.
• Interconnection topologies were strongly correlated to the presence/absence of adverse system impacts.
• Protection impacts were the most common adverse system impact. • 50% of SGIP studies identified total connection costs of less than $689,431. • 50% of SGIP studies identified total connection costs of less than $133,400 per
MW.

4
ACKNOWLEDGMENTS
Data used for this analysis were obtained from a number of sources that deserve acknowledgment:
• OATI webOasis – the majority of SGIP reports were accessed through the OATI webOasis™ portal. The OATI webOasis™ website is used by many transmission providers to publicly publish the availability of open access electrical transmission services. As such, many transmission providers also include SGIP reports on the OATI webOasis™ site. OATI webOasis’s main page can be found at: http://www.oatioasis.com/
• PNM – The entirety of PNM SGIP reports used in this report were accessed through PNM’s OATI webOasis™ portal. PNM’s SGIP reports can be found at: http://www.oatioasis.com/pnm/index.html
• APS – The entirety of APS’s SGIP reports used in this report were accessed through APS’s OATI webOasis™ portal. SGIP reports from APS can be found at: http://www.oatioasis.com/azps/
• PacifiCorp – The entirety of PacifiCorp SGIP reports used in this report were accessed through PacifiCorp’s OATI webOasis™ portal. PacifiCorp SGIP reports can be found by navigating to its webOasis portal: http://www.oasis.oati.com/ppw/
• PJM – A regional transmission organization (RTO), PJM manages and coordinates the operation of all or part of the transmission system within 13 states. As such, SGIP studies performed within PJM’s service area are found on PJM’s “Generation Queues: Active” database. All SGIP reports used in this report from PJM were accessed through the database. The database can be found at: http://www.pjm.com/planning/generation-interconnection/generation-queue-active.aspx

5
CONTENTS
1. Introduction .................................................................................................................... 9 1.1. SGIP Study Process ........................................................................................................ 9
2. Database Overview ....................................................................................................... 11
3. Utility Overview ........................................................................................................... 13 3.1. PNM Resources ............................................................................................................ 13 3.2. APS ............................................................................................................................... 14 3.3. PacifiCorp ..................................................................................................................... 15 3.4. PJM ............................................................................................................................... 16
4. Interconnection Topology ............................................................................................ 17 4.1. Tap Exisiting Low Voltage Distribution Circuit .......................................................... 17 4.2. Build New Distribution Circuit from Substation .......................................................... 17 4.3. Tap Existing High Voltage Distribution Circuit ........................................................... 19
5. Impact Classification & Mitigation .............................................................................. 20 5.1. Overvoltage ................................................................................................................... 20 5.2. Voltage Deviation ......................................................................................................... 21 5.3. Thermal Overload ......................................................................................................... 21 5.4. Protection ...................................................................................................................... 21
6. General Statistics .......................................................................................................... 23
7. Identified Impacts & Mitigation ................................................................................... 29 7.1. Voltage .......................................................................................................................... 29 7.2. Thermal ......................................................................................................................... 33 7.3. Protection ...................................................................................................................... 36
8. Cost Analysis ................................................................................................................ 41 8.1. Tap Existing Distribution Circuit.................................................................................. 43 8.2. Build New Distribution Circuit from Substation .......................................................... 46 8.3. Interconnection and Mitigation Cost Ratio ................................................................... 48
9. Conclusions .................................................................................................................. 53
References ..................................................................................................................................... 55
Appendix A: Overview of Interconnection Terms ...................................................................... 57
Appendix B: Database Structure and Field Names...................................................................... 59 Database Structure .................................................................................................................. 59
Facility & Feeder Information ...................................................................................... 59 Adverse System Impacts & Mitigation ........................................................................ 60 Three Binned Cost Categories ...................................................................................... 60 Itemized Interconnection Costs .................................................................................... 61
Database Field Names............................................................................................................. 62 Facility & Feeder Information (Columns A- K) .......................................................... 62
Appendix C: Definitions ............................................................................................................... 68

6
FIGURES Figure 1. Number of SGIP reports by facility size and EPS provider. ......................................... 11 Figure 2. Proportion of SGIP study report types used in database. .............................................. 12 Figure 3. PNM SGIP reports by facility size. ............................................................................... 13 Figure 4. APS SGIP reports by facility size. ................................................................................ 14 Figure 5. PacifiCorp SGIP reports by facility size. ...................................................................... 15 Figure 6. PJM SGIP reports by facility size. ................................................................................ 16 Figure 7. Tap existing low voltage distribution circuit topology.................................................. 17 Figure 8. Single feeder service topology. ..................................................................................... 18 Figure 9. Double feeder service topology. .................................................................................... 19 Figure 10. Tap existing high voltage distribution circuit topology. ............................................. 19 Figure 11. Facility size binned by MW. ....................................................................................... 23 Figure 12. Facilities binned by interconnection voltage. .............................................................. 24 Figure 13. Proposed interconnection topology. ............................................................................ 25 Figure 14. Interconnection topologies by facility size. ................................................................. 25 Figure 15. Tap existing high and low distribution circuits. .......................................................... 26 Figure 16. Build new distribution circuit. ..................................................................................... 26 Figure 17. Identified impacts for all SGIP studies in database. .................................................... 27 Figure 18. SGIP reports binned by identified impacts. ................................................................. 29 Figure 19. Impact set..................................................................................................................... 29 Figure 20. Impact classification. ................................................................................................... 30 Figure 21. Total overvoltage mitigation cost vs. facility size. ...................................................... 32 Figure 22. Thermal overload impact set. ...................................................................................... 34 Figure 23. Facilities adversely impacted by thermal overloads. ................................................... 34 Figure 24. Protection impact set. .................................................................................................. 37 Figure 25. Protection impact mitigation. ...................................................................................... 37 Figure 26. Total connection costs vs. facility size. ....................................................................... 41 Figure 27. Total connection cost vs. interconnection voltage. ..................................................... 42 Figure 28. Facilities with adverse system impacts........................................................................ 43 Figure 29: Total connection cost vs. facility size for GF interconnecting through existing distribution circuit. ........................................................................................................................ 44 Figure 30. Price per MW vs. facility size for GF interconnecting through existing distribution circuit. ........................................................................................................................................... 45 Figure 31. Total connection cost per MW vs. facility size for GF interconnecting through existing distribution circuit that had no adverse impacts. ............................................................. 46 Figure 32. Build new distribution circuit: Total connection cost vs facility size. ........................ 47 Figure 33. Overvoltage mitigation costs. ...................................................................................... 48 Figure 34. Voltage deviation mitigation costs. ............................................................................. 49 Figure 35. Thermal mitigation costs. ............................................................................................ 50 Figure 36. Protection mitigation costs for substation relay modifications. .................................. 51 Figure 37. Protection mitigation costs for distribution protection modifications. ........................ 51 Figure 38. Overview of interconnection to EPS. .......................................................................... 57 Figure 39. Worksheet field category identification. ..................................................................... 59 Figure 40. Adverse system impact & mitigation identification. ................................................... 60 Figure 41. Binned costs and itemized interconnection costs fields. ............................................. 61 Figure 42. Binned costs for multiple mitigations.......................................................................... 64
7
TABLES
Table 1: Overvoltage mitigation utilizing PF correction only. ..................................................... 31 Table 2: Overvoltage mitigation utilizing voltage regulation equipment and PF correction. ...... 31 Table 3: Overvoltage mitigation utilizing conductor upgrades. ................................................... 32 Table 4: Voltage deviation mitigation and costs........................................................................... 33 Table 5: Thermal mitigation costs. ............................................................................................... 35 Table 6: Ampacity upgrades. ........................................................................................................ 36 Table 7: Substation fault protection - Relay modifications only. ................................................. 37 Table 8: Substation fault protection - Relay modifications & advanced protectionschemes. ...... 38 Table 9: Protection- Recloser modifications................................................................................. 39

8
NOMENCLATURE DOE Department of Energy EPS Electrical Powers System FERC Federal Energy Regulatory Commission GF Generation Facility IC Interconnecting Customer OATT Open Access Transmission Tariff OASIS Open Access Same-Time Information System PCC Point of Common Coupling RTO Regional Transmission Operator SGIP Small Generator Interconnection Procedures SNL Sandia National Laboratories SVC Static VAR Compensator

9
1. INTRODUCTION Sandia National Laboratories (SNL) developed a database from Small Generator Interconnection Procedure (SGIP) studies to identify the most common impacts for PV system interconnections and the costs to mitigate adverse system impacts. An adverse system impact is defined as a negative effect due to the interconnection of a generation facility (GF), which compromises the performance, reliability or safety of the existing electrical power system (EPS). The purpose of the report is to describe the findings from the analysis of 100 SGIP studies and describe the development of the database. Developed by FERC, the SGIP is a common standard interconnection procedure adopted by many states or used as a guide for developing their own interconnection rules for the distribution system. The SGIP outlines the process a utility and interconnecting customer (IC) performs before interconnecting a small GF to the EPS. The SGIP applies to GFs of 20 MW or less. The SGIP consists of three evaluation procedures: (1) a 10 kW Inverter Process, (2) a Fast Track process (typically 2-5 MW or less) and (3) a study process1. SNL was interested in analyzing reports associated with photovoltaic facilities that entered the study process under the SGIP. The goal of the SGIP study analysis was to:
• Classify the interconnection requests by interconnection types and facility costs. • Analyze the types of adverse system impacts and common mitigation strategies. • Analyze the costs associated with the interconnection adverse system impacts.
A total of 100 SGIP PV interconnection reports performed by 3 utilities and one regional transmission operator (RTO) were analyzed to determine the types of impacts and associated costs. All reports in the database were performed by electrical system providers (EPS) that had either adopted the SGIP completely or with some modifications. The reports used to populate the database were acquired through online queues of the aforementioned utilities and RTO. The online queues for the three utilities were found by navigating to their respective webpage on the OASIS website. OASIS is an internet based tool used to share information relating to electrical power transmission such as price and product availability. The scope of the database and analysis was to evaluate costs associated with GFs that entered the SGIP study process, and therefore the report does not cover cost data or impacts associated with GFs that were fast tracked and did not enter the study process.
1.1. SGIP Study Process The SGIP outlines the formal process utilities and IC must follow when evaluating a request for parallel operation of a GF with the EPS. The request is initiated by an IC to assess the feasibility 1 Small Generator Interconnection Procedures(FERC SGIP), http://www.ferc.gov/industries/electric/indus-act/gi/small-gen.asp#skipnav

10
of interconnecting a new small GF to the EPS or expanding the capacity of an existing GF. In either case the SGIP applies to new facilities and facility expansions with generation outputs of 20 MW or less. When an interconnection request enters the study process, it will go through three levels of review with more stringent study requirements at each new level. Most small generation interconnection studies are evaluated based on the following process:
• Feasibility Study (FeS) – identifies any potential adverse system impacts associated with interconnecting the GF and determines the feasibility of connecting at various interconnection points.
• System Impact Study (SiS) – identifies the electrical system impacts that would result if the proposed GF were interconnected without project modifications, specifically focusing on adverse system impacts such as equipment thermal overload ratings, voltage violations, protection requirements and power quality.
• Facility Study (FaS) – provides a cost estimate for equipment and labor required to 1) complete the interconnection engineering and construction work and 2) equipment and labor required to mitigate any adverse system impacts identified in the SIS.
Upon the completion of each study a detailed report is prepared and provided to the IC. Along with outlining the results of the study the report also defines the utility’s additional requirements, the interconnection topology and the interconnection facilities necessary to interconnect the GF to the EPS.

11
2. DATABASE OVERVIEW
This section provides a brief description of the database and describes the procedures used to standardize information derived from the various SGIP report formats. Each record within the database represents an itemized SGIP report and includes information about the GF, interconnecting EPS, identified adverse system impacts, mitigation options and cost associated with interconnecting the GF. The database is grouped into four categories – Facility & Feeder Information, Adverse System Impacts & Mitigation, Binned Costs and Itemized Interconnection Costs. A full description for each category is found in Appendix B. The database is a compilation of information derived from multiple SGIP reports performed by three electrical utilities, PNM, Arizona Public Service (APS), PacifiCorp and one regional transmission operator (RTO), PJM. The database contains 100 records; each record within the database is a summary of an SGIP report performed by one of the previously identified data sources. A breakdown of SGIP reports found in the database by facility size and utility is shown in Figure 1. The generation capacities represented in Figure 1 have been rounded down to the nearest whole number. More than half (59%) of the SGIP reports in the database have generation capacities of 6 MW or less. Furthermore, 82% of the SGIP reports in the database have generation capacities of 10 MW or less.
Figure 1. Number of SGIP reports by facility size and EPS provider.
12
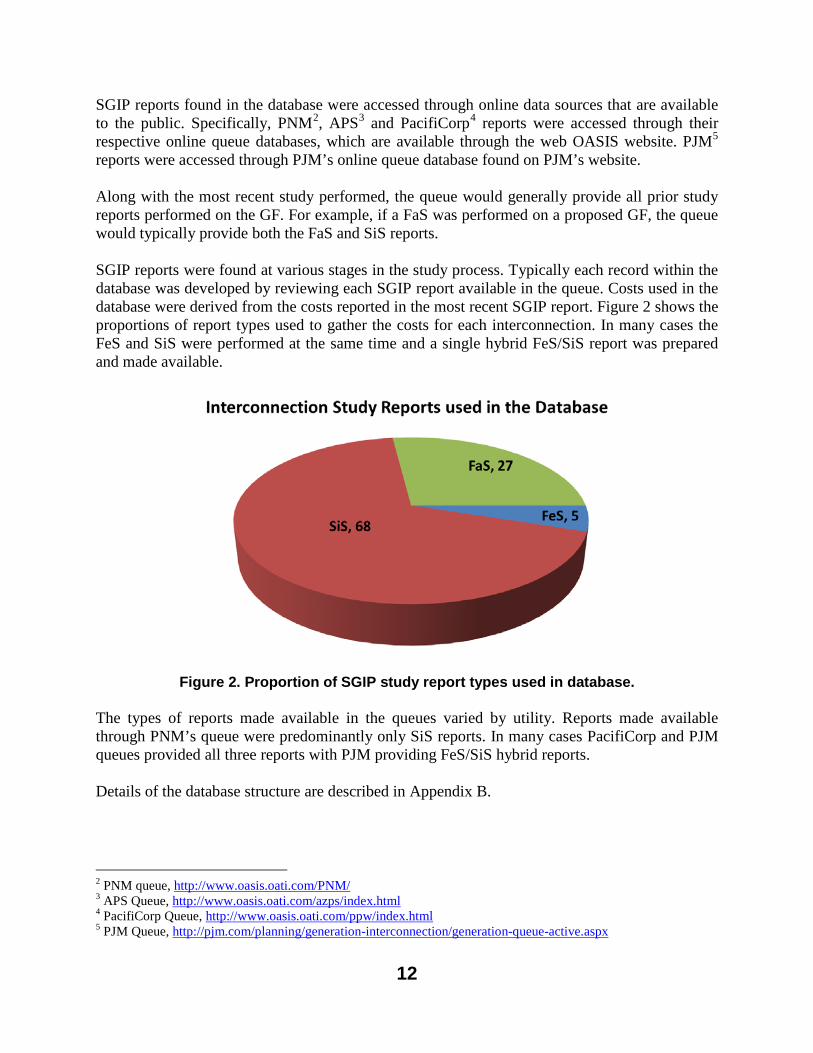
SGIP reports found in the database were accessed through online data sources that are available to the public. Specifically, PNM2, APS3 and PacifiCorp4 reports were accessed through their respective online queue databases, which are available through the web OASIS website. PJM5 reports were accessed through PJM’s online queue database found on PJM’s website. Along with the most recent study performed, the queue would generally provide all prior study reports performed on the GF. For example, if a FaS was performed on a proposed GF, the queue would typically provide both the FaS and SiS reports. SGIP reports were found at various stages in the study process. Typically each record within the database was developed by reviewing each SGIP report available in the queue. Costs used in the database were derived from the costs reported in the most recent SGIP report. Figure 2 shows the proportions of report types used to gather the costs for each interconnection. In many cases the FeS and SiS were performed at the same time and a single hybrid FeS/SiS report was prepared and made available.
Figure 2. Proportion of SGIP study report types used in database. The types of reports made available in the queues varied by utility. Reports made available through PNM’s queue were predominantly only SiS reports. In many cases PacifiCorp and PJM queues provided all three reports with PJM providing FeS/SiS hybrid reports. Details of the database structure are described in Appendix B.
2 PNM queue, http://www.oasis.oati.com/PNM/ 3 APS Queue, http://www.oasis.oati.com/azps/index.html 4 PacifiCorp Queue, http://www.oasis.oati.com/ppw/index.html 5 PJM Queue, http://pjm.com/planning/generation-interconnection/generation-queue-active.aspx

13
3. UTILITY OVERVIEW
This section provides a brief description of the utilities that provided the SGIP reports. Also, this section highlights trends identified in the SGIP reports for each utility.
3.1. PNM Resources PNM Resources is an investor-owned energy holding company that operates within New Mexico. Servicing 498,700 electrical customers within New Mexico, PNM Resources is the state’s largest electrical provider6. SGIP studies obtained from PNM were accessed through PNM’s West Trans Oasis (oatioasis.com) webpage. The Database contains 26 SGIP studies from PNM, which are binned by MW size and shown in Figure 3. Facility sizes ranged from 1 MW to 10 MWs with the largest concentration falling within the 6 MW range. A total of 18 studies performed by PNM provided enough information to determine costs associated with interconnection and/or mitigation. Reports performed by PNM provided an abundance of information about the interconnecting EPS. Generally PNM provided substation and feeder load data and detailed distribution circuit figures.
Figure 3. PNM SGIP reports by facility size. This includes normal and emergency substation transformer ratings as well as load data for the interconnecting feeder and adjacent feeders. All SGIP reports in the database from PNM identified that the GF would interconnect through an existing low voltage distribution circuit (see Interconnection Topology section). Furthermore, all SGIP reports identified interconnection voltages at the PCC of 12.47 kV. No advanced anti-islanding protection schemes other than the inverters build-in factions were required for PNM SGIP studies. PNM SGIP studies also consistently identified the need for IntelliRuptor switches at the ICs GF to facilitate protection requirements. 6 Source: http://www.pnm.com/about/

14
3.2. APS A subsidiary of Pinnacle West Capital Corporation, APS serves over one million customers mainly in northern and central Arizona7. SGIP studies obtained from APS were accessed through APS’s West Trans Oasis (oatioasis.com) webpage. The database contains 13 SGIP studies from APS, which are binned by MW size and shown in Figure 4. Studied facility sizes ranged from 8 MW to 20 MW with almost half falling within the 20 MW range. All of APS SGIP reports provided enough information to determine interconnection and mitigation costs if any.
Figure 4. APS SGIP reports by facility size. Reports performed by APS provided detailed information of the conductor requirements and components /modifications required at the interconnecting substation. More than half of APS’s SGIP reports identified the need to construct new distribution circuits from the substation to the GF to facilitate the interconnection. The building of new distribution circuits limited the amount of existing equipment exposed to possible adverse system impacts by the GF. In fact, all adverse system impact identified in the SGIP studies occurred on equipment located at the interconnecting substation. Also, almost all SGIP reports identified advanced anti-islanding protection requirements which required equipment that facilitated transfer trip schemes. In keeping with the definition of adverse system impacts, transfer trip requirements were not considered adverse system impacts, because the GFs interconnected through newly built distribution circuits not through existing circuits. The need to build new distribution circuits and anti-islanding protection requirements accounted for the high total interconnection cost associated with APS SGIP reports.
7 Source: http://www.aps.com/en/ourcompany/aboutus/companyprofile/Pages/home.aspx

15
3.3. PacifiCorp Through its three subsidiaries, Pacific Power, Rocky Mountain Power and PacifiCorp Energy, PacifiCorp serves approximately 1.8 million customers across six western states. PacifiCorp serves customers across 136,000 square miles in parts of California, Oregon, Washington, Idaho, Utah and Wyoming. PacifiCorp operates 75 generation units, 62,930 miles of distribution line and 16,200 miles of transmission line8. SGIP studies obtained from PacifiCorp were obtained through its West Trans Oasis (oatioasis.com) webpage. The Database contains 37 SGIP studies which are binned by MW size and shown in Figure 5. Generation Capacities ranged from 2 MW to 20 MW with the majority (89%) having capacities of 5 MW or less. All of PacifiCorp’s SGIP studies provided enough detail to identify costs associated with the interconnection of the GF.
Figure 5. PacifiCorp SGIP reports by facility size. Reports performed by PacifiCorp provided detailed information in regard to justification of protection equipment required to mitigate adverse system impacts. The majority of GFs entering the study process identified that the GF would interconnect through an existing distribution circuit. PacifiCorp’s SGIP reports overwhelmingly identified protection impacts requiring advanced relay functions to mitigate anti-islanding concerns and protection schemes to ensure fault protection equipment did not reclose on energized line (see Deadline Checking). Transfer trip and deadline checking requirements for GFs that interconnected through existing distribution circuits were considered adverse system impacts. This is due to the fact that the protection requirements were needed to protect existing EPS infrastructure. The need to implement anti-islanding and deadline checking protection schemes accounted for the high total interconnection cost associated with PacifiCorp SGIP reports.
8 Source: http://www.pacificorp.com/content/dam/pacificorp/doc/About_Us/Company_Overview/PC_FACTSHEET_2013_Fweb.pdf

16
3.4. PJM PJM is a Regional Transmission Operator that coordinates the movement of wholesale electricity for all or parts of Delaware, Illinois, Indiana, Kentucky, Maryland, Michigan, New Jersey, North Carolina, Ohio, Pennsylvania, Tennessee, Virginia, West Virginia and the District of Columbia9. Within its territory PJM controls the operation of 183,604 MW of generation and 62,556 miles of high-voltage transmission lines10. As part of its role as an RTO, PJM also oversees the planning and construction of requests for new generation facilities or increases in the capacity of existing generation facilities request within it territory. With the permission of FERC PJM currently processes interconnection requests according to its own developed interconnection procedures, which are largely based on the SGIP. The database contains 24 SGIP studies performed jointly by PJM and 4 electrical utilities. The four utilities are: Jersey Central Power and Light (JCP&L), Atlantic City Electric (ACE), First Energy and Public Service Electric and Gas Company (PSE&G). Facility sizes ranged from 2 MW to 19 MW and are binned by MW size as shown in Figure 6. The SGIP studies found in this Database represent only a fraction of the currently 242 active interconnection requests within its queue. Currently the database contains SGIP studies performed from January 2008 to June 2013. A total of 15 studies performed by PJM provided enough information to determine cost associated with interconnection and mitigation.
Figure 6. PJM SGIP reports by facility size. GFs interconnection within PJMs service territory identified the most diverse characteristics. Generation capacities were much more evenly spread from 2 MW to 19 MW and interconnected through a broader range of interconnection voltages (12.47kV, 13.8 kV, 23 kV, 26 kV, 34.5 kV and 46 kV). The three SGIP studies with the most expensive total connection cost came from PJM and the three studies required double feeder service to accommodate the generation capacity of the facility. PJM SGIP reports were the only reports that utilized double feeder service. Mixed FeS/SiS hybrid reports were exclusively found in PJMs queue. Generally, PJM provided FeS, SiS, FaS and Interconnection Service Agreements for all studied GF in the queue.
9 Source: http://www.pjm.com/about-pjm/who-we-are.aspx 10 Source: http://www.isorto.org/site/c.jhKQIZPBImE/b.8641105/k.BBB9/PJM.htm

17
4. INTERCONNECTION TOPOLOGY The interconnection topology describes the interconnection facilities required to accommodate the interconnection of the GF. The interconnection topologies identified in the SGIP reports were binned into 3 categories: tap existing low voltage distribution circuit, build new distribution circuit from substation, and tap existing high voltage distribution circuit. Each category gives a general indication of the infrastructure required to interconnect the GF to the existing EPS. Determination of the interconnection topology varied from utility to utility and depended on combination of factors such as the proposed location of the GF, distribution system capacity limits and type of interconnection request (new facility or expansion of existing interconnection). In some instances the SGIP reports indicated that the IC requested a specific interconnection topology, but in most cases it was assumed that the EPS provider determined the topology.
4.1. Tap Exisiting Low Voltage Distribution Circuit Facilities were binned within this category if the SGIP report identified that the GFs proposed PCC was located on a distribution circuit that was currently serving customers. Nominal system voltage at the PCC ranged from 12.47 kV to 34.5 kV. Interconnection facilities required for this configuration generally included short spans of conductors with associated poles, metering and communication equipment. Also included in this category were studies that identified the interconnection customer was requesting the expansion of an existing GF. Figure 7 illustrates a GF interconnecting through an existing distribution circuit.
Figure 7. Tap existing low voltage distribution circuit topology.
4.2. Build New Distribution Circuit from Substation Facilities were binned within this category if the report identified the need to construct one or more distribution feeders from the Substation to the GF. This interconnection topology included two distinct interconnection topologies: single feeder service and double feeder service. Interconnection facilities for single feeder service topology required new three-phase conductors from the substation to the GF. Generally this also included substation modifications such as bus modifications, new feeder position, feeder getaway, and relay equipment. Figure 8 illustrates the circuit topology for facilities requiring a new single feeder distribution circuit.

18
Figure 8. Single feeder service topology. Facilities were binned within the double feeder service topology if the SGIP study identified the need to split the output of the GF between two new distribution feeders, one specifically constructed to service the proposed GF. Double feeder service topologies essentially required two PCCs for the interconnecting GF. Three SGIP studies in the database required double feeder service topologies to interconnect. In all three cases, double feeder service topologies were used to conform to distributive generation capacity limits, which impose a cap on the amount of generation that can be interconnected to distribution feeders and substation transformers. Figure 9 illustrates a typical double feeder service interconnection for a proposed GF. Interconnection facilities requiring double feeder service included a new three-phase distribution circuit from a new substation transformer to the GF. This topology also typically required modifications to the interconnecting substation such as: a new substation transformer, feeder breaker, relays, and feeder getaway.

19
Figure 9. Double feeder service topology.
4.3. Tap Existing High Voltage Distribution Circuit
Facilities were binned within this category if the SGIP study identified that the PCC of the GF was located on distribution circuits interconnecting on the high side of the substation transformer. The nominal system voltage for the EPS at the PCC for these facilities was 69 kV or less. Figure 10 illustrates a typical circuit topology for facilities interconnecting through existing high voltage distribution circuits. Interconnection facilities for this configuration typically included conductor spans from the GF to the existing high voltage distribution circuit and metering and communication equipment.
Figure 10. Tap existing high voltage distribution circuit topology.

20
5. IMPACT CLASSIFICATION & MITIGATION
This section defines the methodology used to classify impacts identified in the individual SGIP studies. The impacts identified in the SGIP reports fell into four main categories: Overvoltage, Voltage Deviation, Thermal Overload and Protection.
5.1. Overvoltage Impacts were classified as overvoltage impacts if the SGIP report identified that the proposed GF caused a voltage violation above the voltage range set by the EPS provider. Although not specifically stated in all SGIP reports, it was assumed that overvoltage violations referred to voltage levels exceeding ANSI Range-A. Under normal conditions of Range-A, ANSI C84.1-201111 requires that service voltage remain within plus or minus 5% of nominal system voltage. Mitigation for overvoltage impacts were binned into four categories: Inverter PF Correction, LTC Adjustments, Voltage Regulation Control Modifications and Voltage Regulation Equipment Modifications. Inverter PF Correction Included SGIP reports that mitigated overvoltage impacts by requiring that inverters operate at a power factor (PF) other than unity. SGIP reports requiring inverter PF correction indicated that inverters located at the GF would need to absorb reactive power at the PCC to mitigate voltage rise caused by the interconnection of the GF. LTC Adjustments Included SGIP reports that mitigated overvoltage impacts by adjusting load tap changer (LTC) settings on the substation transformer. Voltage Regulation Control Modifications Includes SGIP reports that mitigated overvoltage impacts by modifying the controls to existing voltage regulator equipment located on the EPS. In this context voltage regulator equipment would include voltage regulators, capacitor banks and static VAR compensators (SVC). An example of a mitigation that would be binned within the voltage regulator control modifications category would be the need to change the control strategy of a capacitor bank from VAR controlled to voltage controlled. Voltage Regulator Equipment Modifications Includes SGIP reports that mitigated overvoltage impacts by installing new voltage regulator equipment or modifying the location of existing voltage regulator equipment. In this context voltage regulator equipment would include Voltage regulators, Capacitor banks and SVC owned by the EPS provider.
11 Reference: ANSI Standard C84.1-2011 Electrical System Equipment- Voltage Ratings (60Hz)
21
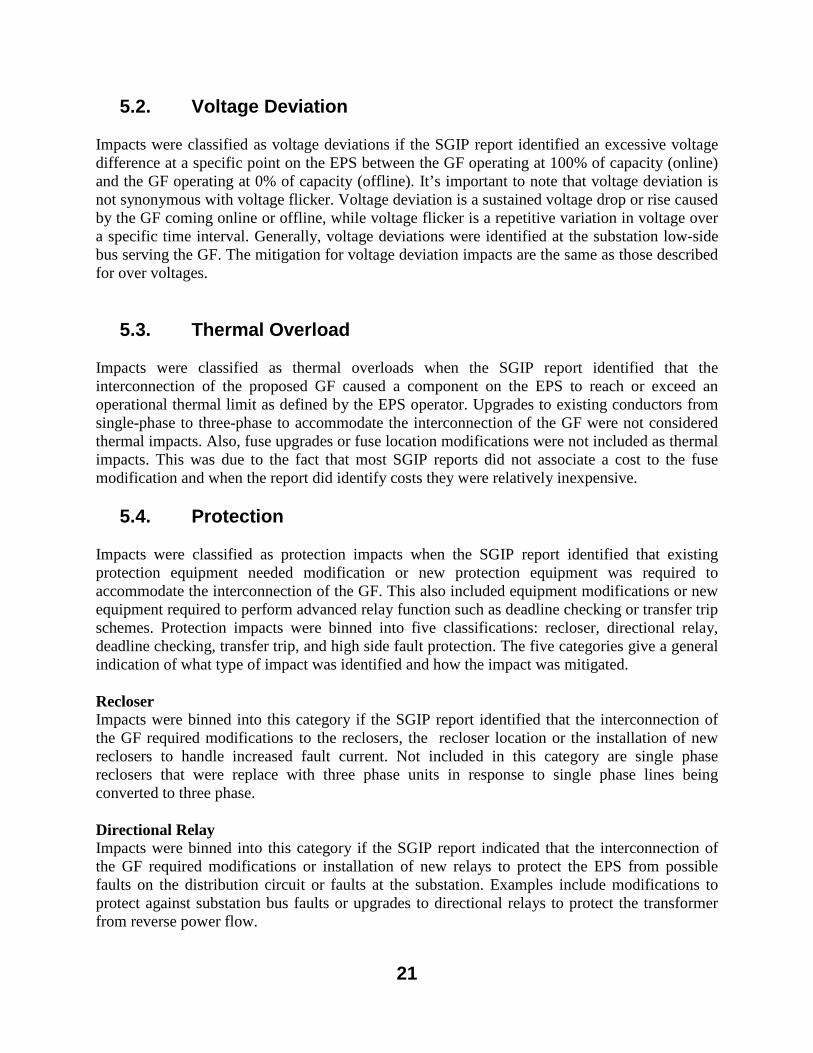
5.2. Voltage Deviation Impacts were classified as voltage deviations if the SGIP report identified an excessive voltage difference at a specific point on the EPS between the GF operating at 100% of capacity (online) and the GF operating at 0% of capacity (offline). It’s important to note that voltage deviation is not synonymous with voltage flicker. Voltage deviation is a sustained voltage drop or rise caused by the GF coming online or offline, while voltage flicker is a repetitive variation in voltage over a specific time interval. Generally, voltage deviations were identified at the substation low-side bus serving the GF. The mitigation for voltage deviation impacts are the same as those described for over voltages.
5.3. Thermal Overload Impacts were classified as thermal overloads when the SGIP report identified that the interconnection of the proposed GF caused a component on the EPS to reach or exceed an operational thermal limit as defined by the EPS operator. Upgrades to existing conductors from single-phase to three-phase to accommodate the interconnection of the GF were not considered thermal impacts. Also, fuse upgrades or fuse location modifications were not included as thermal impacts. This was due to the fact that most SGIP reports did not associate a cost to the fuse modification and when the report did identify costs they were relatively inexpensive.
5.4. Protection Impacts were classified as protection impacts when the SGIP report identified that existing protection equipment needed modification or new protection equipment was required to accommodate the interconnection of the GF. This also included equipment modifications or new equipment required to perform advanced relay function such as deadline checking or transfer trip schemes. Protection impacts were binned into five classifications: recloser, directional relay, deadline checking, transfer trip, and high side fault protection. The five categories give a general indication of what type of impact was identified and how the impact was mitigated. Recloser Impacts were binned into this category if the SGIP report identified that the interconnection of the GF required modifications to the reclosers, the recloser location or the installation of new reclosers to handle increased fault current. Not included in this category are single phase reclosers that were replace with three phase units in response to single phase lines being converted to three phase. Directional Relay Impacts were binned into this category if the SGIP report indicated that the interconnection of the GF required modifications or installation of new relays to protect the EPS from possible faults on the distribution circuit or faults at the substation. Examples include modifications to protect against substation bus faults or upgrades to directional relays to protect the transformer from reverse power flow.

22
Deadline Checking Impacts were binned into this category if the SGIP report identified that the interconnection of the GF required a protection scheme to ensure fault protection equipment did not reclose onto an energized line. This was required to ensure that temporary faults on the distribution line have time to clear before protection equipment recloses onto the line. Equipment required for this type of protection scheme generally included new relays and current transformers as well as communication equipment. Transfer Trip Impacts were binned into this category if the SGIP report identified that protection of the EPS required a protection scheme to enable fast disconnection of multiple generators. This also includes protection schemes to trip remote relays on adjacent feeders. Typically this included new relays and voltage transformers as well as communication equipment. High Side Fault protection Impacts were classified as high side fault protection if the SGIP report identified that the interconnection of the GF required monitoring of faults on the high side of the substation transformer servicing the GF. This includes faults on conductors between substations and faults on the high-side bus of the service transformer. Equipment needed to implement this protection scheme included the installation of relays and equipment at the interconnecting substation and possibly remote substations.

23
6. GENERAL STATISTICS This section highlights general statistics found in the dataset. As indicated in Figure 11, facility sizes found in the dataset ranged from 1 MW to 20 MW. Generally, facilities larger than 2 MW but less than 20 MW enter the study process by default. Facilities found in the dataset less than 2 MW entered the study process by failing one or more of the 10 Fast Track Screens. Specifically, the five Fast Track Screens relevant for facilities studied in the dataset are:
• The small generation facility’s capacity must be less than 15% of the peak load on the
circuit. • The total small generation facility’s contribution to fault current shall not exceed more
than 10% of the distribution circuits’ maximum fault current. • The addition of the small generation facility must no cause distribution equipment to
exceed 87.5% of short circuit interruption capability. • The capacity of the small generation facility shall not exceed 10 MW if interconnecting
to an area with known transient stability limitations • No construction of facilities by the Transmission Provider on its own system shall be
required to accommodate the small generation facility.
The number of SGIP studies in the database, binned by identified generation capacity is illustrated in Figure 11.
Figure 11. Facility size binned by MW12.
12 The generation capacities represented in Figure 11 have been rounded down to the nearest while number.

24
Generation capacities in the SGIP reports were largely dependent on which utility data source the reports came from. The majority of SGIP reports with generation capacities in the 2 MW range (63%) were reports performed by PacifiCorp. All SGIP reports with facilities in the 6 MW capacity range were performed by PNM, while the majority of reports with 20 MW generation capacity were performed by APS. The largest concentration of generation facilities was found in the 2 MW capacity range, with 25% of the generation capacities between 2-3 MW. Approximately two-thirds (66%) of SGIP studies had generation capacities of less than 7 MW. SGIP reports binned by interconnection voltage are illustrated in Figure 12. The interconnection voltage was defined as the operational voltage of the electrical system at the PCC. The majority of facilities (70%) found in the dataset interconnected to the 12.47 kV level. All SGIP reports interconnecting with 69 kV were of 20 MW generation capacities. The remaining 20 MW facilities were split between the 12.47 kV and 34.5 kV interconnection voltages.
Figure 12. Facilities binned by interconnection voltage. Of the 100 SGIP reports in the database, 99 provided enough information to identify the proposed interconnection topology of the generation facility. The exception was an SGIP report that did not specifically state in the body of text or in the accompanying circuit diagrams whether the GF would interconnect through existing infrastructure or would require new construction. As indicated in Figure 13, roughly 70% of the studies identified interconnection through an existing low voltage distribution circuit.

25
Figure 13. Proposed interconnection topology13. A breakdown of interconnection topologies by generation capacity is shown in Figure 14 . Interconnection topologies were largely dependent on the generation capacity of the GF. All GFs interconnecting through existing low voltage distribution circuits had generation capacities of 10 MW or less. Also, the majority GFs interconnecting through existing high voltage distribution circuits had generation capacities of 20 MW.
Figure 14. Interconnection topologies by facility size14. 13 One SGIP study is left out of the analysis for Figures 13. The report did not provide an interconnection topology 14 The generation capacities represented in Figure 14 have been rounded down to the nearest whole number.

26
The interconnection topologies of the GF were strongly correlated to the presence/absence of adverse impacts. Generally, adverse system impacts are more probable if a GF was interconnecting through an existing distribution circuit. Figure 15 highlights adverse system impact by two interconnection topologies: tap existing low voltage distribution circuit and tap existing high voltage distribution circuit. 68% of generation facilities that identified tapping existing distribution circuits caused one or more adverse impacts on the EPS.
Figure 15. Tap existing high and low distribution circuits. Adverse system impacts were less probable if the interconnection of the GF required the construction of a new distribution circuit from the substation. As indicated in Figure 16, three facilities (14% of SGIP reports) that identified interconnecting through new distribution circuits had an adverse impact on the existing equipment located at the substation. The advantage of building new distribution circuits is that the impacts are limited to the equipment at the interconnecting substation.
Figure 16. Build new distribution circuit15.
15 One SGIP study is left out of the analysis for Figures 15 and 16. The report did not provide an interconnection topology but the report identified no adverse impact cause by the interconnection.

27
Taking the dataset as a whole regardless of interconnection topology, Figure 17 shows that 44% of SGIP studies identified no adverse system impact from the interconnection of the GF. Facilities requiring construction of new distribution feeders that did not identify adverse system impacts were binned in the no adverse impact group.
Figure 17. Identified impacts for all SGIP studies in database.

28

29
7. IDENTIFIED IMPACTS & MITIGATION The database contains 56 SGIP reports that identified one or more adverse system impacts associated with the interconnection of the GF. Three main impacts identified in the SGIP reports were voltage impacts, thermal overload impacts and protection impacts. The dataset represented in this section is highlighted in Figure 18, where SGIP reports are binned by identified impacts. All thermal overloads occurred in conjunction with other impacts.
Figure 18. SGIP reports binned by identified impacts.
7.1. Voltage This section highlights voltage mitigation costs as identified in the 29 SGIP reports that identified voltage impacts. It is important to note that 20 of SGIP reports referenced in this section identified other impacts besides the voltage impact. The costs identified in this section refer to only the voltage mitigation. The subset highlighted in this section is illustrated in Figure 19, where voltage impacts are grouped into four categories, those with purely voltage impacts and those with voltage and one or more other impacts.
Figure 19. Impact set16.
16 Subset represents all 29 SGIP reports in dataset that identified a voltage impact.

30
The voltage impacts identified in the SGIP reports were classified into two categories: Overvoltage and Voltage Deviation. The breakdown between the two categories is illustrated in Figure 20. Overvoltage impacts represent the majority of identified voltage issues.
Figure 20. Impact classification. As indicated in Figure 20, 19 SGIP studies identified overvoltage impacts associated with the interconnection of the GF. Three overvoltage mitigation methods were identified in the SGIP reports, they include: inverter power factor (PF) correction, installation or modifications to of voltage regulation equipment and conductor upgrade modifications. Table 1 lists facility characteristics and inverter PF set points for the 9 SGIP reports that required only inverter PF correction to mitigate overvoltage impacts. Facility sizes ranged from 4 -10 MW with interconnection voltages ranging from 12.47 kV-13.8 kV. Utilizing the reactive power control capabilities of the PV inverters provided the added benefit of imposing no added cost to the utility company for mitigating overvoltage impacts.

31
Table 1: Overvoltage mitigation utilizing PF correction only.
Study ID Size Interconnection Voltage PF Correction Mitigation Cost Operate at 99% Lagging PF
$0.00Operate at 95.5% Leading PF
$0Operate at 96% Lagging PF
$0Operate at 99% Lagging PF
$0Operate at 98.5% Lagging PF
$0Operate at 98.5% Lagging PF
$0Operate at 97.5% Lagging PF
$0Operate at 97% Lagging PF
$0Operate at PF other an unity
$0
Project Pajarito 5,000 KVA 5.0 $0
Project Hondale 6.0 $0
Project Tome 4MW 4.0 $0
12.47kV
13.8kV
12.47kV
Project Tularosa 9MN 9.0 $0
Project GDP Tome 9 MW 9.0 $0
Project Alamogordo Airport -Site 1 6.0 $012.47kV
12.47kV
12.47kV
Project Los Chaves 6.0 $0
Project Hondale 9MW 9.0 $0
Lost Horizon 10MW 10.0 $012.47kV
13.8kV
12.47kV
Table 2 lists the 7 SGIP studies that utilized voltage regulator equipment modifications and/or voltage regulator control modifications to mitigate overvoltage impacts. Three out of the seven also used inverter PF correction in the mitigation process. Costs associated with voltage regulator equipment modifications and voltage regulator control modifications ranged from $3,500 to $98,562. The lower end cost was associated with modifications to the controls of an existing capacitor bank. The higher end cost was associated with the installation of both a capacitor bank and voltage regulator. Table 2: Overvoltage mitigation utilizing voltage regulation equipment and PF correction.
Study ID Size PCC Distance Vreg/Cap/SCV PF Correction LTC Vreg/Cap/SCV Mitigation Cost • Upgrade Vreg
$89,562• Install Line Regulator
$UNK• New 1200kVAR Cap Bank • Operate at 99% lag PF
$UNK $0• Remove 1800kVar Cap Bank • Operate at 98% Lag PF
$0 $0•Upgrade Cap Bank Controller
$3,500• New Vreg• New Cap Bank
• Operate at 98% Lag PF
$50,081 $0• LTC Adjustment
$0
$UNK
$0
$3,500
$50,500
$0
$98,562
$UNK
Project Los Morros 9MN 9.0 4,300
Project Tome 10,000KVA 10.0 10,831
Project Mesa Del Sol 10.0 21,211
Project Alamogordo Airport -Site 2 6.0 26,815
Project Juwi 8MW 8.0 27,562
V2-035 2
Q0454 3 47572
Table 3 lists the three overvoltage cases that were mitigated by upgrading conductors. In all three cases, the conductor upgrades were required primarily to mitigate thermal overload impacts that resulted from the interconnection of the GF. The cost associated with conductor upgrades range from $104,100 to $383,700. Facility sizes ranged from 2.1 MW-3 MW and interconnection voltages were at the 12.47 kV class.
32
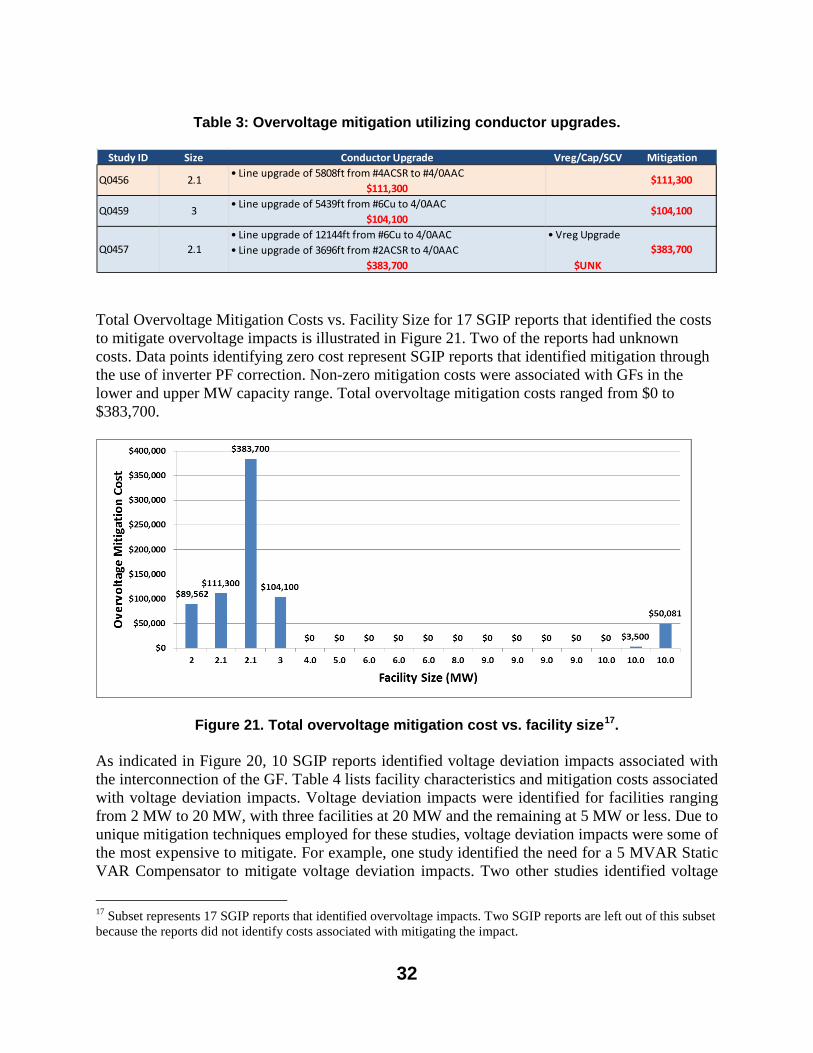
Table 3: Overvoltage mitigation utilizing conductor upgrades.
Study ID Size Conductor Upgrade Vreg/Cap/SCV Mitigation
• Line upgrade of 5808ft from #4ACSR to #4/0AAC$111,300
• Line upgrade of 5439ft from #6Cu to 4/0AAC$104,100
• Line upgrade of 12144ft from #6Cu to 4/0AAC• Line upgrade of 3696ft from #2ACSR to 4/0AAC
• Vreg Upgrade
$383,700 $UNK
Q0459 3
$111,300
$104,100
Q0456 2.1
Q0457 2.1 $383,700
Total Overvoltage Mitigation Costs vs. Facility Size for 17 SGIP reports that identified the costs to mitigate overvoltage impacts is illustrated in Figure 21. Two of the reports had unknown costs. Data points identifying zero cost represent SGIP reports that identified mitigation through the use of inverter PF correction. Non-zero mitigation costs were associated with GFs in the lower and upper MW capacity range. Total overvoltage mitigation costs ranged from $0 to $383,700.
Figure 21. Total overvoltage mitigation cost vs. facility size17. As indicated in Figure 20, 10 SGIP reports identified voltage deviation impacts associated with the interconnection of the GF. Table 4 lists facility characteristics and mitigation costs associated with voltage deviation impacts. Voltage deviation impacts were identified for facilities ranging from 2 MW to 20 MW, with three facilities at 20 MW and the remaining at 5 MW or less. Due to unique mitigation techniques employed for these studies, voltage deviation impacts were some of the most expensive to mitigate. For example, one study identified the need for a 5 MVAR Static VAR Compensator to mitigate voltage deviation impacts. Two other studies identified voltage
17 Subset represents 17 SGIP reports that identified overvoltage impacts. Two SGIP reports are left out of this subset because the reports did not identify costs associated with mitigating the impact.

33
deviations at substation buses which required the installation of voltage regulators on every feeder at the substation.
Table 4: Voltage deviation mitigation and costs.
Study ID SizeInterconnection
VoltagePCC Distance Vreg/Cap Modifications Line Upgrade Mitigation Cost
• Reprogram CapBank• Upgrade (3) Vregs
$UNK• Vreg location Modification • Line upgrade of 22176ft to 477 kcmil AAC
$In Line Upgrade $1,411,200 • Line upgrade 2400ft of #2 ACSR to 477 AAC• line upgrade 11000ft of 1/0 ACSR to 477 AAC
$434,800
• Upgrade Vreg• Line upgrade 28433ft #4 ACSR to 795 AAC• Line upgrade 1478ft 1/0 ACSR to 795 AAC
$In Line Upgrade $1,703,900
• Upgrade Vreg• Line upgrade 19008ft to 477 AAC• Line upgrade 12144ft of #2 Al UG to 1000 AL UG
$In Line Upgrade $2,415,100
• Replace regulator control • Line Upgrade 64416ft of #6 Coppper to 4/0 ACSR
$In Line Upgrade $878,000 • New 1200kVAR CapBank
$UNK• (6) New Vregs
$1,100,000• (4) New Vregs
$600,000• New 5MVAR SCV
$5,000,000
U2-059 2 12.47kV
Q0451 2.97 12.47kV 31680
Q0489 3 12.47kV 36960
Q0491 3 12.47kV 27984
Q0490 3 12.47kV 30096
Q0488 3 34.5kV 82896
Q0422 5 12.47kV
Q166 20 12.47kV
Q190 20 12.47kV
Q122 20 69kV
$UNK
$1,100,000
$600,000
$5,000,000
$UNK
$1,411,200
$434,800
$1,703,900
$2,415,100
$878,000
7.2. Thermal
This section highlights the thermal mitigation costs ascertained from the 20 SGIP reports that identified thermal overload requiring mitigation. The dataset represented in this section is highlighted in Figure 22 where thermal issues are grouped into three categories, those with purely thermal overloads and those with thermal overload and one or more other impacts. As indicated by Figure 22, all 20 SGIP reports identified that thermal overloads occurred in conjunction with one or more other impacts. Three of the studies discussed in the overvoltage section with overvoltage impacts were mitigated when upgrades to conductors were performed. The conductor upgrades were required primarily to mitigate thermal overload impacts that resulted from the interconnection of the GF and secondarily to mitigate the overvoltage impacts. All three studies were facility sizes of 3 MW or less and the conductor upgrades were to 4/0AAC.

34
Figure 22. Thermal overload impact set. Thermal mitigation methods identified in the 20 SGIP reports are highlighted in Figure 23. The majority of thermal mitigation methods required upgrading components to higher power rating components. One notable SGIP report identified that the GF caused a thermal overload on conductor when the feeder was in contingency configuration. To mitigate the thermal violation the GF would need to curtail 100% of its output when the feeder was in contingency operation. The study was notable in that it was the only one that required 100% curtailment of GF output to mitigate a system impact. It was likely that this solution was cost effective for both the utility and the GF owner since contingencies are relatively rare events. A breakdown of specific overloaded components is depicted in Figure 23. As indicated in Figure 23 the vast majority of thermal overloads occurred on feeder conductor sections.
Figure 23. Facilities adversely impacted by thermal overloads.
35
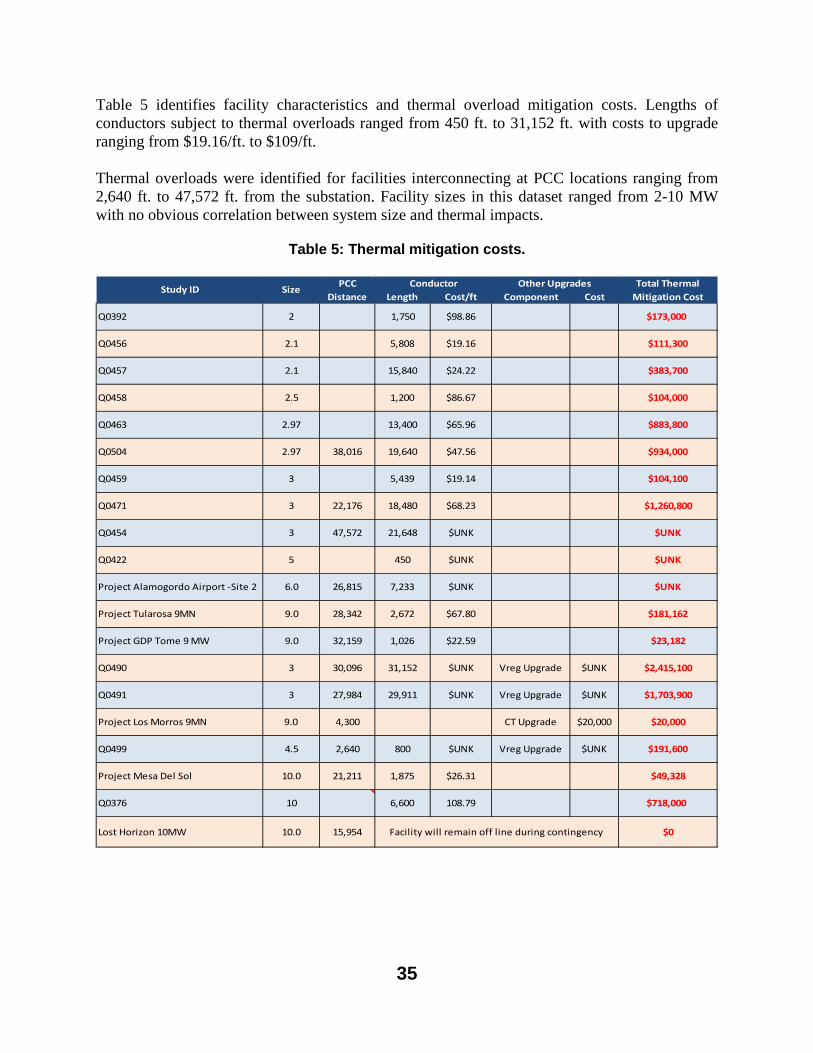
Table 5 identifies facility characteristics and thermal overload mitigation costs. Lengths of conductors subject to thermal overloads ranged from 450 ft. to 31,152 ft. with costs to upgrade ranging from $19.16/ft. to $109/ft. Thermal overloads were identified for facilities interconnecting at PCC locations ranging from 2,640 ft. to 47,572 ft. from the substation. Facility sizes in this dataset ranged from 2-10 MW with no obvious correlation between system size and thermal impacts.
Table 5: Thermal mitigation costs.
Length Cost/ft Component Cost
$98.86 $173,000
10 6,600 108.79
Facility will remain off line during contingency
450
Total Thermal Mitigation Cost
Other UpgradesConductor
$0
$UNK
$20,000
$181,162
$23,182
$49,328
$1,703,900
$2,415,100
$718,000
1,750
$1,260,800
$UNK
$191,600
$UNK
$111,300
$383,700
$104,000
$883,800
$934,000
$104,100
$UNK
$UNK
$UNK
$20,000CT Upgrade
1,875
2.97
2.97
3
3
3
3
4.5 $UNK
$UNK
$47.56
$65.9613,400
19,640
800
2,672
5,439
29,911
18,480
21,648
7,233
1,026
$86.67
$19.14
$26.31
$22.59
$67.80
$UNK
$UNK
Vreg Upgrade
Vreg Upgrade
Vreg Upgrade
$19.16
$24.22
Project Mesa Del Sol 21,211
Lost Horizon 10MW 15,954
10.0
10.0
Project GDP Tome 9 MW 32,1599.0
Project Los Morros 9MN 4,300
Q0376
Q0499 2,640
$UNK
Q0490 30,096 $UNK
Q0471 22,176 $68.23
31,152
Project Tularosa 9MN 28,342
9.0
9.0
Q0422
Project Alamogordo Airport -Site 2 26,815
5
6.0
Q0459 3
Q0491 27,984
Q0463
Q0504 38,016
Q0454 47,572
Q0457 2.1 15,840
Q0458 2.5 1,200
Q0456 2.1 5,808
Study ID Size PCC Distance
Q0392 2

36
Table 6 lists ampacity ratings for conductors before and after they were upgraded. No general trend was identified for conductors that needed to be upgraded.
Table 6: Ampacity upgrades.
From TOQ0392 2 180 510Q0456 2.1 13,200 140 299
120 299180 299
Q0458 2.5 180 299180 510230 510120 510
510Q0459 3 16,579 120 299Q0471 3 22,176 230 510Q0454 3 47,572 230 510
3 300 6703 135 5503 140 7203 230 720
Q0499 4.5 2,640 170 299Q0422 5 11,088 230 299Project Alamogordo Airport -Site 2 6 26,815 230 440Project Tularosa 9MN 9 28,342 340 440Project GDP Tome 9 MW 9 32,159 180 440Project Mesa Del Sol 10 21,211 180 440Q0376 10 490 720
Q0457 2.1 25,872
Study ID Size PCC Distance
Conductor
Q0490 30,096
Q0491 27,984
Q0463 2.97
Q0504 2.97 38,016
7.3. Protection This section highlights the protection mitigation costs ascertained from the 43 SGIP reports that identified protection impacts requiring mitigation. The dataset represented in this section is highlighted in Figure 24 where protection issues are grouped into four categories, those with purely protection issues and those with protection issues and one or more other impacts. Interconnection voltages for studies identifying protection issues ranged from 12.47 kV to 46 kV, with 32 studies at 12.47 kV, 1 at 13.8 kV, 9 at 34.5 kV and 1 at 46 kV as the interconnection

37
voltage. Facilities sizes in the dataset ranged from 2-20 MW, with 41 facility sizes less than 10 MW.
Figure 24. Protection impact set. For the purposes of this analysis protection mitigations were binned into two categories: recloser and substation modification. The breakdown between the two categories is shown in Figure 25. The substation protection category includes impacts requiring deadline checking, transfer trip directional relays and high side fault protection. The majority of the reports that identified protection impacts required substation modifications to interconnect the GF.
Figure 25. Protection impact mitigation. Table 7 highlights a subset of the substation protection category, those that only required relay modifications to mitigate protection impacts. Generally the relay modifications were required to protect the EPS from possible faults on the substation bus or faults in the substation transformer. Facility sizes for the 5 SGIP studies ranged from 2-13 MW with mitigations costs ranging from $2,000 to $505,200.
Table 7: Substation fault protection - Relay modifications only.

38
Study ID SizeInterconnection
VoltagePCC
DistanceProtection
ReqirmentsProtection Mitigation
CostProject Bonanza 2.0 12.47kV 8,409 Relay Adjustment $UNKProject Alamogordo Airport -Site 1 6.0 12.47kV 27,525 Relay Adjustment $5,000Project Las Vegas 6.0 12.47kV 10,900 Relay adjustment $0Project Hondale 9MW 9.0 13.8kV 16,737 Directional Relay $2,000V4-077 13 46kV 2640 Relay Upgrades $505,200 Table 8 summarizes the remainder of substation protection impacts, those that required relay modification in conjunction with advanced protection schemes. Thirty studies identified the need for advanced relay functionality to mitigate protection impacts. Facility sizes ranged from 2-20 MW with the majority (28 reports) of 5 MW or less. SGIP reports that identified the need for advanced relay functions exhibited large variations in mitigation costs, which ranged from $74,600 to $1,300,000. The variation was attributed to the fact that implementing advanced relay functionality did not conform to a standard procedure. Some implementations only required communication lines from the substation to the GF while others required major construction modifications at the substation to install the required equipment. Modifications ranged from substation bus expansion to full substation expansions.
Table 8: Substation fault protection - Relay modifications & advanced protectionschemes.
Study ID SizeInterconnection
VoltagePCC
DistanceDirectional Relay Deadline Checking Transfer Trip High Side Faults Recloser
Protection Mitigation Cost
Q0463 2.97 12.47kV Directional Relay Deadline Checking Transfer Trip Recloser $667,900Q0493 3 12.47kV 9950 Deadline Checking Transfer Trip Recloser $257,400Q0499 4.5 12.47kV 2640 Deadline Checking Transfer Trip High Side Faults $632,200 Q0376 10 12.47kV Deadline Checking Transfer Trip High Side Faults $1,177,200Q0310 20 34.5kV High Side Faults $1,300,000Q0456 2.1 12.47kV Directional Relay Deadline Checking Transfer Trip $618,900 Q0457 2.1 12.47kV Directional Relay Deadline Checking Transfer Trip $1,048,700 Q0385 2.75 12.47kV Directional Relay Deadline Checking Transfer Trip $435,000Q0451 2.97 12.47kV 31680 Directional Relay Deadline Checking Transfer Trip $642,900 Q0459 3 12.47kV Directional Relay Deadline Checking Transfer Trip $961,500Q0471 3 34.5kV 22176 Directional Relay Transfer Trip $112,100 Q0454 3 34.5kV 47572 Directional Relay Deadline Checking Transfer Trip $223,800 Q0392 2 12.47kV Directional Relay Transfer Trip $264,000Q0249 2.3 12.47kV Directional Relay Deadline Checking $74,600 Q0458 2.5 12.47kV Deadline Checking Transfer Trip $117,600Q0492 3 12.47kV 5280 Deadline Checking Transfer Trip $211,300 Q0475 3 12.47kV 11088 Deadline Checking Transfer Trip $300,000 Q0489 3 12.47kV 36960 Deadline Checking Transfer Trip $380,100 Q0491 3 12.47kV 27984 Deadline Checking Transfer Trip $472,200 Q0490 3 12.47kV 30096 Deadline Checking Transfer Trip $404,900 Q0464 3 34.5kV 47572 Deadline Checking Transfer Trip $NONEQ0488 3 34.5kV 82896 Deadline Checking Transfer Trip $518,000 Q0422 5 12.47kV Deadline Checking Transfer Trip $241,600 Q0495 4.8 12.47kV 5193 Deadline Checking $116,200 Q0389 2 12.47kV Deadline Checking $511,000V4-075 2 12.47kV Transfer Trip $130,000 Q0502 2.97 12.47kV 7920 Transfer Trip $274,400 Q0504 2.97 12.47 38016 Transfer Trip $122,500 Q0455 3 34.5kV 47572 Transfer Trip $NONEQ0473 3 34.5kV 28512 Transfer Trip $NONEQ0472 3 34.5kV 14256 Transfer Trip $NONEV4-068 5 34.5kV 23,760 Transfer Trip $UNK SGIP reports that identified the need to monitor high side faults represent the most expensive mitigation costs for facilities requiring advanced relay functionality. This was attributed to the fact that monitoring high side faults required the installation of equipment on high side

39
conductors servicing substation and at remote substations. Table 9 summarizes key characteristics identified in the SGIP studies for facilities using reclosers to mitigate protection impacts. Two SGIP studies identified the need to install more than one recloser to mitigate the identified protection impacts. As indicated in Table 9, facilities sizes ranged from 2-9 MW. Mitigation cost utilizing reclosers ranged from $45,000 to $178,900.
Table 9: Protection- Recloser modifications.
Study ID SizeInterconnection
VoltagePCC
Distance# Units
Protection Mitigation Cost
V2-035 2 12.47kV 1 $67,850 U2-059 2 12.47kV 1 $UNKQ0211 2.75 12.47kV 2 $178,900 Project Los Morros 6,000 KW 6.0 12.47kV 4,155 2 $90,000 Project Los Morros 9MN 9.0 12.47kV 4,300 1 $45,000 Project Tularosa 9MN 9.0 12.47kV 28,342 1 $45,000

40
41
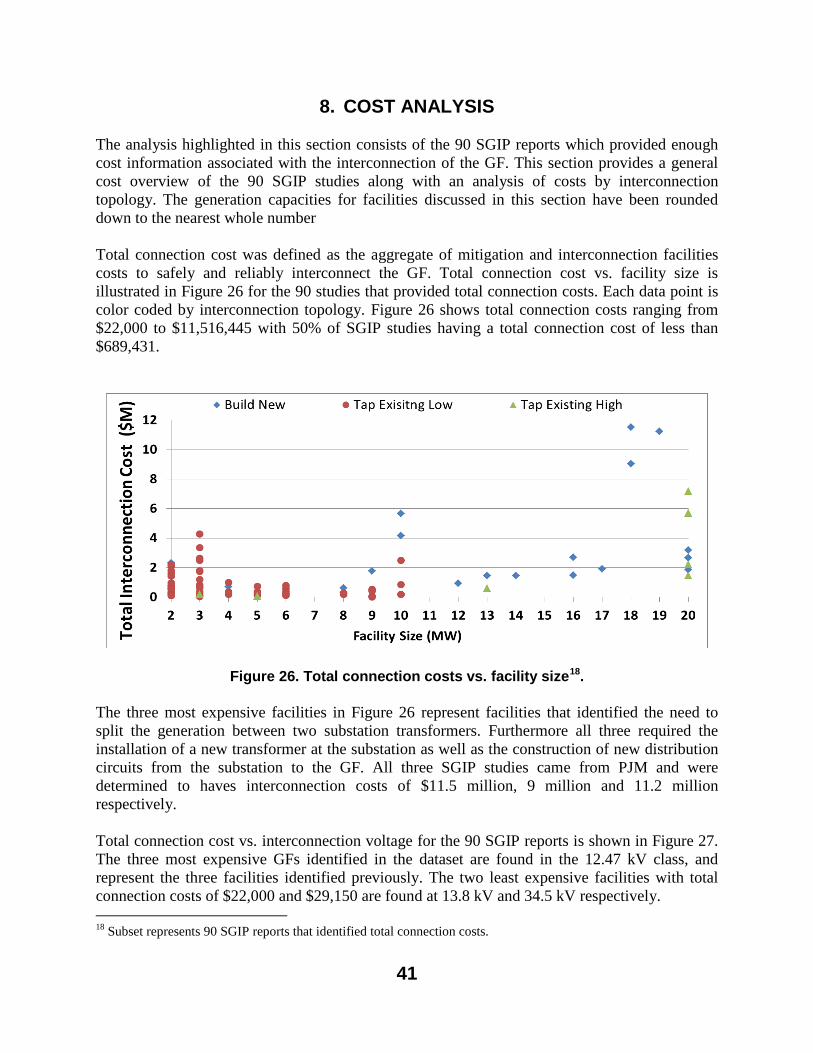
8. COST ANALYSIS The analysis highlighted in this section consists of the 90 SGIP reports which provided enough cost information associated with the interconnection of the GF. This section provides a general cost overview of the 90 SGIP studies along with an analysis of costs by interconnection topology. The generation capacities for facilities discussed in this section have been rounded down to the nearest whole number Total connection cost was defined as the aggregate of mitigation and interconnection facilities costs to safely and reliably interconnect the GF. Total connection cost vs. facility size is illustrated in Figure 26 for the 90 studies that provided total connection costs. Each data point is color coded by interconnection topology. Figure 26 shows total connection costs ranging from $22,000 to $11,516,445 with 50% of SGIP studies having a total connection cost of less than $689,431.
Figure 26. Total connection costs vs. facility size18. The three most expensive facilities in Figure 26 represent facilities that identified the need to split the generation between two substation transformers. Furthermore all three required the installation of a new transformer at the substation as well as the construction of new distribution circuits from the substation to the GF. All three SGIP studies came from PJM and were determined to haves interconnection costs of $11.5 million, 9 million and 11.2 million respectively. Total connection cost vs. interconnection voltage for the 90 SGIP reports is shown in Figure 27. The three most expensive GFs identified in the dataset are found in the 12.47 kV class, and represent the three facilities identified previously. The two least expensive facilities with total connection costs of $22,000 and $29,150 are found at 13.8 kV and 34.5 kV respectively. 18 Subset represents 90 SGIP reports that identified total connection costs.

42
Generation facilities interconnecting through 12.47 kV circuits had the largest total connection cost variation. Total connection costs for generation facilities interconnecting through 12.47 circuits vary from $65,000 to $11,451,445. The smallest total connection cost variation occurs when interconnection through 13.8 kV circuits. Total connection costs for generation facilities interconnecting through 13.8 kV circuits vary from $22,000 to $321,000.
Figure 27. Total connection cost vs. interconnection voltage19. .
Total connection costs vs. facility size for SGIP reports that identified adverse system impacts are depicted in Figure 28. The subset illustrated in Figure 28 represents 53 SGIP reports. Total connection cost for studies that identified adverse impacts ranged from $22,000 to $7,165,454. 50% of SGIP studies identifying adverse system impacts had a total connection cost of less than $700,000. Two SGIP Studies had total interconnection costs of 2.66 million and 2.65 million. They were facilities whose interconnection required building new distribution circuits. The facilities had generation capacities of 20 MW and due to the fact that the total interconnection cost is extremely close, the data points are tough to distinguish in Figure 28.
19 Subset represents 90 SGIP reports that identified total connection costs.

43
Figure 28. Facilities with adverse system impacts20.
The variability in costs shown in Figure 28 reflects many factors such as facility size, mitigation requirements and interconnection configuration. The following sections address costs in relation to the various interconnection topologies.
8.1. Tap Existing Distribution Circuit This section addresses costs associated with generation facilities interconnecting through an existing distribution circuit. The 70 SGIP reports shown in Figure 29 have total connection cost varying between $22,000 and $7.16 million. 50% of facilities interconnected through existing distribution circuits had a total connection cost of less than $521,407 and roughly 80% had total connection costs of less than $1.5 million. The two most expensive facilities identified in Figure 29 interconnected through existing high voltage distribution circuits. They had total interconnection costs of $5.7 million and $7.1 million. Overall, tap existing high voltage distribution circuit topologies had total connection cost varying between $55,600 and $7.1 million.
20 Subset represents 53 SGIP reports that identified adverse system impacts and total costs to mitigate.

44
Facilities that interconnected through low voltage distribution circuits had total connection costs varying between $22,000 and $4.2 million. Furthermore, they represent facilities that all had generation capacities of less than 10MW.
Figure 29: Total connection cost vs. facility size for GF interconnecting through existing
distribution circuit21.
The price per MW for facilities interconnecting through existing distribution circuits is illustrated in Figure 30. The total connection cost per MW ranged from $2,444 per MW to $1,424,400 per MW. The largest price variation occurs for 3 MW facilities which ranged from $8,833 to $1,424,400. 50% of facilities had a total cost per MW of less than $133,833.
21 Subset represents 70 SGIP reports that identified interconnecting through existing distribution circuits. This includes both tap existing low voltage distribution circuits and tap existing high voltage distribution circuit topologies.

45
Figure 30. Price per MW vs. facility size for GF interconnecting through existing distribution circuit22.
A subset of the data discussed above, facilities identified as not having an adverse system impact is depicted in Figure 31. The dataset contains 20 facilities with total connection cost per MW varying between $8,833 and $285,110. 75% of facilities identified in Figure 31 had total connection cost per MW of less than $72,922.
22 Subset represents 70 SGIP reports that identified interconnecting through existing distribution circuits. This includes both tap existing low voltage distribution circuits and tap existing high voltage distribution circuit topologies.

46
Figure 31. Total connection cost per MW vs. facility size for GF interconnecting through existing distribution circuit that had no adverse impacts23.
8.2. Build New Distribution Circuit from Substation This section addresses total connection costs for GFs requiring the construction of a new distribution circuit from the substation. The dataset illustrated in Figure 32 includes both facilities with and without adverse system impacts and contains a total of 20 SGIP studies. Total connection cost for the studies illustrated in Figure 32 ranged from $325,000 to $11,516,445. The three most expensive facilities represent facilities that required double feeder service. All three facilities were interconnecting to 12.47 kV systems and ranged from 18 MW to 19.9 MW in size. 50% of facilities had a total connection cost of less than $2 million.
23 Subset represents 20 SGIP reports that did not identify adverse impacts and were interconnecting through existing distribution circuits. This includes both tap existing low voltage distribution circuits and tap existing high voltage distribution circuit topologies.

47
Two SGIP Studies had total interconnection costs of 2.66 million and 2.65 million and had protection and voltage deviation impacts respectively. The facilities had generation capacities of 20 MW and due to the fact that the total interconnection cost is extremely close, the data points are tough to distinguish in Figure 32.
Figure 32. Build new distribution circuit: Total connection cost vs facility size. Generally, building new distribution circuits limited the amount of distribution equipment exposed to possible adverse impacts. But impacts were still identified at the substation for facilities of sufficient generation capacity. Three SGIP studies identified adverse system impacts associated with the GF interconnecting through a new distribution circuit and each study was for a 20 MW system. Two of the impacts were identified as voltage deviation issues caused by the output capacity of the GFs. The two voltage deviation issues occurred at the substation bus and required the installation of voltage regulators on all feeders of the bus. The third study required line pilot relaying to protect remote substations from exposure caused by substation contingency operations. The SGIP report identified the need to install a 138 kV breaker, VT’s and CT’s at a remote substation as well as installing VT’s at the substation servicing the GF.
48
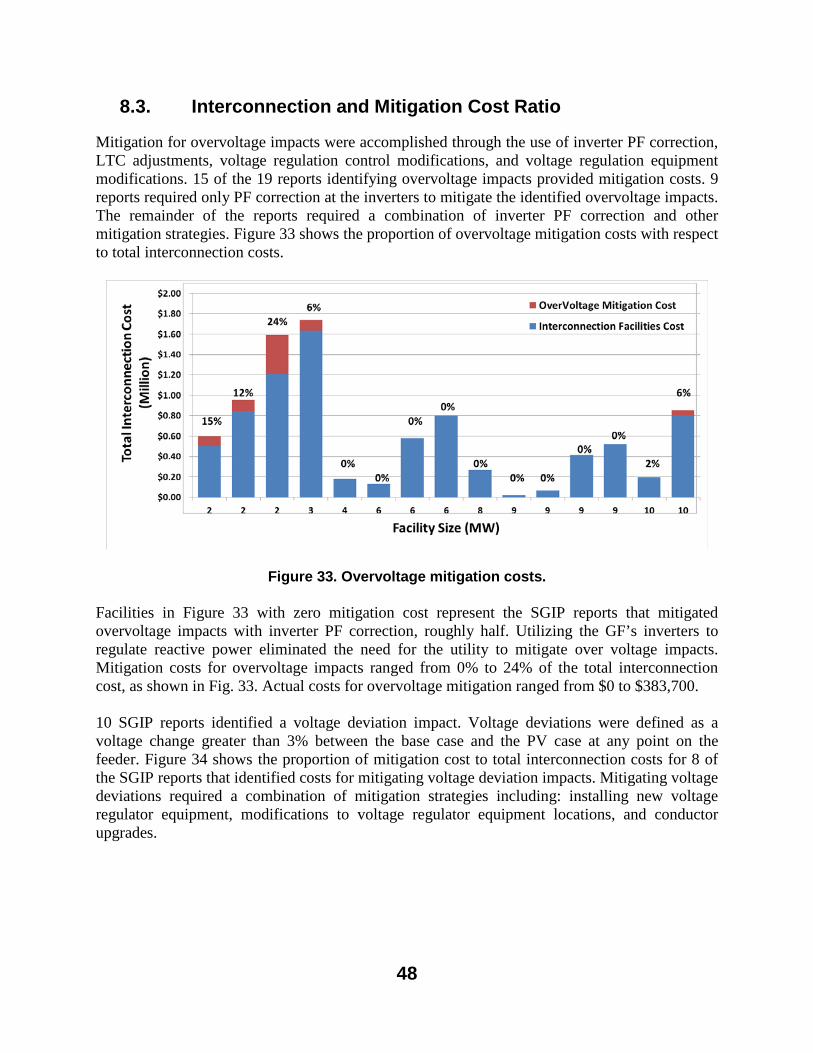
8.3. Interconnection and Mitigation Cost Ratio
Mitigation for overvoltage impacts were accomplished through the use of inverter PF correction, LTC adjustments, voltage regulation control modifications, and voltage regulation equipment modifications. 15 of the 19 reports identifying overvoltage impacts provided mitigation costs. 9 reports required only PF correction at the inverters to mitigate the identified overvoltage impacts. The remainder of the reports required a combination of inverter PF correction and other mitigation strategies. Figure 33 shows the proportion of overvoltage mitigation costs with respect to total interconnection costs.
Figure 33. Overvoltage mitigation costs. Facilities in Figure 33 with zero mitigation cost represent the SGIP reports that mitigated overvoltage impacts with inverter PF correction, roughly half. Utilizing the GF’s inverters to regulate reactive power eliminated the need for the utility to mitigate over voltage impacts. Mitigation costs for overvoltage impacts ranged from 0% to 24% of the total interconnection cost, as shown in Fig. 33. Actual costs for overvoltage mitigation ranged from $0 to $383,700. 10 SGIP reports identified a voltage deviation impact. Voltage deviations were defined as a voltage change greater than 3% between the base case and the PV case at any point on the feeder. Figure 34 shows the proportion of mitigation cost to total interconnection costs for 8 of the SGIP reports that identified costs for mitigating voltage deviation impacts. Mitigating voltage deviations required a combination of mitigation strategies including: installing new voltage regulator equipment, modifications to voltage regulator equipment locations, and conductor upgrades.
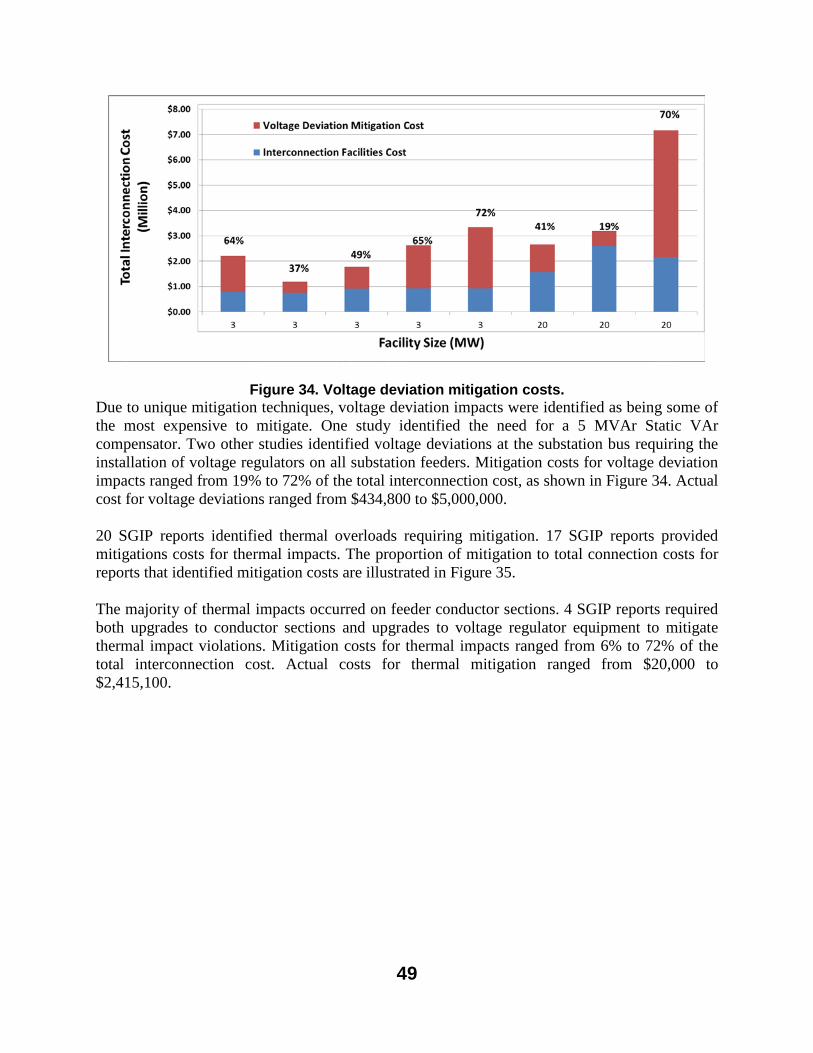
49
Figure 34. Voltage deviation mitigation costs. Due to unique mitigation techniques, voltage deviation impacts were identified as being some of the most expensive to mitigate. One study identified the need for a 5 MVAr Static VAr compensator. Two other studies identified voltage deviations at the substation bus requiring the installation of voltage regulators on all substation feeders. Mitigation costs for voltage deviation impacts ranged from 19% to 72% of the total interconnection cost, as shown in Figure 34. Actual cost for voltage deviations ranged from $434,800 to $5,000,000. 20 SGIP reports identified thermal overloads requiring mitigation. 17 SGIP reports provided mitigations costs for thermal impacts. The proportion of mitigation to total connection costs for reports that identified mitigation costs are illustrated in Figure 35. The majority of thermal impacts occurred on feeder conductor sections. 4 SGIP reports required both upgrades to conductor sections and upgrades to voltage regulator equipment to mitigate thermal impact violations. Mitigation costs for thermal impacts ranged from 6% to 72% of the total interconnection cost. Actual costs for thermal mitigation ranged from $20,000 to $2,415,100.

50
Figure 35. Thermal mitigation costs. 43 SGIP reports identified protection issues requiring mitigation. Mitigation for protection impacts were binned into two categories substation relay modifications and distribution protection modifications. Substation relay modifications included adjusting existing relay settings, implementing advanced relay functions such as deadline checking and transfer trip protection and installing protective relaying on the high side bus to protect against faults on the high side of the distribution substation. Distribution protection modifications included modifications to existing reclosers, or the installation of new reclosers on the existing distribution circuit.
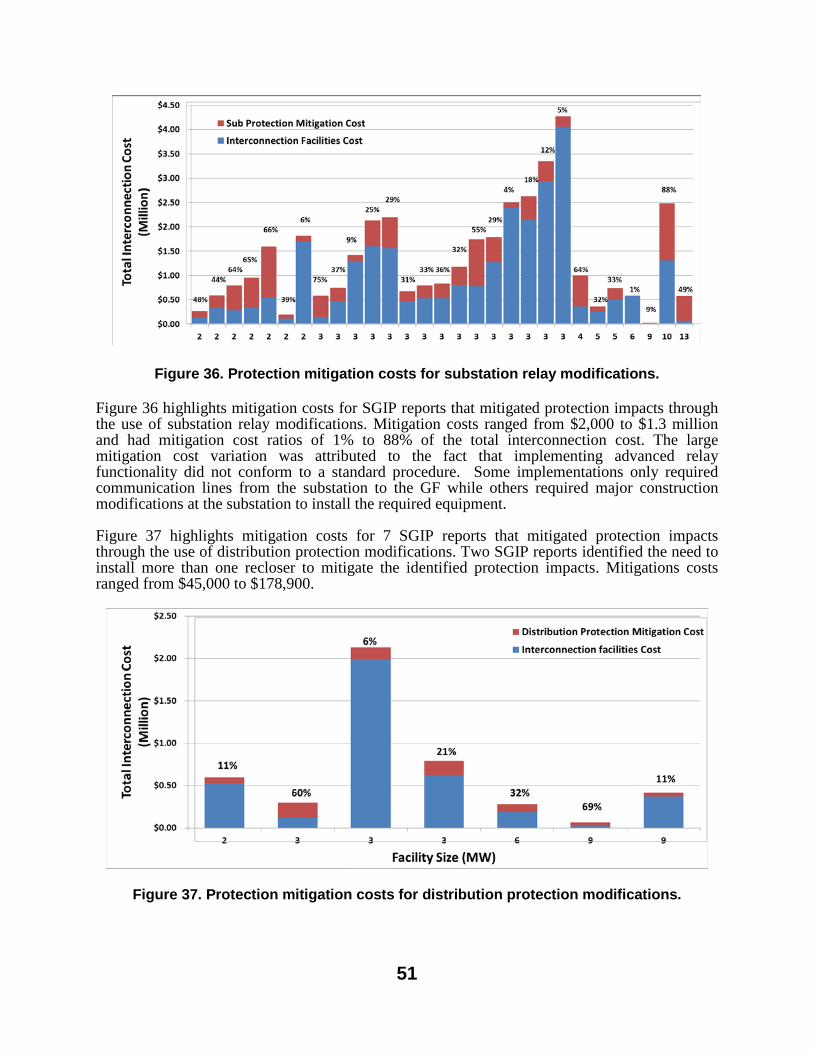
51
Figure 36. Protection mitigation costs for substation relay modifications. Figure 36 highlights mitigation costs for SGIP reports that mitigated protection impacts through the use of substation relay modifications. Mitigation costs ranged from $2,000 to $1.3 million and had mitigation cost ratios of 1% to 88% of the total interconnection cost. The large mitigation cost variation was attributed to the fact that implementing advanced relay functionality did not conform to a standard procedure. Some implementations only required communication lines from the substation to the GF while others required major construction modifications at the substation to install the required equipment. Figure 37 highlights mitigation costs for 7 SGIP reports that mitigated protection impacts through the use of distribution protection modifications. Two SGIP reports identified the need to install more than one recloser to mitigate the identified protection impacts. Mitigations costs ranged from $45,000 to $178,900.
Figure 37. Protection mitigation costs for distribution protection modifications.

52

53
9. CONCLUSIONS SNL analyzed a total of 100 SGIP interconnection reports performed by three utilities and one regional transmission operator (RTO). The analysis identified three interconnection topologies used to interconnect GFs to the local EPS. It was observed that the interconnection topologies were strongly correlated to the incidence of adverse impacts. Generally, adverse system impacts were more probable if the GF interconnected through an existing distribution circuit. Adverse system impacts were found in 68% of GFs interconnecting through existing distribution circuits. Adverse system impacts were less probable if the GF required the construction of a new distribution circuit. Adverse system impacts were found in only 14% of GF interconnecting through newly constructed distribution circuits. Building new distribution circuits to interconnect GFs essentially limits the amount of existing equipment outside of the substation exposed to possible adverse system impacts. Overvoltage impacts were overall the easiest and least expensive to mitigate, with almost half requiring no added cost. Mitigation costs for overvoltage impacts ranged from 0% to 24% of total interconnection costs. Voltage deviation impact mitigations were much more difficult and costly. Mitigation costs for voltage deviation ranged from 19% to 70% of total interconnection costs. Thermal overload impacts were also expensive to mitigate. Mitigation costs for thermal impacts ranged from 4% to 72% of total interconnection costs. Protection impacts were the most likely adverse system impact identified. The majority of protection impacts were associated with transfer trip requirements to protect against GF islanding. Mitigation cost for protection impacts associated with advanced relay functions ranged from $74,600 to $1,300,000. Mitigation costs for protection ranged from 9% to 69% of total interconnection costs. The wide cost variation for advanced relay protection schemes was correlated to the variation in equipment needed to implement the advanced functionality from study to study. 50% of SGIP studies identified total connection costs of less than $689,431 and 50% of SGIP studies identified total connection costs of less than $132,750 per MW. As this report showed with a sample set of 100 cases, 44% of the requests that went into the study process identified no negative impacts. SNL is conducting research to identify more efficient screening methods to avoid this high rate of false positives requiring time consuming studies to be performed that identify no adverse impacts.

54

55
REFERENCES Arizona Public Service Company (APS) Pro Form Open Access Transmission Tariff (OATT).
http://www.oasis.oati.com/AZPS/AZPSdocs/APS_OATT_11012013.pdf PJM Open Access Transmission Tariff (OATT) - Order No. 714, Effective:10/28/2013.
Docket#:ER12-1784-000. http://www.pjm.com/~/media/documents/agreements/tariff.ashx Public Service Company of New Mexico (PNM) Open Access Transmission Tariff (OATT)
Effective:1/8/2013.http://www.oasis.oati.com/PNM/PNMdocs/1-8-13_PNM_Conformed_OATT_Attach_R_and_TX_Rate_Settlement_ER11-1915.pdf
PacifiCorp Pro Forum Open Access Transmission Tariff (OATT). Effective: 4/13/2007. http://www.pacificorp.com/content/dam/pacific_power/doc/About_Us/Rates_Regulation/Tr
ansmission_Services/Generation_Interconnection_Applications/Approved_Open_Access_Transmission_Tariff.pdf
Small Generation Interconnection Procedure (SGIP). Federal Energy Regulatory Commission
(FERC). Order No. 2006-B. Published: 9/13/2006. http://www.ferc.gov/industries/electric/indus-act/gi/small-gen.asp#skipnav W.H. Kersting, Distribution System Modeling and Analysis, Third Ed. Boca Raton, FL: CCRC
Press, 2012

56

57
APPENDIX A: OVERVIEW OF INTERCONNECTION TERMS
The basic one line diagram of a typical Small Generator Interconnection is shown in Figure 38. The figure gives a general overview of the interconnection circuit and identifies sub circuit locations referred to in this report.
Figure 38. Overview of interconnection to EPS. Generating Facility (GF) The GF refers to the interconnection customer’s electrical generator (PV), inverters, protective equipment and all equipment owned, maintained and operated by the IC. Generally, this would include all equipment on the customer side of the point of common coupling. Low Voltage Distribution Circuit Low voltage distribution circuit refers to the electrical provider’s facilities and equipment used to transmit electricity from the substation to customer usage points. This would include utility owned facilities such as: conductors, transformers, protection equipment and power factor correction equipment. Nominal system voltages for facilities in this category ranged from 12.47 kV to 34.5 kV. This term was used to generally refer to three phase feeders and associated laterals between the customer and substation. Point of Common Coupling (PCC) The PCC refers to the point where the GF is electrically and physically connected to the local EPS. Generally, this point is demarcated by a meter and/or a disconnect switch owned and operated by the local utility. This term is also synonymous with the term Point of Interconnection. Substation Substations generally have switching, protection and control equipment, and transformers that transform voltage from high voltage transmission lines to low voltage distribution lines. High Voltage Distribution Circuit

58
This refers to the electrical providers facilities interconnecting through the high side bus of the substation. For the purposes of this report this term was used to reference conductors operating at 69 kV.

59
APPENDIX B: DATABASE STRUCTURE AND FIELD NAMES Database Structure The database consists of four worksheets, each of which is populated with SGIP reports from one of the previously identified EPS providers. Records are tabulated horizontally with each record representing an itemized SGIP report. Switching between the different utility tables is accomplished by selecting the desired utility worksheet tab at the bottom of the table. Within each worksheet are four major field categories: Facility & Feeder Information, Adverse System Impacts & Mitigation, Binned Costs, and Itemized Interconnection Costs. Within each field category are subfields which correspond to information relating to its parent field category. Field categories occupy row 2 and Subfields occupy row 3 of each worksheet.
Figure 39. Worksheet field category identification.
Facility & Feeder Information The Facilities & Feeder Information field category and its corresponding subfields are shown in Figure 39. The Facilities & Feeder Information field contains 11 subfields, which occupy columns A through K of the worksheet. Information about the GF and the interconnecting EPS are found within the Facilities & Feeder Information fields. This includes facility size, interconnection voltage, point of common coupling (PCC) location, interconnecting substation and interconnection topology. The Interconnection Topology section provides a full description of the types of interconnection topologies found in the studies. Fields left blank within this category indicated that the SGIP report did not provide that specific information. Under column A of the Facilities & Feeder Information category is the Study ID subfield which identifies the specific study with a hyperlink to the SGIP report. A more detailed description of the specific subfields within the Facilities & Feeder Information field is found in Appendix B.

60
Adverse System Impacts & Mitigation The Adverse System Impact & Mitigation field and its corresponding subfields are shown in Figure 40. The Adverse System Impact & Mitigation field contains 10 subfields, which occupy columns L through U of the Excel file. Information about the identified impacts, mitigation and mitigation costs are found within the Adverse Impact & Mitigation Field. The Impacts Identified subfield (Column L) list all adverse system impact identified in the SGIP report. There are six impact classifications: Voltage Deviation, Thermal Overload (Thermal OL), Overvoltage, Contingency, Distribution Fault protection and Substation Protection. A full discussion of each impact classification is found within the Impact Classification Section. Each impact classification has its own impact mitigation subfield (columns N through U). If an impact is listed in the Impact Identified subfield, its corresponding mitigation and mitigation cost can be found under the specific impact mitigation subfield. If multiple mitigations were required then each new mitigation was separated by a new line and began with a bullet symbol. For example, the SGIP report Highlighted in Figure 40 indicated that an overvoltage and thermal overload were identified (column L). A conductor upgrade was required to mitigate the thermal overload and the estimated cost to perform the mitigation was $49,328 (column P). The overvoltage impact required the removal of a voltage regulator, the installation of a new capacitor bank and power factor correction at the GFs inverter (column R). The total cost for overvoltage mitigation was estimated at $50,081.
Figure 40. Adverse system impact & mitigation identification. Three Binned Cost Categories The following section describes costs identified in the SGIP reports, binned into three categories; Interconnection Facilities cost, Mitigation Cost, and Total Connection Cost. Interconnection Facilities Costs – Costs for facilities necessary to interconnect the GF to the EPS. This very broad cost category included any cost incurred to physically and electrically interconnect the GF to the EPS. Costs associated with mitigating identified impacts were not included in this cost category. Mitigation Costs – Costs associated with mitigating any adverse system impacts identified in the SGIP reports. Fields left blank in this cost category indicate that no adverse impacts were

61
identified in the SGIP study. Fields listed with zero cost indicate that adverse impacts were found, but no mitigation cost was incurred. Generally, fields with zero mitigation costs represent SGIP reports that mitigated the impact through the use of advanced inverter functions. Fields with the symbol $UNK indicate that adverse impacts were identified in the SGIP report, but no clear cost was associated with that specific mitigation. Total Connection Cost - Cost incurred to interconnect the GF to the EPS. Total Connection Costs represent the aggregate cost of both Mitigation Cost and Interconnection Facilities Costs. Fields with the symbol $UNK indicate that Total Connection Costs were not defined in the SGIP report.
Figure 41. Binned costs and itemized interconnection costs fields.
Itemized Interconnection Costs The Itemized Interconnection Cost field contains 14 subfields which occupy columns Y through Al of the worksheet. This section lists itemize costs as identified in the SGIP report. Itemized costs found in this section were derived from the most recent SGIP report performed on the GF. Figure 41 shows an example of the costs section in the database.
62
Database Field Names Facility & Feeder Information (Columns A- K) Study ID (Column A) This field contains the project name or queued identification number for the SGIP report. In either case the information found in this field can be used to identify the specific study with the utilities online queue, Further more each study ID name is hyperlinked to its corresponding SGIP report Date (Column B) This field contains the date (in month/day/year format) that the SGIP report was submitted to the interconnecting customer. Facility Size (Column D) This field contains the aggregate nameplate generation capacity of the proposed generation facility under study. Inverter Model (Column F) This field contains the make and model of the proposed inverters at the generation facility. Not all studies provided this information in the SGIP report; any blank spaces in this field indicate that inverter information was not provided in the report. Interconnection Voltage Level (Column G) This field identifies the nominal operational voltage of the EPS at the proposed PCC. Interconnection voltages found in the database ranged from 12 kV to 69 kV. PCC Distance from Substation (Column H) This field identifies the distance (in feet) from the substation to the PCC. Information found in this field indicates that the SGIP report clearly identified a PCC distance from the substation. Feeder Name (Column I) This field contains the name of the feeder at which the PCC is located. Blank cells indicate that the feeder name was not identified in the report. Generally, blank cells correspond to interconnections that required the construction of new distribution feeders. Substation (Column J) This field identifies the name of the substation at which the PCC is located. Blank cells indicate that the substation was not identified in the report. Interconnection Type (Column K) This field identifies the interconnection topology for the proposed generation facility. The four interconnection topologies found in this field are: Tap Existing Low Voltage Distribution Circuit, Build New Distribution Circuit from Substation, Double Feeder Service and Tap Existing High Voltage Distribution Circuit. A full description of each interconnection topology

63
is found in section 3 of this report. Blank cells in this field indicate that the interconnection topology was not identified in the SGIP report. Adverse System Impact & Mitigation (Columns L-U) Impacts Identified (Column L) This field list all adverse impacts associated with the interconnection of the generation facility. If multiple impacts were identified each new impact begins on a new line within the cell. The list of impact classifications found in this field include: ContingencyOV, ContingencyP, ContingencyTOL, No Adverse Impact, Overvoltage, Protection, Thermal OL, and Voltage Deviation. If an impact is listed in the Impact Identified subfield its corresponding mitigation and mitigation cost are found under the specific impact category subfield (columns N-U). If adverse impacts were identified while the EPS was in contingency configuration the Impact Identification subfield contains one or more of the following impact classifications: ContingencyOV, ContingencyP, ContingencyTOL. The classifications represent overvoltage, protection and thermal operational limit impacts respectively. Mitigation for all three contingency classifications is found under the contingency impact category subfield (column S). The impact classification No Adverse Impact indicates that the report did not identify adverse system impacts associated with the interconnection of the generation facility. Flow of Electricity from Distribution System Through Substation Transformer. (Column M) This field indicates if the SGIP report identified that the interconnection of the generation facility contributed to possible reverse power flow through the substation transformer. This field gives a brief description of the condition in which reverse power flow is possible. Blank fields indicate the reverse power flow was not identified in the SGIP report. Voltage Deviation (Column O) If voltage deviation impacts were identified in the GSIP report the corresponding mitigation and mitigation cost can be found under this subfield. If the impact required more than one mitigation each new mitigation is separated with a new line and begin with a bullet symbol. The aggregate cost associated with mitigation can be found at the bottom of the subfield (in red). If the symbol $UNK is found at the bottom of the subfield, this indicates that a mitigation cost was not identified in the SGIP report. Some reports had mitigation cost for voltage deviation impacts binned with mitigation costs for other impacts. In those cases, a reference to where the binned cost can be found in the Itemized Interconnection field can be found at the bottom of the subfield. For example, Figure 42 below indicates that the SGIP report identified a thermal OL and overvoltage impact. The report provided a binned cost for both mitigations which can be found under the System Upgrades subfield in the Itemized Interconnection Costs field.

64
Figure 42. Binned costs for multiple mitigations. Thermal OL (Column P) If a thermal overload impact was identified in the SGIP report the corresponding mitigation and mitigation cost can be found under this subfield. If multiple mitigations were identified for the impact each new impact is separated with a new line and began with a bullet symbol. Refer to the Voltage Deviation subfield section for SGIP reports that did not identify mitigation costs or for reports that binned multiple mitigation cost. Overvoltage (Coulmn R) If an overvoltage impact was identified in the SGIP report the corresponding mitigation and mitigation cost can be found under this subfield. If the impact required more than one mitigation, each new mitigation is separated with a new line and begins with a bullet symbol. Refer to the Voltage Deviation subfield section for SGIP reports that did not identify mitigation costs or for reports that binned multiple mitigation cost. Contingency (Column S) If an adverse system impact occurred while the EPS was in contingency operation the impact classification, mitigation and mitigation cost can be found in this subfield. Each new impact classification begins with a bullet symbol and a description of the mitigation follows just below it. The aggregate cost associated with mitigation can be found at the bottom of the subfield (in red). If the symbol $UNK is found at the bottom of the subfield, this indicates that a mitigation cost was not identified in the SGIP report. Impacts occurring while in contingency are identified in the Impacts Identified subfield with one of the following classifications: ContingencyOV, ContingencyP, ContingencyTOL. Distribution Fault Protection (Column T) If the SGIP report identified protection impacts and mitigation for the impact was accomplished through the use of reclosers on the distribution circuit a description of the mitigation and mitigation cost can be found in this subfield. If more than one recloser modification was required the number of reclosers was bound by brackets in the mitigation description. The aggregate cost associated with mitigation can be found at the bottom of the subfield (in red). Substation Protection (Column U) If the SGIP report identified protection impacts and mitigation for the impact was accomplished through the use of equipment modifications at the substation a description of the mitigation and mitigation cost can be found in this subfield. Example of equipment include: new relays, relay modifications or advanced relay functions.

65
Binned Costs (Columns V-X) Total Connection Costs (Column V) The total cost associated with interconnection the generation facility to the EPS is found within this subfield. The cost reflected in this subfield is the aggregate cost of quantities found in the Mitigation Cost and Interconnection Facilities Cost subfields. If the SGIP report did not identify cost associated with the interconnection of the generation facility, the symbol $UNK was placed in this subfield. Mitigation Cost (Column W) The total cost associated with mitigating all adverse system impacts is found within this subfield. If the SGIP report did not provide costs for mitigating the adverse impact , the symbol $UNK was placed in this subfield. Interconnection Facilities Costs (Column X) This is a very broad cost category and would include any cost incurred to physically and electrically interconnect the GF to the EPS. Itemized Interconnection Costs (Columns Y-AL) The Itemized Interconnection Costs field list cost as identified in the SGIP report.

66

67

68
APPENDIX C: DEFINITIONS
Adverse System Impacts – A negative effect, due to the interconnection of the generating facility, which compromises the performance, reliability or safety of the existing Electrical Power System (EPS). Contingency –An event (planned or unplanned) that creates an outage of an electrical power system component such as a transmission or distribution line, generator, transformer or conductor. Deadline Checking –A protection scheme that blocks the automatic reclosing of protection equipment (relays, reclosers) until the lines are de-energized. This scheme ensures that faults have adequate time to clear and protection against damaging equipment. Electric Power System (EPS) – The connected system or power apparatus used to deliver electric power from the source to the utilization device. EPS Provider – Refers to the governing entity that performed or commission the SGIP report. This is a general term and is used to reference one or all of the data sources (APS, PNM, PacifiCorp, PJM) used to compile the database Generating Facility (GF) - All equipment owned, maintained and operated by the Interconnection Customer including electrical generators, inverters, protective equipment, etc. High Voltage Distribution Circuit – refers to the infrastructure interconnecting to the high side bus of the distribution substation. Nominal system voltages in this category were at the 69 kV and below. This circuit class defines a specific interconnection topology. Interconnection Customer (IC) – An entity interconnected or proposing to interconnect its Generating Facility for parallel operation with the local EPS. Interconnection Facilities Cost – are the facilities necessary to make a direct electrical connection from the GF to the EPS. This does not include equipment required to mitigate adverse system impacts. Interconnection Voltage – The nominal system voltage of the EPS at which the PCC is located. Interconnection voltages identified in this reports range from 12.47 kV to 69 kV. Low Voltage Distribution Circuit – refers to the infrastructure interconnecting the customer to the substation low side bus. Typically nominal system voltages range from 12.47 kV to 34.5 kV. Generally distribution circuits are typically owned and maintained by the local utility. Distribution Circuit equipment typically includes: feeder breakers, conductors, poles, switches, transformers, voltage regulators, capacitors and protection equipment. Mitigation – Identifies costs associated with mitigating the adverse system impacts resulting from interconnecting the GF.

69
Point of Common Coupling (PCC) - The point where the Generating Facility is electrically connected to the EPS. The point of Common Coupling is synonymous with the Point of interconnection.
Total Connection Cost per MW – Represents the Total Connection Cost per nameplate capacity (MW) of the GF. Transfer trip – An anti-islanding protection scheme used to ensure that the GF is isolated from the EPS in case of feeder is shutdown.
70
DISTRIBUTION
1 Santiago Sena PNM Main Offices Albuquerque, N.M., 87158
1 MS1033 Jimmy E. Quiroz 6112 1 MS1033 Robert J. Broderick 6112 1 MS1033 Abraham Ellis 6122
1
MS0899
Technical Library
9536 (electronic copy)

71

72