analysis iv mapping testing mep coordination new york avenue thesis final report william d. cox page...
TRANSCRIPT

1099 New York Avenue Thesis Final Report
William D. Cox
Page 47
Analysis IV – Mapping & Testing MEP Coordination
Background Building green is not just achieved though the methods of construction or the manner in which a building “performs”, it is also a state of mind. The idea of sustainability follows the theory of Lean Thinking, a theory that is based upon the removal of waste from production and the creation of value. These methods were pioneered in Japan by Toyota after World War II. They can be simply defined as the combination of craft production in which skilled workers produce custom products and mass production which uses narrowly skilled workers to produced a standardized product. The result is an assembly of team members that possess a variety of skills working at all levels of an organization to produce large volumes in wide varieties. Lean thinking promotes five basic principles that are fundamental to the elimination of waste.
1. Specify what does and does not create value from the customer’s perspective and not from the perspective of the individual firms, functions and departments.
2. Identify all the steps necessary to design, order, and produce the products across the whole value stream to highlight non‐value adding waste.
3. Make those actions that create value flow without interruption, detours, backflow, waiting or scrap.
4. Only make what is pulled by the customer. 5. Strive for perfection by continually removing successive layers of waste as
they are uncovered.
The first step in the movement towards Lean Thinking involves understanding waste. The systematic attack of waste is an attack on the factors that underlie poor quality in production and managerial problems. The second step is establishing direction. Many lean initiatives are abandoned due to the lack of foresight. The next step is to understand the big picture of the process, all of its information and physical flows. Beyond this, each individual process is mapped, customers and suppliers become involved, and then the overall plan is checked against the intentions that were originally sought. Although originally intended for the automotive industry, Lean Thinking can be applied to any manufacturing process, including those in construction. The primary focus of this analysis will be to identify the waste in the MEP Coordination process, determine what direction can be developed to remediate the waste, and assess the courses of action to be taken.

1099 New York Avenue Thesis Final Report
William D. Cox
Page 48
Problem During core construction of the building it was discovered that although the MEP systems had been coordinated on the drawings, there was still difficulty with fitting all the components into the physical space. A redesign of the plenum space in the field was required to ensure that each system fit. The same problem had been noticed in the lobby area as well. With the installation of the stone flooring and the ceiling system above, the available usable space was decreasing. This causes great concern because Tishman Speyer utilizes the lobby as one of the primary selling points for the building. Delays in construction result in potential client loss.
Objective The objective of this analysis will be to map the 2D & 3D MEP Coordination process while analyzing Building Information Modeling (BIM) as a tool for efficiency. This will be done to determine the extent of the waste that can be removed from the process and the amount of productivity that can be added. Once a map of this operation has been developed, it will be tested using a 3D model of the MEP systems scheduled to be installed in the lobby. Each component will be constructed as it appears on the contract documents.
Analysis Part I
Understanding Waste Waste can be defined as an activity that does not add value to a product or a service; the Japanese refer to it as “muda”. In the Toyota Production System, seven different types of waste were identified. They are as followed:
1. Overproduction – producing too much or too soon, resulting in poor flow of information 2. Defects – frequent errors in paperwork, product quality problems, or poor delivery problems 3. Unnecessary Inventory – excessive storage and delay of information resulting in excessive
cost and poor service 4. Inappropriate Processing – going about work processes using the wrong set of tools 5. Excessive Transportation – excessive movement of people, information or goods 6. Waiting – long periods of inactivity for people, information or products 7. Unnecessary Motion – poor workplace organization

1099 New York Avenue Thesis Final Report
William D. Cox
Page 49
The Lean Enterprise Research Center (LERC) at Cardiff Business School in England claims that when one thinks about waste, it is useful to define the three types of activities within an organization.
1. Value Adding Activity – an activity that, in the eyes of the customer, make a product or a service more valuable
2. Non‐Value Adding Activity – an activity that, in the eyes of the customer, do not make a product or a service more valuable and are not necessary even under present circumstances
3. Necessary Non‐Value Adding Activity – an activity that, in the eyes of the customer, do not make a product or a service more valuable but are necessary unless the existing supply process is radically changed
Through research, the LERC indentified the average ratio of activities to the total stream line in the informational flow environment, such as in the construction industry, as 1% value adding, 49% non‐value adding, and 50% necessary but non‐value adding. The Dynamic System Model Creating a model of a process can help one visualize a process and determine if the output is sufficient. If not, one can determine where the waste is developing and decide how to remediate the situation and optimize the overall performance. The dynamic system model was a theory developed by Milton Alexander in the 1970’2 as a simple method of mapping a dynamic system for a single process operation. The model consists of inputs for a processor to form outputs. Overseeing the process is a controller who regulates the flow of resources and inputs to the system. The inputs are defined as the elements of a given system that are consumed or transformed during the process. Some inputs may be completely consumed or partially consumed and returned to input though maintenance. Outputs are the creation of the process, which is the method used to convert the input resources. The dynamic system model can be seen in Figure 4.1 below. Ideas, thoughts or concepts do not function as inputs or outputs. They are merely feedback from which the controller uses to monitor the process. The controller not only regulates the flow of inputs, but determines how the process will meet its objectives and which rules it is to follow. The performance of the process relies ultimately on the controller’s design and decision making; the controller is therefore the primary function that makes the model work. As it is in any process, the objective of Alexander’s model is to maximize output while minimizing input and eliminating waste.

1099 New York Avenue Thesis Final Report
William D. Cox
Page 50
Figure 4.1 Shows the framework for Alexander’s dynamic system model
Alexander’s model is not designed for mapping an entire production like a construction project. The intent of creating such a model is strictly for detailing an individual component of a process, such as MEP Coordination, in order to gauge where productivity may be falling short. The 2D Design Coordination Process The traditional design coordination process begins after the preliminary design of the building systems are complete. As seen in Figure 4.2 below, this occurs when roughly 60% of the design is complete. At this point the level of detail on the drawings is no more than the location and sizing of mechanical ductwork and piping. The electrical and fire protection systems have yet to be identified considering their installations tend to be more flexible. Coordination, of course, continues well through the design phase and into the construction phase.
Figure 4.2 Maps the components of the traditional design cycle for a project.
Program Schematic Design
Design Development
MEP Coordination
Construction Documents
(10‐15%) (25‐60%) (100%)

1099 New York Avenue Thesis Final Report
William D. Cox
Page 51
At the coordination meetings, various trades bring together their individual shop drawings, which have been developed from the contract documents and lay them on top of each other over a light table. Each trade then compares their individual design against the constraints that other building systems such as building structure, fire walls, equipment location, architectural features, and plenum space may present. Many of the early collisions are imposed by the specialty contractors when they take it upon themselves to optimize their respective systems by shortening branches, altering fittings, designing for efficient installation, etc. Once all the problems have been identified, the developed solutions are marked on the drawings. This process continues until coordination is complete, and all trades have signed each drawing to show their acceptance. The map of this process is illustrated in Figure 4.3 below.
Figure 4.3 Displays the process map for 2D Design Coordination
This process can be classified as a non‐value adding but necessary activity. It is very time‐consuming, inefficient and often times leads to a less than desirable performance as many conflicts are still encountered and must be resolved in the field. Still, it is an integral part of combining different areas of the construction process. The majority of the waste from this process is found in the rework/maintenance loop between the inputs and the actual coordination process as seen in Figure 4.4 below. The waste is developed from the

1099 New York Avenue Thesis Final Report
William D. Cox
Page 52
inadequacies that characterize two dimensional drawings. Schematics and designs are revised several times because so many collisions are unnoticed. Even designs that are approved by all trades can result in poor performance when conflicts go undetected until they are assembled in the field. Construction is a four dimensional process and can often times be difficult to portray or let alone understand when time and a spatial location are not accurately identified in the design. A building is not assembled with its components laid one on top of the other similar to the 2D coordination process, it is assembled to create a space in between and the most efficient way to construct that space is to visualize it in extreme detail prior to production.
Figure 4.4 Diagrams the waste production cycle from the 2D Design Coordination Process
The 3D Design Coordination Process The 3D Coordination Process functions similarly to the 2D Process. There is a difference, however, in the resources utilized. The construction manager still plays the same roll and coordination meetings are still held regularly, yet they are fewer and less frequent. Specialty contractors bring electronic models of their designs instead of paper shop drawings, and they are compared through a collision detection program as opposed to a light table. The intent of these tools is to improve the efficiency of the process by eliminating the rework loop associated with the traditional system. Sheryl Staub‐French of the University of British Columbia and Atul Khanzode of Stanford University described the optimal process based on challenges the encountered while studying the Camino Medical Group Project from January 2005 through April 2007.

1099 New York Avenue Thesis Final Report
William D. Cox
Page 53
1. Identify Potential Uses of the 3D Model 2. Identify the Modeling Requirements 3. Establish the Drawing Protocol 4. Establish a Conflict Resolution Process 5. Develop a Protocol for Addressing Design Questions 6. Develop Discipline‐specific 3D Models 7. Integrate Discipline‐specific 3D Models 8. Identify Conflicts between Components/Systems 9. Develop Solutions for the Conlficts Identified 10. Document Conflicts and Solutions
With improving technology, modeling programs that can optimize the development, routing, and connection of systems are continuously being developed to further aide in the planning, design, and inspection of the system components prior to construction. Utilizing this technology is part of what is known as Building Information Modeling. The CIC Research Group at the Pennsylvania State University defines as the process of designing, analyzing, integrating, and documenting a building’s lifecycle by developing a virtual prototype of the building which includes a central database of information. Barton Malow Company currently practices the 3D design coordination process out of their corporate headquarters in Michigan for healthcare facilities and industrial manufacturing projects. The process begins with a template model being created by the building’s MEP engineering team. That template is then passed on to the respective trade to be further developed for fabrication. Coordination meetings begin as soon as primary duct and pipe arteries have been located and sized. The result is a fabrication level model. The process continues in the same manner until a conflict free design has been developed and approved. Having the ability to visualize the building and its integral systems in a third dimension significantly enhances the coordination process. One of the major advantages is being able to make modifications and corrections to the model on site as opposed to over a week’s time on paper. Barton Malow reports that an average of 90% of the errors are identified and solved right away. As a result, there are fewer Requests for Information (RFI’s), less than 1% of the change orders on the project are design related, the schedule can be reduced by 30%, and cost savings can approach 20% (if all of the building is modeled). The ideal 3D design process can be seen incorporated with Staub‐French and Khanzode’s process in Figures 4.5a & 4.5b below.

1099 New York Avenue Thesis Final Report
William D. Cox
Page 54
Figure 4.5a Shows the dynamic system model for the 3D design coordination incorporated with Staub‐French and Khanzode’s process. Note that the waste loop has been considered negligible.
Figure 4.5b Shows the details the 3D design coordination incorporated with Staub‐French and Khanzode’s process.

1099 New York Avenue Thesis Final Report
William D. Cox
Page 55
Analysis Part II In order to test the effectiveness of the 3D Design Process, a model of the main lobby was constructed using Autodesk’s Revit Desktop. Included were the mechanical, plumbing, electrical, and fire protection systems. The model was developed from the initial set of the Design Development drawings.
Step 1
• The architectural and structural components were loaded into Revit in order to create the lobby and plenum spaces. The ceiling is a 1 1/2” suspended painted drywall system. The finished floor to ceiling height is 14’ – 7 ½” and the finished floor to the bottom of the slab is 16’ – 6”, thus creating a 1’ ‐ 9” plenum space.
Figure 4.6 Model of the architectural features in the lobby
Figure 4.7 Section of the typical plenum space in the main lobby.
8” Concrete Slab
Suspended Ceiling Ties
¾” Plywood Backing
5/8” Painted Gypsum
1099 New York Avenue Thesis Final Report
William D. Cox
Page 56
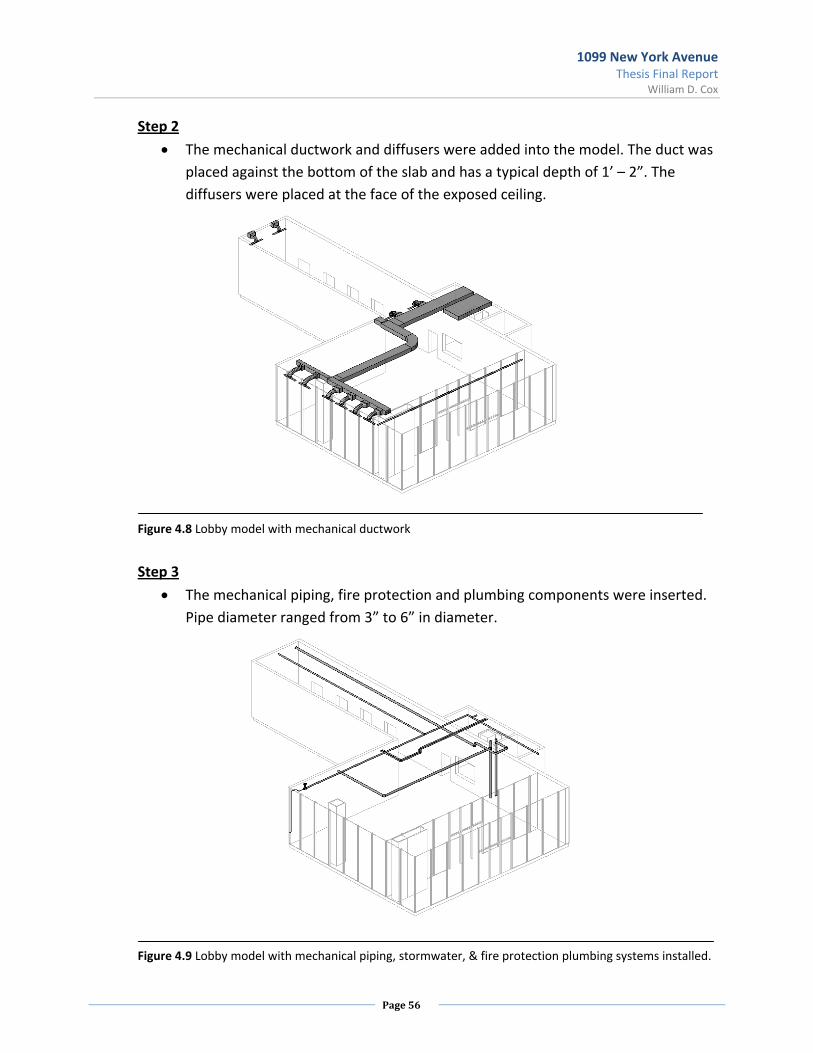
Step 2
• The mechanical ductwork and diffusers were added into the model. The duct was placed against the bottom of the slab and has a typical depth of 1’ – 2”. The diffusers were placed at the face of the exposed ceiling.
Figure 4.8 Lobby model with mechanical ductwork
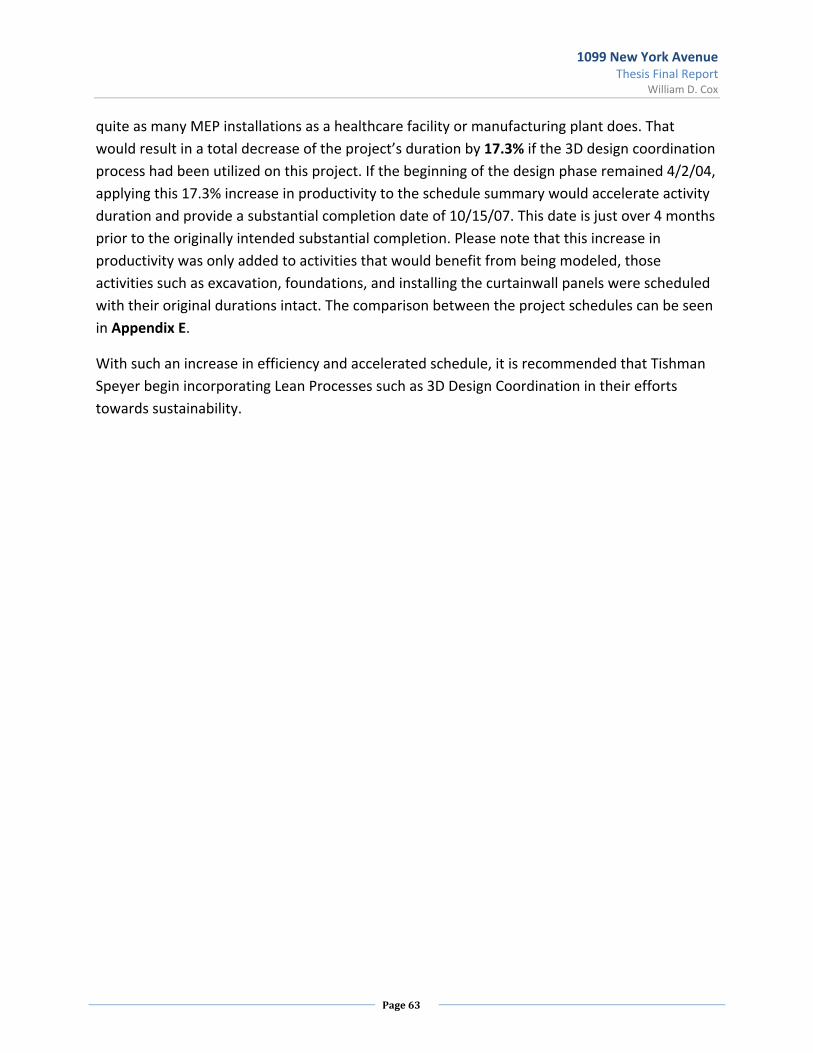
Step 3
• The mechanical piping, fire protection and plumbing components were inserted. Pipe diameter ranged from 3” to 6” in diameter.
Figure 4.9 Lobby model with mechanical piping, stormwater, & fire protection plumbing systems installed.

1099 New York Avenue Thesis Final Report
William D. Cox
Page 57
Step 4
• The proposed light fixtures were inserted. Electrical conduit was excluded because it had not been sized or located at this point in the design.
Figure 4.10 Lobby model with light fixtures
Step 5
• The model containing all building systems was uploaded into Navisworks Jetstream, a collision detection software program, and analyzed for inconsistencies.
Figure 4.11 Caption of the lobby model as loaded into Navisworks Jetstream

1099 New York Avenue Thesis Final Report
William D. Cox
Page 58
• After running a collision test between the mechanical ductwork and plumbing systems, there was only conflict to be found. The fire protection pipe intersected with a duct line just above the space outside of the security office as highlighted below.
Figure 4.12 Caption of the intersection between the fire protection piping and the mechanical ductwork as determined through collision testing
Why was there a collision? The area in question is highlighted in Figure 4.13 below. As mentioned before the available plenum space is 1’ – 9”. According to the design development drawings, a 14” deep duct, a 3” condenser water pipe, and a 4” cold water pipe are to pass through this area along with the 6” fire protection pipe segment. This is a total of 2’ – 3” of material that needs to pass through a 1’ – 9” section. The fire protection pipe must also be run under a 6” stormwater pipe in the middle of the lobby. A clash like this could be missed in the coordination process and not discovered until after fabrication since it requires visualizing the system in a third dimension. At this stage of the design no elevation for system components is given on the drawings, so it must be determined by each of the individual trades. When the drawings are laid over top of each other, it appears as if there may be plenty of space, but if a section were to be drawn, the problem would be discovered. The amount of time it would take to develop a section for every area of the building would be quite inefficient considering that you would be drawing each component of the building two or three times. Constructing a model allows you to develop a plan and section simultaneously so the entire space can be seen.

1099 New York Avenue Thesis Final Report
William D. Cox
Page 59
Figure 4.13 The area outside of the security office requires 2’ – 7” of material to pass through 1’ – 9” of space.
How is the conflict resolved? The situation can be remediated by one of two methods.
1. The pipe or the ductwork can be resized to allow all materials to pass through 2. Change the location/elevation of the pipe or ductwork.
To spare the intensive calculations required to resize the pipe and ductwork, it was determined that relocating some of the elements would be a leaner approach. The 3” condenser water pipes were relocated to run between the two segments of ductwork and a series of 90˚ elbows was inserted into the 6” fire protection stretch so that it may pass the 6” stormwater pipe, the 1’ – 2” deep ductwork, and the 4” cold water pipe collision free. The reconfiguration can be seen in Figure 4.14 below.

1099 New York Avenue Thesis Final Report
William D. Cox
Page 60
Figure 4.14 The suggested rerouting of the 6” fire protection pipe to accommodate the available plenum space.
In the 2D design coordination process, a correction such as this would require both the fire protection and mechanical contractor to leave the coordination meeting with unapproved drawings, reconcile the design flaw, issue another set of shop drawings and return to the following meeting to further investigate if the conflict has actually been resolved. The 3D design coordination process allows for the problem areas to be evaluated and solutions formed instantaneously. By following the process model, this collision specifically was remedied in a matter of minutes by a reconfiguration within the virtual model. Commentary on the 3D Design Process
• Developing a three dimensional model from primitive construction documents is no simple task. Many of the dimensions and details required to make an accurate model are unavailable or difficult to translate. This becomes increasingly difficult when multiple trades are creating multiple models that need to be merged. The model created for this analysis was simple enough to create in one file.
• Revit MEP is too “user friendly”. Many of the components that can be inserted into a model are standardized and can be difficult to customize. Routing pipe can also be a challenge as the majority of the connections and fittings are automated.
• Navisworks Jetstream’s detection of collisions tends to be very elementary. The conflicts are not identified very well and can be difficult to locate in the model.

1099 New York Avenue Thesis Final Report
William D. Cox
Page 61
• It is important to develop a hierarchy for the order in which the different systems are to be installed and what precedence they take in location prior to the coordination meetings.
• Developing solutions should be a team effort. The coordinator should be able to accept suggestions just as well as he or she makes them. The suggestion of adding the elbows to the segment of fire protection piping may prove to be sufficient for the other systems but could be a more difficult installation for that contractor.
• Currently it appears as if the 3D design coordination process is more beneficial for a Design‐Build delivery as opposed to Design‐Bid‐Build. It is beneficial to have the designers of the systems develop the models and pass them to the specialty contractors instead of relying on the trades to interpret the drawings themselves. To be more effective in the Design‐Bid‐Build method, the construction manager and major trades such as mechanical, electrical and plumbing onto the project during the design process.
Conclusion & Recommendations
The 3D Design Coordination has its flaws just as any other process may tend to have. With BIM still being established as a new technology, there is learning curve that has left many of the specialty contractors reluctant to change. The 3D process requires teamwork on all levels and cannot be performed efficiently if there is not equal involvement from all parties.
The process also requires a large initial investment in technology. Modeling and reviewing software, such as Revit Desktop and Navisworks Jetstream, as well as computers capable of supporting these programs are expensive.
To analyze the potential savings that utilizing BIM for MEP Coordination could provide, a series of five case studies on projects that used 3D Design Coordination were reviewed.
Project Description Estimated Increase in ProductivityA General Motors Manufacturing Facility 30% B The Camino Medical Group Project 25% C Harborview Medical Center 50% D Alcoa World Alumina Plant 20% E NLA Federal Building 19%
Average Productivity Increase 28.8% Table 4.1 Summary of productivity increases as observed through case studies.

1099 New York Avenue Thesis Final Report
William D. Cox
Page 62
The estimate of a 28.8% increase in productivity can be attributed to being able to identify most design conflicts prior to construction. This allows for fabrication to begin prior to the end of the coordination process, decreases the amount of rework in the field and provides a greater opportunity for pre‐fabrication. When phases of a project can be intertwined in this, there is a margin of time savings that develops in the schedule.
Figure 4.15 Models the savings in productivity as observed through the project case studies in Table 4.1
It should be noted that the majority of project case studies surveyed were based on either healthcare or manufacturing facilities which tend to be rather MEP intensive. 1099 New York Avenue is a core and shell office structure which means that the increase in productivity would be considerably less than what was projected in the figures shown above. As a conservative estimate, it shall be assumed that the increased productivity on core and shell projects shall be 60% of the value tabulated for the other programs. This percentage was chosen because a core and shell project does not require the construction of an entire building and would not involve
28.8% Savings
1099 New York Avenue Thesis Final Report
William D. Cox
Page 63
quite as many MEP installations as a healthcare facility or manufacturing plant does. That would result in a total decrease of the project’s duration by 17.3% if the 3D design coordination process had been utilized on this project. If the beginning of the design phase remained 4/2/04, applying this 17.3% increase in productivity to the schedule summary would accelerate activity duration and provide a substantial completion date of 10/15/07. This date is just over 4 months prior to the originally intended substantial completion. Please note that this increase in productivity was only added to activities that would benefit from being modeled, those activities such as excavation, foundations, and installing the curtainwall panels were scheduled with their original durations intact. The comparison between the project schedules can be seen in Appendix E.
With such an increase in efficiency and accelerated schedule, it is recommended that Tishman Speyer begin incorporating Lean Processes such as 3D Design Coordination in their efforts towards sustainability.