analysis and optimization of ozone assisted biological
TRANSCRIPT

Analysis and Optimization of Ozone Assisted Biological Filtration Systems Used
in Surface Water Treatment
A Thesis
Submitted to the Faculty of Graduate Studies and Research
in Partial Fulfillment of the Requirements
for the Degree of
Master of Applied Science
in Environmental Systems Engineering
University of Regina
by:
Enisa Zanacic
Regina, SK
March 2014
© 2014: Enisa Zanacic

UNIVERSITY OF REGINA
FACULTY OF GRADUATE STUDIES AND RESEARCH
SUPERVISORY AND EXAMINING COMMITTEE
Enisa Zanacic, candidate for the degree of Master of Applied Science in Environmental Systems Engineering, has presented a thesis titled, Analysis and optimization of Ozone Assisted Biological Filtration Systems Used in Surface Water Treatment, in an oral examination held on March 26, 2014. The following committee members have found the thesis acceptable in form and content, and that the candidate demonstrated satisfactory knowledge of the subject material. External Examiner: Dr. Kevin McCullum, Saskatchewan Ministry of Environment
Co-Supervisor: Dr. Dena McMartin, Environmental Systems Engineering
Co-Supervisor: Dr. John Stavrinides, Department of Biology
Committee Member: Dr. Yee-Chung Jin, Environmental Systems Engineering
Committee Member: Dr. Tsun Wai Kelvin Ng, Environmental Systems Engineering
Chair of Defense: Dr. Daryl Hepting, Department of Computer Science *Not present at defense

i
Abstract
Small and rural communities across Canada depend on potable water sources that
are collected in farm dugouts or small reservoirs. In Saskatchewan, the village of Osage
and Hamlet of Benson are two communities that depend on farm dugouts for their
drinking water supply. Within the last 10 years both communities implemented ozone-
assisted biological filtration for water treatment; however, both plants experienced low
treatment efficiency, as indicated by presence of disinfection by products and in
particular trihalomethanes at concentration that exceeds Saskatchewan Drinking water
standards of maximum acceptable concentration (MAC) of 100 µg/L as a running
annual average of seasonal samples.
Over a 14 months period water treatment plant performance at both communities
was monitored and analysed along with water quality. Water samples were collected
through the treatment train every two months and analysed for a large number of water
chemistry parameters. From water quality results ozone efficiency was assessed.
Microbiology of the water sources at both communities in fall and early spring was
analysed. Analysis of microbiology of biologically activated carbon filter media
collected in fall at Village of Osage was performed.
Water chemistry and performance at both plants indicates that raw water quality
is the major obstacle to the efficient plant performance. High alkalinity (bicarbonate,
carbonate and phenol) as well as salinity seem to inhibit / scavenge the ozone so that
oxidation of organic matter is not adequate. Fluctuations in the turbidity of the water
make the operation of the plant very challenging and filters requires frequent backwash.

ii
Microbiology of the dugouts suggests that salinity of the dugouts govern
microbiology of the dugouts as well. Even though both dugouts have bacterial
communities with identical phylum, the species richness of the each phylum is different
between the two dugouts. Microbiology of the filters showed decline of drinking water
pathogens through the filter except for two bacterial genera Legionella and
Campylobacter. Both genera are opportunistic pathogen with potential to cause
respiratory and gastro intestinal infections especially in immunocompromised (seniors,
children, ill) population. Most of the pathogens identified here if not all are susceptible
to disinfection, chlorination in particular. However, it is recommended that at peoples’
homes hot water tanks are keep the water temperature at or above 60 ºC and cold water
tanks are set at less than 20 ºC to minimize survival of Legionella in piping and faucets.
Potential improvement in design and layout of the filters is identified. Filters
should be configured so that the contaminant removal from the drinking water is
maximized. That can be achieved with installation of up-flow dual or multimedia
roughing filter to reduce turbidity and connecting filters in series in order to maximize
the contaminant removal from the drinking water.
The first step in improvement of efficiency for the water treatment plants
employing ozone assisted biological filtration is to outline and design a buffer zone
around dugout. Next step would be to optimize the ozone dose for DOC removal as well
as outfitting the plant filters design and layout to meet the degrading water quality of the
source that is being treated. Finally, disinfection of the water must not be neglected or
compromised in order to meet regulatory standard on disinfection by product.

iii
Acknowledgements
I would like to say thank you to:
Dr. John Stavrinides and Dr. Dena McMartin thank you for your kind assistance,
patience, support, encouragement and understanding that you have shown me long from
the time I was undergraduate student all the way now throughout the graduate time. Even
though, from time to time for me it felt like being on a roller-coaster, but you were
always there for me. There were no holidays, no weekends and no time away for you
from me. Thank you cannot express my gratitude for your support.
Thank you Dr. Andrei Volodin for your kind assistance with statistics.
Samuel (Sam) Ferris at Water Security Agency thank you for your support and
interest you have shown for this project. I know even though you are a Biologist by
training, deep down in your heart you are an Engineer as well.
Many thanks to you Dr. Phil Bailey and your staff at Provincial Disease
Laboratory, Ministry of Health for your kind support and smiling faces every time I
brought a “millions of bottles of water” to be analysed.
I would like to thank Silverhill Institute of Environmental Research and
Conservation for their kind financial support for this project.
Gail and Florence Frazs at Hamlet of Benson thank you for your assistance every
time I came to the plant. Also, Garry and Mike Glover at Village of Osage thank you as
well for your assistance and patience with me every time I came to the plant to “check
things out”.

iv
Dedication
This work is dedicated to my children Una and Ian Zanacic.
It’s not that I’m so smart; it’s just that I stay with problems longer.
– Albert Einstein

viii
Table of Content
Abstract ............................................................................................................................................ i
Acknowledgements ........................................................................................................................ iii
Dedication ...................................................................................................................................... iv
List of Tables .................................................................................................................................. x
List of Figures ............................................................................................................................... xii
List of Abbreviations ................................................................................................................... xvi
1. Introduction ............................................................................................................................. 1
1.1 Background ..................................................................................................................... 1
1.2 Organic Matter and Ozone in Water Treatment .............................................................. 2
1.3 Relevant Regulations ...................................................................................................... 4
1.4 Research Objectives ........................................................................................................ 6
2. Literature Revie....................................................................................................................... 7
2.1. Biologically Active Filters .............................................................................................. 7
2.2 Composition, stability and performance of pre-ozonation assisted biological filters for
surface water treatment ............................................................................................................... 8
2.3 Biofilms in biological filters ........................................................................................... 8
2.4 Composition .................................................................................................................... 9
2.5 Stability and functionality ............................................................................................. 13
3. Materials and Methods .......................................................................................................... 15
3.1 Water Sample Collection .................................................................................................... 15

ix
3.1.1 Village of Osage ........................................................................................................... 16
3.1.2 Hamlet of Benson ......................................................................................................... 18
3.2 Microbiological Sample Collection .................................................................................... 20
3.3 PCR analyses of bacterial communities .............................................................................. 21
4. Results and Discussion.......................................................................................................... 23
4.1. Village of Osage............................................................................................................ 23
4.2. Hamlet of Benson.......................................................................................................... 38
4.3. Osage vs. Benson .......................................................................................................... 56
4.4 Microbial Diversity - Village of Osage ............................................................................. 61
4.5 Microbiology - Hamlet of Benson .................................................................................... 75
4.6 Microbiology - Osage vs. Benson ..................................................................................... 78
5. Conclusions ........................................................................................................................... 89
6. Recommendations ................................................................................................................. 92
7. References ............................................................................................................................. 95
Appendix A ................................................................................................................................. 110
Appendix B ................................................................................................................................. 110
Appendix C ................................................................................................................................. 113
Appendix D ................................................................................................................................. 116
Appendix E ................................................................................................................................. 119

x
List of Tables
Table 1: PCR components and concentrations per reaction used for sequencing of the
samples ....................................................................................................................... 22
Table 2: Selected parameters for Osage raw water quality ......................................... 23
Table 3: Field measured dissolved oxygen (mg/L) through the treatment train ......... 27
Table 4: Field measured water temperature (ºC) through the treatment train ........... 28
Table 5: THMs concentrations at the WTP and distribution system over time (Osage)
....................................................................................................................... 32
Table 6: C:N:P ratio in sand filter effluent/BAC filter influent at Osage and BAC filter
DOC removal efficiency .................................................................................................. 37
Table 7: p-values for Spearman’s rank and Kendall’s rank correlation statistical
analysis of DOC vs. TN, DOC vs. TP, DOC vs. Ortho-P, TN vs. TP, and TN vs. Ortho-P
(OP), Osage ...................................................................................................................... 38
Table 8: Selected raw water quality parameters ......................................................... 39
Table 9: Field measure of dissolved oxygen (mg/L) through the filters ..................... 44
Table 10: Field measurement of water temperature change through the treatment train
.................................................................................................................... 45
Table 11: Changes in total alkalinity through the WTP and with time. Values for sand
and BAC filters are presented as the average of each filter set. ....................................... 45
Table 12: C: N: P ratio in sand filter effluent/ BAC filter influent at Osage and BAC
filter DOC removal efficiency, Benson. September and November DOC removal through
the BAC was due to the adsorption to activated carbon media. ...................................... 55
Table 13: p-values for Spearman’s rank and Kendall’s rank correlation statistical
analysis of DOC vs. TN, DOC vs. TP, DOC vs. Ortho-P, TN vs. TP, and TN vs. Ortho-P
(OP), Benson .................................................................................................................... 56
Table 14: Metagenomic analysis of environmental samples collected at Osage, (MG-
RAST, 2013). ................................................................................................................... 62
Table 15: Total coliforms and E-coli results from testing water samples at the
Provincial laboratory ........................................................................................................ 73

xi
Table 16: Metagenomic analysis of environmental samples collected at Benson,
(MG-RAST, 2013). .......................................................................................................... 75
Table 17: Total coliforms and E-coli results from testing water samples at the
Provincial laboratory, Benson .......................................................................................... 78

xii
List of Figures
Figure 1: Bacterial composition obtained from ozone pre-oxidized granular BAC filter
treating de-chlorinated tap water infused with bacteria and organic matter from the
Mississippi River and assimilable organic carbon from centrifuged raw sewage
supernatant (Norton and LeChavalier, 1999). .................................................................. 11
Figure 2: Bacterial community in treated water effluent produced after experimental
granular BAC treatment (Norton and LeChavalier, 1999)............................................... 12
Figure 3: Dugout that serves as raw water source for Osage (within red circle).
Proximity of agricultural fields is evident. ....................................................................... 17
Figure 4: Double dugout system highlighted in red circle in top left photograph, with
closer view provided in bottom right photograph. The creek feeding the two dugouts can
be seen flowing through agricultural fields from the north-east (Google, 2012)............. 19
Figure 5: Changes in total nitrogen and its components in the raw water for Osage 24
Figure 6: DOC and Chlorophyll A level changes in raw water at Osage .................. 25
Figure 7: Changes in BCOD and COD over time in raw water source ..................... 26
Figure 8: Change in total alkalinity in raw to treated water over time at Osage ....... 29
Figure 9: Changes in DOC (mg/L) removal through the treatment train, Osage ...... 30
Figure 10: DOC in raw and treated water; THMs collected at the Osage WTP ......... 31
Figure 11: Changes in nitrate concentrations through the treatment ........................... 33
Figure 12: Changes in ammonia concentrations through the treatment ...................... 34
Figure 13: Total nitrogen concentration change, percent removal (%) of nitrogen from
the raw and percent removal from the raw coming out of roughing filter is shown ........ 34
Figure 14: Changes in total phosphorous concentrations through the treatment train;
concentrations decreased for all months except July. ...................................................... 35
Figure 15: Changes in ortho-phosphorous concentrations through the treatment ....... 36
Figure 16: Changes in BCOD and COD with time in the Benson raw water source .. 40
Figure 17: Raw water samples collected over 2 month period during PDWA. Cloudy
and turbid water is due to the colloidal matter suspension from the dugout.................... 41
Figure 18: Changes in DOC and Chlorophyll A concentrations in raw water ............ 42
Figure 19: Changes in TN and its components in the raw water over time ................ 43

xiii
Figure 20: February 2012, Changes in Bicarbonate alkalinity through the treatment
train at Benson. Values for sand and BAC filters are presented as average of each filter
set. Carbonate and phenol alkalinity were not present in the water since pH of the raw
water was 7.9 ................................................................................................................ 46
Figure 21: April 2012, Changes in Bicarbonate alkalinity through the treatment train
at Benson. Values for sand and BAC filters are presented as average of each filter set.
Carbonate and phenol alkalinity were not present in the raw water since it was 8.1 ...... 46
Figure 22: July 2012, Changes in Bicarbonate, carbonate and phenol alkalinity
through the treatment train at Benson. Values for sand and BAC filters are presented as
average of each filter set. Carbonate and phenol alkalinity appear since the pH of the raw
was 8.7 .................................................................................................................... 47
Figure 23: September 2012, Changes in Bicarbonate, carbonate and phenol alkalinity
through the treatment train at Benson. Values for sand and BAC filters are presented as
average of each filter set. Raw water pH was 9.2 ............................................................ 47
Figure 24: November 2012, Changes in Bicarbonate, carbonate and phenol alkalinity
through the treatment train at Benson. Values for sand and BAC filters are presented as
average of each filter set. Raw water pH was 9.1 ............................................................ 48
Figure 25: Changes in DOC removal through the treatment before and after AC
replacement, Benson 2012 ............................................................................................... 49
Figure 26: Benson, DOC in raw water, treated water and THMs in treated water at the
plant .................................................................................................................... 50
Figure 27: Change in TN concentration through the treatment. Removal of TN in
September and November is mainly due to the AC adoption and not biological
degradation .................................................................................................................... 51
Figure 28: Nitrate concentrations and changes through the treatment ........................ 52
Figure 29: Ammonia fluctuations during the treatment. ............................................. 52
Figure 30: TP initial concentration and change in the water throughout the treatment
at Benson .................................................................................................................... 54
Figure 31: Ortho phosphorous concentrations and changes through the treatment .... 54
xiv
Figure 32: Raw water samples from Osage dugout collected on September 19, 2012
(G), and sample collected on March 18, 2013 (N) are sorted by phylum abundance (%)
and compared to each other ............................................................................................. 63
Figure 33: Configuration of BAC filter, showing core sample that was cored out of the
filter and split into 3 smaller samples- H, I and J ............................................................ 64
Figure 34: Raw water sample (sample) collected from Osage raw water source and
BAC samples collected from Osage BAC filter. Both types of samples were collected on
September 19, 2012. BAC media is extracted from BAC filter and media sample is
divided in 3 equally long samples and analysed as top 1/3 of the BAC filter (sample H),
second 1/3 of the BAC filter (sample I) and bottom of 1/3 of the BAC filter (sample J).
Samples are compared to each other based on microbial phylum abundance (%). ......... 67
Figure 35: BAC sample collected from Osage BAC filter collected on September 19,
2012. BAC media is extracted from BAC filter and media sample is divided in 3 equally
long samples and analysed as top 1/3 of the BAC filter (sample H), second 1/3 of the
BAC filter (sample I) and bottom of 1/3 of the BAC filter (sample J). Samples are
compared to each other based on microbial genera abundance (%) of microbes known as
potential pathogens of concern if found in drinking water. ............................................. 70
Figure 36: Raw water sample (sample) collected from Osage on September 19, 2012
(sample G) and on March 18, 2013 (sample N). Samples are compared to each other
based on microbial genera abundance (%) of microbes known as potential pathogens of
concern if found in drinking water. .................................................................................. 72
Figure 37: Raw water samples from water source for Benson collected on September
19, 2012 and on April 2, 2013. Samples are compared to each other based on microbial
phylum abundance (%). ................................................................................................... 76
Figure 38: Raw water sample (sample) collected from Benson on September 19, 2012
(sample K) and on April 2, 2013 (sample O). Samples are compared to each other based
on microbial genera abundance (%) of microbes known as potential pathogens of
concern if found in drinking water. .................................................................................. 77

xv
Figure 39: Comparison of microbial composition by abundance (%) of two samples
collected on September 19, 2012 from two different sources (Benson sample K and
Osage sample G) .............................................................................................................. 79
Figure 40: Comparison of microbial composition by abundance (%) of pathogens of
concern of samples collected on September 19, 2012 from two different sources, Benson
sample K and Osage sample G ........................................................................................ 81
Figure 41: Comparison of microbial composition by abundance (%) of two samples
collected on March 18, 2013 (Osage sample N) and on April 2, 2013 (Benson sample O)
.................................................................................................................... 83
Figure 42: Comparison of microbial composition by abundance (%) of pathogens of
concern of two samples collected on March 18, 2013at Osage (sample N) and April 2,
2013 at Benson (sample O). ............................................................................................. 85
Figure 43: Comparison in abundance in microbial composition (%) of pathogens of
concern samples collected at Osage and Benson in fall 2012 and spring 2013. .............. 87

xvi
List of Abbreviations
AC activated carbon
AOC assimilable organic carbon
AWWA American Water Works Association
BAC biologically activated carbon
BDOC biological dissolved organic carbon
CCME Canadian Council of Ministers of the Environment
Chll A chlorophyll A
COD chemical oxygen demand
DBP disinfection by-product
DO dissolved oxygen
DOC dissolved organic carbon
DON dissolved organic nitrogen
FA fulvic acid
GAC granular activated carbon
HA humic acid
HM humic matter
IMAC interim maximum acceptable concentration
M5RNA non-redundant multi-source ribosomal RNA annotation base
MAC maximum acceptable concentration
MG-RAST rapid annotation using subsystems technology for metagenomes
NOM natural organic matter
O3 ozone

xvii
OC organic carbon
PCR polymerase chain reaction
PDWA precautionary drinking water advisory
QC quality control
TC total coliforms
THM trihalomethanes
TN total nitrogen
TP total phosphorous
US EPA United States Environmental Protection Agency
WHO World Health Organisation
WTP water treatment plant

1
1. Introduction
1.1 Background
In Saskatchewan, over 50% of the population depends on surface water as their
source of drinking water. Even though rivers and lakes are used by larger cities to supply
their population with potable water, a large number of small rural communities depend
on local reservoirs and dugouts. Such water sources are primarily recharged by seasonal
precipitation that comes as surface runoff from the surrounding terrain. One of the
predominant contaminants commonly found in surface water in the province is organic
matter quantified as dissolved organic carbon (DOC) accompanied by high alkalinity
that can reach over 440 mg/L as CaCO3. In Saskatchewan, surface water DOC
concentration can be between 4 mg/L up to 35 mg/L or higher for various surface water
bodies. High concentrations of DOC are challenging to remove by conventional water
treatment. Reverse osmosis is effective for reducing DOC concentrations, but high DOC
and presence of other pollutants cause rapid fouling of the membranes which in turn
results in high operational and maintenance costs (Ang & Menachem, 2008). This is not
a viable option for small communities especially where the population ranges from 20 to
100 people and where the water source depends solely on run off.
One of the treatment technologies gaining interest in rural Saskatchewan, in
particular, is ozone-assisted biofiltration. Reports from other countries with similar
climate indicate that this inexpensive treatment offers great potential for removal of
impurities from raw water including organic carbons (OC), metals, and even pesticides
(Reungoat et al., 2010). However, application of the technology to water with high
turbidity and OC concentrations is challenging, particularly in cold conditions. As a

2
result of inadequate removal of OC, disinfection by-products (DBPs) such as
trihalomethanes (THMs), which are known human carcinogens, often exceed the limit of
100 µg/L recommended in the Guidelines for Canadian Drinking Water Quality (Health
Canada, 2012 ).
1.2 Organic Matter and Ozone in Water Treatment
In natural waters organic matter can be of natural or anthropogenic origin and is
present in particulate and/or dissolved state. The amount and characteristics of organic
matter in surface water depend on climate, geology and topography. Generally, in
surface water organic matter is composed mainly of humic matter (HM) followed
byoxalic, citric, formic and acetic acids, neutral carbohydrate material, and others (van
Loon & Duffy, 2010).
HM is usually plant or microbial origin, and is a major component of the carbon
found in terrestrial and aquatic environment. HM contains aromatic and aliphatic
compounds with mainly carboxylic and phenolic functional groups (Rodrigues et al,
2008). HM affects the charge balance and alkalinity of water, interacts with metals,
small neutral organic molecules and sediment solids. Based on their aqueous solubility at
different pH values HM will be comprised of different amount of the alkali and acid-
soluble fulvic acid (FA), the alkali soluble humic acid (HA) and the alkali and acid
insoluble humin (van Loon & Duffy, 2010). FA and HA are very similar in composition,
however FA is less aromatic, with lower molecular weight and it is more acidic (Theng,
2012).

3
The presence of HM in the surface water used for human consumption affects the
complexity of the treatment process and quality of the drinking water. Humic substances
do not only enhance biological growth in the distribution system and increase levels of
heavy metals and adsorbed organic pollutants, but are also the main pre-cursors for DBP
materialization (Matilainen, 2011)
In the water treatment industry, ozone (O3) has been used as a disinfectant or
oxidant. The use of ozone in oxidation processes helps to reduce taste and odour as well
as colour, oxidize natural organic matter (NOM), and reduce the majority of emerging
contaminants such as endocrine disruptors and pharmaceuticals (Snyder et al. 2006,
Deborde et al. 2005). Ozone is unstable in water where carboxylic acids, alcohols and/or
aldehydes are products of ozonation. The ozone reaction rates and efficiency are
dependent on temperature, pH, alkalinity and DOC (Elovitz et al. 2000).
Both bicarbonate and carbonate alkalinity will retain ozone residual for a longer
period of time than waters with low alkalinity. Carbonate alkalinity is a more effective
scavenger than bicarbonate alkalinity, where the hydroxyl radical (OH∙), one of the
ozone decomposition by-products, is one of the strongest chemical oxidants known and
is capable of rapidly reacting with a number of organic and inorganic compounds (Singer
and Reckhow, 1999).
Disinfection-by-products that can form by the use of ozone include aldehydes,
ketoacids and carboxylic acids where the formation of bromate is the most concerning
since bromate is a DBP of the ozonation of bromide-containing waters and is a strong
carcinogen, resulting in a maximum allowable concentration limited to 10 μg/L
4
(Antoniou and Andersen, 2011). However, most DBPs formed by ozone pre-oxidation
are easily biodegradable and can be removed by biofiltration (Ṥwietlik et al. 2004).
1.3 Relevant Regulations
Disinfection of drinking water is essential for protection of public health from
outbreaks of waterborne infectious and parasitic diseases. The American Water Works
Association (AWWA) Manual of Water Supply Practices M-48 ( 2006) isolated a group
of pathogens of concern that have the potential to produce waterborne diseases in
humans consuming contaminated water. Pathogens classified by genera are:
Acinetobacter, Aeromonas, Campylobacter, Cyanobacteria, Escherichia coli,
Flavobacterium, Helicobacter pylori, Klebsiella, Legionella, Mycobacterium avium,
Pseudomonas, Salmonella, Serratia, Shigella, Staphylococcus, Vibrio cholerae and
Yersinia. Also of interest are cyanobacteria known for their potential ability to produce
toxic substances, including Anabaena, Aphanizomenon, Cylindrospermopsis, Lyngbya,
Microcystis, Nodularia, Nostoc and Planktothrix (Carmichael, 2001). Parasites of
concern are Cryptosporidium parvum oocysts and Giardia lamblia cysts.
Primary disinfection is typically a chemical oxidation method where oxidants
such as chlorine, chloramine, chlorine dioxide, and/or ozone are used (LeChevallier and
Au, 2004). The main factors that influence disinfection efficiency are concentration of
the disinfectant, contact time between the disinfectant and water, temperature, and pH of
the water. A US EPA (1999a) report on Giardia shows that inactivation of the cysts by
chlorine is less effective at lower temperatures and higher pH. For example, at a
temperature of 5°C, pH 8, chlorine dose of 2 mg/L and 30 min contact time, less than 1/3

5
of all cysts are considered inactive. In order to completely inactivate Giardia cysts under
the given conditions 8 mg/L of chlorine is required (US EPA, 1999a), where chloramines
are even less effective than chlorine, and chlorine dioxide is effective at higher pH
values. In general, with increasing temperature and decreasing pH, lower concentrations
of chlorine and shorter contact time are required for complete cyst inactivation.
The use of chlorine as a disinfectant in water containing organic matter produces
a number of toxic DBPs (Health Canada, 2009). Chloramine tends to react with organic
nitrogen precursors producing N-nitrosodimethylamine (Health Canada, 2011).
Halonitromethane is a product of use of ozone in oxidation followed by chlorination (Hu
et al. 2009). Chlorine dioxide will react with organics to form chlorite and chlorate ions
that are also carcinogenic DPBs (WSA, EPB 416). When bromides are present in the
water and ozone is used as an oxidant, bromates will form (Health Canada, 1998).
In Saskatchewan, the only DBPs that are provincially regulated are THMs. The
Health Canada (2006) technical document shows that THMs are considered to be
possible carcinogens in humans. The document presents the results and observations
from different animal and human studies over time by different researchers. Studies on
mice and rats showed the link between the certain THM and liver tumours in mice, as
well as kidney tumors in mice and rats. Some studies in humans show the links between
exposure to specific THMs and liver tumours, kidney tumours, colorectal cancers, and/or
reproductive effects. Further studies are required to confirm these findings and other
potential negative health outcomes (Health Canada, 2006).
The THMs most commonly found in drinking water are chloroform,
bromodichloromethane, dibromochloromethane and bromoform (Health Canada, 2006).

6
In Saskatchewan, the interim maximum acceptable concentration (IMAC) of total THMs
in drinking water is 100 µg/L based on an annual average of 4 seasonal samples
(Saskatchewan Ministry of Environment, 2006). Water samples have to be collected at
the furthest point in the distribution system where the potential THM formation is
highest. The Disinfectants and Disinfection By-Products document published by the
World Health Organisation (WHO) indicates that the creation of THMs can be
minimized by avoiding pre-chlorination and by employing a water treatment process in
which removal of organic matter from water prior to chlorination is maximized.
The health risks from DBPs, including THMs, are much less than the risks from
consuming water that has not been disinfected. Water providers are advised that every
effort should be made to maintain concentrations of all DBPs as low as reasonably
attainable without neglecting the effectiveness of disinfection (Health Canada, 2006).
1.4 Research Objectives
The objective of this work is to identify and understand processes that lead to
poor filter performance in potable water treatment plants employing ozone-assisted
biofiltration. Specifically, the research objectives are to:
1. Identify and quantify the most influential surface water quality and filter-related
factors contributing to enhanced DOC removal efficiency;
2. Assess the microbial communities using metagenomic approaches and evaluate
removal of coliforms during the filtration process
3. Provide recommendations to achieve appropriate ozone assisted biofiltration
performance for the removal of OCs and other DBP-related compounds; and

7
4. Identify and recommend source water protection measures, which may include
the development of a formal source water protection plan for each community.
2. Literature Review
2.1. Biologically Active Filters
Biologically active filters are those in which a microorganism-derived biofilm is
formed on media such as sand, anthracite, or granular activated carbon (GAC). A GAC
filter that is completely exhausted evolves into biologically activated carbon (BAC)
filter, where most of the DOC is removed by biological degradation and not by
adsorption (Velten et al, 2011). Biofilm-based microbial communities are adept of
contaminants decrease through oxidation- reduction reactions (Zhu et al, 2010).
Biological activity within the filters is capable of reducing a wide range of natural and
industrial pollutants (Rochex et al, 2008; Zhang et al, 2010).
Generally, biofilter efficiency depends largely on the filter medium properties,
which include porosity, degree of compaction, water retention capacities, and capacity to
host microbial population (Srivastava et al, 2007). To achieve optimal performance of
the filters it is important to understand the factors that influence biofilm formation and
maturation including microbial community composition, as well as factors that influence
these microbes such as temperature, pH, nutrients composition and availability. Bacterial
community composition in a biofilm is governed by substrate availability, but large
bacterial communities do not necessary imply higher activity or enhanced DOC removal.
Biofilm performance is influenced by abundance, dynamics, evenness and functional

8
redundancy of the bacterial community. These factors contribute to greater system
stability (Boon et al, 2011).
2.2 Composition, stability and performance of pre-ozonation assisted
biological filters for surface water treatment
Biological filtration (biofiltration) preceded by ozonation is gaining attention in
North America (Fonseca et al, 2001). Use of ozone as a pre-oxidant maximizes the
production of biodegradable dissolved organic carbon (BDOC) (Yavich et al, 2004).
However, not all DOCs are broken down at the same rate, since the small amount of
DOC in surface water is easily biodegradable. One of the reasons is that the
microorganisms present in the water have already consumed the most of easily
biodegradable matter (van der Aa et al, 2011).
It is important to emphasize that the ozonation of the untreated water does not
change the composition of culturable bacteria significantly, unlike pre-chlorination.
Norton and LeChevalier (1999) showed that use of chlorine in the untreated water results
in a quick shift from predominantly Gram-negative to Gram-positive bacteria, whereas in
ozonated natural water majority of the culturable Gram-negative bacteria remain
throughout the treatment.
2.3 Biofilms in biological filters
The rate of biofilm development can be influenced by water temperature, organic
carbon quality and quantity and microbial community composition. Therefore, the rate of
the biofilm development is likely to differ considerably under different conditions

9
(Velten et al, 2011). Rochex et al. (2008) observed that biofilm formation goes through
three major phases: adhesion where diversity is high, growth with diversity reduced due
to the dominance of more competitive microorganisms and maturation where diversity
decreases due to the variety of microhabitats in the biofilm.
Boon et al. (2011) showed that, despite the similar biomass concentration at
different sections of the BAC filter treating pre-ozonated surface water, DOC removal
was not the same in all sections. The top 10cm section had the lowest DOC removal
efficiency, where the bottom 115cm had the highest DOC removal efficiency most likely
due to the bacterial community dynamics, biodiversity and evens.
2.4 Composition
Bacterial community composition in a biologically activated filter is a function of
bacterial diversity of the community from which the bacteria are drawn, distribution of
taxa within the community, rate of transport of bacteria, size of the source, and spatial
structure of the community (Curtis et al, 2004).
Magic-Knezev et al. (2009) reported that, in an effort to select representative
strains to study the role of bacteria in removal of DO matter, bacterial isolates from 21
GAC filters in nine water treatment plants in The Netherlands were collected. There, the
WTPs rely on ground or surface water with or without pre-oxidation. The results from
the Magic-Knezev et al. (2009) study indicated that Proteobacteria represented nearly
94% of all isolates, where Betaproteobacteria dominated over the Alphaproteobacteria.
Sphingomonas and Afipia were the most represented isolates in Alphaproteobacteria in
surface and ground water, respectively. The genera Caulobacter, Devosia,

10
Methylobacterium, Variovorax and Rhodobacter were only acquired from filters treating
raw groundwater. Members of the family Acetobacteriaceae and the genera
Brevundimonas, Rhizobium, and Rosemonas were obtained from filters with ozonated
surface water.
Further in the Magic-Knezev et al. (2009) research, Betaproteobacteria were most
frequently represented by Polaromonas sp. and Hydrogenophaga sp. followed by
Methylibium, Ultramicrobacterium, Aquaspirillum, Ideonella, Acidovorax, unclassified
Comamondaceae, Variovorax, Alcaligenes, Burkholderia, Pseudomonas, Rubrivivax,
Xylophilus, Aquamonas, as well as other unclassified bacteria. The results showed that
GAC filters treating either source showed similar abundance of Betaproteobacteria with
Polaromonas represented a significantly larger proportion of the isolates cultured from
GAC filters supplied with ozone oxidized water than from filters without pre-oxidation.
Zhang et al (2010) reported that bacterial species diversity was gradually reduced
over time in a BAC filtration pilot plant treating contaminated water from the Songhua
River in China. Species present in the filter on days 195 and 225 were not detected by
day 255. Final communities (at day 255) were dominated by Pseudomonas sp., Bacillus
subtilis, Nitrospira sp. and other uncultured bacteria. It is believed that these changes in
the bacterial community are due to either temperature change or / and bacterial
competition.
Norton and LeChavalier (1999) studied changes in bacterial communities
throughout the drinking water treatment and distribution system. Using de-chlorinated
tap water, they combined bacteria and organic matter from the Mississippi River with
assimilable organic carbon (AOC) from centrifuged raw sewage supernatant. The water

11
mixture was then oxidized by ozone and passed through a granular BAC filter. The
bacterial composition of the water sample was evaluated (Figure 1).
Figure 1: Bacterial composition obtained from ozone pre-oxidized granular BAC filter treating de-
chlorinated tap water infused with bacteria and organic matter from the Mississippi
River and assimilable organic carbon from centrifuged raw sewage supernatant (Norton
and LeChavalier, 1999).
Treated water (Figure 2) was dominated by Gram-negative bacteria including
Acinetobacter spp., Pseudomonas spp., Alcaligenes spp., Klebsiella spp. and
Hydrogenophaga spp. Following treatment the percent of Pseudomonas spp. had
increased from 14 to 22%, Sphingomonas spp. increased from 2 to 19%, and
Enterobacter spp. and Flavobacterium spp. each increased from 2 to 5%. In contrast,
Pseudomonas
spp.
14%
Sphingomonas spp.
2%
Enterobacter spp.
2%
Flavobacterium
spp. 2%
Acidovorax spp.
2%
Klebsiella spp.
10%
Comamonas spp.
1%
Stenotrophomonas
spp. 2%
Methylobacterium
spp. 1%
Alcaligenes spp.
12%
Hydrogenophaga
spp.
8% Acinetobacter spp.
30%
Xanthobacter spp.
3%
Alteromonas spp.
2%
Rhodobacter
spp.
2% Unidentified
3%
Nocardia spp.
1%
Rhodococcus spp.
0%
Other
1%
Staphylococcus
spp.
1%
Gram positive
6%

12
Alcaligenes spp. declined from 12 to 1%, Klebsiella spp. from 10 to 1%, and
Hydrogenophaga spp. from 8 to 1% in the post-treatment effluent. There was a total
disappearance of Acinetobacter spp, Xanthobacter spp., Alteromonas spp. and
Rhodobacter spp. Gram-positive bacteria Nocardia spp. increased from 1% in raw to 7%
in treated water and Rhodococcus spp. increaased from non-detectable in raw water to
4% in the treated effluent.
Figure 2: Bacterial community in treated water effluent produced after experimental granular BAC
treatment (Norton and LeChavalier, 1999).
The results of this study do not provide clear indication as to why the shift of
species within the Gram-negative bacteria occurred after GAC treatment of ozonated
Pseudomonas spp.
22%
Sphingomonas
spp.
19%
Enterobacter spp.
5%
Flavobacterium
spp. 5%
Acidovorax spp.
4%
Klebsiella spp.
3%
Comamonas spp.
3% Stenotrophomonas
spp.
2%
Methylobacterium
spp. 2% Alcaligenes spp.
1%
Hydrogenophaga
spp.
1% Acinetobacter
spp.
0%
Xanthobacter spp.
0%
Alteromonas spp.
0%
Nocardia spp.
7%
Unidentified
16% Other
1%
Rhodococcus spp.
4%
Gram positive
28%
13
water, although nutrient availability may have been a factor. Further, it is possible that
ozone pre-oxidation of the raw water changed substrate bioavailability by breaking
molecular bonds and creating an environment in which the original bacterial community
shifted due to changes in nutrients competition.
In their report, Niemi and colleagues (2009) reported that the majority of BAC
isolates collected from surface water prior to ozonation were Betaproteobacteria of the
order Burkholderiales, Comamonadaceae and an undescribed family, as well as related
sequences belonging mainly to uncultured bacteria. The less abundant
Alphaproteobacteria were characterized by the genus Sphingomonas, and genera Afipia,
Bosea, and Bradyrhizobium.
In freshwater, commonly found bacteria include Betaproteobacteria,
Alphaproteobactera and Gammaproteobacteria, where Betaproteobacteria are usually
found in water polluted with organic contaminants (Brümmer et al, 2003; Rodrigues et
al, 2010; Vigliotta et al, 2010; Huang et al, 2011). Araya et al (2002) suggests that the
dominance of Betaproteobacteria in freshwater biofilms can be accredited to the
capability of those bacteria to more easily attach to surfaces during the initial phase of
biofilm development than other bacteria.
2.5 Stability and functionality
Understanding the role and composition of microbial groups at the source as well
as in biofilters is pivotal to understanding the long term stability of a system (Briones
and Raskin, 2003). Boon et al. (2011) showed that greater system stability could be
attained through higher biodiversity. In their analysis of a BAC filter fed by ozone pre-

14
oxidized surface water, Boon and colleagues (2011) noted that DOC removal efficiency
increased with increased filter depth. At the same time, biomass concentration across the
filter remained relatively constant. Based on these results, researchers suggest that
microbial communities are exclusively responsible for the differences in removal
efficiencies.
In Boon et al. (2011), the community across the filter contained high biodiversity,
community dynamics and evenness, while the community at the bottom of the filter was
better able to adapt to a changing environment. Boon et al. (2011) also noted that the
most important parameters in determining high functionality in biologically active filters
are community structure parameters (richness, dynamics and evenness) and not biomass
content. It is through richness and dynamics that an ecosystem is resilient against decline
in functionality, since multiple pathways exist to stabilize the system in response to
external factors.
Similarly, Briones and Raskin (2003) concluded that population diversity alone
does not govern ecosystem stability, but that functional redundancy within the system is
also important. System stability relies on the pool of species capable of using substrates
through parallel pathways. To demonstrate this, Briones and Raskin (2003) discuss the
performance of a bioreactor designed for removal of soluble mercury from wastewater.
Here, reactor performance in the presence of multiple species of mercury–resistant
bacteria was superior to that containing only a single species of mercury–resistant
bacteria.

15
3. Materials and Methods
3.1 Water Sample Collection
The Village of Osage and Hamlet of Benson were selected for this study since
they are among the oldest provincially regulated ozone-assisted biofiltration plants in
Saskatchewan. Seasonal samples were collected in approximately two-month intervals in
2012 from both communities’ WTPs.
Samples were collected in bottles supplied by the Saskatchewan Disease Control
Laboratory, Environmental Services in Regina, SK. Samples were collected at the raw
water tap and filter taps in the plant after taps have been left running for some time. For
unionized ammonia testing water sample was collected in a white 250 ml plastic bottle
and sample was preserved with 5 ml of 10% sulfuric acid (H2SO4). For the rest of the
parameters, except for the total coliforms (TC) and E.coli, water was collected in white
plastic 2 L bottle. Water samples intended for TC and E.coli testing were collected in
clear plastic sterilized 250 ml bottle containing sodium thiosulphate. Water sample
analyses were performed at the Saskatchewan Disease Control Laboratory, , and
included analyses for conductivity, pH, total alkalinity, phenol alkalinity, bicarbonate,
carbonate, hydroxide, chloride dissolved , fluoride dissolved, sulphate dissolved, calcium
(Ca), magnesium (Mg), potassium (K), sodium (Na), total hardness, total dissolved
solids, total suspended solids, turbidity, total Kjedahl nitrogen (TKN), nitrate-N (NO3-),
ammonia (NH3), total nitrogen (N-total), total phosphorous (P-total), ortho-phosphorous
(P-ortho), DOC, chlorophyll A, biochemical oxygen demand (BCOD), chemical oxygen
demand (COD), boron (B), iron (Fe), manganese (Mn), aluminum (Al), arsenic (As),
barium (Ba), cadmium (Cd), chromium (Cr), copper (Cu), lead (Pb), selenium (Se),

16
uranium (U), zinc (Zn), antimony (Sb), berylium (Be), cobalt (Co), molybdenum (Mo),
nickel (Ni), silver (Ag), thalium (Tl), thorium (Th), vanadium (V), total coliform (TC),
E-coli and THMs (Appendix D). Cost for samples analysis was covered between the
Lab and Water Security Agency / formerly Ministry of Environment.
Sets of raw water samples collected in spring and fall and were shipped to the
Saskatchewan Research Council (SRC) Lab in Saskatoon, SK where samples were
analysed for cyanide and Phenoxy herbicides, including: 2,4-D; 2,4,5-T; 2,4,5-TP
(Silvex); Bromoxynil (Buctril); Dicamba (Banvel); Diclofop-methyl (Hoe-grass); MCPA
and Picloram (Tordon).
None of the samples were collected in duplicates or triplicated due to the
economic constraints of the project. The only set of samples where ice packs were not
placed in the cooler were samples that were collected in February 2012. However,
samples were delivered to the Provincial Lab for testing within less than 4 hours of
sampling. All samples were kept in the cooler at the same temperature, therefore any
change that might have been occurring within the one sample bottles would be
happening in all of the bottles.
3.1.1 Village of Osage
Osage has a population of about 20 and is located 93 km south-east of Regina, on
highway #33. The surface water dugout that serves as the raw water source for the
community is roughly 70 m in length, 24 m width and about 4 m in depth (Figure 3)
since the ground water is unavailable or of poor quality. To the north, a berm prevents

17
direct runoff from agricultural fields into the dugout. Two small windmill aerators are
floating in the dugout to aid in aeration.
Figure 3: Dugout that serves as raw water source for Osage (within red circle). Proximity of
agricultural fields is evident.
Osage installed the first ozone-assisted biological filtration facility regulated by
the Saskatchewan Ministry of Environment / Water Security Agency. In 2004, the
ozone-assisted biofiltration treatment train was launched as a pilot project (average 4.4
m3/day, with peak consumption of 6.3 m
3/day) of with construction and implementation
of the full scale WTP (11 m3/day) completed in 2007.
The Osage WTP is composed of one 0.66 m diameter roughing filter, one 1.75 m
diameter biological sand filter and one 1 m diameter biologically activated carbon filter.
The filtration rate for the biological sand filter is 0.24 m/h and contact time for the

18
biologically activated carbon is 30 to 56 min. An air diffuser is installed in the sand filter
to aid in back wash, where a re-circulation system is re-circulating the non-chlorinated
water back into BAC filter for added aeration at 0.6 m3/ hr. Treated water is then
chlorinated and stored in a storage tanks prior to distribution (Mainstream Water
Solutions Inc, 2004; Appendix E).
Two ozone generators (VMUS-04) each provide up to 7 mg/L of ozone at 6
L/min of oxygen. The report on WTP design and operation states that the ozone dosage
is 4 g/hr at 5 L/min airflow and 7 mg/L at average flow rate. Thus, the applied ozone
dose is approximately 17 mg/L. Average ozone contact time is 60 min (Mainstream
Water Solutions Inc, 2004). An air dryer was installed in April 2012 to improve the
efficiency of the ozone generator. The design report also provides instructions for
backwash timing and protocols with the established practice being a schedule of
backwashing the roughing filter every 10 to 14 days, the sand filter once per month and
the BAC filter every 4 to 5 months.
3.1.2 Hamlet of Benson
In 2012 population of Hamlet of Benson is 95 and it is located about 170 km
south-east of Regina. Raw water is collected in two dugouts located in an agricultural
field north of town (Figure 4). Neither surface water dugout includes berms or buffer
zones to separate the community’s raw water sources from agricultural operations. The
larger dugout was built in 1974 and is 119 m in length, 61 m in width and 7.3 m in depth.
The smaller dugout was built in 2001 to supplement raw water availability and is 91 m in
length, 58 m in width and 6 to 7 m in depth. The smaller dugout is used to recharge the
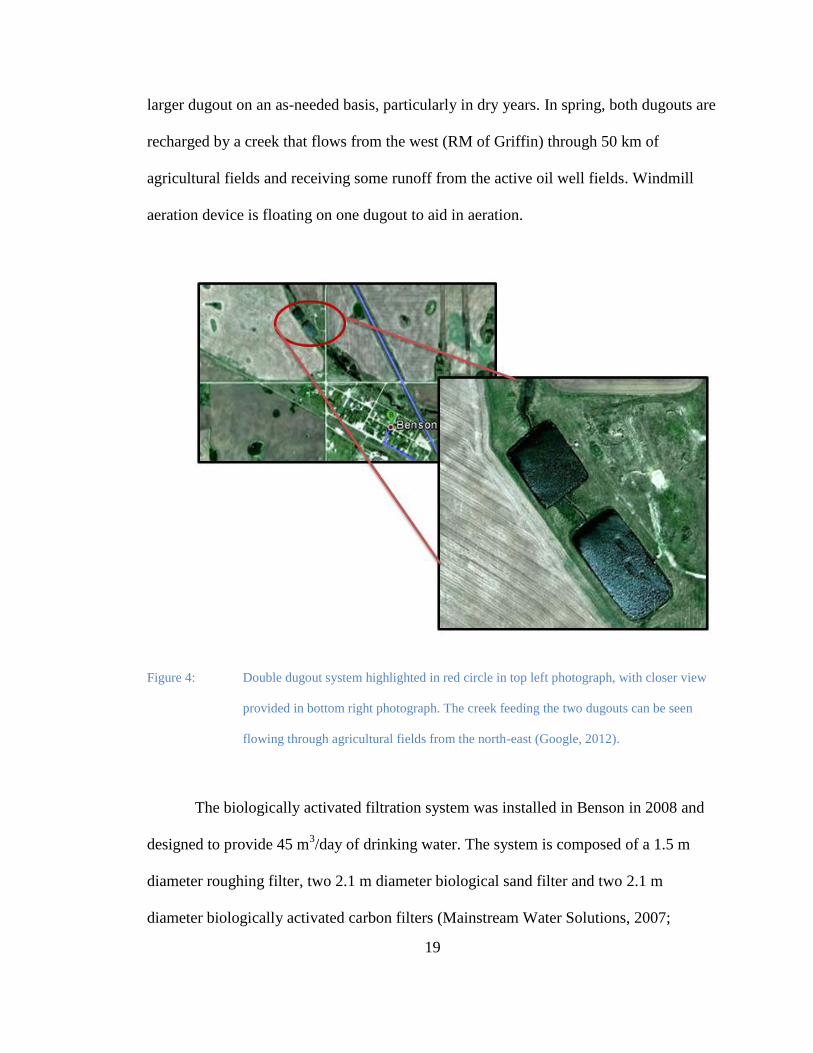
19
larger dugout on an as-needed basis, particularly in dry years. In spring, both dugouts are
recharged by a creek that flows from the west (RM of Griffin) through 50 km of
agricultural fields and receiving some runoff from the active oil well fields. Windmill
aeration device is floating on one dugout to aid in aeration.
Figure 4: Double dugout system highlighted in red circle in top left photograph, with closer view
provided in bottom right photograph. The creek feeding the two dugouts can be seen
flowing through agricultural fields from the north-east (Google, 2012).
The biologically activated filtration system was installed in Benson in 2008 and
designed to provide 45 m3/day of drinking water. The system is composed of a 1.5 m
diameter roughing filter, two 2.1 m diameter biological sand filter and two 2.1 m
diameter biologically activated carbon filters (Mainstream Water Solutions, 2007;

20
Appendix E). The filtration rate for the biosand filter is 0.35 m/hr and the rate for the
biologically activated carbon is 0.70 m/hr (>30 min contact time). Just like at Osage, an
air diffuser is installed in the sand filter to aid in back wash, and aeration of BAC filters
in enabled by a re-circulation system that is re-circulating the non-chlorinated water back
into BAC filters at 0.6 m3/ hr. Treated water is chlorinated and stored in a storage tanks.
Water automatically enters the WTP by pump from the dugout when water in the
roughing filter drops below a set minimum level. From the roughing filter water is
delivered to the rest of the filters by gravity (Appendix E).
Four ozone generators (VMUS-04) are each capable of generating up to 7 mg/L
of ozone per unit at 6 L/min of oxygen. At full operating capacity the applied ozone dose
is 17 mg/L. The average ozone contact time is approximately 60 min. The established
practice for filters backwash is that the roughing filter is backwashed every 10 to 14
days, sand filters once per month and BAC filters every 1 to 3 months depending on raw
water turbidity.
3.2 Microbiological Sample Collection
Two sets of raw water samples were collected in 1 L white plastic bottles from
communities in September 2012 and March/April 2013. Bottles were kept at 4⁰C and
processed within 24 hours.
Water samples were vacuum filtered using 0.2 µm Millipore filters GSWP04700.
About 0.35 L of water was filtered and filter papers placed in conical tube. To the tubes
was added the respective raw water and then the mixture vortexed to re-suspend the
sediments/turbidity particles collected on the papers. The filter paper was removed from

21
the conical tube and centrifuged at 1000 RPM for 10 minutes. The turbidity-associated
particles were recovered and processed using MoBio PowerSoil® kits per the
manufacturer’s instructions, kit purchased in 2012 from MO BIO Laboratories, Inc.
In September 2012, a media sample was collected from the BAC filter in Osage.
This sample was collected using a grain coring tool that had been washed with soap and
warm water and disinfected with denatured alcohol. The core samples were collected
approximately eight (8) inches from the centre of the filter and at three depths within the
BAC filter (top 1/3, middle 1/3 and bottom 1/3). Media samples were placed in
disinfected bottles. Distilled water was added to the bottles and samples vortexed for 10
minutes to displace the microbes/ biofilm from BAC pores. Samples were then
centrifuged and the sediment collected on the bottom of the conical tube collected and
processed using PowerSoil® DNA Isolation Kit per the manufacturer’s instructions, kit
purchased in 2012 from MO BIO Laboratories, Inc.
3.3 PCR analyses of bacterial communities
Water and media samples were processed for DNA content and bacterial
community profile using gel electrophoresis. Successful DNA samples then were then
used as template for 16S rRNA amplification with Polymerase Chain Reaction (PCR)
(Table 1).

22
Table 1: PCR components and concentrations per reaction used for sequencing of the samples
PCR per REACTION
H2O (µL) 37.60
5xHF buffer (µL) 10.00
V3F (100µM) (µL) 0.25
REVERSE PRIMER (100µM) (µL) 0.25
dNTP (100mM) 0.40
PHUSION (2U/ µL) (µL) 0.50
TEMPLATE (10ng) (µL) 1.00
Three PCR amplifications were prepared for each sample with one negative
control as a fourth amplification. Samples were thermo cycled using the following cycle:
98°C/ 2 min, 20x (98°C/ 10 sec, 50°C/30 sec, 72°C/15 sec), 72°C/7 sec (Bartram &
Neufeld, 2011). Following this, about 120 µL of each sample was loaded on 1.2%
Agarose gel and analyzed by gel electrophoresis at 120V for 40 min. The gel was stained
for 10 min in ethidium bromide and then destained. It was then placed on UV
transilluminator and the gel containing DNA was cut out and cleaned with an E.Z.N.A.
Gel Extraction Kit D-2500-01 by OMEGA bio-tek purchased in 2012. The concentration
and purity of samples were confirmed by NanoDrop UV-Vis Spectrophotometer
(Appendix A). Sequencing of amplicons was carried out on a Illumina GAIIx platform.
Approximately 40 µL of each sample was submitted to the McGill University
and Génome Québec Innovation Centre, Montréal, QC to be sequenced using Illumina
MiSec Technology. Sequenced data is uploaded on MG-RAST metagenomics analysis
server. The concentrations of each sample are summarized in Appendix A.
Organism abundance is analyzed using best hit classification with M5RNA
annotation source, maximum e-value cut off 1e-5, 60% maximum percentage cut off and

23
50 minimum alignment length cut off. Data were generated and grouped by genera in a
table and bacterial domain is selected for analysis.
Raw water samples and those collected through the treatment trains in both
Osage and Benson were collected in September 2012 and submitted to the Provincial
Laboratory for Total Coliform (TC) and E. coli analyses to complete the microbiological
examination.
4. Results and Discussion
4.1. Village of Osage
Water samples collected from the Osage dugout indicate continuous increases in
many parameters from 2012 spring run-off through the end of the sampling period
(Table 2). In particular, the values for TDS, pH, alkalinity and specific conductivity rose
notably.
Table 2: Selected parameters for Osage raw water quality
OSAGE, 2012/ 2013 RAW
DATE TDS
(mg/L)
TURBIDITY
(NTU) pH
TOTAL
ALKALINITY
(mg/L as
CaCO3)
SPECIFIC
COND.
(µS/cm)
DOC
(mg/L)
Chll A
(mg/m3)
TN
(mg/L)
TP
(mg/L)
2/6/12 453 4.60 8.30 150 599 13.90 64.27 1.00 0.41
4/30/12 341 2.80 8.00 127 427 13.10 9.95 1.00 0.38
7/17/12 414 12.00 8.20 150 528 12.00 56.18 1.50 0.81
9/19/12 459 8.20 8.60 176 579 12.20 37.12 1.00 0.52
11/20/12 516 4.00 8.50 204 654 14.20 38.70 1.40 0.38
3/18/13 606 2.60 7.90 234 743 15.70 13.58 1.80 0.35

24
Total alkalinity and specific conductivity rose steadily over time with exception
in April 2013 where the fresh runoff has recharged the dugout and diluted most of the
parameters. Chlorophyll A was significantly higher in February 2012 than in March
2013. It is most likely that under the ice algae growth occurred in February 2012 and
thereby contributed to the higher levels of Chlorophyll A. Normally, during
decomposition of organic matter pH of the water would lean toward the more acidic
condition, which was not the case in February 2012 with pH of 8.3.
Total phosphorous and total nitrogen peaked in July 2012. In March 2013, total
nitrogen peaked again alongside total DOC. Those two instances are the only instances
during which ammonia and nitrate were present in raw water samples (Figure 5).
Figure 5: Changes in total nitrogen and its components in the raw water for Osage
One of the probable causes of ammonia and nitrate presence in water in the
summer is low oxygen levels in the dugout due to the temperatures through the summer.
Since the winter 2013 was mild winter in Saskatchewan with large amount of
0.00
0.20
0.40
0.60
0.80
1.00
1.20
1.40
1.60
1.80
2.00
mg
/L
NITROGEN
TKN
NITRATE
AMMONIA

25
precipitation and no prolonged time with extremely low temperatures it could be that
under the ice low oxygen conditions with no significant algal growth were created where
nitrifiers were active therefore ammonia and nitrate presence in the water.
The values for Chlorophyll A were highest in February and July 2012. DOC
values were at steady incline since July 2012, reaching 15.7 mg/L in March 2013; the
lowest values for these two parameters were noted in April and July of 2012,
respectively. It seems that algae growth under the ice in winter of 2013 was retarded
throughout the winter since Chlorophyll A in March 2013 was about four times less than
algae growth in February 2012 (Figure 6).
Figure 6: DOC and Chlorophyll A level changes in raw water at Osage
Chlorine packs that are used for disinfection of piping were thrown into dugout in
order to control algal growth and aid in aeration of the dugout in October 2012. That
could be the potential reason of algal growth obstruction through the winter.
0.00
10.00
20.00
30.00
40.00
50.00
60.00
70.00
0.00
2.00
4.00
6.00
8.00
10.00
12.00
14.00
16.00
18.00
DO
C (
mg/L
)
DOC
(mg/L)
CHLL A
(ug/L)
Ch
ll A
(µg/L
)

26
The highest COD level occurred in March 2013 and the lowest in September
2012 (Figure 7). Biochemical oxygen demand was low at all times (BCOD). These
values show that there is not much readily bioavailable matter present in the water.
Chemical oxidation is required to aid in mineralisation of carbon present in the water. In
unpolluted water, COD is typically less than 20 mg/L (UNESCO/WHO/UNEP, 1992,
1996; NERRS-NOA, 2013). Further information about COD removal through the
treatment train is available in Appendix C.
Figure 7: Changes in BCOD and COD over time in raw water source
In February and September of 2012 raw water was tested for phenoxy herbicides
and the cyanide. Samples were collected in February at the beginning of the project and
in September before the harvest. In both cases, all concentrations of herbicides and
cyanide were below the laboratory detection limits. There could be few reasons that
could have influenced the lab results. One reason is that detection limits are high set at
0.5 µg/L except for MCPA and Picloram with detection limit of 1 µg/L and Diclofop-
0.00
5.00
10.00
15.00
20.00
25.00
30.00
35.00
40.00
45.00
mg
/L
COD (mg/L)
BCOD(mg/L)
27
methyl with even higher detection limit of 3 µg/L. Another reason is that pesticides used
in the field might differ from those that lab is currently testing for. Therefore
considering the proximity of the cultivated area and the dugout it cannot be said with
certainty that there is no the actual impact of pesticide use in adjacent agricultural fields.
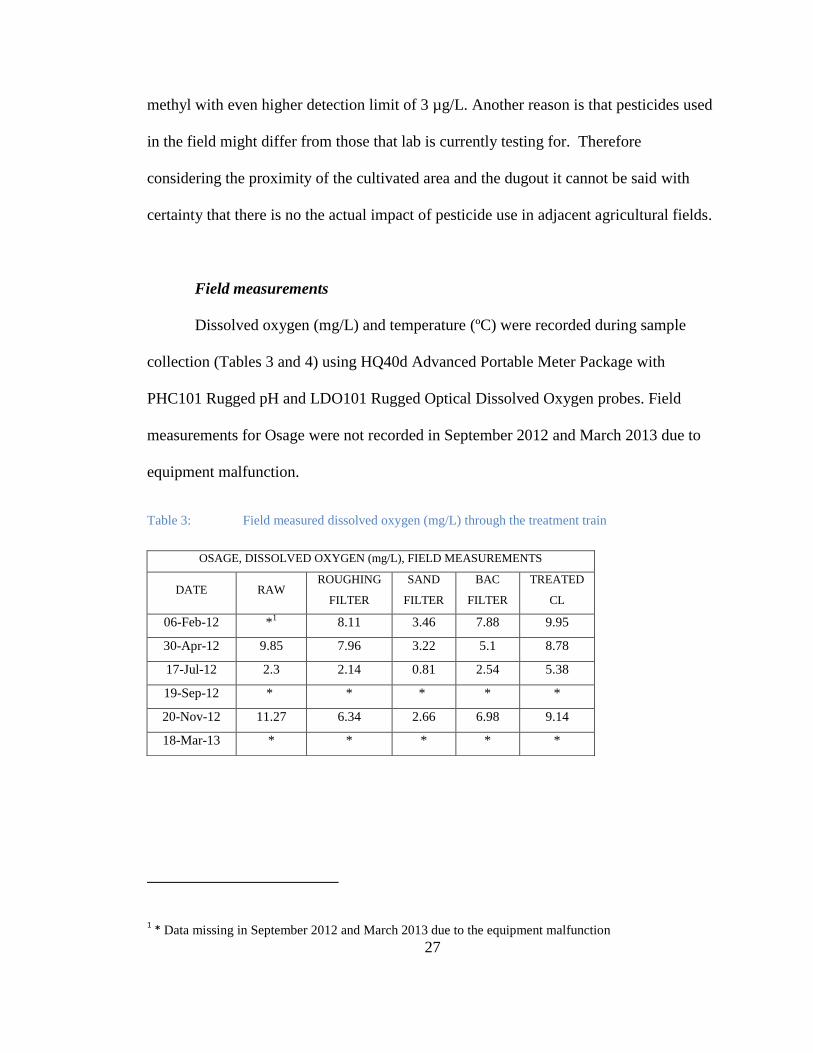
Field measurements
Dissolved oxygen (mg/L) and temperature (ºC) were recorded during sample
collection (Tables 3 and 4) using HQ40d Advanced Portable Meter Package with
PHC101 Rugged pH and LDO101 Rugged Optical Dissolved Oxygen probes. Field
measurements for Osage were not recorded in September 2012 and March 2013 due to
equipment malfunction.
Table 3: Field measured dissolved oxygen (mg/L) through the treatment train
1 * Data missing in September 2012 and March 2013 due to the equipment malfunction
OSAGE, DISSOLVED OXYGEN (mg/L), FIELD MEASUREMENTS
DATE RAW ROUGHING
FILTER
SAND
FILTER
BAC
FILTER
TREATED
CL
06-Feb-12 *1 8.11 3.46 7.88 9.95
30-Apr-12 9.85 7.96 3.22 5.1 8.78
17-Jul-12 2.3 2.14 0.81 2.54 5.38
19-Sep-12 * * * * *
20-Nov-12 11.27 6.34 2.66 6.98 9.14
18-Mar-13 * * * * *

28
Table 4: Field measured water temperature (ºC) through the treatment train
OSAGE, WATER TEMPERATURE (ºC), FIELD MEASUREMENTS
DATE RAW ROUGHING
FILTER
SAND
FILTER
BAC
FILTER
TREATED
CL
06-Feb-12 4.5 5.7 6.4 7.1 7.7
30-Apr-12 14 10.6 11.2 11.8 11.9
17-Jul-12 19.4 20.7 21.8 22.3 22.9
19-Sep-12 * * * * *
20-Nov-12 6.6 6.8 6.8 6.7 8.4
18-Mar-13 * * * * *
DO levels through sand filter are significantly lower at all times than DO levels
through the rough filter regardless of the water temperature (Tables 3 and 4).
Considering low flow rates through the sand filter, low oxygen levels in its water
effluent it could be assumed that a degree of biological degradation is occurring in the
filter in spite the fact that filter is backwashed on average once a month.
DO levels almost double through the BAC filters and it is most likely due to the
re-circulation system. Temperature of the water in colder months rises above 4ºC
through the treatment and is probably due to the fact that the WTP building is kept
heated through the winter. Biological reactors perform better at warmer temperatures.
DOC removal from the water
In principle, the higher the alkalinity, the lower the rate of DOC removal (US
EPA, 1999). However, through the ozone-assisted biofiltration treatment train, alkalinity
changes that occur are minimal (Figure 8).

29
Figure 8: Change in total alkalinity in raw to treated water over time at Osage
Carbonate and phenol alkalinity were detected in raw water in February,
September and November 2012 where the carbonate alkalinity increased from 1, to 6 and
7 mg/L. Phenol alkalinity increased from 0.55 mg/L in February to 5.34 and 5.67 mg/L
in September and November, respectively.
Elovitz et al (2000) demonstrated that ozone depletion rates increase with
increasing temperature. Even though ozone concentration could not be measured at
Osage through the treatment train, the effect of ozone and its radicals can be observed
through the mineralization of DOC through the roughing and sand filter (Figure 9).
0.00
50.00
100.00
150.00
200.00
250.00
mg
/L a
s C
aC
O3
RAW
TREATED

30
Figure 9: Changes in DOC (mg/L) removal through the treatment train, Osage
During the period examined, removal of DOC through the treatment ranged
between 35 and 52 % (Supplemental Table 3, Appendix B) of total DOC present in the
water. In July and September, initial DOC mineralization is high measuring from the raw
through the roughing filter (38 and 35% respectively), where the removal rates from
roughing filter through the sand filter are lesser in comparison to the initial DOC
removed (5 and 7% respectively) (Supplemental Table 4, Appendix B). However, in
months with colder temperatures DOC mineralization rates are almost constant
measuring from the raw through the roughing filter (average 17%) and subsequently
through the sand filter (average 17%). That occurrence can be ascribed to the fact that
ozone has different depletion rates at different range of temperatures.
0.00
2.00
4.00
6.00
8.00
10.00
12.00
14.00
16.00
18.00
RAW ROUGHING
FILTER
SAND
FILTER
BAC
FILTER
TREATED
NO CL
TREATED
W CL
mg/L
06-Feb-12
30-Apr-12
17-Jul-12
19-Sep-12
20-Nov-12
18-Mar-13

31
DOC removal in the BAC filter itself ranged from 4 to 11% of total DOC present
in the water. DOC reduction in the BAC filter can be accredited to the biological activity
within the filter.
Dugout batch chlorination occurred at the beginning October 2012. It is most
likely that majority of the organic matter in the dugout was oxidized at that time. Since
the THMs are volatile, warmer day and colder night temperatures enabled mixing of
water in the dugout and most likely enabled the highly volatile THMs to evaporate.
The total THM concentration measured in treated water at the plant was close to
55 µg/L at a DOC concentration of nearly 9 mg/L (Figure 10). The difference between
THM values for the samples collected at farthest point in distribution system and those
collected at the plant is minimal (Table 5).
Figure 10: DOC in raw and treated water; THMs collected at the Osage WTP
0.00
10.00
20.00
30.00
40.00
50.00
60.00
70.00
80.00
90.00
100.00
0.00
2.00
4.00
6.00
8.00
10.00
12.00
14.00
16.00
18.00
20.00
DOC RAW
(mg/L)
DOC
TREATED(mg/L)
THM (µg/L)
µg
/L
mg/
L
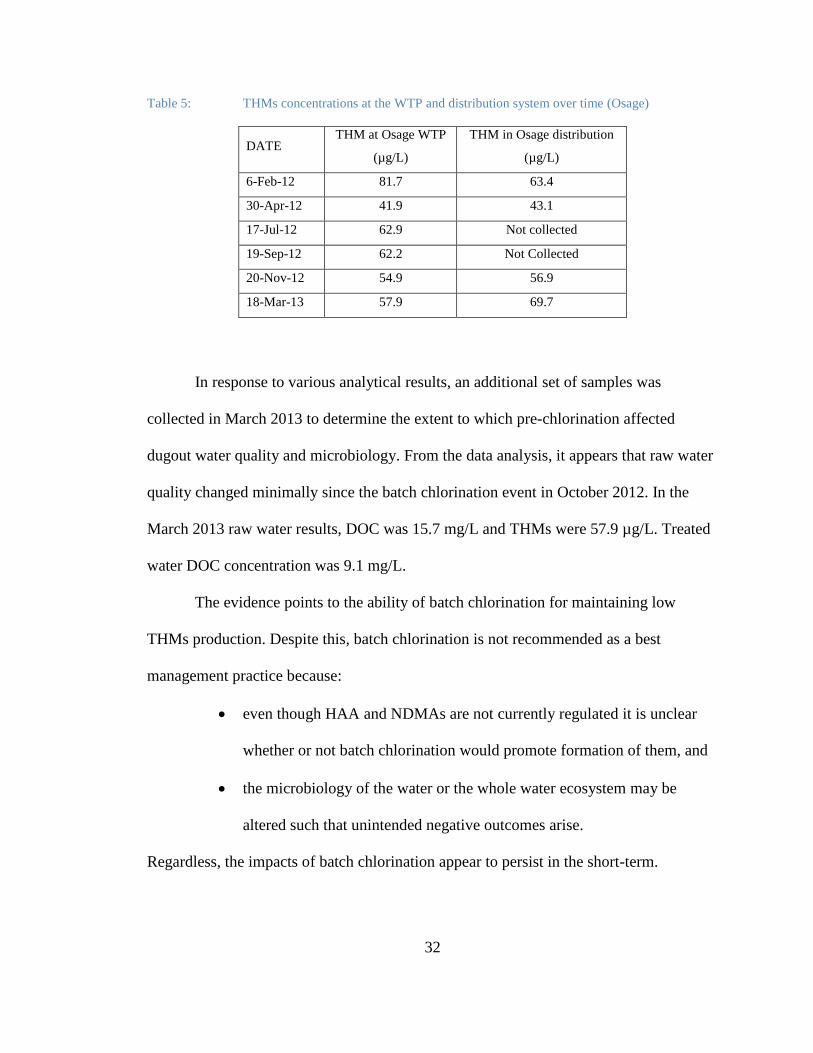
32
Table 5: THMs concentrations at the WTP and distribution system over time (Osage)
DATE THM at Osage WTP
(µg/L)
THM in Osage distribution
(µg/L)
6-Feb-12 81.7 63.4
30-Apr-12 41.9 43.1
17-Jul-12 62.9 Not collected
19-Sep-12 62.2 Not Collected
20-Nov-12 54.9 56.9
18-Mar-13 57.9 69.7
In response to various analytical results, an additional set of samples was
collected in March 2013 to determine the extent to which pre-chlorination affected
dugout water quality and microbiology. From the data analysis, it appears that raw water
quality changed minimally since the batch chlorination event in October 2012. In the
March 2013 raw water results, DOC was 15.7 mg/L and THMs were 57.9 µg/L. Treated
water DOC concentration was 9.1 mg/L.
The evidence points to the ability of batch chlorination for maintaining low
THMs production. Despite this, batch chlorination is not recommended as a best
management practice because:
even though HAA and NDMAs are not currently regulated it is unclear
whether or not batch chlorination would promote formation of them, and
the microbiology of the water or the whole water ecosystem may be
altered such that unintended negative outcomes arise.
Regardless, the impacts of batch chlorination appear to persist in the short-term.

33
Nitrogen removal
Total nitrogen or nitrogen derivatives level increase following ozone contact. The
increase is occurring between raw water inflow and the roughing filter, except in July
2012 where total nitrogen removal through the system was about 30% (Supplemental
Tables 5- 7 in Appendix B). The highest nitrogen removal from raw to treated water was
about 30%, which occurred in July of 2012 most likely because of bacterial nitrifiers and
denitrifiers that are most active at water temperatures around 20°C (Figures 11-13)
(Metcalf & Eddie, 2003). That also can be observed in ammonia conversion to nitrate in
BAC filter for the same month. The similar occurrence happened in September 2012. For
the months with cooler water temperature nitrogen removal rates were much smaller.
Figure 11: Changes in nitrate concentrations through the treatment
0
0.2
0.4
0.6
0.8
1
1.2
1.4
1.6
1.8
2
RAW ROUGHING SAND BAC TREATED W CL
Nit
rate
(m
g/L
) 06-Feb-12
30-Apr-12
17-Jul-12
19-Sep-12
20-Nov-12
18-Mar-13

34
Figure 12: Changes in ammonia concentrations through the treatment
Figure 13: Total nitrogen concentration change, percent removal (%) of nitrogen from the raw and
percent removal from the raw coming out of roughing filter is shown
Nitrogen concentrations in source water increased from 1.00 mg/L in April 2012
to 1.5 mg/L in July 2012 and then again to 1.8 mg/L in March 2013. The nitrogen surge
in July could have occurred due to the combination of algal decomposition and nitrogen
0
0.2
0.4
0.6
0.8
1
1.2
1.4
1.6
1.8
2
RAW ROUGHING SAND BAC TREATED W CL
Am
mo
nia
(m
g/L
)
06-Feb-12
30-Apr-12
17-Jul-12
19-Sep-12
20-Nov-12
18-Mar-13
0
0.2
0.4
0.6
0.8
1
1.2
1.4
1.6
1.8
2
RAW ROUGHING SAND BAC TREATED W CL
TN
(m
g/L
)
06-Feb-12
30-Apr-12
17-Jul-12
19-Sep-12
20-Nov-12
18-Mar-13

35
fertilizers run-off, where the nitrogen rise in March 2013 might be attributed primarily to
algal decomposition. Since nitrogen is present in the raw water, it would be helpful to
determine the concentrations of NDMA, if any, in the distribution system
Phosphorous removal
Phosphorous removal through the WTP system ranged from 7 to 42%
(Supplemental Table 8 in Appendix B). Phosphorous concentration in raw water
fluctuated from 0.35 to 0.81 mg/L over the course of the sampling period. Large
increases in phosphorous concentration occurred between April and July 2012 when
measured phosphorous increased from 0.38 to 0.81 mg/L (Figure 14).
Figure 14: Changes in total phosphorous concentrations through the treatment train; concentrations
decreased for all months except July.
0
0.2
0.4
0.6
0.8
1
1.2
1.4
1.6
RAW ROUGH
FILTER
SAND
FILTER
BAC FILTER TREATED
CL
TP
l (m
g/L
)
06-Feb-
1230-Apr-
1217-Jul-12
19-Sep-
1220-Nov-
1218-Mar-
13
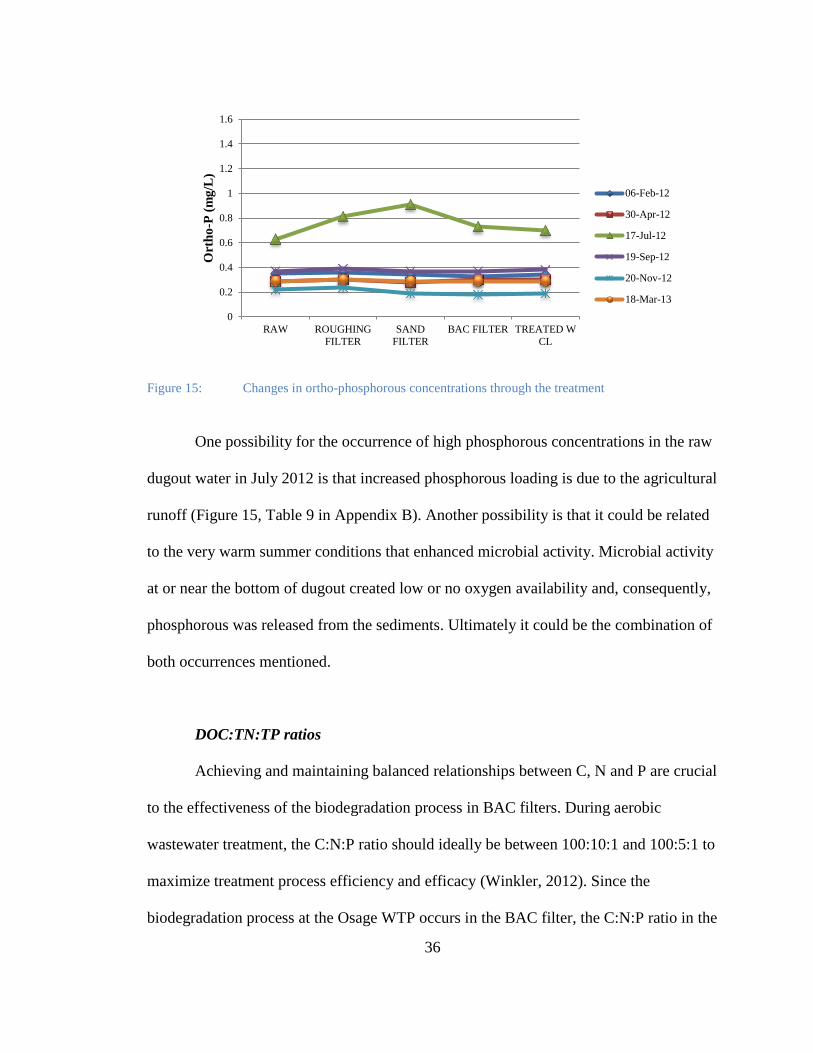
36
Figure 15: Changes in ortho-phosphorous concentrations through the treatment
One possibility for the occurrence of high phosphorous concentrations in the raw
dugout water in July 2012 is that increased phosphorous loading is due to the agricultural
runoff (Figure 15, Table 9 in Appendix B). Another possibility is that it could be related
to the very warm summer conditions that enhanced microbial activity. Microbial activity
at or near the bottom of dugout created low or no oxygen availability and, consequently,
phosphorous was released from the sediments. Ultimately it could be the combination of
both occurrences mentioned.
DOC:TN:TP ratios
Achieving and maintaining balanced relationships between C, N and P are crucial
to the effectiveness of the biodegradation process in BAC filters. During aerobic
wastewater treatment, the C:N:P ratio should ideally be between 100:10:1 and 100:5:1 to
maximize treatment process efficiency and efficacy (Winkler, 2012). Since the
biodegradation process at the Osage WTP occurs in the BAC filter, the C:N:P ratio in the
0
0.2
0.4
0.6
0.8
1
1.2
1.4
1.6
RAW ROUGHING
FILTER
SAND
FILTER
BAC FILTER TREATED W
CL
Ort
ho
-P (
mg
/L)
06-Feb-12
30-Apr-12
17-Jul-12
19-Sep-12
20-Nov-12
18-Mar-13

37
sand filter effluent is the ratio that governs the biological removal of DOC in BAC
(Table 6).
Table 6: C:N:P ratio in sand filter effluent/BAC filter influent at Osage and BAC filter DOC
removal efficiency
OSAGE, BAC FILTER
INFLUENT C:N:P RATIO EFFLUENT
DOC TN TP DOC REMOVAL
Feb. 6, 2012 25 3 1 7%
April 30, 2012 24 3 1 14%
July 17, 2012 7 1 1 13%
September 19, 2012 17 2 1 19%
November 20, 2012 41 5 1 14%
March 18, 2013 32 6 1 14%
Spearman's rank correlation and Kendall's rank correlation with p < 0.05
statistical analyses are used to analyze the performance of the system (Appendix D)
using statistical software R0. Spearman’s rank correlation is a statistical analysis that
measures relationship between two variables without assuming that the relationship is
straight-line; Kendall’s rank correlation measures the strength of the dependence
between the two variables compared. Correlation between DOC and TN, DOC and TP
and Ortho-P as well as correlation between N and TP and N and Ortho-P is presented in
Table 7.

38
Table 7: p-values for Spearman’s rank and Kendall’s rank correlation statistical analysis of DOC
vs. TN, DOC vs. TP, DOC vs. Ortho-P, TN vs. TP, and TN vs. Ortho-P (OP), Osage
OSAGE
Spearman's rank
correlation
Kendall's rank
correlation Spearman's Kendall's
DOC
vs. TN
DOC
vs.TP
DOC vs.
Ortho-P
DOC
vs. TN
DOC
vs. TP
DOC
vs.
Ortho-
P
TN
vs. TP
TN vs.
OP
TN
vs. TP
TN
vs. OP
DATE p-
value p-value p-value p-value p-value p-value
p-
value
p-
value
p-
value
p-
value
Feb. 6, 2012 0.19 0.01 0.06 0.13 0.01 0.08 0.19 0.14 0.13 0.11
Apr.30, 2012 0.01 0.05 0.87 0.02 0.04 0.87 0.11 0.61 0.15 0.59
July 17, 2012 0.02 0.07 0.56 0.03 0.13 0.58 0.07 0.49 0.13 0.42
Sept.19, 2012 0.02 0.03 0.51 0.03 0.03 0.5 0.09 0.38 0.11 0.41
Nov.20, 2012 0.01 0.01 0.01 0.02 0.01 0.02 0.01 0.01 0.02 0.02
Mar.18, 2013 0.25 0.01 0.28 0.22 0.02 0.24 0.22 0.08 0.21 0.07
The only instance in which the correlation between DOC and TN, DOC and TP,
DOC and Ortho-P, TN and TP as well as TN and Ortho-P is unanimously positively
significant is for samples collected in November 2012. During that sampling period, the
C:N:P ratio at the sand filter was 41:5:1 with removal of 10% of total DOC in the water
or 26% of total DOC removed through BAC filter.
The analysis suggests that TP and TN are not limiting substrates in the process. It
is possible, then, that for the current system design the presence of TP and TN in such
large amount does not maximize DOC utilization and removal.
4.2. Hamlet of Benson
During the April 2012 sample collection period, a wide algal mat was apparent
along the edges of the Benson dugout. The algal cover and increase in pH also noted in
April 2012 suggest that algae had been growing under the ice, and after the melt an algal
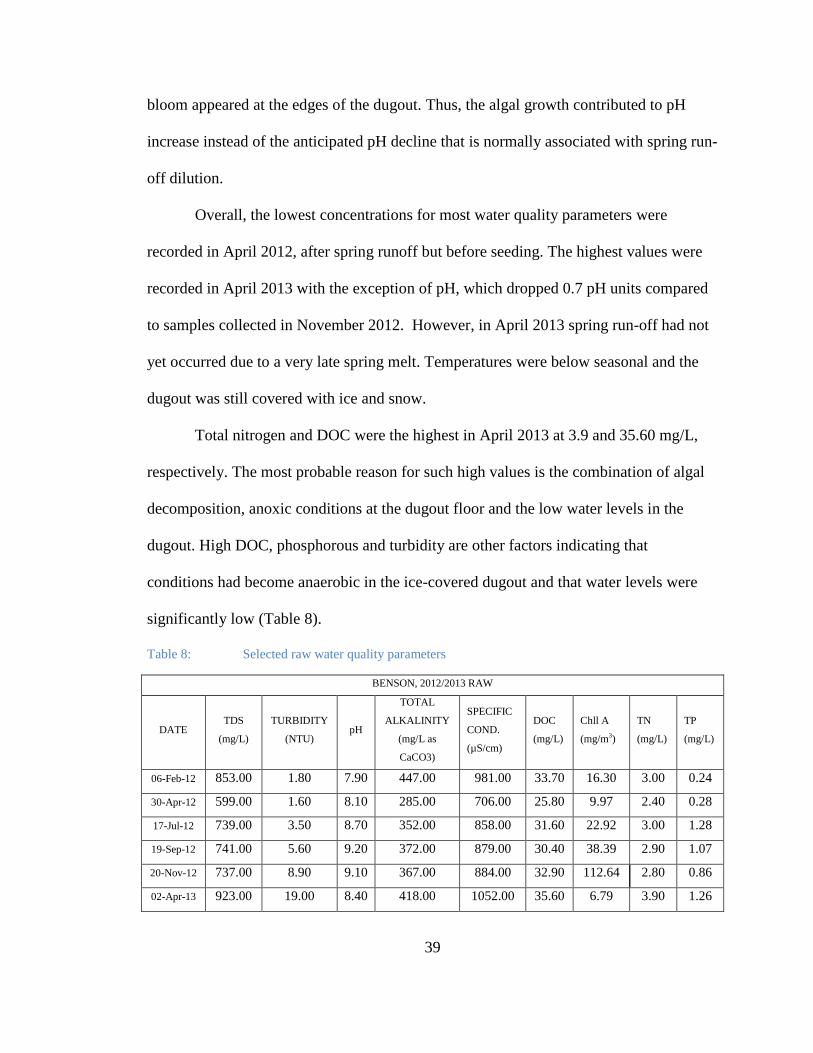
39
bloom appeared at the edges of the dugout. Thus, the algal growth contributed to pH
increase instead of the anticipated pH decline that is normally associated with spring run-
off dilution.
Overall, the lowest concentrations for most water quality parameters were
recorded in April 2012, after spring runoff but before seeding. The highest values were
recorded in April 2013 with the exception of pH, which dropped 0.7 pH units compared
to samples collected in November 2012. However, in April 2013 spring run-off had not
yet occurred due to a very late spring melt. Temperatures were below seasonal and the
dugout was still covered with ice and snow.
Total nitrogen and DOC were the highest in April 2013 at 3.9 and 35.60 mg/L,
respectively. The most probable reason for such high values is the combination of algal
decomposition, anoxic conditions at the dugout floor and the low water levels in the
dugout. High DOC, phosphorous and turbidity are other factors indicating that
conditions had become anaerobic in the ice-covered dugout and that water levels were
significantly low (Table 8).
Table 8: Selected raw water quality parameters
BENSON, 2012/2013 RAW
DATE TDS
(mg/L)
TURBIDITY
(NTU) pH
TOTAL
ALKALINITY
(mg/L as
CaCO3)
SPECIFIC
COND.
(µS/cm)
DOC
(mg/L)
Chll A
(mg/m3)
TN
(mg/L)
TP
(mg/L)
06-Feb-12 853.00 1.80 7.90 447.00 981.00 33.70 16.30 3.00 0.24
30-Apr-12 599.00 1.60 8.10 285.00 706.00 25.80 9.97 2.40 0.28
17-Jul-12 739.00 3.50 8.70 352.00 858.00 31.60 22.92 3.00 1.28
19-Sep-12 741.00 5.60 9.20 372.00 879.00 30.40 38.39 2.90 1.07
20-Nov-12 737.00 8.90 9.10 367.00 884.00 32.90 112.64 2.80 0.86
02-Apr-13 923.00 19.00 8.40 418.00 1052.00 35.60 6.79 3.90 1.26
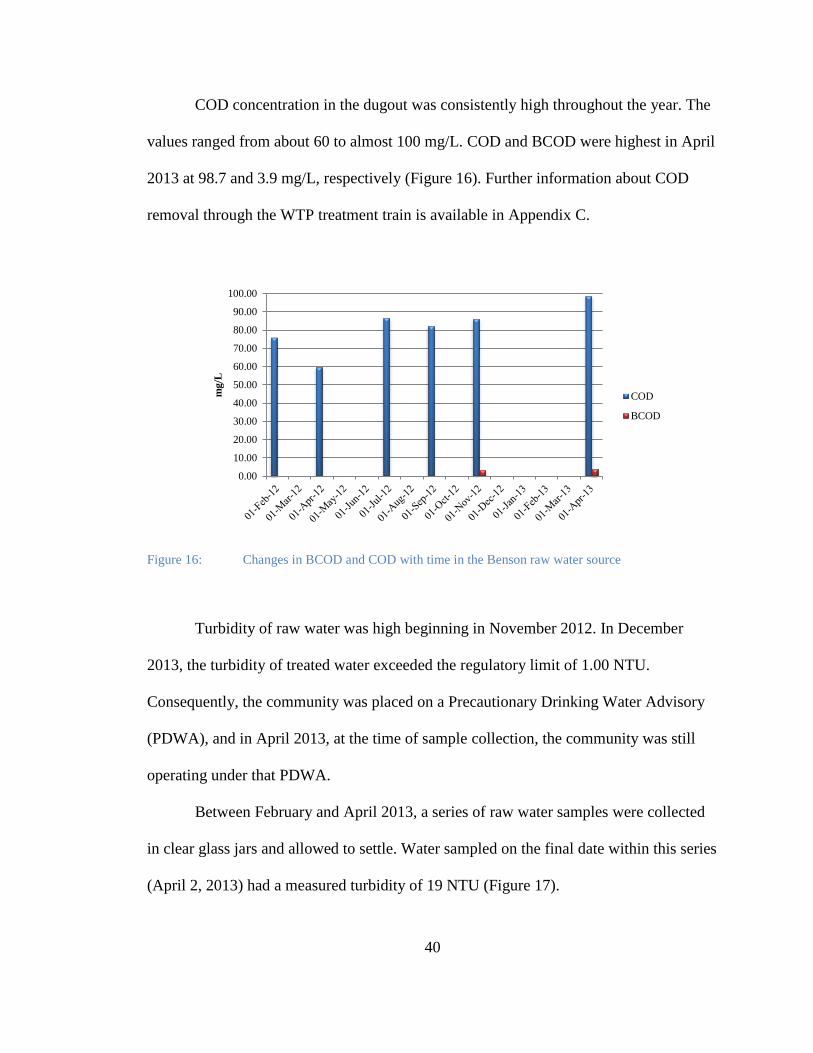
40
COD concentration in the dugout was consistently high throughout the year. The
values ranged from about 60 to almost 100 mg/L. COD and BCOD were highest in April
2013 at 98.7 and 3.9 mg/L, respectively (Figure 16). Further information about COD
removal through the WTP treatment train is available in Appendix C.
Figure 16: Changes in BCOD and COD with time in the Benson raw water source
Turbidity of raw water was high beginning in November 2012. In December
2013, the turbidity of treated water exceeded the regulatory limit of 1.00 NTU.
Consequently, the community was placed on a Precautionary Drinking Water Advisory
(PDWA), and in April 2013, at the time of sample collection, the community was still
operating under that PDWA.
Between February and April 2013, a series of raw water samples were collected
in clear glass jars and allowed to settle. Water sampled on the final date within this series
(April 2, 2013) had a measured turbidity of 19 NTU (Figure 17).
0.00
10.00
20.00
30.00
40.00
50.00
60.00
70.00
80.00
90.00
100.00
mg
/L
COD
BCOD

41
Figure 17: Raw water samples collected over 2 month period during PDWA. Cloudy and turbid
water is due to the colloidal matter suspension from the dugout
The colloidal matter collected on the bottom of the sample jars permitted visual
observation of colloidal type and structure. That collected on March 15, 2013 was
observed to be heavier and settled out more rapidly than colloidal material in samples
collected in February. Based on the photograph in Figure 17, it may be noted that the
colloids in the February 28 sample was still settling out at the time of the picture, April
2, 2013.
Since colloids can be mobilized when low ionic strength water mixes with high
strength water, it is possible that seepage and mixing of ground water with surface water
had caused colloidal displacement. Another possibility is that under-ice convection

42
occurred. As the biodegradation of organic matter occurred on the bottom of the dugout,
sediments slowly warmed due to bacteriological metabolism. In turn the water warmed
as well (3 to 5 ºC) on the bottom creating a temperature difference between the upper
and lower layers of water. Eventually, the temperature difference is sufficiently high that
under-ice convection happens, disturbing the sediments and colloids on the bottom of the
dugout (Terzhevik and Golosov, 2012) and dispersing them throughout the water
column.
Degradation of organic matter was similarly evident from increased level of DOC
and decreased concentration of chlorophyll A, as well as pH shifts from November to
April (Table 8). It is possible that different salinity in each layer of water due to the
mineralization of the organic matter may have further contributed to under-ice
convection (Boehrer, 2012). DOC was highest in April 2013, whereas Chlorophyll A
was highest in November 2012 (Figure 18).
Figure 18: Changes in DOC and Chlorophyll A concentrations in raw water
0
20
40
60
80
100
120
0
5
10
15
20
25
30
35
40
DOC
(mg/L)
CHLL A
(ug/L)
DO
C m
g/L
CH
LL
A
µg/L

43
As with Osage, samples were collected in February and September to test for the
presence of phenoxy herbicides. The results indicated that all herbicides were below the
detection limit.
In July 2012, shortly before the water sample was collected, copper sulphate was
applied to the dugout to control algal growth. The concentration of copper in the water
sample collected after the application was 60.4 µg/L; Chll A concentration in the same
sample was 22.92 mg/m3. Analyses of samples collected in September 2012 indicate,
however, that [Cu] has dropped three (3) times the original concentration down to 18.7
µg/L while Chll A had increased to 33.39 mg/m3 in the raw water source. In November
2012 [Cu] was even lower at 13.3 µg/L and Chll A had quadrupled to 112.64 mg/m3.
The total nitrogen level in the dugout fluctuated from 2.4 to 3.9 mg/L (Figure
19).
Figure 19: Changes in TN and its components in the raw water over time
0.00
0.50
1.00
1.50
2.00
2.50
3.00
3.50
4.00
4.50
mg
/L
NITROGEN
TOTAL
TKN
NITRATE-N
AMMONIA-N
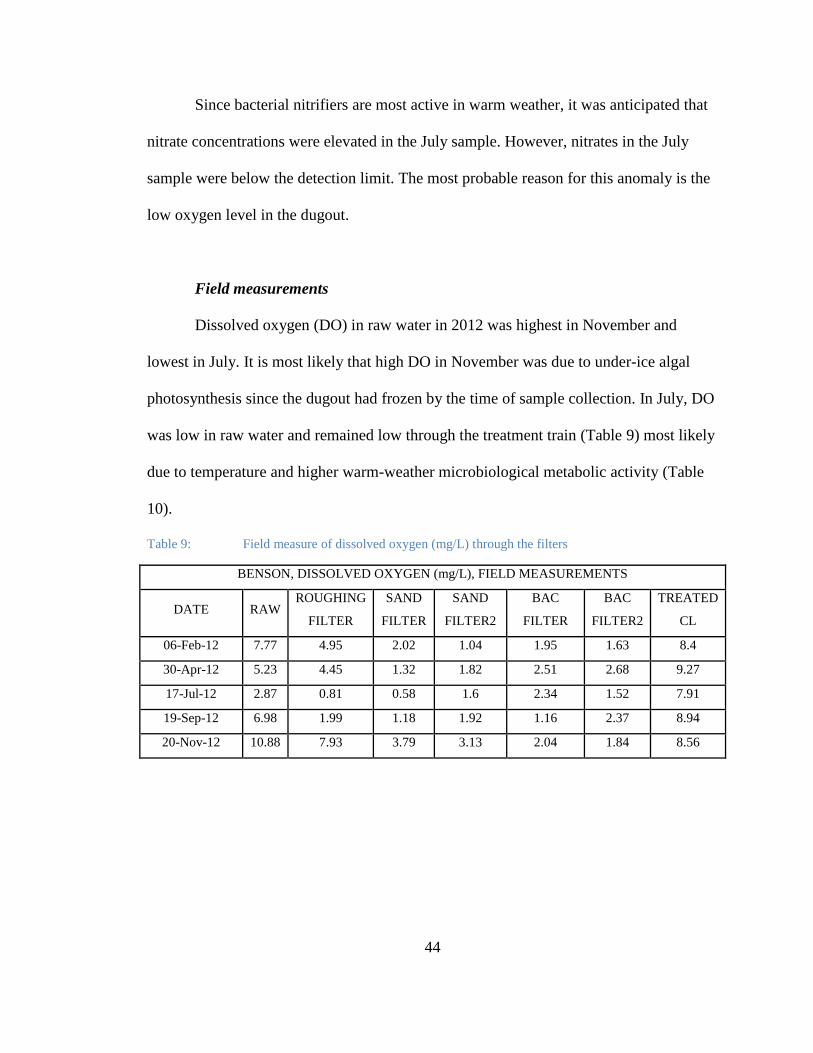
44
Since bacterial nitrifiers are most active in warm weather, it was anticipated that
nitrate concentrations were elevated in the July sample. However, nitrates in the July
sample were below the detection limit. The most probable reason for this anomaly is the
low oxygen level in the dugout.
Field measurements
Dissolved oxygen (DO) in raw water in 2012 was highest in November and
lowest in July. It is most likely that high DO in November was due to under-ice algal
photosynthesis since the dugout had frozen by the time of sample collection. In July, DO
was low in raw water and remained low through the treatment train (Table 9) most likely
due to temperature and higher warm-weather microbiological metabolic activity (Table
10).
Table 9: Field measure of dissolved oxygen (mg/L) through the filters
BENSON, DISSOLVED OXYGEN (mg/L), FIELD MEASUREMENTS
DATE RAW ROUGHING
FILTER
SAND
FILTER
SAND
FILTER2
BAC
FILTER
BAC
FILTER2
TREATED
CL
06-Feb-12 7.77 4.95 2.02 1.04 1.95 1.63 8.4
30-Apr-12 5.23 4.45 1.32 1.82 2.51 2.68 9.27
17-Jul-12 2.87 0.81 0.58 1.6 2.34 1.52 7.91
19-Sep-12 6.98 1.99 1.18 1.92 1.16 2.37 8.94
20-Nov-12 10.88 7.93 3.79 3.13 2.04 1.84 8.56

45
Table 10: Field measurement of water temperature change through the treatment train
BENSON, TEMPERATURE (⁰C), FIELD MEASUREMENTS
DATE RAW ROUGHING
FILTER
SAND
FILTER
SAND
FILTER2
BAC
FILTER
BAC
FILTER2
TREATED
CL
06-Feb-12 14.1 12.5 14.8 11.7 10.8 13.2 13.8
30-Apr-12 10.5 9.5 9.9 10.9 11.5 11.2 13.9
17-Jul-12 15.3 14.6 15.3 15 15.7 16.2 17.5
19-Sep-12 14.5 15.2 15.3 15.4 16.2 16.4 17
20-Nov-12 9 9.3 9.3 9.3 10.1 10.1 13.3
DOC removal
As noted previously, the effectiveness of DOC removal from water is alkalinity
dependant. The higher alkalinity in the water the more difficult DOC removal becomes.
Alkalinity production/ consumption at this water treatment plant are seemingly
insignificant (Table 11). However, a closer look at the bicarbonate, carbonate and phenol
alkalinity shows that as phenol and carbonate alkalinity are consumed, bicarbonate
alkalinity is similarly produced. Carbonate and phenol alkalinity were present in four of
six raw water samples collected (Figures 20- 24).
Table 11: Changes in total alkalinity through the WTP and with time. Values for sand and BAC
filters are presented as the average of each filter set.
ALKALINITY (mg/L as CaCO3), BENSON, 2012/2013
ALKALINITY
(mg/L as CaCO3) RAW
ROUGHING
FILTER
SAND FILTERS
average
BAC FILTER
average
TREATED
with Cl
06-Feb-12 447 445 447 448 458
30-Apr-12 285 278 271 284 292
17-Jul-12 352 352 356 346 341
19-Sep-12 372 372 373 369 367
20-Nov-12 367 366 364 360 364
02-Apr-13 219 * * * 198
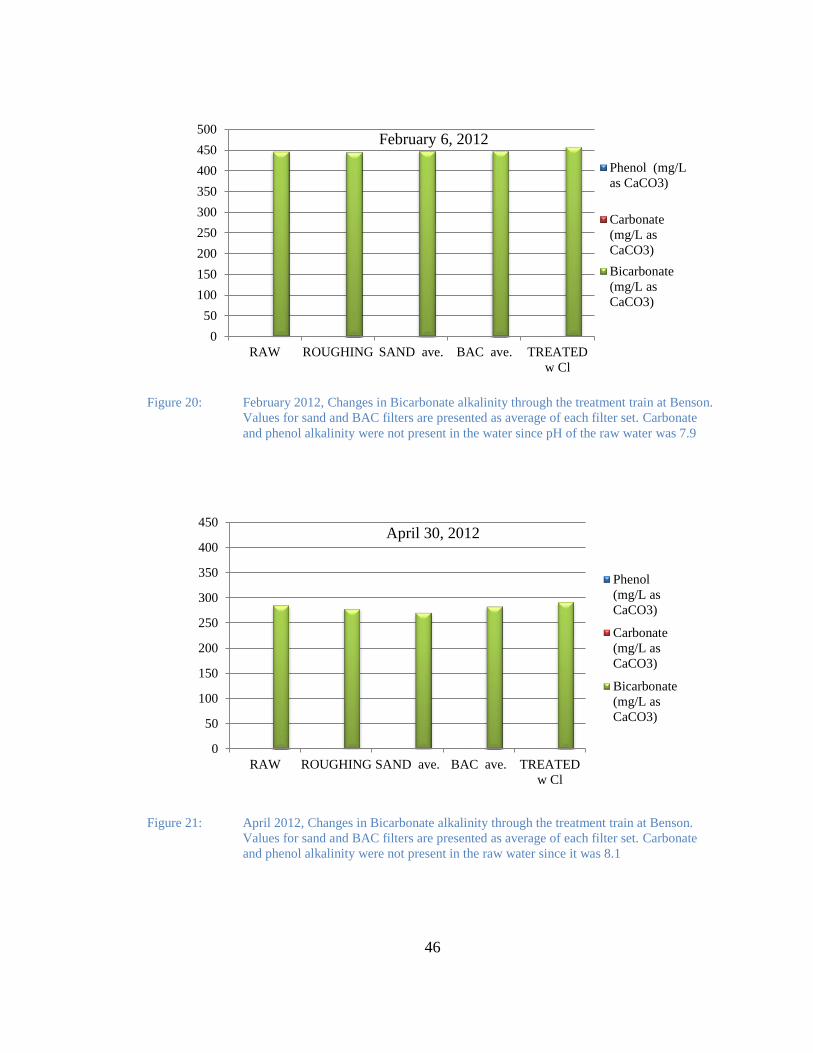
46
Figure 20: February 2012, Changes in Bicarbonate alkalinity through the treatment train at Benson.
Values for sand and BAC filters are presented as average of each filter set. Carbonate
and phenol alkalinity were not present in the water since pH of the raw water was 7.9
Figure 21: April 2012, Changes in Bicarbonate alkalinity through the treatment train at Benson.
Values for sand and BAC filters are presented as average of each filter set. Carbonate
and phenol alkalinity were not present in the raw water since it was 8.1
0
50
100
150
200
250
300
350
400
450
500
RAW ROUGHING SAND ave. BAC ave. TREATED
w Cl
February 6, 2012
Phenol (mg/L
as CaCO3)
Carbonate
(mg/L as
CaCO3)
Bicarbonate
(mg/L as
CaCO3)
0
50
100
150
200
250
300
350
400
450
RAW ROUGHING SAND ave. BAC ave. TREATED
w Cl
April 30, 2012
Phenol
(mg/L as
CaCO3)
Carbonate
(mg/L as
CaCO3)
Bicarbonate
(mg/L as
CaCO3)

47
Figure 22: July 2012, Changes in Bicarbonate, carbonate and phenol alkalinity through the
treatment train at Benson. Values for sand and BAC filters are presented as average of
each filter set. Carbonate and phenol alkalinity appear since the pH of the raw was 8.7
Figure 23: September 2012, Changes in Bicarbonate, carbonate and phenol alkalinity through the
treatment train at Benson. Values for sand and BAC filters are presented as average of
each filter set. Raw water pH was 9.2
0
50
100
150
200
250
300
350
400
450
RAW ROUGHING SAND ave. BAC ave. TREATED
w Cl
July 17, 2012
Phenol
(mg/L as
CaCO3)
Carbonate
(mg/L as
CaCO3)
Bicarbonate
(mg/L as
CaCO3)
0
50
100
150
200
250
300
350
400
450
RAW ROUGHING SAND ave. BAC ave. TREATED w
Cl
September 19, 2012
Phenol
(mg/L as
CaCO3)
Carbonate
(mg/L as
CaCO3)
Bicarbonate
(mg/L as
CaCO3)

48
Figure 24: November 2012, Changes in Bicarbonate, carbonate and phenol alkalinity through the
treatment train at Benson. Values for sand and BAC filters are presented as average of
each filter set. Raw water pH was 9.1
Where ozone is applied as a pre-oxidant, carbonate alkalinity must be taken into
consideration. Carbonate alkalinity is a stronger scavenger than bicarbonate alkalinity
with respective reaction rates of k= 4.2x10⁸ M
-1s
-1 and k= 1.5x10
7 M
-1s
-1 (Gottschalk, et
al. 2010). In both September and November, the carbonate alkalinity was not completely
removed by the ozone application.
Carbon media in the BAC filters was replaced on July 28, 2012. DOC removed
through BAC filter prior to the AC replacement ranged from 23% in February to 54% in
July 2012. After the activated carbon replacement DOC removal through the AC filter
was 79% in September and 76% in November 2012 (Figure 25).
0
50
100
150
200
250
300
350
400
450
RAW ROUGHING SAND ave. BAC ave.TREATED w Cl
November 20, 2012
Phenol
(mg/L as
CaCO3)
Carbonate
(mg/L as
CaCO3)
Bicarbonate
(mg/L as
CaCO3)

49
Figure 25: Changes in DOC removal through the treatment before and after AC replacement,
Benson 2012
The data from April sampling showed that DOC in the raw water was 35.6 mg/L
and in final treated water DOC level was 25.4 mg/L. These values indicate that the
activated carbon (AC) media had begun to saturate and exhibit lower adsorption ability
since the DOC removal through the complete treatment train was 29%.
In 2012, the average of seasonal THMs samples results exceeded 100 µg/L. The
bi-monthly results ranged between 176 and 373 µg/L (Figure 26). Dashed red line shows
the regulatory limit set for THMs. There is no set regulatory limit for DOC in treated
water. On April 2, 2013 a THMs sample was not collected.
10
15
20
25
30
35
RAW ROUGHING SAND ave. BAC ave WITH Cl
DO
C (
mg/L
)
06-Feb-12
30-Apr-12
17-Jul-12
19-Sep-12
20-Nov-12

50
Figure 26: Benson, DOC in raw water, treated water and THMs in treated water at the plant
Nitrogen removal
The concentration of nitrogen was reduced following ozone oxidation in all
samples except for that taken in July. Total nitrogen removal through the system is
anywhere from 27 to 62 % (Supplemental Table 14, Appendix C). Nitrogen removal was
greater after AC media replacement, indicating that removal was due primarily to
adsorption rather than biological degradation (Figure 27).
0.00
50.00
100.00
150.00
200.00
250.00
300.00
350.00
400.00
0.00
5.00
10.00
15.00
20.00
25.00
30.00
35.00
40.00DOC RAW
(mg/L)
DOC
TREATED(mg/L)
THM
(µg/L)D
OC
TH
M (
µg/L
)

51
Figure 27: Change in TN concentration through the treatment. Removal of TN in September and
November is mainly due to the AC adoption and not biological degradation
Nitrates were absent from the raw in July and November (Figure 28). The low
level of nitrates or lower activity of nitrifiers in November was most likely related to low
water temperature whereas the probable reason for absence of nitrates in July was lack of
oxygen on the bottom of the dugout, elevated pH of 8.7 and presence of heavy metals.
Nitrifiers are highly sensitive to heavy metals such as Hg, Cu, Ni, Zn, Au, etc (Metcalf
&Eddie, 2003). No denitrification occurred through AC in September and November
2012 indicating that filter did not mature into BAC filter yet and confirming that
contaminants from the water were removed by adsorption still.
0
0.5
1
1.5
2
2.5
3
3.5
RAW ROUGHING SAND ave BAC ave TREATED with Cl
N-t
ota
l (m
g/L
)
06-Feb-12
30-Apr-12
17-Jul-12
19-Sep-12
20-Nov-12

52
Figure 28: Nitrate concentrations and changes through the treatment
The only time when ammonia was absent from the raw was in November (Figure
29). The highest levels of ammonia were in July and September. The most likely reason
is that heavy organics load, warm temperatures and low oxygen in the raw water.
Figure 29: Ammonia fluctuations during the treatment.
0
0.1
0.2
0.3
0.4
0.5
0.6
0.7
RAW ROUGHING SAND average BAC averageTREATED with Cl
Nit
rate
-N (
mg
/L)
06-Feb-12
30-Apr-12
17-Jul-12
19-Sep-12
20-Nov-12
0
0.1
0.2
0.3
0.4
0.5
0.6
0.7
RAW ROUGHING SAND average BAC average TREATED W
CL
Am
mo
nia
-N (
mg
/L)
06-Feb-12
30-Apr-12
17-Jul-12
19-Sep-12
20-Nov-12
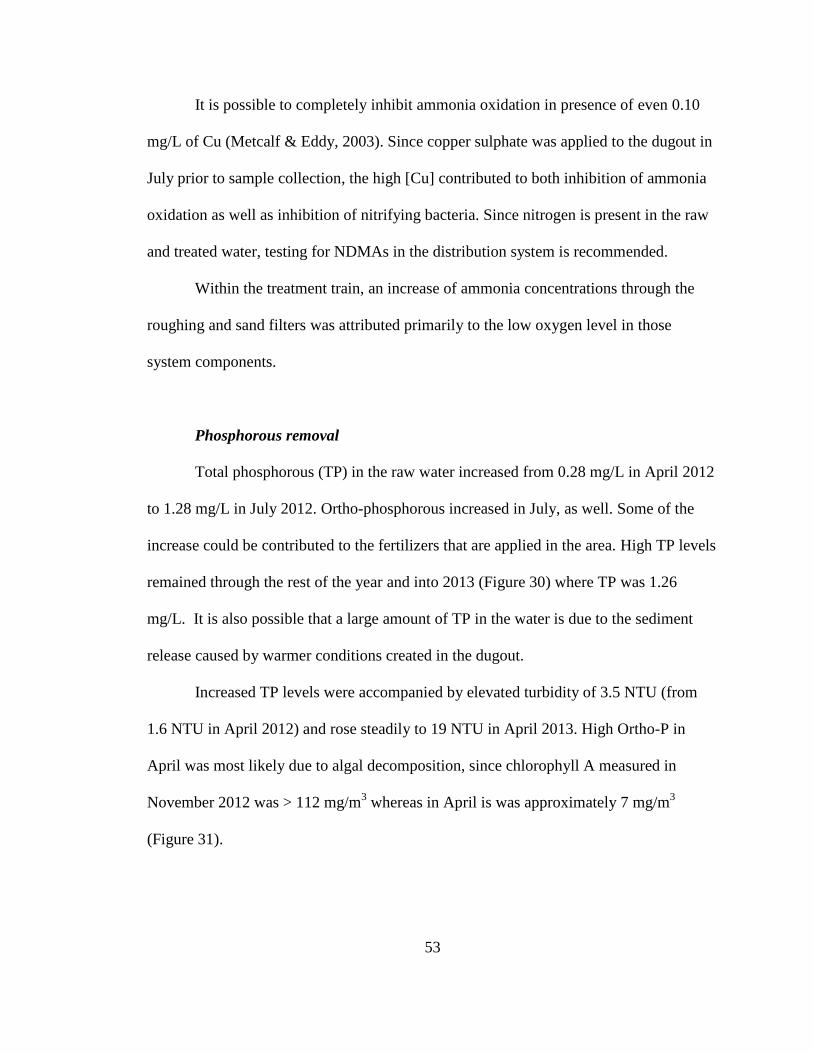
53
It is possible to completely inhibit ammonia oxidation in presence of even 0.10
mg/L of Cu (Metcalf & Eddy, 2003). Since copper sulphate was applied to the dugout in
July prior to sample collection, the high [Cu] contributed to both inhibition of ammonia
oxidation as well as inhibition of nitrifying bacteria. Since nitrogen is present in the raw
and treated water, testing for NDMAs in the distribution system is recommended.
Within the treatment train, an increase of ammonia concentrations through the
roughing and sand filters was attributed primarily to the low oxygen level in those
system components.
Phosphorous removal
Total phosphorous (TP) in the raw water increased from 0.28 mg/L in April 2012
to 1.28 mg/L in July 2012. Ortho-phosphorous increased in July, as well. Some of the
increase could be contributed to the fertilizers that are applied in the area. High TP levels
remained through the rest of the year and into 2013 (Figure 30) where TP was 1.26
mg/L. It is also possible that a large amount of TP in the water is due to the sediment
release caused by warmer conditions created in the dugout.
Increased TP levels were accompanied by elevated turbidity of 3.5 NTU (from
1.6 NTU in April 2012) and rose steadily to 19 NTU in April 2013. High Ortho-P in
April was most likely due to algal decomposition, since chlorophyll A measured in
November 2012 was > 112 mg/m3 whereas in April is was approximately 7 mg/m
3
(Figure 31).

54
Figure 30: TP initial concentration and change in the water throughout the treatment at Benson
Figure 31: Ortho phosphorous concentrations and changes through the treatment
0
0.2
0.4
0.6
0.8
1
1.2
1.4
1.6
RAW ROUGH SAND ave BAC ave TREATED
CL
TP
(m
g/L
)
06-Feb-12
30-Apr-12
17-Jul-12
19-Sep-12
20-Nov-12
0
0.2
0.4
0.6
0.8
1
1.2
1.4
1.6
RAW ROUGH SAND ave BAC ave TREATED
CL
OR
TH
O-P
(m
g/L
)
06-Feb-12
30-Apr-12
17-Jul-12
19-Sep-12
20-Nov-12

55
DOC:TN:TP ratios
Biological removal of DOC in Benson water treatment plant was observed in the
BAC filters. Details about the C:N:P ratio in sand filter effluent and DOC removal
efficiency in the BAC filter is given in Table 12. September and November 2012 DOC
removal through the BAC filter was due to the adsorption and therefore high removal
percentage of 52 and 44% respectively.
Table 12: C: N: P ratio in sand filter effluent/ BAC filter influent at Osage and BAC filter DOC
removal efficiency, Benson. September and November DOC removal through the BAC
was due to the adsorption to activated carbon media.
BENSON
SAND FILTER C:N:P
RATIO BAC FILTER
DOC TN TP DOC REMOVAL
Feb. 6, 2012 168 15 1 9%
April 30, 2012 102 9 1 16%
July 17, 2012 20 2 1 11%
Sept. 19, 2012 22 2 1 52%
Nov. 20, 2012 57 5 1 44%
Spearman's rank correlation and Kendall's rank correlation with p < 0.05
statistical analyses are used to analyze the performance of the system (Appendix D).
Correlation between DOC and TN, DOC and TP and Ortho-P as well as correlation
between N and TP and N and Ortho-P is presented in Table 13.
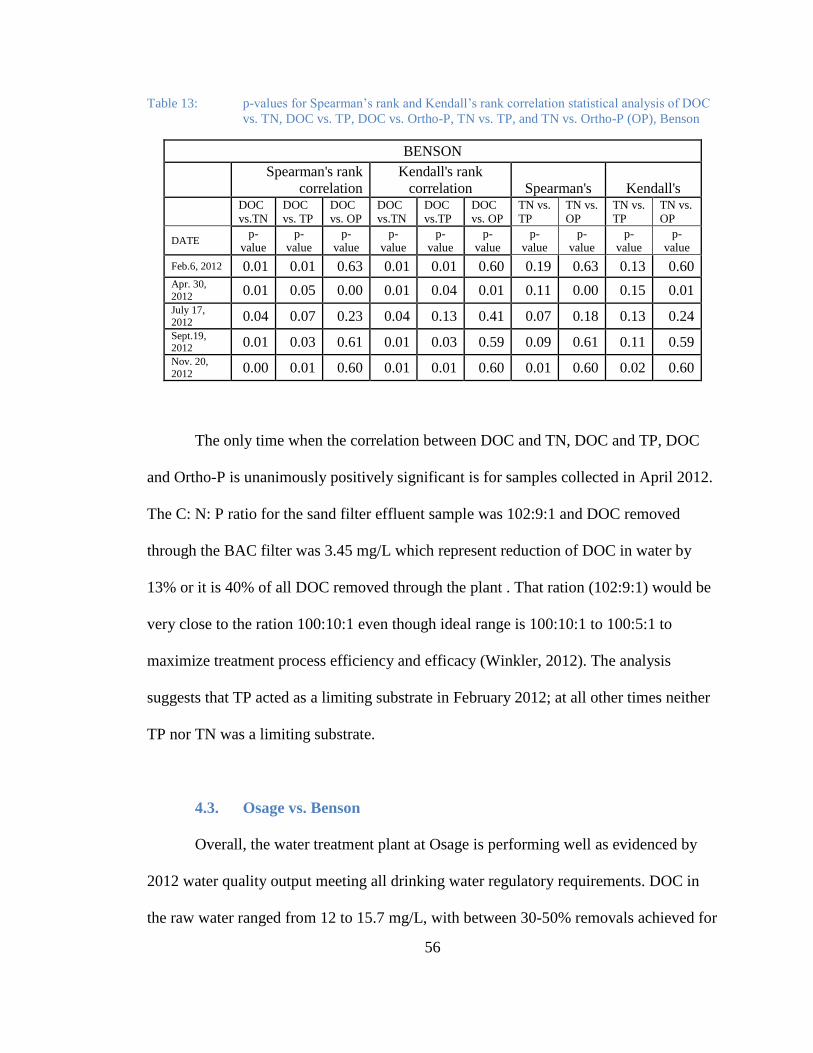
56
Table 13: p-values for Spearman’s rank and Kendall’s rank correlation statistical analysis of DOC
vs. TN, DOC vs. TP, DOC vs. Ortho-P, TN vs. TP, and TN vs. Ortho-P (OP), Benson
BENSON
Spearman's rank
correlation
Kendall's rank
correlation Spearman's Kendall's
DOC
vs.TN
DOC
vs. TP
DOC
vs. OP
DOC
vs.TN
DOC
vs.TP
DOC
vs. OP
TN vs.
TP
TN vs.
OP
TN vs.
TP
TN vs.
OP
DATE p-
value
p-
value
p-
value
p-
value
p-
value
p-
value
p-
value
p-
value
p-
value
p-
value
Feb.6, 2012 0.01 0.01 0.63 0.01 0.01 0.60 0.19 0.63 0.13 0.60 Apr. 30,
2012 0.01 0.05 0.00 0.01 0.04 0.01 0.11 0.00 0.15 0.01
July 17,
2012 0.04 0.07 0.23 0.04 0.13 0.41 0.07 0.18 0.13 0.24
Sept.19, 2012 0.01 0.03 0.61 0.01 0.03 0.59 0.09 0.61 0.11 0.59
Nov. 20,
2012 0.00 0.01 0.60 0.01 0.01 0.60 0.01 0.60 0.02 0.60
The only time when the correlation between DOC and TN, DOC and TP, DOC
and Ortho-P is unanimously positively significant is for samples collected in April 2012.
The C: N: P ratio for the sand filter effluent sample was 102:9:1 and DOC removed
through the BAC filter was 3.45 mg/L which represent reduction of DOC in water by
13% or it is 40% of all DOC removed through the plant . That ration (102:9:1) would be
very close to the ration 100:10:1 even though ideal range is 100:10:1 to 100:5:1 to
maximize treatment process efficiency and efficacy (Winkler, 2012). The analysis
suggests that TP acted as a limiting substrate in February 2012; at all other times neither
TP nor TN was a limiting substrate.
4.3. Osage vs. Benson
Overall, the water treatment plant at Osage is performing well as evidenced by
2012 water quality output meeting all drinking water regulatory requirements. DOC in
the raw water ranged from 12 to 15.7 mg/L, with between 30-50% removals achieved for
57
the treated water. The Benson WTP achieved DOC removal rates between 20-59%
representing about 6 to 17 mg/L of DOC. Considering the very high raw water DOC
concentrations between 25 and 35 mg/L with total alkalinity over 400 mg/L as CaCO3
this represents a significant amount removed. However, the remaining DOC in treated
water remains too high to meet the THMs regulations.
The Benson WTP faced challenges through the sample period, including some
deviations from the regulatory requirements. THM concentrations were consistently
above 100 µg/L throughout the sampling period. DOC in raw water ranged from 25.8 to
35.6 mg/L, and removal of DOC ranged from 20 to 59%. However, DOC in potable
water was never below 12.6 mg/L.
Based on the results of this research, ozone performance appears to be more
efficient at Osage than Benson. However, these results are most likely related to the raw
water quality at Benson which has resulted in poorer performance. The dugouts in both
communities are located in the agricultural fields and are recharged by runoff. However,
the Benson dugout receives spring melt water from the creek that stretches an additional
50 km west running through agricultural fields with active oil wells.
Several water quality parameters can impede ozone performance, including the
type and amount of salts present. Additionally, the presence of high COD and organic
carbons (DOC) may have significant impacts on ozone efficacy. At the two field sites,
the COD in Osage raw water ranges between 30 and 40 mg/L while that in Benson
ranges from about 60 to almost 100 mg/L. The high alkalinity (bicarbonate, carbonations
and phenol), DOC and COD in Benson raw water are most probably the combined
reason for ozone scavenging and poor DOC removal.

58
In addition to ozone performance differences, the performance of the BAC filters
also differs between the two communities. The Benson WTP appears to be more efficient
than that at Osage. The amount of DOC removed in the BAC filter at Benson vs. Osage
in February, April and July 2012 is 0.6, 1.1 and 0.9 mg/L vs. 6.2, 4.25 and 3.85 mg/L.
The Benson BAC filters are exposed to higher nutrients concentrations and also feature
larger surface area than the Osage BAC filters. Samples collected during September and
November at Benson cannot be considered under the same series of analyses due to the
presence of new AC media which precluded biological performance.
Due to the location of the Benson dugout, this particular raw water would benefit
greatly from a source water protection program. It is recommended that both the dugout
and creek incorporate buffer zones to reduce agricultural and oil well impacts on raw
water quality. Additional features of a source water protection plan for Benson should
include stream bed improvements within the source creek. For example, creating a
stream bed that forces water to cascade through the bed would not only increase aeration,
but would also minimize sediment deposit in the dugout.
In Osage, a larger buffer zone should be designed. The high turbidity values that
occur during seasonal changes can be addressed in part by source water protection
planning. However, additional WTP design options may be considered for both Benson
and Osage making use of dual media up-flow roughing filters that would reduce turbidity
since heavier particles would be restricted by the dual media in the filter. The further
benefit of this design makes effective use of gravity settling such that heavier particles
will settle in the roughing filter and not be transmitted further in the WTP.

59
In both communities, more powerful aeration unit(s) capable of aerating dugouts
throughout the water column, such as air diffusers, should be installed.
For ozonation of water where high total alkalinity is present, rural communities
should consider installation of treatment components:
1. UV light in addition to ozone to maximize oxidation power, or
2. An ozone system in series so that water exiting one tank contains ozone
residual while receiving ozone coming into another tank. An ozone
injector (such as the Mazzei or similar model) can minimize the diameter
of the ozone bubbles, thereby maximizing the surface area and oxidation
potential, or
3. A small dose of O3 prior to coagulation (in systems using coagulation) to
maximize the effects (AWWA, 1991).
Where possible, the treatment train should be designed in series rather than
parallel to ensure steady flow at all times. Filters designed in parallel are capable of
treating greater volume of water, where filters designed in series have greater
contaminant removal capacity (IRC International Water and Sanitation Centre, 2006).
Use of water meters and valves to ensure steady flow for all filters at all times is highly
recommended.
To ensure that occupational health and safety requirements are achieved, an
ozone gas detector and protective gas masks should be available at every WTP, in
addition to any further site specific and general WTP safety protocols and equipment.
Lastly, municipality using surface water with an ozone assisted BAC filtration
system should consider the following design issues:

60
1) Gauging based on following parameters:
a) Turbidity – it has been noticed that when average monthly turbidity is less than 3
NTU the system is able to produce water that meets regulatory standard as
outlined in The Water Regulations, 2002, section 33.
b) High total alkalinity/ salinity - presence of carbonate and phenol alkalinity and
ionic strength of the water/ depending on type of salts in the water it will increase
demand of and inhibit the effectiveness of O3. Consequently, DOC degradation
will decrease.
c) Determine:
i) DOC concentration-know the annual range of DOC in raw water.
ii) Range of nitrogen and phosphorous in the raw water in order to assess the
performance of the system
2) The following parameters should be monitored:
a. Removal of DOC should be the parameter governing the performance status of
the plant.
b. Ozone dosage- for optimal reduction in DOC and consequently reduction in DBP
formation typical ozone dosage is between 0.5 g to 2 g of O3/g of DOC initially
present (Gottschalk et al, 2010). If greater than 2 g of O3/g of DOC initially
present dose of ozone is required benefit-cost analysis and sustainability of the
system analysis should be done prior to the installation. Ozone dose that is
applied in summer vs. ozone dose that is applied in winter should be determined.
c. The annual COD range- range of COD in water should be good indicator of
ozonation performance. The COD of the water will show demand for O3;
61
however it is not an indication of DOC removal. COD reduction will show that
DOC transformation occurred (from one compound into other) where DOC
reduction will show mineralization of DOC and its actual removal.
3) Consider installing system in parallel that has optimized ozone oxidation system with
deozonation chamber, an up flow dual or multi-media roughing filter(s), sand filter(s)
and BAC filter with aeration. If parallel installation is not feasible or economical
install water meters or valves to ensure steady flow for all filters at all times.
4.4 Microbial Diversity - Village of Osage
Microbial composition of the dugout was evaluated in September 2012 and
March 2013. The microbial community from the Osage dugout in September 2012
shows high alpha diversity in relation to the other samples collected at Osage and
Benson. Alpha diversity is the distribution of species-level observation in a data set
(MG-RAST, 2013). Osage raw water and BAC media metagenomic samples with
quality control results are summarized in the Table 14.

62
Table 14: Metagenomic analysis of environmental samples collected at Osage, (MG-RAST, 2013).
SAMPLE Quality Control ribosomal RNA genes
ALPHA DIVERSITY
BY
PHYLUM in
FIGURE PASS (%) FAIL (%) YES (%) NO (%)
G (raw, fall
19/09/2012)
99.4 0.6 94.9 4.5 56 16
N (raw, spring
18/03/2013)
99.6 0.4 98.7 0.9 47 16
H (BAC top) 99.4 0.6 97.7 1.7 19 18
I (BAC
middle)
99.4 0.6 97.2 2.3 21 18
J (BAC
bottom)
99.4 0.6 98.1 1.3 22 18
For both raw water samples, fall (G) and spring (N) the most abundant bacterial
phylum is Cyanobacteria (around 20%) and Bacteriodetes (around 20%), followed by
Proteobacteria (16%) for the fall sample, and Actinobacteria (14%) for the spring
sample. For both samples, the cyanobacteria Aphanizomenon and Dolichospermum (8%)
are the predominant group. Over 30% of bacteria in both samples are unclassified.

63
Figure 32: Raw water samples from Osage dugout collected on September 19, 2012 (G), and
sample collected on March 18, 2013 (N) are sorted by phylum abundance (%) and
compared to each other
0.0001 0.01 1 100
Acidobacteria
Actinobacteria
Aquificae
Bacteroidetes
Chlamydiae
Chloroflexi
Cyanobacteria
Deinococcus-Thermus
Dictyoglomi
Fibrobacteres
Firmicutes
Fusobacteria
Gemmatimonadetes
Lentisphaerae
Nitrospirae
Planctomycetes
Proteobacteria
Spirochaetes
Synergistetes
Tenericutes
Verrucomicrobia
unclassified (derived…
%
N, raw Osage
08-03-2013
G, raw Osage
09-19-2012

64
Based on the figure 32 it seems that chlorination of the dugout did not
significantly change the microbial communities of the dugout or that the bacterial
community bounced back to whatever it was previously. However, alphc diversity did
change from 56 in fall to 47 in spring sample. From here, it is not clear if the alpha
diversity has chnaged due to the cold weather or is it that chlorination of the dugout has
altered the community’ diveristy or is it combiation of both.
The core sample, about 90 cm long, from the Osage BAC filter was split into 3
samples- top 1/3 of the filter (sample H), second 1/3 of the filter (sample I) and bottom
1/3 of the filter (sample J) (Figure 17), and the microbial diversity evaluated using a
metagenomics approach.
Figure 33: Configuration of BAC filter, showing core sample that was cored out of the filter and
split into 3 smaller samples- H, I and J

65
Alpha diversity, a number of distinct species within a sample (MG RAST, 2013),
within the filter is increasing with increasing depth of the filter. The abundance of the
unclassifed bacteria in raw water is 33% whereas about 45% of bacteria are unclassified
for all three BAC samples. The most abundant bacterial phylum is Proteobacteria (from
15% in raw to about 25% throughout the filter). The top layer of the BAC filter is most
abundant with Betaproteobacteria, Deltaproteobacteria and Nitrospira, which does not
change much through to the bottom layer of the BAC filter.
The abundance of the Nitrospira, which are nitrifying bacteria that transform
ammonia to nitrate, shifted from 0.3% in the raw to 6%, 7% and 8.6% for samples from
the top down to the bottom respectively. The most abundant species in genus Nitrospira
is the Candidatus Nitrospira defluvii for all 4 samples. Candidatus N. defluvii is the
nitrite oxidizer that is primarily different in enzymatic selection and metabolic pathways
from all other known nitrifiers (Lücker et al. 2010). Lücker et al (2010) suggests that the
adequate areation is critical for maintaining stable and active population of Nitrospira
since it does not have protection mechanism against oxidative stress. An increase in
Nitrospira from raw water through the BAC filter suggests that microbes like Nitrospira
will grow in the presence of oxygen, but will concentrate in areas like the bottom of the
filter that have lower oxygen.
Planctomycetes abundance increases from 2% in the raw through the filter and
accounts for almost 6% in sample collected from the bottom part of the filter, and
Acidobacteria increases in abundance from raw through the filter as well; from 0.07% in
the raw to over 1%. Likewise, members of the phylum Firmicutes decrease in the upper

66
part of the filter (0.5%) relative to the raw water sample (2%) and then increase to 6% in
the middle of the filter, and decrease to 4% toward the bottom.
Two important factors for the shift in bacterial community composition from raw
water throughout the filter are substrate availability and temperature. Temperature not
only governs the substrate availability, but also influences metabolism and can change
reproduction rates. Figure 30 shows that all bacterial communities are present, but there
is a shift in abundance through the winter. There is a posibility that some bacteria are
less active or dormant through the winter.

67
Figure 34: Raw water sample (sample) collected from Osage raw water source and BAC samples
collected from Osage BAC filter. Both types of samples were collected on September 19,
2012. BAC media is extracted from BAC filter and media sample is divided in 3 equally
long samples and analysed as top 1/3 of the BAC filter (sample H), second 1/3 of the
BAC filter (sample I) and bottom of 1/3 of the BAC filter (sample J). Samples are
compared to each other based on microbial phylum abundance (%).
68
Magic-Knezev et al. (2009) report that GAC filters from 9 different WTPs
mainly showed similar abundance of Betaproteobacteria with Polaromonas represented
a significantly larger proportion of the isolates cultured from GAC filters supplied with
ozonated water than from filters without pre-oxidation. They also report isolates of
Variovorax in filters treating non-oxidized ground water. In the Osage BAC sample
Variovorax is detected throughout the whole filter column with greater abundance values
in upper and lower part of the BAC filter. It is reported that Variovorax sp. either as
isolates or in consortium with other species are capable of degrading wide range of
natural and anthropogenic compounds (Satola et al., 2013; Horemans et al. 2013; Han et
al, 2011; Sørensen et al, 2008).
In Manual 48 of the American Water Works Association (2006) a group of
pathogens of concern were isolated that have a potential to produce waterborne diseases
in humans using contaminated water. These include: Acinetobacter, Aeromonas,
Campylobacter, Cyanobacteria, Escherichia coli, Flavobacterium, Helicobacter pylori,
Klebsiella, Legionella, Mycobacterium avium, Pseudomonas, Salmonella, Serratia,
Shigella, Staphylococcus, Vibrio cholerae and Yersinia. Also of interest are
cyanobacteria known for their potential ability to produce toxic substances, including
Anabaena, Aphanizomenon, Cylindrospermopsis, Lyngbya, Microcystis, Nodularia,
Nostoc and Planktothrix (Carmichael, 2001).
Because of their importance to health, samples were examined for the presence
and relative abundance of these specific pathogens (Figure 34). Osage raw water (fall)
contained Acinetobacter, Aeromonas, Flavobacterium, Legionella, Mycobacterium,
Pseudomonas and Staphylococcus along with several cyanobacterial groups including

69
Aphanizomenon and Dolichospermum. Escherichia coli and Salmonella were isolated
from the sample representing the top BAC filter (sample H) only. Campylobacter and
Yersinia were isolated from the top sample (H) and the bottom sample (J), where
Serratia was isolated from the sample representing the middle part of the BAC filter (I)
and the representing the bottom of the BAC filter (J). Acinetobacter was not detected in
the J sample. All genera experienced a decline in abundance through the filter except
Legionella and Campylobacter.
Legionella can cause two types of disease in humans: Legionnaires’ disease and
Pontiac fever (Public Health Agency of Canada, 2013, Infectious Diseases). Pontiac
fever has a flu like symptoms. Legionnaires’ disease is respiratory illness resulting in
pneumonia. Campylobacteriosis is a disease caused by Campylobacter jejuni and
Campylobacter coli cause, where the symptoms are diarrhea, abdominal pain, malaise,
fever, nausea and vomiting (Public Health Agency of Canada, 2013, Food Safety).
Szewzyk et al. (2000) showed that the main drivers in Legionella are nutrients,
either in water or water plumbing/ fixtures and the water temperature. One possibility
why Legionella abundance increased in the filter is the large abundance of
cyanobacteria, since Legionella uses algal cells for nutrition in aquatic environment
(Taylor et al. 2009). The greater abundance of Legionella in March sample than in
September sample, indicates that nutrient avaialbility is the main driver in growth of the
Legionella and bacteria of similar genetic make up, and not necessary the temperature.

70
Figure 35: BAC sample collected from Osage BAC filter collected on September 19, 2012. BAC
media is extracted from BAC filter and media sample is divided in 3 equally long
samples and analysed as top 1/3 of the BAC filter (sample H), second 1/3 of the BAC
filter (sample I) and bottom of 1/3 of the BAC filter (sample J). Samples are compared to
each other based on microbial genera abundance (%) of microbes known as potential
pathogens of concern if found in drinking water.
0.0001 0.001 0.01 0.1 1 10 100
Acinetobacter
Aeromonas
Campylobacter
Cyanobacteria
Escherichia
Flavobacterium
Legionella
Mycobacterium
Pseudomonas
Salmonella
Serratia
Staphylococcus
Yersinia
%
J, bottom 1/3
of BAC filterI, second 1/3
of BAC filterH, top 1/3 of
BAC filterG, raw Osage
09-19-2012

71
A comparison of the microbial prevalance of potential pathogens between the
raw water samples (G - fall and N - spring) showed that Yersinia and Escherichia coli
were not detected in either sample, whereas Campylobacter, Salmonella and Serratia
were isolated from the spring raw water sample. Aeromonas, Pseudomonas and
Staphylococcus are the only genera that seem to be more abundant in sample H (fall
sample) than in sample N (spring sample). Likewise, the abundance of Acinetobacter,
Cyanobacteria, Flavobacterium, Legionella and Mycobacterium seem to be greater in
the spring than the fall water sample, which could be due to the fact that the dugout was
still frozen over when samples were taken in the fall. The cooler temperatures could have
contributed to a shift in the bacterial community so that abundance of the other bacteria
less resilient to cooler temperatures declined.
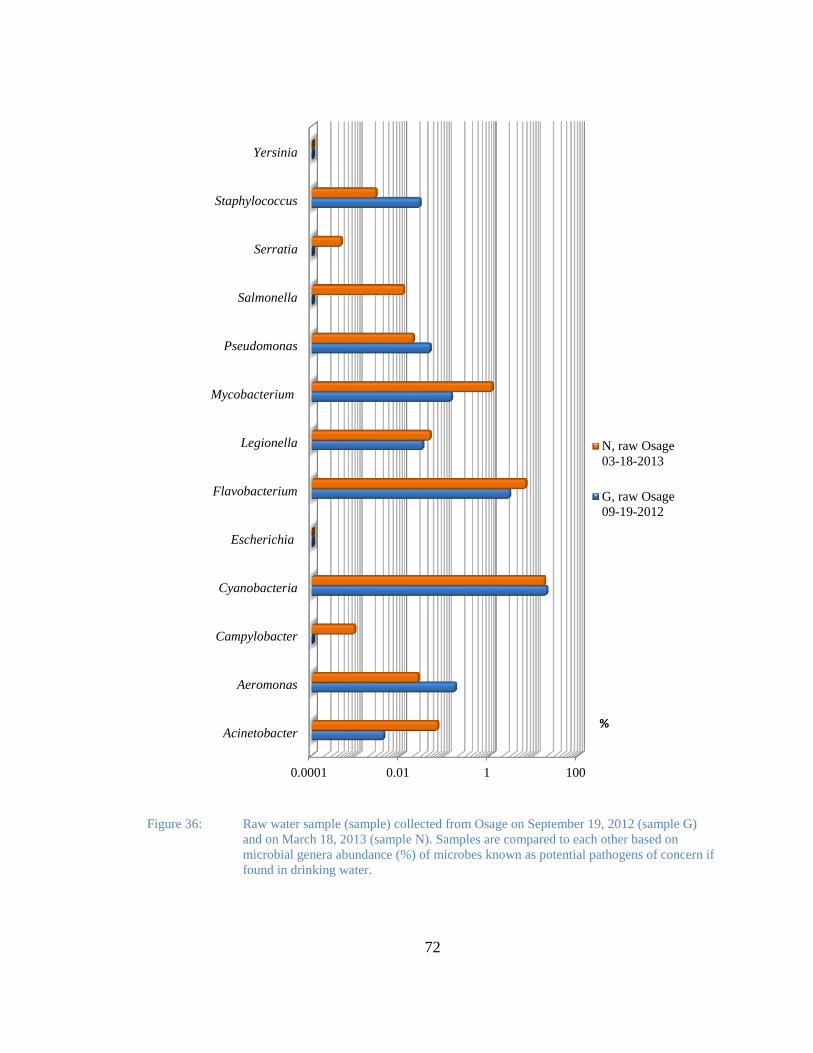
72
Figure 36: Raw water sample (sample) collected from Osage on September 19, 2012 (sample G)
and on March 18, 2013 (sample N). Samples are compared to each other based on
microbial genera abundance (%) of microbes known as potential pathogens of concern if
found in drinking water.
0.0001 0.01 1 100
Acinetobacter
Aeromonas
Campylobacter
Cyanobacteria
Escherichia
Flavobacterium
Legionella
Mycobacterium
Pseudomonas
Salmonella
Serratia
Staphylococcus
Yersinia
%
N, raw Osage
03-18-2013
G, raw Osage
09-19-2012

73
Some of the genera classified as a pathogens of concern also belong to the total
coliform group. Total Coliforms (TC) belong within the family Enterobacteriaceae
include facultative anaerobic Gram-negative, non-spore forming, lactose fermentig
bacteria as well as bacteria having β-galactosidase enzyme (Health Canada, 2012).They
include various groups of coliforms including Budvicia, Citrobacter, Serratia
Enterobacter, Escherichia, Klebisella, Leclercia, Pantoea (Health Canada, 2012).
Water samples results for TC and E-coli in raw and water collected through the
treatment train are summarised in Table 15.
Table 15: Total coliforms and E-coli results from testing water samples at the Provincial laboratory
OSAGE, September 19, 2012
Sample RAW ROUGH SAND BAC NO CL WITH CL
TC (orgs/100 ml) >100 15 3 None detectable
E-coli (orgs/100 ml) 1 absent absent None detectable
Water quality evaluation of total coliform (TC) counts showed that TC was very
high in raw water, and included one E.coli ( 1 organism/100 ml). In contrast, the
metagenomic analysis of raw water did not show presence of any Escherichia. The
metagenomic sample collected from BAC filter in particular the top biofilm sample
showed presence of Escherichia in particular Escherichia albertii that comprised
0.00075% of the whole sample sequenced. Escherichia was not detected in the
metagenomic analysis of the other two samples from BAC filter. The difference in
E.coli results between the lab and metagenomic sampling could be due to the timing of

74
water sample collection, or the small volume of the sample filtered for the metagenomic
analysis. Overall, the detected TC in the raw water is consistent with the results from
metagenomic sampling. Further through the treatment train, the TC is declining, and
E.coli is not detected.
The water sample collected from the BAC filter had no detectable TC, whereas
the biofilm sample had Pantoea and Serratia. The TC in the BAC filter are most likely
stationed within biofilm in anaerobic zones and thereby are not present in the water.
Pathogen Safety Data Sheets and Risk Assessment, 2013 published by Public
Health Agency of Canada lists a number of human pathogens generally found in soil
and/or water. Some of the bacterial species listed on the sheet have been found
throughout the BAC filter: Aerococcus spp., Bacteroides spp., Clostridium spp.,
Fusobacterium spp., Capnocytophaga spp., Lactobacillus spp., Micrococcus spp.,
Mycoplasma spp., Nocardia spp., Pseudomonas spp., Peptococcus spp. , Serratia spp,
Bartonella bacilliformis, Clostridium botulinum, Coxiella burnetii, Campylobacter
jejuni, Listeria monocytogenes, Legionella pneumophila, Leptospira interrogans,
Plesiomonas shigelloides, Rickettsia rickettsii, Salmonella enterica and Yersinia
pseudotuberculosis. The majority of the species noted prefer environment with low or no
oxygen (Pathogen Safety Data Sheets and Risk Assessment, 2013).
Some of these are found in the bottom part of the BAC filter (sample J), and
some at relative higher densities. Those that were found at a relatively higher density
includes Clostridium sp., Leptospira sp., and Cytophaga sp. Most of the species
mentioned if not all are susceptible to disinfectants, such as 1% sodium hypochlorite.

75
4.5 Microbiology - Hamlet of Benson
Microbial composition of the dugout was evaluated in September 2012 and April 2013
(Figure 33). The microbial community from the Benson dugout in September 2012
shows higher alpha diversity than sample collected in April 2013. Benson raw water
metagenomic samples with quality control results are summarized in the Table 16.
Table 16: Metagenomic analysis of environmental samples collected at Benson, (MG-RAST,
2013).
SAMPLE
Quality Control ribosomal RNA genes
ALPHA
DIVERSITY
BY
PHYLUM in
FIGURE PASS (%) FAIL (%) YES (%) NO (%)
K (raw, fall
19/09/2012)
99.5 0.5 98.3 1.1 33 33
O (raw, spring
02/04/2013)
99.5 0.5 96.2 3.3 26 33
About 40% of the both raw water samples collected at Benson are comprised of
unclassified bacteria, Bacteriodetes take up about 20%, Proteobacteria and
Actinobacteria are the next most abundant phyla in the sampels for both seasons.
Salmonella and Escherichia were not isolated from either fall or spring samples
(Figure 38). Serratia is the only genus that was detected in the fall and not in the spring
sample. Aeromonas, Campylobacter, Staphylococcus and Yersinia are the genera
detected in the spring and not in the fall sample.

76
Figure 37: Raw water samples from water source for Benson collected on September 19, 2012 and
on April 2, 2013. Samples are compared to each other based on microbial phylum
abundance (%).

77
Figure 38: Raw water sample (sample) collected from Benson on September 19, 2012 (sample K)
and on April 2, 2013 (sample O). Samples are compared to each other based on
microbial genera abundance (%) of microbes known as potential pathogens of concern if
found in drinking water.
0.0001 0.01 1 100
Acinetobacter
Aeromonas
Campylobacter
Cyanobacteria
Escherichia
Flavobacterium
Legionella
Mycobacterium
Pseudomonas
Salmonella
Serratia
Staphylococcus
Yersinia
%
O, raw
Benson 04-
02-2013
K, raw
Benson 09-
19-2012

78
Table 17: Total coliforms and E-coli results from testing water samples at the Provincial
laboratory, Benson
BENSON, September 19, 2012
Sample RAW ROUGH SAND BAC NO CL WITH CL
TC (orgs/100 ml) 1 Not detectable
E-coli (orgs/100 ml) 1 Not detectable
Raw water tested at the Provincial lab shows low count for TC and E-coli, where
metagenomic sequencing did not detect any E-coli but it did detect a 1TC/100 ml of
water sample (Table 17 and Figure 38).
4.6 Microbiology - Osage vs. Benson
Alpha diversity of the raw water samples is greater in the fall than in the spring
both at Osage (Table 14) and Benson (Table 16). However, alpha diversity at Benson in
spring and fall is much lower than alpha diversity of the sample collected at Osage for
both seasons. The raw water samples collected at Osage and Benson on September 19,
2012 are compared to each other by microbial phylum abundance expressed as
percentage (%) of the bacteria present (Figure 39). Even though it seems that fall sample
from Benson has greater variety of the species, fall sample from Osage would have more
balanced bacterial distribution than Benson’ sample, since Alpha diversity for Osage and
Benson fall samples are 56 and 33, respectively.
Water at the Benson dugout is more nutrient rich and more saline than water at
the Osage dugout (Table 2 and Table 8) which could account for the difference in alpha
diversity difference.

79
Figure 39: Comparison of microbial composition by abundance (%) of two samples collected on
September 19, 2012 from two different sources (Benson sample K and Osage sample G)

80
A comparison of fall raw water samples from Osage and Benson showed that the
relative abundance of Flavobacterium, Legionella, Mycobacterium and Pseudomonas
were almost identical. However, Acinetobacter and Serratia were detected at Benson,
but not in Osage, and Aeromonas and Staphylococcus were in Osage but not Benson.
The presence of Cyanobacteria was greater in Osage sample than in Benson sample
(Figure 40).

81
Figure 40: Comparison of microbial composition by abundance (%) of pathogens of concern of
samples collected on September 19, 2012 from two different sources, Benson sample K
and Osage sample G
0.0001 0.01 1 100
Acinetobacter
Aeromonas
Campylobacter
Cyanobacteria
Escherichia
Flavobacterium
Legionella
Mycobacterium
Pseudomonas
Salmonella
Serratia
Staphylococcus
Yersinia
%
K, raw
Benson 09-
19-2012
G, raw Osage
09-19-2012

82
Cyanobacteria are present in greater abundance in Osage than in Benson samples
both in fall sample (September) and spring sample (March/ April) (Figure 39 and 41).
While in Osage dugout Aphanizomenon and Dolichospermum are consistently two
predominant genera with Microcystis present at very low abundance in Beson dugout
Anabaenopsis and Microcystis are two predominant genera in the fall followed by
Aphanizomenon and Planktothrix, but in the spring sample Aphanizomenon and
Planktothrix are two predominant genera followed by Anabaenopsis and Microcystis and
Dolichospermum in very low number. This could be due to the fact that the dugout in
Osage is shallower and therefore the growth and bloom conditions are better than in
Benson dugout, or difference in salinity of the waters or the overall chemistry of the
Osage dugout supports a greater diversity of microbes, including cyanobacteria. Further
research is required to determine why the differences between the species in apparently
very similar environment and the shift among the genera in the Benson’ dugout.

83
Figure 41: Comparison of microbial composition by abundance (%) of two samples collected on
March 18, 2013 (Osage sample N) and on April 2, 2013 (Benson sample O)

84
Even though the diversity for the fall sample is greater than of the spring sample,
diversity and presence (%) of the pathogens in the spring sample seem to be greater than
of the fall sample (Figure 40 and 42). In both dugouts bacterial composition has changed
with the change of season. The abundance of the bacteria by phylum has decreased in the
winter in both dugouts except Bacteroidetes, Actinobacteria and Tenericutes. The
abundance of these three phyla has increased in colder temperature. Polaribacter in the
Bacteriodetes increased from 0.01% in September to over 12% in April in Benson’s
water. The shift for the other genera might have been caused by the abundance of the
food available, low metabolic activity due to the low temperature, predators or some
other factors.
Actinobacteria are more abundant in Osage water than in Benson in fall and
spring (Figures 40 and 42). The majority of organisms belonging to the Actinobacteria
are involved in the decomposition of biopolymers, such as cellulose, hemicelluloses,
chitin, and lignin (Kämpfer, 2010).
Most of the bacteria present in the water from both dugouts are soil bacteria. The
shift within bacterial communities is driven by changes in water quality, temperature and
presence of oxygen. Sigee (2004) shows that change in bacterial community function
and arrangement follows as a reaction to change in the supply of organic matter. The
greatest stimulation in increased of extracellular enzyme production comes from
biodegradation of easily biodegradable substrates. Different enzyme activity indicates
shift in community purpose and configuration.
During the oxidation of the organic matter, free energy is released and bacteria
that are involved in high energy reactions have a greater growth potential than bacteria

85
that are involved in lower energy reactions. In an aerobic environment, oxygen generates
most free energy and therefore will become the main electron acceptor and bacteria
using oxygen will predominate.
Figure 42: Comparison of microbial composition by abundance (%) of pathogens of concern of two
samples collected on March 18, 2013at Osage (sample N) and April 2, 2013 at Benson
(sample O).
0.0001 0.001 0.01 0.1 1 10 100
Acinetobacter
Aeromonas
Campylobacter
Cyanobacteria
Escherichia
Flavobacterium
Legionella
Mycobacterium
Pseudomonas
Salmonella
Serratia
Staphylococcus
Yersinia
%
O, raw
Benson 04-
02-2013
N, raw
Osage 03-
18-2013

86
Even though the diversity for the fall sample is greater than of the spring sample,
diversity and presence (%) of the pathogens in the spring sample seem to be greater than
of the fall sample (Figure 43).
A comparison of raw water samples from both sites (Figure 43) showed that
Yersinia was unique to Benson, whereas Serratia and Salmonella were unique to Osage.
Staphylococcus, Pseudomonas and Campylobacter show greater abundance in Benson
water than in Osage.

87
Figure 43: Comparison in abundance in microbial composition (%) of pathogens of concern
samples collected at Osage and Benson in fall 2012 and spring 2013.
0.0001 0.01 1 100
Acinetobacter
Aeromonas
Campylobacter
Cyanobacteria
Escherichia
Flavobacterium
Legionella
Mycobacterium
Pseudomonas
Salmonella
Serratia
Staphylococcus
Yersinia
%
O, raw
Benson
04-02-
2013
K, raw
Benson
09-19-
2012
N, raw
Osage 03-
18-2013
G, raw
Osage 09-
19-2012

88
Many bacteria labeled as opportunistic pathogens are also common soil bacteria,
some of which are found in low abundance in water. In these dugouts presence of enteric
bacteria normally found in gut of animals, such as Campylobacter can be accredited to
the warm gut animals (rats, muskrats, geese, ducks, etc) that are present in the fields
(Public Health Agency of Canada, 2013).

89
5. Conclusions
Two water treatment plants using ozone assisted biological filtration to treat
water from farm dugouts in Saskatchewan were analysed in order to understand and
pinpoint the main cause(s) of hindered performance of the plants. The analysis of the
water chemistry throughout the treatment trains at suggests that high alkalinity/ionic
strength of the water along with high pH, high organics loading and high turbidity are the
main causes of poor plant performance. Bicarbonate and carbonate ions act as natural
ozone inhibitors and as such they predominate in ozone reaction with substances in water
over metals and organics.
Presence of high bicarbonate, carbonate and phenol alkalinity hinders the ozone
contact with organic matter. In turn organic matter is not completely oxidized and
therefore not easily bioavailable to the bacteria. To maximize the organics oxidation and
mineralisation ozone dose should be determined based on presence of DOC and
administered based on presence of alkalinity.
Further analysis of the plant performance suggests that current plant design at
both communities does not meet current water quality in the dugouts. Water quality in
the dugouts is prone to seasonal fluctuation and as the dugouts are aging the fluctuations
seem to be more severe with every season change.
Roughing filter is designed as single media gravity fed filter. Filter re-design to
allow for dual or multi-media up flow can reduce turbidity. Sand and BAC filters at
Benson are designed in parallel. To maximize the contaminant reduction filters should be
placed in series (IRC International Water and Sanitation Centre, 2006) or water meters
and valves should be installed to ensure steady flow for all filters at all times.

90
The villages of Osage and Hamlet of Benson are both financially constrained
communities and water source limited. If designed and operated properly, ozone-
assisted biological filtration is an inexpensive yet effective water treatment strategy that
can provide small community with potable water that meets regulations. Application of
all of the recommendations set forth here should improve water quality in selected
communities. Still, a cost-benefit analysis should be done to determine if the application
of the recommendations is more economical than joining the regional pipeline system or
purchasing, maintenance and operation of new equipment.
The microbiology of the raw water source shows that different water quality of
the dugouts along with changes of seasons drives the composition of the microbial
communities. Differences in microbial composition (diversity and abundance) between
the two dugouts are impacted by a combination of oxygen availability, biodegradability
of DOM, COD, presence of the metals, and /or salinity. A significant difference in
abundance and diversity at two dugouts is noticed in the cyanobacteria present. One of
the driving factors for noted differences could be differences in salinity, temperature,
nutrition in the water or some other pollutants.
The microbiology of the BAC filter shows that abundance of opportunistic
pathogens through the BAC filter is declining except for Legionella and Campylobacter.
Where Campylobacter causes gastrointestinal disease Campylobacteriosis, Legionella
can cause flu like Pontiac fever and Legionnaires’ disease that result in pneumonia.
The analysis of both raw water sources and the BAC filter show presence of
opportunistic pathogens, and therefore disinfection as a final part of the drinking water
treatment is a crucial step in reducing pathogens and providing safe water. Communities

91
should strive to maintain the minimum free chlorine residual in distribution systems as
required in their permits to operate in order to provide safe drinking water for everyone
in community. In addition, to minimize the survival of Legionella in the plumbing it is
recommended that water temperature in hot water tanks in people’s homes is kept at
above 60°C and cold water in tanks below 20°C (Szewzyk et al, 2000) since Pontiac
fever and Legionnaires’ disease are caused by inhalation of Legionella contaminated
aerosols.
92
6. Recommendations
The following recommendations may improve plant performance:
1) Water Source Protection
(1) Implementation of source water protection. The current practice of
source water protection is not adequate to provide good quality raw water.
Suitably designed buffer zones are required to enhance sedimentation
outside of the dugouts.
(2) Proper aeration of the dugouts. Windmill aeration devices do not provide
adequate aeration of dugouts. Air diffusers are required or other type of
devices that will provide aeration for the whole dugout throughout the
column.
(3) Dredging of the old dugouts (more than 20 old) may help with organic
carbon loading and reduction of anoxic zone forming in the summer with
phosphorous and heavy metals release as a consequence.
(4) Copper sulphate should be applied early in June when pH is still below 8
and lower alkalinity. Cooper sulphate if applied at high pH and high
alkalinity will precipitate quickly (AWWA, 1995). As the pH is
approaching 9 pH units copper sulphate will precipitate faster (Cooke et
al., 2005).
2) Oxidation as a pre treatment
(1) Communities should consider installation of more efficient ozone
generators than ones currently used. Recommended effective ozone

93
concentration should be between 0.5 and 2 mg/L / mg of DOC
(Gottschalk et al., 2010).
(2) Where DOC (> 8 mg/L), alkalinity (> 120 mg/L as CaCO3) are high (US
EPA, 1999) and COD is >> 20 mg/L and where coagulation is not
economically feasible plant can try to install in series minimum of two
tanks each one with an ozone injector to maximize the oxidation of DOC.
3) Filtration:
(1) Re-design roughing filter to be an up flow dual or multi-media filter so
that heavy turbidity particles are settling down by gravity and low
turbidity water is further spilling over to the sand filter
(2) Where possible, do not design filters in parallel but rather in series. Filters
in parallel will handle higher volumes of water, however if designed in
series will enhance contaminant removal (IRC International Water and
Sanitation Centre, 2006). Consider installation of valves and water meters
to maintain steady flow in all filters at all times.
(3) If colloids are present in the water on a regular basis, consider installing a
clarifier tank to include coagulation as a first component of the treatment
train.
For operations considering installation of ozone assisted biologically activated
filtration units, here are the following recommendations to consider in their design:
1) Do not use ozone assisted biological filtration as a primary treatment to treat
surface water in Saskatchewan, especially raw water coming from reservoirs or man-

94
made dugouts without knowing magnitude of raw water seasonal changes. The main
reasons are:
a. Very high seasonal turbidity fluctuation
b. High seasonal fluctuation in raw water quality such as but not limited
to: alkalinity/ salinity, pH, DOC, COD, P, N, Chlorophyll A, TDS,
metals and DO.
c. There is no detailed source water protection defined in regulatory policy
in place to regulate the proper design, operation and maintenance of the
reservoirs and to minimize the contamination of the water reservoir.
2) Use ozone assisted biofiltration at the end of the treatment train as polishing units
in order to further reduce DOC and other contaminants.
3) If possible install the ozone injection before coagulant addition in order to
enhance the coagulation or particle removal from the water.
General recommendations for this type of treatment used in Saskatchewan to
treat surface water would be to collect seasonal data and determine range of following
parameters in the raw water: total alkalinity, pH, turbidity, DOC, C:N:P ratio and metals
(where applicable).
Based on these parameters feasibility of the system should be determined. If
system feasible, determine ozone dosage based on DOC levels in the water.
Configure plant layout based on the turbidity range and system appurtenances
such as water meters and valves availability.

95
7. References
American Water Works Association (AWWA) Research Foundation, Advances in Taste-
and-Odor, 1995
American Water Works Association (AWWA) Manual of Water Supply Practices M-48
(2006), Second Edition, Waterborne Pathogens, 2006
American Water Works Association (AWWA) Research Foundation, Advancing the
Science of Water: AwwaRf and Giardia and Cryptosporidium, 2006
American Water Works Association (AWWA) Research Foundation, Ozone in Water
Treatment, Application and Engineering, Cooperative research report, 1991
Ang Wui Seng and Menachem Elimelech (2008), Optimization of Chemical Cleaning of
Organic-Fouled Reverse Osmosis Membranes, Desalination and Water
Purification Research and Development Program Report No. 141, U.S.
Department of the Interior Bureau of Reclamation
Antoniou. Maria G and Andersen Henrik R. (2011), Evaluation of pretreatments for
inhibiting bromate formation during ozonation, Environmental
technology, ISSN 0959-3330, 07/2012, Volume 33, Issue 13-15, pp. 1747 - 1753
Araya Ruben, Tani Katsuji, Takagi Tatsuya, Yamaguchi Nobuyasy, Nasu Masao, (2002)
Bacterial activity and community composition in stream water and biofilm from
an urban river determined by fluorescent in situ hybridization and DGGE
analysis, FEMS microbiology ecology, ISSN 0168-6496, 02/2003, Volume 43,
Issue 1, pp. 111-119

96
Arlex, Galvis Gerardo and Latorre Jorge , Multi Stage Filtration, October 2006
Bartram A. and Neufeld J.D., (June 2011) 16S rRNA gene(V3 region) Library
Construction for Illumina, Appl. Environ. Microbiol. 2011, 77(11):3846. DOI:
10.1128/AEM.02772-10.
Bergmann Gaddy T. (2010), Bates Scott T, Eilers Kathryn G., Lauber Christian L.,
Caporasoc J. Gregory, Walters William A., Knight Rob, Fierer Noah, The under-
recognized dominance of Verrucomicrobia in soil bacterial communities, Soil
Biology & Biochemistry 43 (2011) 1450e1455
Boehrer Bertram, (2012) Double-diffusive convection in lakes, Encyclopedia of Lakes
and Reservoirs 10.1007/978-1-4020-4410-6_241, © Springer Science+Business
Media B.V., 2012
Boon Nico, Pycke Benny F.G., Marzorati Massimo, Hammes Frederik, (2011) Nutrient
gradient in a granular activated carbon filter drives bacterial community
organization and dynamics, Water Research, ISSN 0043-1354,
12/2011, Volume 45, Issue 19, pp. 6355 – 6361
Briones Aurelio and Raskin Lutgarde,(2003) Diversity and dynamics of microbial
communities in engineered environemnts and their implications for process
stability, Current Opinion in Biotechnology, ISSN 0958-1669,
2003, Volume 14, Issue 3, pp. 270 - 276

97
Brümmer I.H.M., Felske A., and Wagner-Döbler I., (2003) Diversity and Seasonal
Variability of β-Proteobacteria in Biofilms of Polluted Rivers: Analysis by
Temperature Gradient Gel Electrophoresis and Cloning, Applied and
Environmental Microbiology, ISSN 0099-2240, 08/2003, Volume 69, Issue 8, pp.
4463 - 4473
Canadian Council of Ministers of Environment (CCME), 2004. Canadian water quality
guideline for protection of aquatic life; Phosphorous; Canadian Guidance
Framework for the Management of freshwater Systems. Pg. 1-2
Carmichael Wayne W. (2001) Health Effects of Toxin-Producing Cyanobacteria: “The
CyanoHABs”, Human and Ecological Risk Assessment: An International
Journal, 7:5, 1393-1407, DOI: 10.1080/20018091095087
Cooke G. Dennis, Welch Eugene B., Peterson Spencer, Nichols Stanley A. (2005),
Restoration and Management of Lakes and Reservoirs, Copper Sulphate, Third
Edition, Taylor & Francis
Curtis Thomas P. and Sloan William T., (2004) Prokaryotic diversity and its limits:
microbial community structure in nature and implications for microbial ecology,
Current Opinion in Microbiology, ISSN 1369-5274, 2004, Volume 7, Issue 3, pp.
221 - 226
Deborde Marie, Rabouan Sylvie, Duguet Jean-Pierre, Legube Berenard, (2005) Kinetics
of Aqueous Ozone-Induced Oxidation of Some Endocrine Disruptors,

98
Environmental science & technology, ISSN 0013-936X,
08/2005, Volume 39, Issue 16, pp. 6086 - 6092
Elovitz Michael S., von Gunten Urs & Kaiser Hans-Peter, (2000) Hydroxyl
Radical/Ozone Ratios During Ozonation Process II. The Effect of temperature,
pH, Alkalinity and DOM Properties, Ozone: Science & Engineering, ISSN 0191-
9512, 2000, Volume 22, Issue 2, pp. 123 - 150
Environment Canada, Groundwater, http://www.ec.gc.ca/eau-
water/default.asp?lang=En&n=300688DC-1, accessed on June 11, 2012
Fonseca A. Cristina, Summers R. Scott and Hernandez Mark T., (2001), Comparative
Measurements of Microbial Activity in Drinking Water Biofilters, Water
Research, ISSN 0043-1354, 2001, Volume 35, Issue 16, pp. 3817 – 3824
Fox, Kim R. and Reasoner, Donald J; Security by Gertig, Kevin R., (2006) Water
Quality in Source Water, Treatment, and Distribution Systems AWWA M48,
2006
Gottschalk Christiane, Libra A. Judy, Saupe Adrian, (2010) Ozonation of water and
wastewater, A practical guide to understanding ozone and its applications,
Second, completely revised and updated edition, WILEY-VCH Verlag GmbH &
Co. KGaA
Han Jong-In, Choi Hong-Kyu, Lee Seung-Won, Orwin Paul M., Kim Jina, LaRoe Sarah
L. , Kim Tae-gyu, O'Neil Jennifer, Leadbetter Jared R., Lee Sang Yup, Hur

99
Cheol-Goo, Spain Jim C., Ovchinnikova Galina, Goodwin Lynne, Han Cliff,
(2011), Complete Genome Sequence of the Metabolically Versatile Plant
Growth-Promoting Endophyte Variovorax paradoxus S110, Journal of
Bacteriology, 2011, 193(5):1183. DOI: 10.1128/JB.00925-10.,Published Ahead
of Print 23 December 2010.
Health Canada, (2012) Guidelines for Canadian Drinking Water Quality, Summary
Table, August 2012
Health Canada, (2012a) Guidelines for Canadian Drinking Water Quality, Guideline
Technical Document, Total Coliforms, March 2012
Health Canada, (2011) Guidelines for Canadian Drinking Water Quality, Guideline
Technical Document, N-Nitrosodimethylamine (NDMA), 2011
Health Canada, (2009), Guidelines for Canadian Drinking Water Quality: Guideline
Technical Document Chlorine, June 2009
Health Canada, (2006), Guidelines for Canadian Drinking Water Quality: Guideline
Technical Document, Trihalomethanes, 2006
Health Canada, (1998), Guidelines for Canadian Drinking Water Quality, Guideline
Technical Document, Bromate (1998)
Horemans Benjamin, Vandermaesen Johanna, Vanhaecke Lynn, Smolders Erik,
Springael Dirk (2013), Variovorax sp.-mediated biodegradation of the phenyl
urea herbicide linuron at micropollutant concentrations and effects of natural

100
dissolved organic matter as supplementary carbon source. Applied Microbiology
and Biotechnology 97(22): 9837-9846.
Hu Jia, Sang Hocheol, Addison Jesse W., Karanfil Tanju, 2009.Halonitromethane
formation potentials in drinking waters. Water research 44(1): 105–114.
Huang Yi, Li Zou, ShuYing Zhang, and ShuGuang Xie, (2011), Comparison of
Bacterioplankton Communities in Three Heavily Polluted Streams in China,
Biomedical and Environmental Sciences, ISSN 0895-3988, 2011, Volume 24,
Issue 2, pp. 140 - 145
Kämpfer, Peter. 2010. Handbook of Hydrocarbon and Lipid Microbiology. , Springer-
Verlag, Berlin. DOI 10.1007/978-3-540-77587-4_133.
LeChevallier Mark W and Au Kwok-Keung (2004) Water treatment and pathogen
control: Process Efficiency in Achieving Safe Drinking Water, 2004,World
Health Organization (WHO)
Lücker Sebastian, Wagner Michael, Maixner Frank, Pelletier Eric, Koch Hanna,
Vacherie Benoit, Rattel Thomas, Sinninghe Damsté Jaap S., Spieck Eva, Le
Paslier Denis, Daims Holger, 2010. A Nitrospira metagenome illuminates the
physiology and evolution of globally important nitrite-oxidizing bacteria. PNAS
107(30): 13479–13484.
Magic-Knezev A., B. Wullings and D. Van der Kooij. 2009. Polaromonas and
Hydrogenophaga species are the predominanat bacteria cultured from granular

101
activated carbon filters in water treatment. Journal of applied
microbiology 107(5): 1457–1467.
Mainstream Water Solutions Inc., Proposal for Benson Water Treatment Plant, 2005,
available from Saskatchewan Water Security Agency at request
Mainstream Water Solutions Inc., Proposal for Osage Water Treatment Plant, 2004,
available from Saskatchewan Water Security Agency at request
Matilainen Anu, Gjessing Egil T., Lahtinen Tanja, Hed Leif, Bhatnagar Amit, Sillanpää
Mika, (2011), An overview of the methods used in characterisation of natural
organic matter (NOM) in relation to drinking water treatment, Chemosphere,
ISSN 0045-6535, 06/2011, Volume 83, Issue 11, pp. 1431 - 1442
Metagenomic Analysis Server (MG RAST) (2012),
http://metagenomics.anl.gov/metagenomics.cgi?page=Home , accessed on
October 10, 2013
Metcalf &Eddie, Wastewater Engineerng, Treatment and Reuse, 2003, pg.610
Meyer F., Paarman D., D'Souza M., Olson R., Glass EM., Kubal M., Paczian T.,
Rodriguez A., Stevens R., Wilke A., Wilkening J., and Edwards RA., Software,
The metagenomics RAST server – a public resource for the automatic
phylogenetic and functional analysis of metagenomes, BMC Bioinformatics,
https://www.google.ca/search?q=mg+rast&ie=utf-8&oe=utf-8&rls=org.mozilla:en-

102
US:official&client=firefox-
a&channel=np&source=hp&gws_rd=cr&ei=VmgpUoO4KYa6yQHrk4Aw
Mulder, Jan and Cresser Malcolm S. (1994), Soil and Soil Solution Chemistry,
Biogeochemistry of Small Catchments: A Tool for Environmental Research,
edited by Moldan B. and Černý J, 1994
National Estuarine Research Reserve System (NERRS-NOA), 2013, Environmental
Conditions, Water Quality,
http://www.nerrs.noaa.gov/Doc/SiteProfile/ACEBasin/html/envicond/watqual/wq
intro.htm , accessed on July 20, 2013
Niemi R. Maarit, Heiskanen Ilse, Heine Riitta, Rapala Jarrko , (2009), Previously
uncultured β-Proteobacteria dominate in biologically active granular activated
carbon (BAC) filtersWater Research, ISSN 0043-1354, 2009, Volume 43,
Issue 20, pp. 5075 - 5086
Norton Cheryl D. and LeChevallier Mark W., (1999), A Pilot Study of Bacteriological
Population Changes through Potable Water Treatment and Distribution, Applied
and environmental microbiology, ISSN 1350-0872, 01/2000, Volume 66, Issue 1,
p. 268
Public Health Agency of Canada, 2013, Food Safety, Fact Sheet, Campylobacter,
http://www.phac-aspc.gc.ca/fs-sa/fs-fi/campylo-eng.php, accessed on October 7,
2013

103
Public Health Agency of Canada, 2013, Infectious Diseases, Legionella,
http://www.phac-aspc.gc.ca/id-mi/legionella-eng.php, accessed on October 7,
2013
Public Health Agency of Canada, 2013, Pathogen Safety Data Sheets and Risk
Assessment, http://www.phac-aspc.gc.ca/lab-bio/res/psds-ftss/index-eng.php,
accessed on December 5, 2013
Rajakumar Sundaram, Ayyasamy Pudukadu Munusamy, Shanthi Kuppusamy,
Thavamani Palanisami, Velmurugan Palanivel, Song Young Chae,
Lakshmanaperumalsamy Perumalsamy, (2008), Nitrate removal efficiency of
bacterial consortium (Pseudomonas p. KW1 and Bacillus sp. YW4) in synthetic
nitrate-rich water, Journal of hazardous materials, ISSN 0304-3894,
09/2008, Volume 157, Issue 2-3, pp. 553 – 563
Reungoat J., Macova, M; Escher, B I; Carswell, S; Mueller, J F; Keller, J, (2010),
Removal of micropollutants and reduction of biological activity in a full scale
reclamation plant using ozonation and activated carbon filtration, Water research,
ISSN 0043-1354, 01/2010, Volume 44, Issue 2, pp. 625 - 637
Rochex Alice, Godon Jean-Jacques, Bernet Nicolas, Escudié Renaud, (2008), Role of
shear stress on composition, diversity and dynamics of biofilm bacterial
communities, Water Research, ISSN 0043-1354, 2008, Volume 42, Issue 20, pp.
4915 - 4922

104
Rodrigues A.L., Brito A.G., Jankenecht P., Silvia J., Machadp A.V., Nogueira R.,
(2008), Characterization of biofilm formation on a humic material, Journal of
Industrial Microbiology & Biotechnology, ISSN 1367-5435,
11/2008, Volume 35, Issue 11, pp. 1269 - 1276
Rodrigues A.L., Pereira M.A., Janknecht P., Britto A.G., Noguiera R., (2010) Biofilms
formed on humic substances: Response to flow conditions and carbon
concentrations, Bioresource technology, ISSN 0960-8524, 09/ 2010, Volume
101, Issue 18, pp. 6888 - 6894
Sánchez Luis Darío, Sánchez Arlex, Gerardo Galvis and Jorge Latorre, reviewed by Jan
Teun Visscher, Multi-Stage Filtration, IRC International Water and Sanitation
Centre. 2006.
Saskatchewan Ministry of Environment. 2006. Drinking water quality standards and
objectives, 2006
http://www.saskh20.ca/DWBinder/EPB207Drinking_Water_Standards_post.pdf
accessed on October 19, 2012
SaskH2O, My Drinking Water, http://saskh20.ca/MyDrinkingWater.asp , accessed on
October 20, 2012
A Guide for Waterworks Design, EPB 201, Saskatchewan Water Security
Agency,http://sarwp.ca/wpcontent/uploads/2012/05/EPB201AGuideWaterworks
Design.pdf accessed on April 24, 2013

105
Satola Barbara, Wübbeler Jan Hendrik, Steinbüchel Alexander, (2013), Metabolic
characteristics of the species Variovorax paradoxus, Applied Microbiology and
Biotechnology, January 2013, Volume 97, Issue 2, pp 541-560
Sewzyk U., Sewzyk R., Manz W., and Schleifer K.-H. (2000), Microbial Safety of
Drinking Water, Annu. Rev. Microbiol., 2000, 54:81-127
Sigee, C. David, (2005) Freshwater Microbiology: biodiversity and dynamic interaction
of microorganisms in the fresh water environment, 2005, ISBN 9780471485285,
xviii, 524.
Singer and Reckhow, (1999), Chemical oxidation, R.D. Letterman (Ed.), Water Quality
and Treatment, McGraw-Hill, Inc., New York (1999),
Snyder Shane A., Wert Eric C., Rexing David J., Zegers Ronald E., and Drury Douglas
D.,(2006) Ozone Oxidation of Endocrine Disruptors and Pharmaceuticals in
Surface Water and Wastewater, Ozone: Science & Engineering, ISSN 0191-
9512, 12/2006, Volume 28, Issue 6, pp. 445 – 460
Sørensen Sebastian R., Albers Christian N., and Aamand Jens (2008), Rapid
Mineralization of the Phenylurea Herbicide Diuron by Variovorax sp. Strain
SRS16 in Pure Culture and within a Two-Member Consortium, Applied
Environmental Microbiology, 2008 April; 74(8): 2332–2340.

106
Srivastava N.K., Majmuder C.B., (2007) Novel biofiltration methods for the treatment of
heavy metals from industrial wastewater, Journal of Hazardous
Materials, ISSN 0304-3894, 2008, Volume 151, Issue 1, pp. 1 - 8
Ṥwietlik J., Dabrowska A., Raczyk-Stanisławiak U., and Nawrocki J.; (2004) Reactivity
of natural organic matter fractions with chlorine dioxide and ozone, Water
Research, ISSN 0043-1354, 2004, Volume 38, Issue 3, pp. 547 – 558
Taylor Michael, Ross Kirstin and Bentham Richard, Legionella, Protozoa, and Biofilms:
Interactions within Complex Microbial Systems, (Oct., 2009), Microbial
Ecology, Vol. 58, No. 3 pp. 538-547
Terzhevik Arkady and Golosov Sergey (2012), Dissolved Oxygen in Ice-Covered Lakes,
Encyclopedia of Lakes and Reservoirs, 10.1007/978-1-4020-4410-6_225, ©
Springer Science+Business Media B.V. 2012
Theng B.K.G., (2012), Formation and Properties of Clay-Polymer Complexes, Chapter
12, Humic Substances, Pages 391-456, ISBN: 978-0-444-53354-8, 2012
UNESCO/WHO/UNEP, Water Quality Assessments - A Guide to Use of Biota,
Sediments and Water in Environmental Monitoring - Second Edition , Edited by
Deborah Chapman , © 1992, 1996, ISBN 0 419 21590 5 (HB) 0 419 21600 6
(PB)
United States Environmental Protection Agency USEPA (1999a), Giardia: Drinking
Water Health Advisory, 1999

107
United States Environmental Protection Agency (US EPA), Enhanced Coagulation and
Enhanced Precipitative Softening Guidance Manual, May 1999
United States Environmental Protection Agency US EPA (1999), Enhanced coagulation
and enhanced precipitative softening manual, EPA 815-R-99-012, May 1999
van der Aa L.T.J., Rietveld L.C., and van Dijk J.C., (2011) Effects of ozonation and
temperature on the biodegradation of natural organic matter in biological granular
activated carbon filters, Drinking Water Engineering and Science, ISSN 1996-
9457, 01/2011, Volume 4, Issue 1, pp. 25 - 35
van Loon Garry W. & Duffy Stephen J., (2010) Environmental Chemistry, A Global
Perspective, Third Edition,
Velten Silvana, Boller Markus, Köster Oliver, Helbing Jakob, Weilenmann Hans-Ulrich,
Hammes Frederik, (2011) Development of biomass in a drinking water granular
active carbon (GAC) filter, Water Research, ISSN 0043-1354, 12/2011, Volume
45, Issue 19, pp. 6347 - 6354
Vigliotta Giovanni , Mottab Oriana, Guarinoa Francesco, Iannecea Patrizia, Protoa
Antonio, (2010), Assessment of perchlorate-reducing bacteria in a highly
polluted river, nternational journal of hygiene and environmental health, ISSN
1438-4639, 11/2010, Volume 213, Issue 6, pp. 437 - 443
Volk Christian J. and LeChevallier Mark W., Assesing biodegradable organic matter,
May 2000, American Water Works Association, Volume 92, Issue 5, pg. 64-76

108
Volk Christian J. and LeChevallier Mark W., Effects of Conventional treatment on AOC
and BDOC levels, June 2002, American Water Works Association, Volume 94,
Issue 6, pg. 112-123
Water Security Agency (WSA), EPB 416- Chlorine Dioxide,
http://www.saskh20.ca/DWBinder/epb416.pdf , accessed on January 10, 2014
Water Quality - National Estuarine Research Reserve System (NERRS) – NOAA, South
Carolina,
http://www.nerrs.noaa.gov/doc/siteprofile/acebasin/html/envicond/watqual/wqint
ro.htm, accessed on September 7, 2013
Winkler Michael, 2012, BIOSERVE GmbH, Mainz, Hach-Lange, www.hach-lange.com,
accessed on December 1, 2013
World Health Organization (WHO), Disinfectants and Disinfection By-Products,
http://www.who.int/water_sanitation_health/dwq/S04.pdf, accessed on January
10, 2013
Yavich Alex A., Lee Kyung-Hyuk, Chen Kuan-Chung, Pape Lars, Masten Susan J.,
(2004), Evaluation of biodegradability of NOM after ozonation, Water
Research, ISSN 0043-1354, 2004, Volume 38, Issue 12, pp. 2839 - 2846
Zhang Duo Ying, LI WeiGuang, Zhang ShuMei, LIU Miao, Zhao Xiao Yu, and Zhang
Xian Cheng, (2010), Bacterial Community and Function of Biological Activated

109
Carbon Filter in Drinking Water Treatment, Biomedical and environmental
sciences : BES, ISSN 0895-3988, 04/2011, Volume 24, Issue 2, pp. 122 - 131
Zhu Ivan X., Getting Tom, Bruce Dan, (2010), Review of biologically active filters in
drinking water applications, Journal - American Water Works Association,
December 2010, Volume 102, Number 12, Page(s): 67-77

110
Appendix A
Supplemental Table 1 Concentration and purity of the samples were confirmed by NanoDrop UV-Vis
Spectrophotometer
SAMPLE SOURCE
DATE OF
COLLECTION
CONCENTRATION
(µg/µL)
G1 OSAGE RAW 19-Sep-12 13.3
H1 OSAGE BAC, TOP 10 CM 19-Sep-12 10.7
I1 OSAGE BAC, 2ND 10 CM 19-Sep-12 14.6
J1 OSAGE BAC, 3RD 10 CM 19-Sep-12 9.3
K1 BENSON RAW 19-Sep-12 18.5
M1 OSAGE, BAC TOP 30CM 18-Mar-13 16.4
N1 OSAGE, RAW 18-Mar-13 12.4
O1 BENSON RAW 2-Apr-13 11.9
Appendix B
Supplemental Table 2 Changes in BCOD and COD over time in raw water source
Supplemental Table 3Changes in DOC levels over time and its removal through the treatment train
OSAGE, DOC (mg/L) REMOVAL
DATE PARAMETER RAW ROUGHING
FILTER
SAND
FILTER
BAC
FILTER
TREATED
NO CL
TREATED
W CL
OVERALL
REMOVAL
06-Feb-12 DOC (mg/L) 13.90 10.80 9.10 8.50 8.50 8.40 40%
30-Apr-12 DOC (mg/L) 13.10 11.20 8.10 7.00 6.60 6.40 51%
17-Jul-12 DOC (mg/L) 12.00 7.50 6.90 6.00 6.00 6.10 49%
19-Sep-12 DOC (mg/L) 12.20 7.90 7.00 5.70 5.80 5.70 53%
20-Nov-12 DOC (mg/L) 14.20 12.30 10.30 8.90 9.10 9.20 35%
18-Mar-13 DOC (mg/L) 15.70 12.80 10.30 8.90 9.00 9.10 43%
PARAMETER OSAGE RAW, 2012/2013
6-Feb-12 30-Apr-12 17-Jul-12 19-Sep-12 20-Nov-12 18-Mar-13
BCOD (mg/L) 2.00 2.00 3.80 2.00 3.20 2.00
COD (mg/L) 34.30 32.10 39.50 29.90 38.70 40.60

111
Supplemental Table 4Changes in concentration of DOC (mg/L) removed after each filter
OSAGE, DOC (mg) REMOVED
DATE PARAMETER ROUGHING
FILTER
SAND
FILTER
BAC
FILTER
06-Feb-12 DOC (mg/L) 3.10 1.70 0.60
30-Apr-12 DOC (mg/L) 1.90 3.10 1.10
17-Jul-12 DOC (mg/L) 4.50 0.60 0.90
19-Sep-12 DOC (mg/L) 4.30 0.90 1.30
20-Nov-12 DOC (mg/L) 1.90 2.00 1.40
18-Mar-13 DOC (mg/L) 2.90 2.50 1.40
Supplemental Table 5Total nitrogen concentration change, percent removal (%) of nitrogen from the raw
and percent removal from the raw coming out of roughing filter is shown
OSAGE
RAW ROUGHING
FILTER
SAND
FILTER
BAC
FILTER
TREATED
NO CL
TREATED
W CL
TREATED
VS.
ROUGHING
FILTER (%)
TREATED
VS. RAW
(%)
06-Feb-12 N-TOTAL 1.00 1.40 1.10 1.00 1.00 1.00 29% 0%
30-Apr-12 N-TOTAL 1.00 1.10 0.90 0.90 0.90 0.80 27% 20%
17-Jul-12 N-TOTAL 1.50 1.40 1.20 1.10 1.10 1.00 29% 33%
19-Sep-12 N-TOTAL 1.00 1.30 0.90 0.90 0.90 0.80 38% 20%
20-Nov-12 N-TOTAL 1.40 1.60 1.20 1.10 1.10 1.10 31% 21%
18-Mar-13 N-TOTAL 1.80 2.00 1.90 1.80 1.70 1.70 15% 6%
Supplemental Table 6 Changes in nitrate concentrations through the treatment
OSAGE RAW
ROUGHING
FILTER
SAND
FILTER
BAC
FILTER
TREATED
NO CL
TREATED
W CL
06-Feb-12 NITRATE-N (mg/L) <0.04 0.53 0.44 0.47 0.47 0.47
30-Apr-12 NITRATE-N (mg/L) <0.04 0.28 0.33 0.52 0.49 0.48
17-Jul-12 NITRATE-N (mg/L) 0.18 <0.04 0.05 0.67 0.63 0.56
19-Sep-12 NITRATE-N (mg/L) <0.04 0.55 0.09 0.48 0.49 0.48
20-Nov-12 NITRATE-N (mg/L) <0.04 0.59 0.32 0.43 0.42 0.41
18-Mar-13 NITRATE-N (mg/L) 0.37 0.94 1.02 1.08 1.06 1.06

112
Supplemental Table 7 Changes in ammonia concentrations through the treatment
OSAGE RAW ROUGHING
FILTER
SAND
FILTER
BAC
FILTER
TREATED
NO CL
TREATED W
CL
06-Feb-12 AMMONIA-N (mg/L) <0.02 <0.02 <0.02 <0.02 <0.02 <0.02
30-Apr-12 AMMONIA-N (mg/L) 0.02 0.02 0.06 <0.02 <0.02 <0.02
17-Jul-12 AMMONIA-N (mg/L) 0.10 0.36 0.31 0.04 0.04 0.04
19-Sep-12 AMMONIA-N (mg/L) <0.02 0.02 0.16 <0.02 <0.02 <0.02
20-Nov-12 AMMONIA-N (mg/L) <0.02 <0.02 0.02 <0.02 <0.02 <0.02
18-Mar-13 AMMONIA-N (mg/L) 0.08 0.02 0.03 <0.02 <0.02 <0.02
Supplemental Table 8 Changes in total phosphorous concentrations through the treatment
Supplemental Table 9 Changes in ortho-phosphorous concentrations through the treatment
OSAGE RAW
ROUGHING
FILTER
SAND
FILTER
BAC
FILTER
TREATED
NO CL
TREATED
W CL
%
REMOVAL
06-Feb-12 P- TOTAL (mg/L) 0.41 0.38 0.37 0.36 0.34 0.35 15%
30-Apr-12 P- TOTAL (mg/L) 0.38 0.36 0.33 0.32 0.32 0.33 13%
17-Jul-12 P- TOTAL (mg/L) 0.81 0.91 1.01 0.77 0.74 0.75 7%
19-Sep-12 P- TOTAL (mg/L) 0.52 0.46 0.42 0.40 0.39 0.41 21%
20-Nov-12 P- TOTAL (mg/L) 0.38 0.33 0.25 0.22 0.21 0.22 42%
18-Mar-13 P- TOTAL (mg/L) 0.35 0.32 0.32 0.30 0.31 0.30 14%
OSAGE RAW
ROUGHING
FILTER
SAND
FILTER
BAC
FILTER
TREATED
NO CL
TREATED
W CL
06-Feb-12 ORTHO-P (mg/L) 0.35 0.36 0.34 0.33 0.34 0.34
30-Apr-12 ORTHO-P (mg/L) 0.29 0.30 0.28 0.30 0.30 0.30
17-Jul-12 ORTHO-P (mg/L) 0.63 0.81 0.91 0.73 0.70 0.70
19-Sep-12 ORTHO-P (mg/L) 0.37 0.39 0.37 0.37 0.38 0.38
20-Nov-12 ORTHO-P (mg/L) 0.22 0.24 0.19 0.18 0.19 0.19
18-Mar-13 ORTHO-P (mg/L) 0.29 0.30 0.29 0.29 0.29 0.29

113
Supplemental Table 10 COD reduction through the plant
COD(mg/L), OSAGE, 2012/2013
PARAMETER RAW ROUGHING
FILTER
SAND
FILTER
BAC
FILTER
TREATED
with Cl
06-Feb-12 COD 34.3 15.2 12.3 <11 <11
30-Apr-12 COD 32.1 19.5 <11 <11 <11
17-Jul-12 COD 39.5 20.7 21.1 17.2 16.4
19-Sep-12 COD 29.9 16 17.7 <11 <11
20-Nov-12 COD 38.7 26.4 20.5 17.8 19.1
18-Mar-13 COD 40.3 29 29.9 23.1 20.6
Appendix C
Supplemental Table 11 Changes in BCOD and COD over time in Benson raw water source
PARAMETER BENSON, RAW 2012/2013
06-Feb-12 30-Apr-12 17-Jul-12 19-Sep-12 20-Nov-12 02-Apr-13
BCOD (mg/L) < 2.00 < 2.00 < 2.00 < 2.00 3.50 3.90
COD(mg/L) 76.00 59.7 86.70 82.30 86.10 98.70
Supplemental Table 12 COD reduction through the plant
COD(mg/L), BENSON, 2012/2013
PARAMETER RAW ROUGHING
FILTER
SAND FILTERS
average
BAC FILTER
average
TREATED
with Cl
06-Feb-12 COD 76 65.2 59.7 48.5 46.1
30-Apr-12 COD 59.7 51.2 47.6 41 37.8
17-Jul-12 COD 86.7 82.6 73.5 68.3 65.3
19-Sep-12 COD 82.3 71.2 68.9 29.4 25.1
20-Nov-12 COD 86.1 82.5 72.7 38.6 34.6
02-Apr-13 COD 98.7 n/a n/a n/a 50.5

114
Supplemental Table 13 Changes in DOC levels over time and its removal through the treatment train
BENSON, DOC REMOVAL THROUGH THE TREATMENT TRAIN (mg/L)
DATE PARAMETER RAW ROUGHING SAND
ave. BAC ave WITH Cl
OVERAL
REMOVAL(%)
06-Feb-12 DOC (mg/L) 33.7 30.3 28.5 25.9 22.3 34%
30-Apr-12 DOC (mg/L) 25.8 22.3 21.35 17.9 17.1 34%
17-Jul-12 DOC (mg/L) 31.6 29.7 29.25 25.9 25.4 20%
19-Sep-12 DOC (mg/L) 30.4 28.4 27 13 12.6 59%
20-Nov-12 DOC (mg/L) 32.9 31.9 29.6 16.65 15.8 52%
02-Apr-13 DOC (mg/L) 35.6 * * * 25.4 29%
Supplemental Table 14 Total nitrogen concentration change, overall percent removal (%) of nitrogen
N-TOTAL (mg/L), BENSON, 2012/2013
PARAMETER RAW ROUGHING SAND ave BAC ave TREATED
with Cl
REMOVAL
(%)
06-Feb-12 N- TOTAL 3 2.9 2.55 2.15 2 33%
30-Apr-12 N- TOTAL 2.4 2.2 1.8 1.4 1.3 46%
17-Jul-12 N- TOTAL 3 3.2 2.9 2.5 2.2 27%
19-Sep-12 N- TOTAL 2.9 2.8 2.7 1.3 1.1 62%
20-Nov-12 N- TOTAL 2.8 2.8 2.7 1.4 1.3 54%
02-Apr-13 N- TOTAL 3.9 * * * 2.6 33%
Supplemental Table 15 Changes in nitrate concentrations through the treatment
NITRATE (mg/L), BENSON, 2012/2013
PARAMETER RAW ROUGHING SAND
average
BAC
average
TREATED
with Cl
06-Feb-12 NITRATE-N 0.34 0.68 0.3 0.35 0.45
30-Apr-12 NITRATE-N 0.34 0.44 <0.04 0.05 0.04
17-Jul-12 NITRATE-N <0.04 0.21 0.04 0.04 0.09
19-Sep-12 NITRATE-N 0.22 0.13 0.04 0.05 0.21
20-Nov-12 NITRATE-N <0.04 0.2 0.17 0.09 0.17
02-Apr-13 NITRATE-N 0.8 * * * 0.74
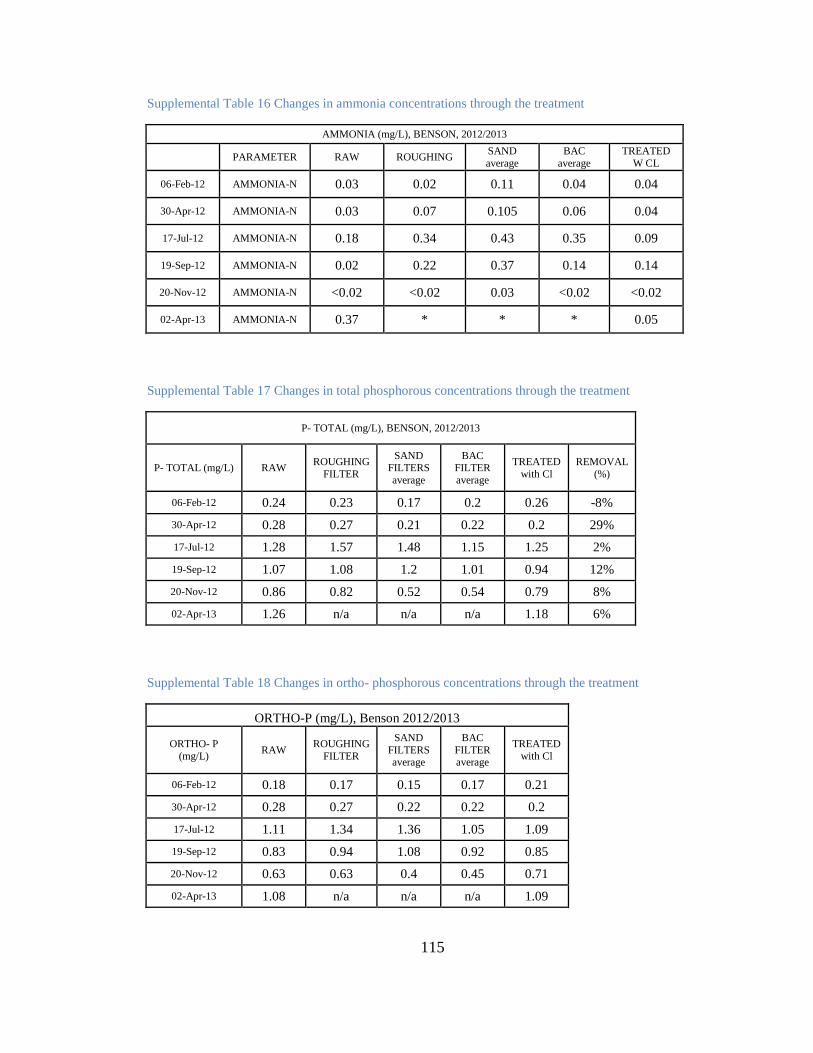
115
Supplemental Table 16 Changes in ammonia concentrations through the treatment
AMMONIA (mg/L), BENSON, 2012/2013
PARAMETER RAW ROUGHING SAND
average
BAC
average
TREATED
W CL
06-Feb-12 AMMONIA-N 0.03 0.02 0.11 0.04 0.04
30-Apr-12 AMMONIA-N 0.03 0.07 0.105 0.06 0.04
17-Jul-12 AMMONIA-N 0.18 0.34 0.43 0.35 0.09
19-Sep-12 AMMONIA-N 0.02 0.22 0.37 0.14 0.14
20-Nov-12 AMMONIA-N <0.02 <0.02 0.03 <0.02 <0.02
02-Apr-13 AMMONIA-N 0.37 * * * 0.05
Supplemental Table 17 Changes in total phosphorous concentrations through the treatment
P- TOTAL (mg/L), BENSON, 2012/2013
P- TOTAL (mg/L) RAW ROUGHING
FILTER
SAND FILTERS
average
BAC FILTER
average
TREATED
with Cl
REMOVAL
(%)
06-Feb-12 0.24 0.23 0.17 0.2 0.26 -8%
30-Apr-12 0.28 0.27 0.21 0.22 0.2 29%
17-Jul-12 1.28 1.57 1.48 1.15 1.25 2%
19-Sep-12 1.07 1.08 1.2 1.01 0.94 12%
20-Nov-12 0.86 0.82 0.52 0.54 0.79 8%
02-Apr-13 1.26 n/a n/a n/a 1.18 6%
Supplemental Table 18 Changes in ortho- phosphorous concentrations through the treatment
ORTHO-P (mg/L), Benson 2012/2013
ORTHO- P
(mg/L) RAW
ROUGHING
FILTER
SAND
FILTERS average
BAC
FILTER average
TREATED
with Cl
06-Feb-12 0.18 0.17 0.15 0.17 0.21
30-Apr-12 0.28 0.27 0.22 0.22 0.2
17-Jul-12 1.11 1.34 1.36 1.05 1.09
19-Sep-12 0.83 0.94 1.08 0.92 0.85
20-Nov-12 0.63 0.63 0.4 0.45 0.71
02-Apr-13 1.08 n/a n/a n/a 1.09

116
Appendix D
Supplemental Table 19 Statistical analysis showing correlation between DOC and Total Nitrogen
Supplemental Table 20 Statistical analysis showing correlation between DOC and Ortho-Phosphorous
S p-value rho z p-value tau
FEB, 2012 19.394 0.188 0.446 1.145 0.126 0.445
APRIL, 2012 4.186 0.010 0.880 2.014 0.022 0.745
JULY, 2012 6.177 0.022 0.824 1.946 0.026 0.714
SEPT, 2012 5.892 0.020 0.832 1.842 0.033 0.694
NOV, 2012 4.186 0.010 0.880 2.014 0.022 0.745
FEB, 2012 0.000 0.008 1.000 10.000 0.008 1.000
APRIL, 2012 0.000 0.008 1.000 10.000 0.008 1.000
JULY, 2012 2.000 0.042 0.900 9.000 0.042 0.800
SEPT, 2012 0.000 0.008 1.000 10.000 0.008 1.000
NOV, 2012 0.506 0.002 0.975 2.274 0.011 0.949
DATE Spearman's rank correlation rho Kendall's rank correlation tau
DOC vs. NITROGENO
SA
GE
BE
NS
ON
S p-value rho z p-value tau
FEB, 2012 10.204 0.058 0.708 1.433 0.076 0.540
APRIL, 2012 53.932 0.866 -0.541 -1.128 0.870 -0.430
JULY, 2012 37.574 0.555 -0.074 -0.195 0.577 -0.071
SEPT, 2012 35.548 0.512 -0.016 0.000 0.500 0.000
NOV, 2012 4.186 0.010 0.880 2.014 0.022 0.745
FEB, 2012 24.104 0.630 -0.205 -0.253 0.600 -0.105
APRIL, 2012 0.506 0.002 0.975 2.274 0.011 0.949
JULY, 2012 10.000 0.225 0.500 6.000 0.408 0.200
SEPT, 2012 22.000 0.608 -0.100 5.000 0.592 0.000
NOV, 2012 23.078 0.598 -0.154 -0.253 0.600 -0.105
DOC vs. ORTHO-P
DATE Spearman's rank correlation rho Kendall's rank correlation tau
OS
AG
EB
EN
SO
N

117
Supplemental Table 21 Statistical analysis showing correlation between DOC and Total Phosphorous
Supplemental Table 22 Statistical analysis showing correlation between Total Nitrogen and Ortho
Phosphorous
S p-value rho z p-value tau
FEB, 2012 3.547 0.007 0.899 2.295 0.011 0.828
APRIL, 2012 9.254 0.048 0.736 1.754 0.040 0.645
JULY, 2012 11.664 0.074 0.667 1.148 0.126 0.414
SEPT, 2012 6.591 0.025 0.812 1.913 0.028 0.690
NOV, 2012 3.547 0.007 0.899 2.295 0.011 0.828
FEB, 2012 3.547 0.007 0.899 2.295 0.011 0.828
APRIL, 2012 9.254 0.048 0.736 1.754 0.040 0.645
JULY, 2012 11.664 0.074 0.667 1.148 0.126 0.414
SEPT, 2012 6.591 0.025 0.812 1.913 0.028 0.690
NOV, 2012 3.547 0.007 0.899 2.295 0.011 0.828
DATE Spearman's rank correlation rhoKendall's rank correlation tau
OS
AG
EB
EN
SO
N
DOC vs. TP
S p-value rho z p-value tau
FEB, 2012 16.141 0.135 0.539 1.201 0.115 0.481
APRIL, 2012 40.029 0.607 -0.144 -0.240 0.595 -0.096
JULY, 2012 34.485 0.489 0.015 0.195 0.423 0.071
SEPT, 2012 29.262 0.378 0.164 0.219 0.413 0.087
NOV, 2012 4.516 0.012 0.871 2.150 0.016 0.833
FEB, 2012 24.104 0.630 -0.205 -0.253 0.600 -0.105
APRIL, 2012 0.506 0.002 0.975 2.274 0.011 0.949
JULY, 2012 8.000 0.175 0.600 T=7 0.242 0.400
SEPT, 2012 22.000 0.608 -0.100 5.000 0.592 0.000
NOV, 2012 23.158 0.600 -0.158 -0.260 0.603 -0.111
DATE Spearman's rank correlation rhoKendall's rank correlation tau
OS
AG
EB
EN
SO
N
N vs.ORTHO P
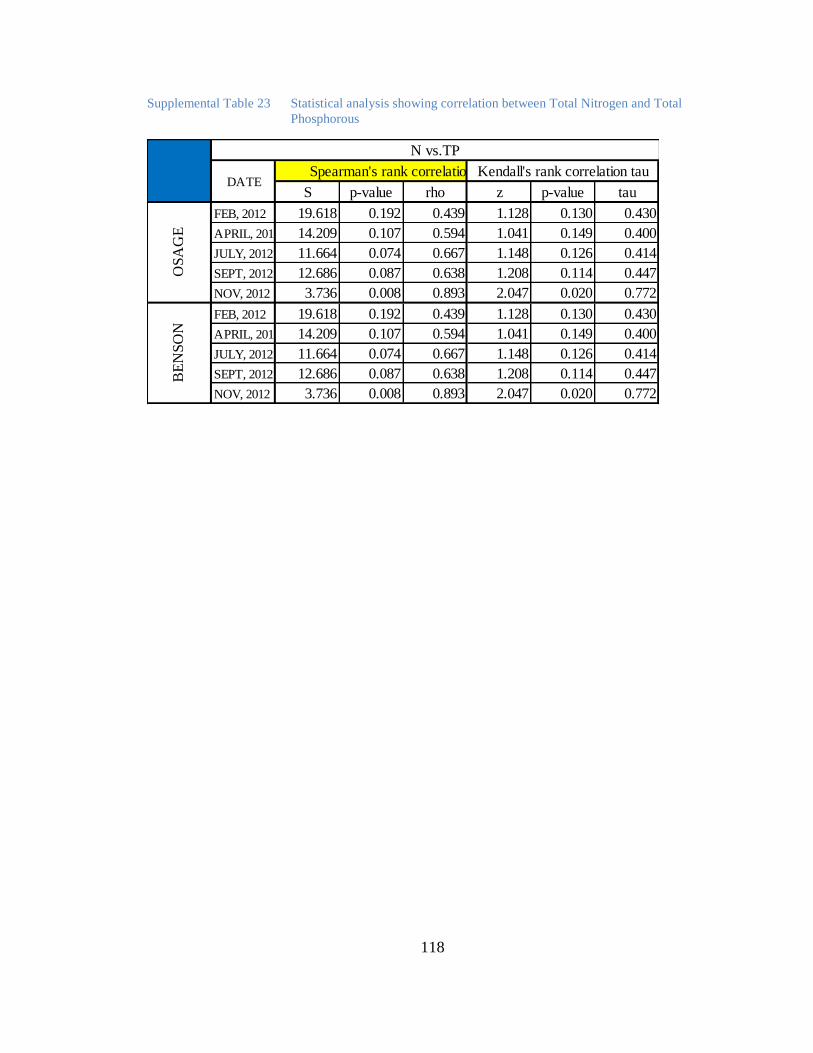
118
Supplemental Table 23 Statistical analysis showing correlation between Total Nitrogen and Total
Phosphorous
S p-value rho z p-value tau
FEB, 2012 19.618 0.192 0.439 1.128 0.130 0.430
APRIL, 2012 14.209 0.107 0.594 1.041 0.149 0.400
JULY, 2012 11.664 0.074 0.667 1.148 0.126 0.414
SEPT, 2012 12.686 0.087 0.638 1.208 0.114 0.447
NOV, 2012 3.736 0.008 0.893 2.047 0.020 0.772
FEB, 2012 19.618 0.192 0.439 1.128 0.130 0.430
APRIL, 2012 14.209 0.107 0.594 1.041 0.149 0.400
JULY, 2012 11.664 0.074 0.667 1.148 0.126 0.414
SEPT, 2012 12.686 0.087 0.638 1.208 0.114 0.447
NOV, 2012 3.736 0.008 0.893 2.047 0.020 0.772
OS
AG
EB
EN
SO
NDATE
Spearman's rank correlation rhoKendall's rank correlation tau
N vs.TP

119
Appendix E
Supplemental Picture 1 Rough sketch for Osage water treatment plant layout

120
Supplemental Picture 2 Rough sketch of Benson water treatment plant layout