analysis and monte carlo simulation of cargo handling
TRANSCRIPT
ANALYSIS AND MONTE CARL0 SIMULATION OF CARGO HANDLING*
R. R. O'Neill Professor of Engineering University of California
Los Angeles
Analysis of cyclic-linked cargo-handling systems is presented and solved by Monte Carlo techniques for several typical instances.
INTRODUC "ION
diversity of interests and equipment, a wide variety of skilled and unskilled manpower, and a collection of heterogeneous facilities. The loading and unloading of ships, commonly referred to as cargo handling, is the heart of this system. So much time is required for cargo handling that it is a key factor in determining the number of voyages a vessel can make per year.
until the unformulated experiences are assembled and the physical laws which govern the movement and handling of the individual packages are deduced. While water flowing through a pipe and a ball rolling down an inclined plane are useful concepts, such analogies are not adequate for quantitative calculations of performance. There is, however, a widely accepted measure of merit for cargo-handling systems. It is the rate of flow expressed in either weight or volume tons per hour. The average rate of flow, commonly called 'productivity,'' is used as a means of comparing different methods uf work, different facilities, etc. Productivity is also the basis of planning operations, and is the key to all costs.
A limited amount of productivity data is available. It ranges from broad over-all averages to figures for loading specific case goods commodities. For most commodities, productivity data a re few, and those which are available a re variable and controversial. Hence, interpolation and extrapolation are hazardous. To facilitate the design of new cargo-handling systems and the evaluation of existing ones, over a wide range of parameters, a rational tech- nique of prediction based upon a theory of flaw for discrete entities is needed.
idealizations of the materials-handling system developed by the Staff of the Cargo-Handling Research Project. Research, sponsored by the Office of Naval Research, has been in progress
The Maritime Industry is a highly complex transportation system. It embraces a
The design of methods of handlhg cargo is largely an art. It will not become a science
This paper presents the analysis of productivity that has been predicated upon the
*Research on this paper was sponsored by the Office of Naval Research.
223
224 R. R. O'NEILL
on the Los Angeles campus of the University of California since 1951. Studies have been directed toward the determination of relationships between the basic elements of the gen- eralized cargo-handling system, with the requirement that these relationships should provide criteria for both the design and evaluation of specific systems. Furthermore, the program has had a s its objective a study of the entire system from shipper to receiver. Although analytical studies must be made on the individual components or subcomponents of any sys- tem, it is not until the results of analysis are used t o synthesize an effective operating system that tangible improvements a re realized.
and unloading operations in several ports in the United States. It was observed that the loading and unloading of cargo involves a great variety of shapes and sizes of commodities. Actually, cargo is a composite of commodities from many warehouses and factories all over the world. Hundreds of shippers and consignees are represented in the commodities loaded and discharged at the several ports of call of a ship. The loading and unloading takes place on pier facilities which vary widely. Some are antiquated, while others are a s modern as any industrial struc- ture. Furthermore, there is no standard design for a ship, Finally, the methods for handling cargo are not the same from port to port; the number of men in the "gang," which unloads a single hatch, varies from port to port, because gang size is negotiated between the employer and the union. In Los h g e l e s the standard gang is eighteen men, in New Orleans nineteen men, and in New York City twenty-three men.
Because cargo handling varies so, it is not possible to describe a standard loading and unloading operation, but the following description will illustrate the basic operations. In Fig- ure 1, cargo is taken from its position of final rest on the pier and transported by the fork-lift truck to the apron opposite the hold of the vessel into which it is to be loaded. After each load is delivered to the apron, the fork-lift truck returns to the transit shed for another load. The cargo is picked up from the apron by the hook, hoisted up and over the side of the vessel, lowered into the hold, and detached from the hook. The hook then returns to the apron for another draft. In the hold each package is taken from the pallet by one or more hold men, depending upon the size of the unit being handled, and stowed. While methods differ from port
The study of productivity had as its point of departure observations of actual loading
Figure 1 - Schematic diagram of loading maritime cargo

ANALYSIS AND MONTE C A R L 0 SIMULATION O F CARGO HANDLING 225
to port and commodity to commodity, general cargo is moved piece by piece from the pier to the ship, or vice versa, by a sequence of movements and handlings that a re repeated at regu- lar intervals.
IDEALIZATION OF CARGO HANDLING SYSTEM The handling of cargo has been "idealized,"' as shown in Figure 2. The factors of the
system are classified into a limited group of independent elements: (1) the facility, (2) the inland transport, (3) the sea transport, (4) the commodity, and (5) the control. The sixth ele- ment, the process, is dependent upon the others and is the path of the transporting agent and the commodity.
(5) CONTROL (4) COMMODITY
r
6
(b) Figure 2 - (a) The cargo-handling system, (b) cargo
handling as a series of cyclic operations
A s the Figure 2 suggests, the process of loading and unloading of cargo may be con- sidered as a sequence of cyclic operations. In each segment of the operation there is a trans- porting agent which is a self -contained unit capable of performing all of the operations neces- sary to transport the commodity from one place to another. The round trip path of this transporting agent is considered to be a "link"; one round trip is a "cycle." Note that there may be more than one transporting agent associated with a particular link; f o r example, there may be four men in the hold. The region where the cargo is transferred from one transporting agent to another is called a "anode. The transfer may or may not be direct, and the commodity may remain at a node for any interval of time.
it can be readily seen that the productivity of the entire system is the same as the productivity of any single component. Thus, attention may be directed toward the productivity of the indi- vidual links. In each link the transporting agent picks up the load, moves it to the next location, releases the load, and returns for another. While engaged in these productive activities, how- ever, the transporting agent may encounter delays. There may be nothing to pick up; there
'See l ist of references at end of paper.
If during the loading or unloading operation there is no net storage at the interior nodes,

226 R. R. O'NEILL
RELEASE RETURN EYPTY
TOTAL TIME
may be a stoppage during an actual operation or move- ment; or there may be no place to put the load. All of these delays can be grouped into two categories: "induced" and "internal." Induced delays arise when the transporting agent in the adjacent link either does not provide a load for pickup or is not available to receive the load when it arrives at the node, Internal delays are all stoppages, avoidable or unavoidable, during the actual operation or movement. The total time that the transporting agent takes to complete one round trip can be represented as shown in Figure 3.
It is desirable to calculate the productivity in terms of the working times alone. At first it may appear that it is
Figure3 - Element times for materials-handling s y s t e m
necessary to examine only the slowest link. Here, there should be no delay other than internal. Field studies [2] , however, have shown that even the slowest link encounters considerable induced delay. This is the result of the cycle-to-cycle variation in the time required to perform each basic operation. If the transporting agent in the slowest link makes a fast trip at the same time that the transporting agent in one of the adjacent links makes a slow trip, the slowest transporting agent will have to wait, and thus encounter an induced delay.
I 2 . . . . . . . i . . . . . LINK
DELAY CAUSED EY CYCLE-TO- CYCLE
DELAY CAUSED BY
WORKINO TIME
. . .n
Figure 4 - Time bars, materials- handling system
The average time per cycle for several transporting agents operating in sequence is shown graphically in Figure 4. The time bars are divided into three segments: (1) working time (2) delay time caused by the work methods and imbalance among the capacities of the trans- porting agents, and (3) delay time caused by cycle-to-cycle variation. Because there is no net storage at the nodes, the average time per cycle must be the same for each 1Mr. But the average working time for each transporting agent is not necessarily the same. Calculation of the delay caused by unbalance is relatively simple, provided the necessary methods study data a re available. Calculation of the delay caused by cycle-to-cycle variation, unfortu- nately, is not so simple.
The magnitude of the cycle-to-cycle variation is shown by Figure 5. It is seen that the time required to perform each basic oper- ation is subject to unknown factors and may
have different values. This introduces the notion of stochastic variation rather than deter- ministic behavior and the concept of average or mean delay.
CALCULATION OF PRODUCTIVITY
for the simpler cases they have been solved [ 31. The results for the simplest case are shown Equations have been written which take into account the cycle-to-cycle variation, and

ANALYSIS AND MONTE CARL0 SIMULATION O F CARGO HANDLING 227
2 0
t V 2
0 W .: LL
';r 10
30
2 0 * 0 2 W 5) 0 W 0: LL 10
10 2 0 30 P, SEC.
R E L E A S E
0 20 30 40 P, SEC.
2 0
t 0 2 W
0 W P L
3 ' 0
20
t 0 2 W
0 W P L
= 10
T R A N S P O R T LOADED
. . . . . . . 10 20 30 40
L, SEC.
RETURN E M P T Y
JtL 10 2 0 30 40
E, SEC.
Figure 5 - Example field data for hook link
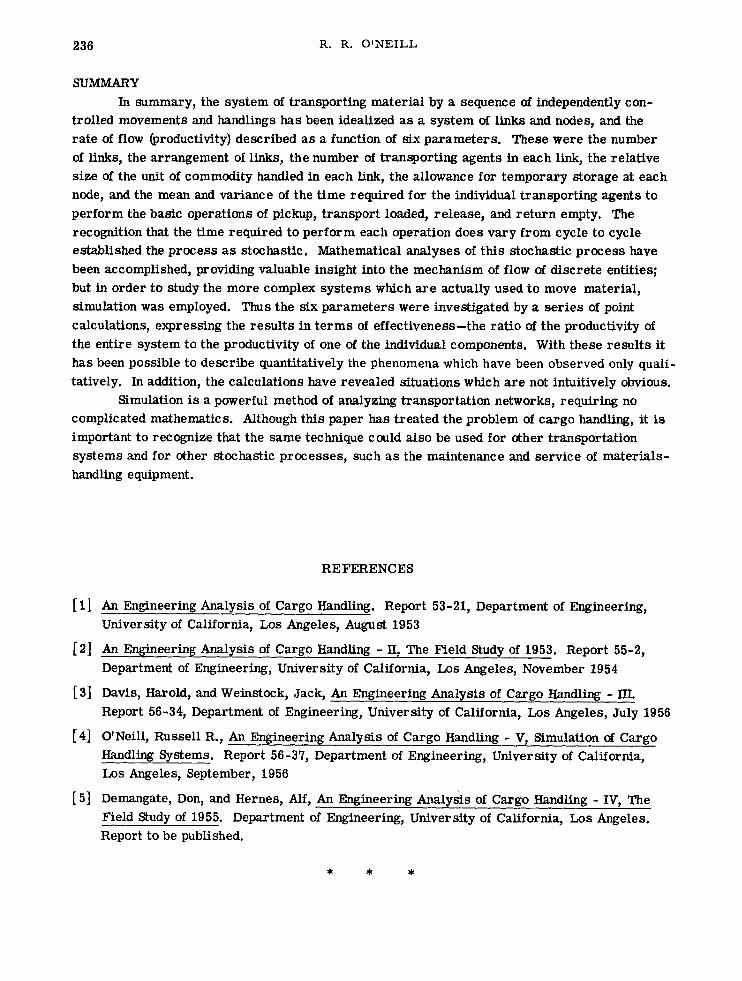
in Figure 6. The system consists of two links, with one transporting agent in each link. One unit of commodity is handled by each transporting agent. This unit is transferred directly from the first transporting agent to the second. Furthermore, the working activities are combined so that there a r e only two: (1) pickup plus transport loaded and (2) release plus return empty. It was possible to express the induced delay in this system as an explicit function of the working activity times; hence the average delay could be calculated for par- ticular density functions. Theinduced delay is shown as a function of the unbalance between the two links for two distributions of element working times. It is interesting to note at this point that the delay increases as the two-link system approaches balance.
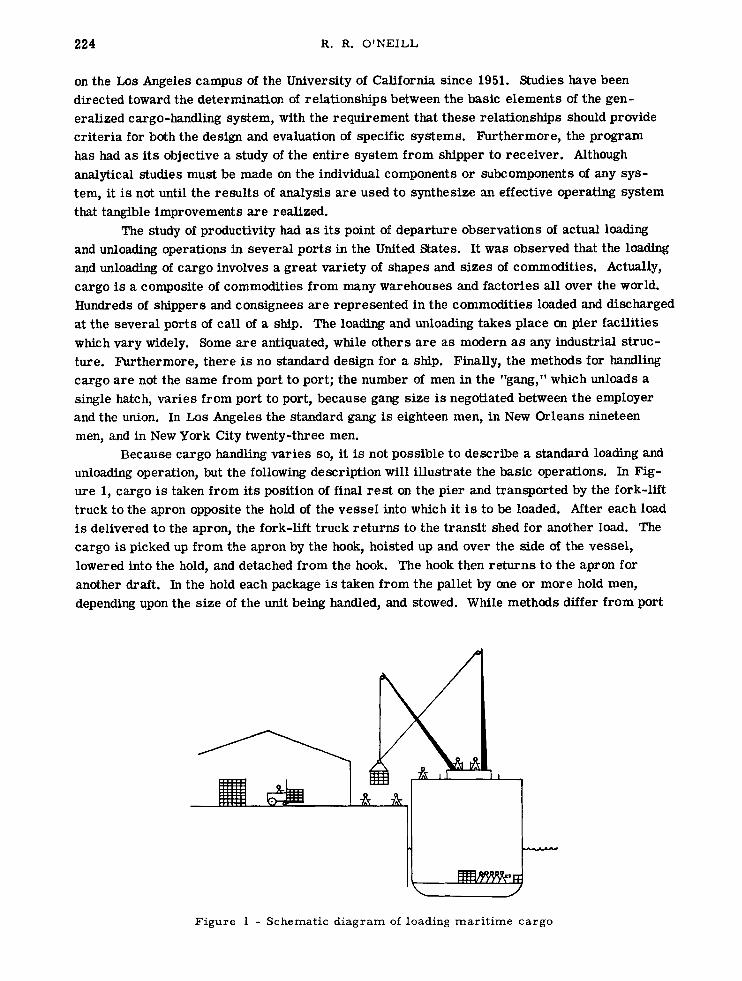
The three-link, zero storage system, shown in Figure 7, has also been studied ana- lytically. Although recurrence equations could be written, the delays couldn't be expressed explicitly in terms of working times. Consequently, it was not possible to calculate the mean delay, although upper and lower bounds were established, as shown.
An impasse had been reached. It was necessary t o use another technique, simulation, to obtain quantitative estimates of mean delay time for more complex and realistic systems. Simulation, however, involves point-by-point computations, When there are many parameters, the number of points required to establish the functional relationships between all of the parameters is very large. After careful consideration, it was decided to carry out the com- putations in such a manner that the relative influence of each individual parameter could be studied, One parameter was varied at a time. The parameters involved in the link-node

2 28 R. R. O'NEILL
0.6
0.5
0.4
0 .3
0 . 2
0 . I
0
m = P+L+R+Ij: =; 2 m2 s = etandard deviation of (P+L) and (R+E) subscripts 1 and 2 refer to slower and
faster rates
rTWO-POINT D E N S I T Y L 0 I 2 3
%? Figure 6 - Average induced delay for two-link system
idealization a re six in number: (1) the number of links in the system; (2) the arrangement of the links, that is, whether the links are arranged in series, parallel, or some combination thereof; (3) the number of transporting agents operating in each link; (4) the relative size of the unit of commodity handled by each transporting agent per trip; (5) the number of units of commodity that may be stored temporarily at the nodes; and (6) the distributions of the pro- ductive activity times, P (pick-up), L (transport loaded), R (release), and E (return empty).
values of the working times which were selected at random, allowing for the induced delay time as it occurred. In' this way, the time required to move a single unit of commodity from its initial point of rest to its final point of r e s t was calculated. By repeating these calculations a large number of times, a good estimate of the average productivity, including delay time, was determined. The calculations were carried out on WAC, the high-speed digital computer at the Numerical Analysis Research Project on the University of California, Los Angeles, campus.
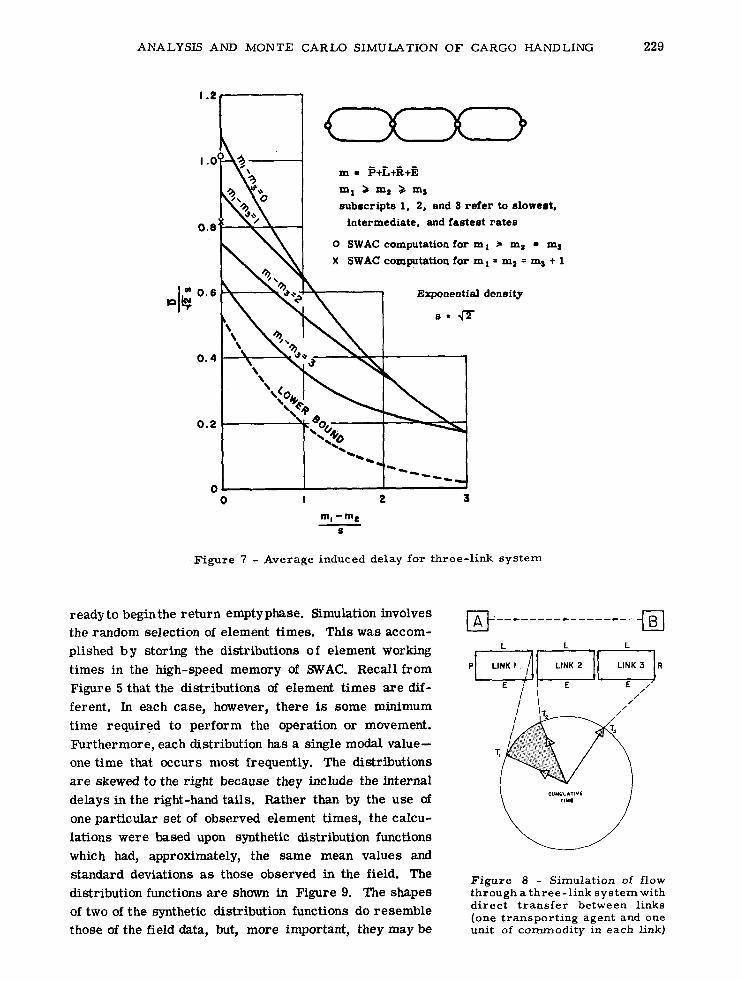
The simulation computations themselves may best be illustrated by an example. Con- sider Figure 8. The movement of material from A to B is to be accomplished in three steps. There a r e three links with direct transfer between links. There is one transporting agent in each link; it moves one unit of commodity at a time. At the start all transporting agents are
Simulation was accomplished by adding together in proper sequence the particular
ANALYSIS AND MONTE CARL0 SIMULATION O F CARGO HANDLING 229
m = P+L+R+a m, ma > ma eubocripte 1, 2, and 3 refer to elowert,
intermediate, and faeteet rates
0 SWAC computation for m l * ma ma X SWAC computation for ml = ma ma + 1
Exponential density
s = fl
0 I 2 3
m~ ’mr S
Figure 7 - Average induced delay for three-link sys t em
ready to begin the return empty phase. Simulation involves the random selection of element times. This was accom- plished b y storing the distributions of element working times in the high-speed memory of SWAC. Recall from Figure 5 that the distributions of element times a re dif- ferent. In each case, however, there is some minimum time required to perform the operation or movement. Furthermore, each distribution has a single modal value- one time that occurs most frequently. The distributions a re skewed to the right because they include the internal delays in the right-hand tails. Rather than by the use of one particular set of observed element times, the calcu- lations were based upon synthetic distribution functions which had, approximately, the same mean values and standard deviations as those observed in the field. The Figure - of flow
of two of the synthetic distribution functions do resemble distribution functions are shown in Figure 9. The shapes through a three- l ink sys t em with
d i r ec t t r ans fe r betwe en links (one t ransport ing agent and one unit of commodity in each link) those of the field data, but, more important, they may be

2 30 R. R. O'NEILL
f (e ) 1 E X P O N ENTI A L
, , ,
Figure 9 - Comparison of three di s t r ibution functions
considered as probable limiting cases within which the actual distributions lie. The use of the expo- nential density is equivalent to supposing that the activity time is the sum of the absolute minimum time, corresponding to the most favorable circum- stances, and an additional random component of time. However, the modal value of the exponential density is the minimum value. Since this may seem unlikely to some, the log-normal distribution was used for comparison. The uniform density was taken as an extreme case.
A sequence of random numbers was gen- erated by SWAC through the use of an arithmetical process. These random numbers were used to select particular values of the prestored activity times. Values of E, P, and L thus selected are added successively to the cumulative time for the transporting agent in the first link, TI. Because no storage is allowable, the transporting agent in the first link cannot release the first unit of com-
modity until the transporting agent in the second link is in position. Therefore, another value of E is selected at random and added to the cumulative time for the transporting agent in the second link, T2. At this point, TI and T2 are compared and both are made equal to the larger. Next, another value of P is selected. It is added to both T1 and T2, because the pickup time for the second transporting agent is considered to be equal to the release time of the first. L is selected at random and added to T2. E is selected at random and added to T3. Then T2 and T3 are compared. This process is continued until the first unit of commodity is moved through all three links. At the end of the first round of calculations T1, T2, and T3 represent the cumulative time after the transporting agents in the first, second, and third links have successively released the f i r s t unit of commodity. This process was repeated over and over. T3 therefore increases by increments a s the first, second, third, etc., units of com- modity arrive at B. The basis of this method is sufficient repetition so that the average of the individual values becomes an acceptable estimate of the true average. In order to establish the number of times that the calculation should be repeated, a pilot run was made, and it was concluded that the average, based on 2500 units of commodity, would be satisfactory.
RESULTS
describe the flow of material as a function of the six parameters which determine the pro- ductivity of the system [ 41. The results have been expressed in te rms of "effectiveness," which is the ratio of the productivity of the entire system to the productivity of the individual components. The effectiveness, e, was calculated as the ratio of the time required for n units of commodity to move through the system when there a r e no induced delays to the time which was calculated, allowing for delays, T(n).
In this manner a number of different systems were studied, making it possible to

ANALYSIS AND MONTE CARL0 SIMULATION OF CARGO HANDLING 231
What appear to be the more significant results follow: Inasmuch as the movement of cargo has been considered as a stochastic process, it is
to be expected that the density or distribution functions of the element working times are fun- damental quantities, Recall that three different density functions, exponential, log-normal, and uniform, were used. Their influence may be observed by plotting a family of curves for a particular system with the coefficient of variation (ratio of standard deviation to the mean) as the abscissa and the effectiveness as the ordinate, The calculations for systems of two and then twenty links are shown in Figure 10. The striking observation is the relatively minor influence of the shape of the distributions, as characterized by the third, fourth, and higher moment 6.
Values of the coefficient of variation ranging from zero to unity were used in the calculations.
I C
05
oa
m 07
There is some evidence to indicate that the coefficient of variation is approximately one quarter for the
lations were extended in order to investigate the >
many materials-handling operations which are more
m
5 0.6
05
operations involved in cargo handling, but the calcu-
influence of variability. Furthermore, there are lL
W
h a4 a variable. Figure 11 shows some observed values of 0 3
0 2 standard deviation and average cycle time for cargo handling. 0 1
A s expected, the number of links comprising the system is found to be a significant parameter.
H A UNIFORM DENSITY x EXPONENTIAL DENSITY ! ! ! 1 o LOG-NORMAL D E N S I T Y ~
ILkiEEH 0.1 0.2 0.3 0.4 0.5 0.6 0.7 0.8 09 1.0 .. .. .
COEFFICIENT OF VARIATION
Induced delay is caused by lack of synchronization, A s the number of links is increased, the probability Figure 10 - Influence of distribution
function (variable number of links, of asynchronization between two adjacent links also increases. Thus, the average induced delay is increased, and the effectiveness of the system is decreased. The relationship between the number of links and the effectiveness was determined for a balanced system of N-links connected in series, balance referring t o the ability of the transporting agents to move the commodities at equal rates. In each link a single transporting agent carried a single unit of commodity which was transferred directly from one transporting
no storage)
" 0 5 0 100 I50 200 250 so0
AVERAGE CYCLE TIME,SEC
Figure 11 - Relationship between mean and standard deviation for one group of field observations

232 R. R. O'NEILL
Figure 12 - Influence of number of links (no storage, one transporting agent)
agent to the next. The results are shown in Figure 12. The general shape of the curve may be explained intuitively as follows: Whenever transporting agents in adjacent links have fast, average, or slow cycles simultaneously, the induced delay is zero or almost zero. A delay will result only when one transporting agent completes its cycle in less than average time and must wait for the other transporting agent that has taken longer to complete its cycle. But when several transporting agents are delayed simultaneously, the total delay is no greater than when only the first transporting agent in the sequence is delayed. It, therefore, seems reason- able that the induced delay is caused principally by the transporting agents in the first few links, accounting for the general shape of the curve. For systems of few links the effectiveness can be increased by reducing both the number of links and the variability in the time required to perform the individual operations and movements. For systems of many links (e.g., bucket brigade) only changes in the cycle-to-cycle variability will influence the effectiveness.
the simple N-link system was the requirement that each unit of commodity must be transferred directly from one transporting agent to the next. In other words, both transporting agents had to be at the node before either could perform the release or pickup operation. This delaywould be reduced considerably if either the transporting agent arriving with the load could set it down without delay and continue on its cycle, or i f the transporting agent arriving empty could pick up a unit of commodity from a stock pile. In the limit, this delay could be eliminated com- pletely by providing a very large stock pile at each node. For this phase of the study a three- link system was selected. There is no difficulty in accounting for the general shape of the curves shown in Figure 13, from intuitive considerations. The value of effectiveness would be expected to have a minimum for conditions of zero allowable storage and increase monotoni- cally to an asymptotic value of unity as the number of units of allowable storage increased. It is significant to note that a substantial increase in productivity can be achieved by making provisions for only one or two units of temporary storage.
transferring the commodity at the node. If, however, more than one transporting agent is
The single factor which contributed to the induced delay of the transporting agents in
The single cause of delay that has been considered up to this point is the process of

ANALYSIS AND MONTE GARLO SIMULATION OF CARGO HANDLING 233
S, NUMBER O F UNITS O F STORAQE
Figure 13 - Influence of amount of storage (three links, one transporting agent)
operating within a single link, a delay may be encountered, because the transporting agents must maintain their positions with respect to each other. For example, in the hold of the ship two or more men may perform the same task of carrying one carton from the pallet being unloaded under the hook to the wings where it is finally stowed. In this case a queue may be formed either at the pallet or at the place where the cargo is being secured. Again a three- link system was selected for study, The results are shown in Figure 14. The curve for the coefficient of variation equal to zero breaks at M = 4, because the first transporting agent delivers one unit of commodity and returns for the next pickup in less time than that required for the other transporting agents to make their first pickup. This is a consequence of the particular values assumed for P, L, and E. In the terminology of queueing theory, M = 5 corresponds to the condition where the utilization factor* is greater than unity. In this case,
e C , COEFFICIENT OF VARIATION 0 1.0 r I I I
0. I
0 I 2 3 4 I 6 7 8 S 10
M. NUMBER OF TRANSPORTINQ A6ENTS
Figure 14 - Influence of number of transporting agents (three links, no storage)
+The utilization factor i s the ratio of the average service time to the average interval between arrivals.

234 R. R. O'NEILL
the results a r e sensitive to the proportion of the total cycle time that is required for pickup and release. In any event, the interaction among transporting agents within the same link is another factor to consider when deciding whether to use one large piece of materials-handling equipment or several smaller units.
By varying one parameter at a time and using relatively simple balanced systems, the influences of the individual parameters have been examined. There are many actual situations, however, where the arrangement of the links is more complex and where the transporting agents are not matched. h order to demonstrate the power of simulation applied to the flow or transfer problem, the calculations were carried out for a more typical cargo-loading operation. The methods and time data were observed on the Los Angeles waterfront [ 51 during the summer of 1955. The generalized activity chart, shown in Figure 15, indicates simultaneous activities
I * I
I I I/ I I I
* I I I I I I I M OV!E M E N T -
Figure 15 - Generalized activity chart, maritime cargo-loading

ANALYSIS AND MONTE CARL0 SIMULATION OF CARGO HANDLING 235
horiEontally and sequence in time verti- cally. The single fork-lift truck is the transporting agent on the pier. It moves two loaded pallets per trip to a spot onthe apronunder the hook. The hook lifts the pallets one at a time, servicing the two hold gangs withalternate cycles. The first pallet is taken to a team of two men work- ing in the starboard wing of the hold. The loaded pallet is left there and the hook is then swung over to the port side where it
CYCLES
picks up an empty pallet that has just been Figure 16 - Link-node arrangement, split-hold gang loading mari t ime cargo unloaded by the two-man team working in
the port wing. The empty pallet is lifted out of the hold and returned to the apron. The operations of the hook are reversed during the next cycle. This arrangement of Links is shown schematically in Figure 16.
The results a re presented a s a set of time bars (Figure 17). The added amount of induced delay caused by the cycle-to-cycle variation is small a s a result of the imbalance among the transporting agents and the delays caused by the work methods themselves. If the system were more balanced, the productivity would increase, but so too would the percentage of induced delay, according to Figures 6 and 7.
400
350
300 a < a: L a 250 0 0 w z L F 3 a 200 g: a m
la s IS0 E c
2 % 2 '
2
I- LL
w o 0
u a 100
so
0 Wharf Hook * Hold
LINK
DELAY CAUSED BY CYCLE-TO- CYCLE VARIATION DELAY CAUSED BY IMBALANCE C:O
WORKINO TIME
* A V E R A G E T I M E F O R
T W O R O U N D T R I P S
Figure 17 - Time bars , generalized loading system
236 R. R. O'NEILL
SUMMARY In summary, the system of transporting material by a sequence of independently con-
trolled movements and handlings has been idealized as a system of links and nodes, and the rate of flow (productivity) described a s a function of six parameters. These were the number of links, the arrangement of links, the number of transporting agents in each link, the relative size of the unit of commodity handled in each link, the allowance for temporary storage at each node, and the mean and variance of the time required for the individual transporting agents to perform the basic operations of pickup, transport loaded, release, and return empty. The recognition that the time required to perform each operation does vary from cycle to cycle established the process a s stochastic. Mathematical analyses of this stochastic process have been accomplished, providing valuable insight into the mechanism of flow of discrete entities; but in order to study the more complex systems which are actually used to move material, simulation was employed. Thus the six parameters were investigated by a series of point calculations, expressing the results in terms of effectiveness-the ratio of the productivity of the entire system to the productivity of one of the individual components. With these results it has been possible to describe quantitatively the phenomena which have been observed only quali- tatively. In addition, the calculations have revealed situations which are not intuitively obvious.
Simulation is a powerful method of analyzing transportation networks, requiring no complicated mathematics. Although this paper has treated the problem of cargo handling, it is important to recognize that the same technique could also be used for other transportation systems and for other stochastic processes, such a s the maintenance and service of materials- handling equipment.
REFERENCES
[ 11 An Engineering Analysis of Cargo Handling. Report 53-21, Department of Engineering,
[ 21 An Engineering Analysis of Cargo Handling - II, The Field Study of 1953. Report 55-2, Department of Engineering, University of California, Los Angeles, November 1954
[ 31 Davis, Harold, and Weinstock, Jack, An Engineering Analysis of Cargo Handling - III. Report 56-34, Department of Engineering, University of California, Los Angeles, July 1956
[ 41 O'Neill, Russell R., An Engineering Analysis of Cargo Handling - V, Simulation of Cargo Handling Systems. Report 56-37, Department of Engineering, University of California, Los Angeles, September, 1956
University of California, Los Angeles, August 1953
[ 51 Demangate, Don, and Hernes, Alf, An Engineering Analysis of Cargo Handling - IV, The Field Study of 1955. Department of Engineering, University of California, Los Angeles. Report to be published.
* * *