analysis and mitigation of atmospheric crosstalk kyle hilburn remote sensing systems may 21, 2015
TRANSCRIPT

Analysis and Mitigation of Atmospheric Crosstalk
Kyle HilburnRemote Sensing Systems
May 21, 2015

Introduction• What is crosstalk?
• When a retrieval algorithm aliases unrelated geophysical signals into the retrieval
• Why is understanding crosstalk important?• Can mask important modes of variability (e.g., El Nino)• Can produce spurious trends on decadal time scales
• What are primary crosstalk sources for IR SST retrievals?• Clouds, water vapor, aerosols
• Why is quantifying IR SST crosstalk difficult?• Vapor is correlated with SST, and this correlation is a function of time scale• Vapor and cloud are correlated • Clouds have significant horizontal, vertical, and microphysical variability• Aerosols have a variety of radiative properties and lack unique spectral signature

Objectives
1. Develop a better understanding the effects of water vapor, aerosols, and clouds on VIIRS SST retrievals
2. Develop and implement two VIIRS SST algorithms• Physically parameterized statistical algorithm (PPSA)
• Weighted least-squares algorithm, parameterized in terms of physical quantities• Tunable, like a statistical algorithm, by adjusting the a priori values and uncertainties
• Combined VIIRS and AMSR2 algorithm• Uses AMSR2 in specifying a priori values and uncertainties• Additional cloud clearing based on AMSR2• Identifying and mitigating aerosol effects by comparing AMSR2 and VIIRS
3. Provide a characterization of uncertainties in SST retrievals
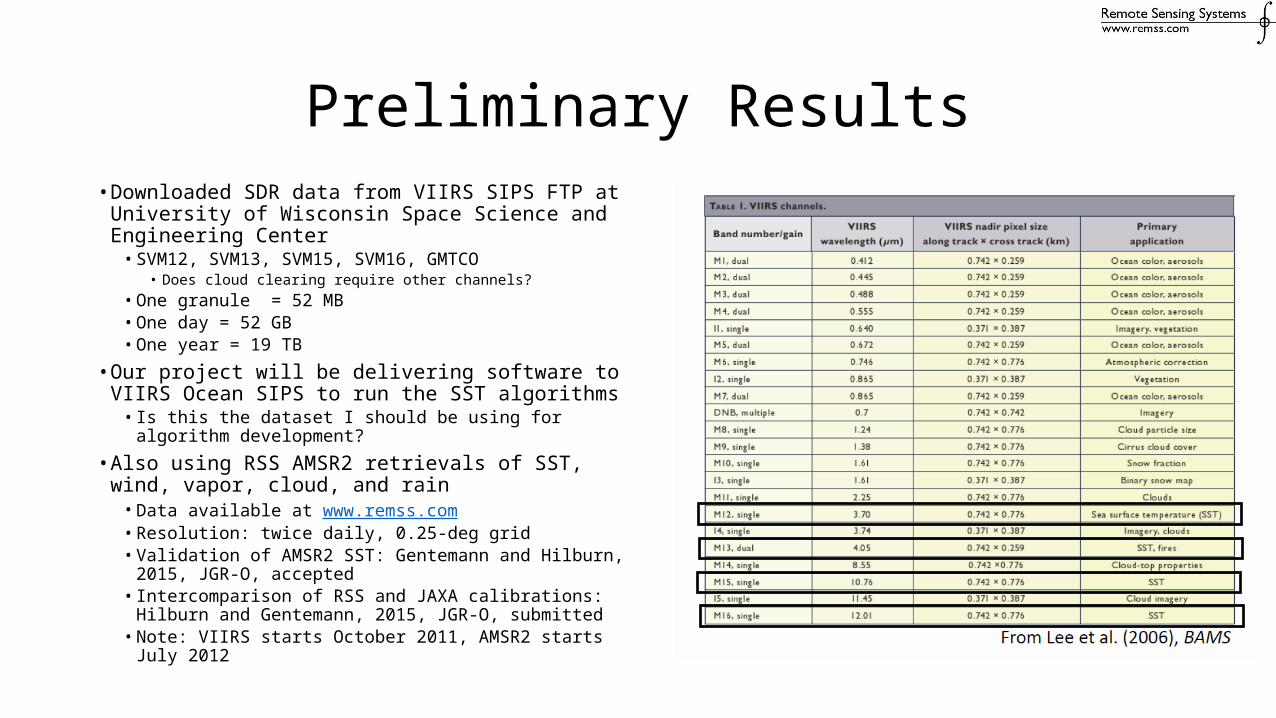
Preliminary Results• Downloaded SDR data from VIIRS SIPS FTP at University
of Wisconsin Space Science and Engineering Center• SVM12, SVM13, SVM15, SVM16, GMTCO
• Does cloud clearing require other channels?• One granule = 52 MB• One day = 52 GB• One year = 19 TB
• Our project will be delivering software to VIIRS Ocean SIPS to run the SST algorithms• Is this the dataset I should be using for algorithm
development?
• Also using RSS AMSR2 retrievals of SST, wind, vapor, cloud, and rain• Data available at www.remss.com• Resolution: twice daily, 0.25-deg grid• Validation of AMSR2 SST: Gentemann and Hilburn, 2015,
JGR-O, accepted• Intercomparison of RSS and JAXA calibrations: Hilburn and
Gentemann, 2015, JGR-O, submitted• Note: VIIRS starts October 2011, AMSR2 starts July 2012

Sampling Patterns• Maps show the number of observations falling in 0.25-deg
Earth grid, for one day, separated local AM/PM• VIIRS resolution = 0.7 km• Thus, in the swath center the typical number of observations is
• 25 km (1440 x 720) gives 1225 obs• 12.5 km (2880 x 1440) gives 289 obs• 9 km (4096 x 2048) gives 144 obs• 5 km (7200 x 3600) gives 49 obs
• Sampling patterns are complicated along swath edges because• Adjacent passes overlap (increases number of observations)• Mitigation of bow-tie effect (decreases number of observations, for
two distinct scan angle ranges)
• To handle the TB-scale data volume, our project is to use VIIRS files that are pre-processed onto Earth grids• Is there compelling reason to chose particular grid resolution?• Since Earth zenith angle increases with scan angle, is there a
maximum scan angle beyond which retrieval is not advisable?• Avoid high latitude overlap by making each map one orbit?

Viewing Geometry
• The Earth zenith angle varies from 0 deg at swath center to 70 deg at swath edges• At swath edge, path through
atmosphere is 2.9 x longer than swath center• At 4.05 micron there is clear
zenith angle dependence• Warmer at zenith angles of 0 deg• Cooler at zenith angles of 70 deg
4.05 micron
Solar Geometry
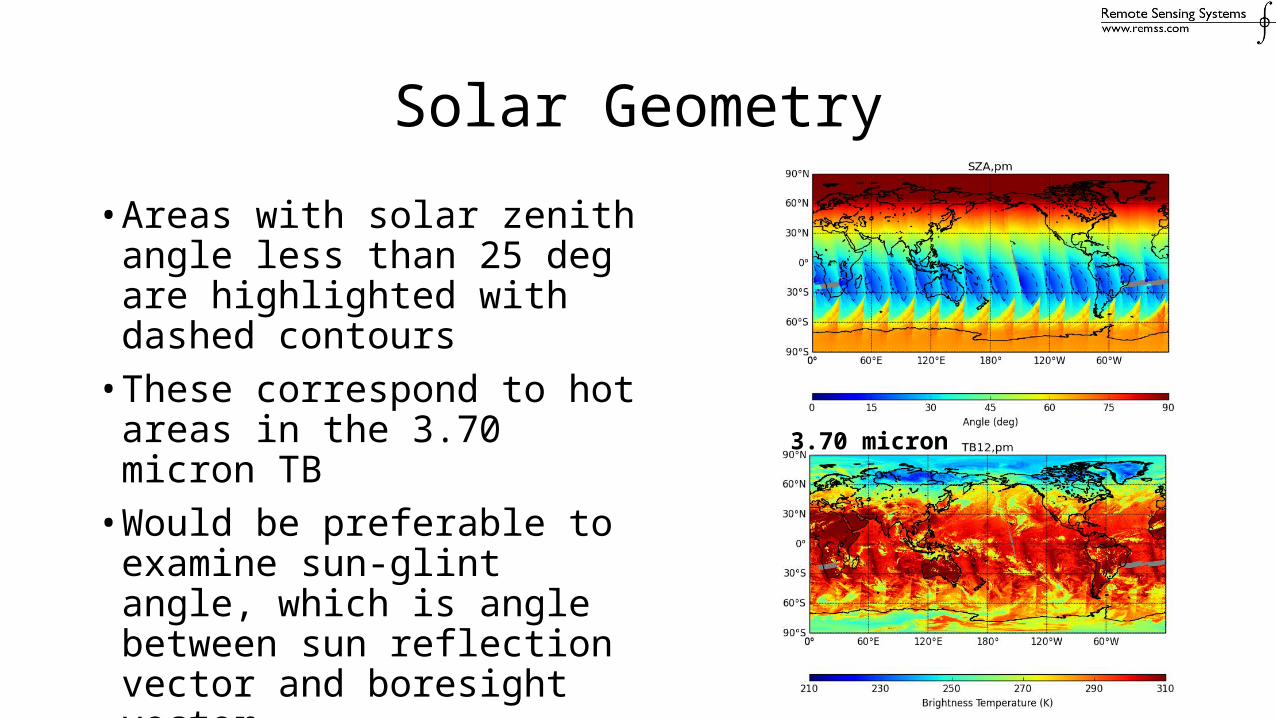
• Areas with solar zenith angle less than 25 deg are highlighted with dashed contours• These correspond to hot areas in
the 3.70 micron TB• Would be preferable to examine
sun-glint angle, which is angle between sun reflection vector and boresight vector
3.70 micron

Daily Average TB
• Temperatures range from about 260 K over high-latitude ocean to 300 K over tropical ocean
• Areas with TB below 250 K are tall clouds with cold cloud tops, and are most prominent in longer wavelengths
• The 3.70 micron channel most closely resembles SST
3.70 micron
4.05 micron
10.76 micron
12.01 micron
Daily average VIIRS TB from 2015/01/01
AMSR2 SST

PM-AM TB Difference• VIIRS on Suomi NPP satellite has
ascending node time of 1:30 PM• Over land, the increase in
temperature from morning to afternoon is strongest at 3.70 micron, indicating the largest surface contribution
• 3.70 micron also has large (20-30 K) positive PM-AM differences over Southern Ocean – this example is from January: sun reflection
• Diurnal differences are on the order 10-20 K at 4.05 micron and are 10 K or less for 10.76 and 12.01 micron
3.70 micron
4.05 micron
10.76 micron
12.01 micron
PM-AM (LT) VIIRS TB from 2015/01/01
11-12 Micron TB Difference and Vapor
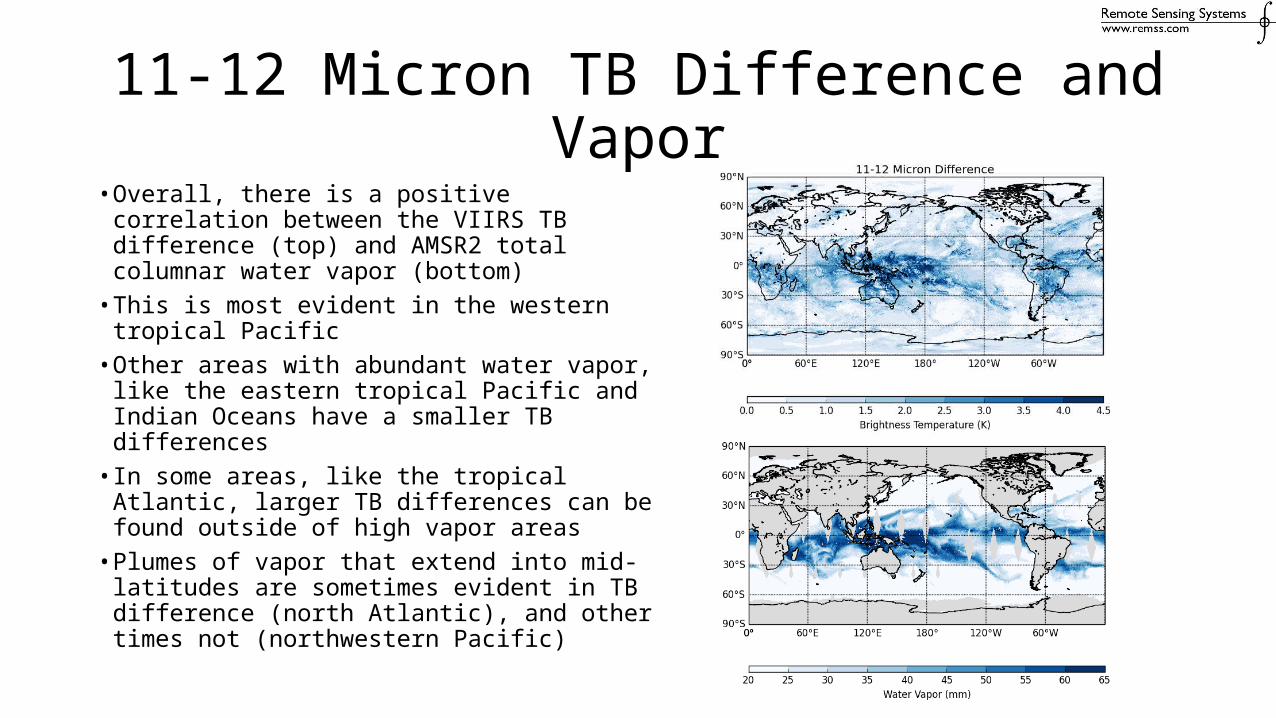
• Overall, there is a positive correlation between the VIIRS TB difference (top) and AMSR2 total columnar water vapor (bottom)
• This is most evident in the western tropical Pacific
• Other areas with abundant water vapor, like the eastern tropical Pacific and Indian Oceans have a smaller TB differences
• In some areas, like the tropical Atlantic, larger TB differences can be found outside of high vapor areas
• Plumes of vapor that extend into mid-latitudes are sometimes evident in TB difference (north Atlantic), and other times not (northwestern Pacific)

Summary and Conclusions
• Performed initial exploration of VIIRS data and comparison with AMSR2• There is a clear SST signal in VIIRS TBs• There is also a clear signal from clouds• Large TB-SST differences occur where water vapor is abundant• Large differences also can occur where vapor is low
• Suggests that effective air temperature also plays important role
• The relationship between 11-12 micron TB diff and vapor varies by region• First order of business: to produce gridded VIIRS TB with clouds cleared
• Q/C: sun glint, TB bounds check, scan angle threshold, number of obs threshold• Maps should also include time and Earth zenith angle